Embed Size (px)
Citation preview

Audit Report
Food and Nutrition Service Financial Statements for
Fiscal Years 2010 and 2009
Audit Report 27401-35-Hy November 2010
U.S. Department of Agriculture
Office of Inspector General

United States Department of Agriculture
Office of Inspector General
Washington, D.C. 20250
DATE: November 5, 2010
AUDIT NUMBER: 27401-35-Hy
TO: Julia M. Paradis Administrator Food and Nutrition Service
ATTN: E. Stephen Butler Chief Financial Officer Food and Nutrition Service
FROM: Gil H. Harden /s/ Assistant Inspector General
for Audit
SUBJECT: Food and Nutrition Service Financial Statements for Fiscal Years 2010 and 2009
This report presents the results of our audit of the Food and Nutrition Service’s financial
statements for the fiscal years ending September 30, 2010 and 2009. The report contains an
unqualified opinion on the financial statements, as well as the results of our assessment of the
Food and Nutrition Service’s internal controls over financial reporting and compliance with laws
and regulations.
Based on the information provided during the audit, we are making no further recommendations
within this report. We appreciate the courtesies and cooperation extended to us by members of
your staff during our audit fieldwork and subsequent discussions. If you have any questions
regarding this report, please contact me at (202) 720-6945 or have a member of your staff
contact Donald Pfeil at (301) 504-2100.

Table of Contents
Executive Summary .................................................................................................1
Opinion on the Consolidated Financial Statements .............................................2
Internal Control Over Financial Reporting ..........................................................2
Compliance and Other Procedures ........................................................................3
Responsibilities .........................................................................................................4
Abbreviations ...........................................................................................................6
Exhibit A: Financial Statements .............................................................................7

Food and Nutrition Service Financial Statements for Fiscal Years 2010 and 2009
AUDIT REPORT 27401-35-Hy 1
Executive Summary
Purpose
Our audit objectives were to determine whether the (1) financial statements present fairly, in all material respects, in accordance with generally accepted accounting principles, the assets, liabilities, and net position; net costs; changes in net position; and budgetary resources; (2) internal control objectives for financial reporting were met; and (3) Food and Nutrition Service (FNS) complied with laws and regulations for those transactions and events that could have a direct and material effect on the financial statements. We also determined that the Management Discussion and Analysis was materially consistent with the information in the financial statements.
We conducted our audit at the FNS National Office in Alexandria, Virginia. We also performed a site visit to the Federal Reserve Bank in Richmond, Virginia, and obtained information from all FNS Regional Offices.
Results in Brief
In our opinion, FNS’ comparative financial statements for fiscal years 2010 and 2009, including
the accompanying notes, present fairly in all material respects, the assets, liabilities, and net
position of FNS as of September 30, 2010 and 2009; and its net costs, changes in net position,
and budgetary resources, in conformity with accounting principles generally accepted in the
United States of America.
In the section entitled “Internal Control over Financial Reporting,” we report that although FNS
reported no material weaknesses in its FY 2010 Federal Manager’s Financial Integrity Act, it did
report one control deficiency that was part of a Department-wide material weakness on
unliquidated obligations, which remains a control deficiency in FY 2010. FNS also reported that
the seven significant deficiencies, which were identified and reported on in FY 2009 relative to a
minor agency financial system, have been remediated.
In the section entitled, “Compliance with Laws and Regulations,” we report that FNS’ core
financial system is in substantial compliance with the Federal Financial Management
Improvement Act of 1996. We did report that the agency was not in full compliance with the
Improper Payments Improvement Act of 2002 and Executive Order 13520.

Independent Auditor’s Report
Julia M. Paradis Administrator Food and Nutrition Service
Opinion on the Consolidated Financial Statements
We have audited the accompanying balance sheets of the Food and Nutrition Service (FNS) as of September 30, 2010 and 2009, and the related statements of net cost, changes in net position, and the combined statements of budgetary resources (herein afterward referred to as the “financial
statements”) for the fiscal years (FY) then ended. The financial statements are the responsibility
of FNS’ management. Our responsibility is to express an opinion on the financial statements
based on our audits.
We conducted our audits in accordance with standards generally accepted in the United States of
America (the standards applicable to financial audits are contained in Government Auditing
Standards issued by the Comptroller General of the United States), and the Office of
Management and Budget (OMB) Bulletin 07-04, Audit Requirements for Federal Financial
Audits, as amended. Those standards and OMB Bulletin 07-04, as amended, require that we
plan and perform the audits to obtain reasonable assurance that the financial statements are free
of material misstatement. An audit includes examining, on a test basis, evidence supporting the
amounts and disclosures in the financial statements. An audit also includes assessing the
accounting principles used and significant estimates made by management, as well as evaluating
the overall financial statement presentation. We believe our audits provide a reasonable basis for
our opinion.
In our opinion, the financial statements referred to above, present fairly, in all material respects,
the financial position of the FNS as of September 30, 2010 and 2009; and its net costs; changes
in net position; and budgetary resources for the year then ended, in conformity with accounting
principles generally accepted in the United States of America.
The information in FNS’ Management Discussion and Analysis and Required Supplementary
Information is not a required part of the consolidated financial statements, but is supplemental
information required by accounting principles generally accepted in the United States of America
and OMB Circular A-136. We have applied certain limited procedures, consisting primarily of
inquiries of management regarding the methods of measurement and presentation of this
information. However, we did not audit this information and, accordingly, express no opinion on
it.
Internal Control Over Financial Reporting
Our consideration of the internal controls over financial reporting was for the limited purposes
described in the Responsibilities section of this report and would not necessarily identify all
matters in the internal controls over financial reporting that might be significant deficiencies.
Under standards issued by the American Institute of Certified Public Accountants significant
AUDIT REPORT 27401-35-Hy 2

deficiencies are deficiencies in internal control, or a combination of deficiencies, that is less severe than a material weakness yet important enough to merit attention by those charged with governance. Material weaknesses are deficiencies, or combinations of deficiencies in internal control, such that there is a reasonable possibility that a material misstatement of the entities financial statements will not be prevented, or detected and corrected, on a timely basis. Because of inherent limitations in any system of internal control, misstatements due to error or fraud may occur and not be detected.
FNS asserted through its FY 2010 Federal Manager’s Financial Integrity Act (FMFIA)
submission that although no material weaknesses were identified, it did identify one recurring
control deficiency that was part of a Department-wide material weakness on unliquidated
obligations. FNS also asserted that seven significant deficiencies identified in FY 2009 to an
agency financial system that processes transaction amounts immaterial to the overall FNS
financial reporting system have been remediated. Our tests of system vulnerabilities during the
FY 2010 audit confirmed FNS’ corrective actions. FNS has established a corrective action plan
as required by OMB Circular A-123 to address the issue of unliquidated obligations.
Compliance and Other Procedures
As part of obtaining reasonable assurance about whether the financial statements are free of
material misstatement, we performed tests of FNS’ compliance as described in the
Responsibilities section of this report. The results of our tests disclosed two instances of
reportable noncompliance with other laws and regulations discussed in the Responsibilities
section of this report that are required to be reported under Government Auditing Standards and
OMB Bulletin 07-04, as amended. We found that although FNS has made significant progress
with the 2002 Improper Payments Improvement Act (IPIA), they are still not in full compliance
with its requirements regarding the design of program internal controls related to reporting
improper payments. The IPIA requires agency official to estimate erroneous payments for all
programs susceptible to significant improper payments. FNS has not reported the amount of
improper payments they expect to recover involving the Special Nutrition Assistance Program
(SNAP), the Special Supplemental Nutrition Program for Women, Infants, and Children (WIC),
the Child and Adult Care Food Program (CACFP), the National School Lunch Program (NSLP),
and the School Breakfast Program (SBP).
FNS reported estimated improper payments for SNAP, NSLP, and SBP. However, FNS has not
reported erroneous payment rates for WIC certification errors and CACFP verification errors.
As stated in the FNS Management Discussion and Analysis (MD&A), work is currently
underway to report on WIC certification errors. An estimate of erroneous payments associated
with WIC certification errors will be available in 2011. Regarding CACFP verification errors,
FNS has developed a methodology to randomly sample the results of State monitoring visits to
Family Day Care Homes (FDCHs) and follow up by observing the FDCHs or contacting parents
to corroborate the Family Day Care Sponsors’ child claimant reports. FNS has not established a
date for publishing the CACFP verification error estimate.
The IPIA also requires that agencies report the amount of erroneous payments the agency
expects to recover and how it will recover them. FNS has not reported the amount of improper
AUDIT REPORT 27401-35-Hy 3

payments they expect to recover for the SNAP, the WIC, the CACFP, the NSLP, and the SBP. FNS explains in section 4 of its MD&A that the current statute only provides authority to recover improper payments identified through reviews, audits, or other operational oversight activity. FNS further explains that an estimated recovery target amount for the SNAP is not feasible because claims collections are tied to the abilities of States to determine pursue and collect erroneous payments.
As required by OMB Bulletin 07-04, as amended, with respect to internal controls related to key performance measures as determined by management and reported in the MD&A, we obtained an understanding of the design of significant internal controls related to the existence and completeness assertions and determined if they had been placed in operation. Our procedures were not designed to provide assurance on internal controls over reported performance measures. Accordingly, we do not provide an opinion on such controls.
As further required by OMB Bulletin 07-04, as amended, we considered FNS’ internal controls
over Required Supplementary Stewardship Information (RSSI) by obtaining an understanding of
the internal controls, along with making a determination if those controls had been placed in
operation, assessing control risk, and performing tests of the controls. Our procedures were not
designed to provide assurance on internal controls over RSSI. Accordingly, we do not provide
an opinion on such controls.
This report is intended for the information and use by the management of FNS, and by OMB and Congress, and is not intended to be, and should not be, used by anyone other than these specified parties.
Additionally, the results of our tests disclosed no instances in which FNS’ financial management
systems did not substantially comply with the Federal Financial Management Improvement Act.
Responsibilities
Management’s Responsibilities
Management is responsible for the consolidated financial statements, establishing and maintaining effective internal control, and complying with laws and regulations.
Auditor’s Responsibilities
The objective of our audit was to express an opinion on the fair presentation of the accompanying financial statements. We conducted our audit in accordance with auditing standards generally accepted in the United States of America (the standards applicable to financial audits are contained in Government Auditing Standards issued by the Comptroller General of the United States); and OMB Bulletin 07-04, as amended, Audit Requirements for Federal Financial Statements. Those standards require that we plan and perform the audit to obtain reasonable assurance about whether the financial statements are free of material misstatement. An audit includes examining, on a test basis, evidence supporting the amounts and disclosures in the financial statements. An audit also includes assessing the accounting
AUDIT REPORT 27401-35-Hy 4

principles used, and significant estimates made by management, as well as evaluating the overall financial statement presentation. We believe that our audit provides a reasonable basis for our opinion.
In planning and performing our audit, we considered FNS’ system of internal control over
financial statement reporting by obtaining an understanding of the design effectiveness of
internal controls, determining whether the internal controls had been placed in operation,
assessing control risk, and performing tests of controls in order to determine our audit procedures
for the purpose of expressing our opinion on the financial statements. We limited our internal
control testing to those controls necessary to achieve the objectives described in OMB 07-04, as
amended, and Government Auditing Standards. We did not test all internal controls as defined by the Federal Managers Financial Integrity Act of 1982. The objective of our audit was not to provide an opinion on FNS’ internal control. Accordingly, we do not provide an opinion on
internal controls over financial reporting.
As part of obtaining reasonable assurance about whether the financial statements are free of
material misstatement, we performed tests of FNS’ compliance with certain provisions of laws
and regulations, contracts and agreements, and Governmentwide policy requirements where
noncompliance could have a direct and material effect on the determination of the financial
statement amounts. We also obtained reasonable assurance that FNS complied with certain
provisions of other laws and regulations specified in OMB Bulletin No. 07-04, as amended,
including requirements referred to in the Federal Financial Management Improvement Act of
1996, except for those that, in our judgment, were clearly inconsequential. We limited our tests
of compliance to the provisions described in the preceding sentences and did not test compliance
with all laws and regulations applicable to FNS. However, providing an opinion on compliance
with laws and regulations was not an objective of our audit and, accordingly, we do not express
an opinion.
AUDIT REPORT 27401-35-Hy 5
Gil Harden /s/ Assistant Inspector General
for Audit
November 5, 2010

Abbreviations
AUDIT REPORT 27401-35-Hy 6
CACFP Child and Adult Care Food Program FDCH Family Day Care Home FNS Food and Nutrition Service FY Fiscal Year IPIA Improper Payment Improvement Act of 2002 MD&A Management Discussion and Analysis NSLP National School Lunch Program OMB Office of Management and Budget RSSI Required Supplementary Stewardship Information SBP School Breakfast Program WIC Special Supplemental Nutrition Program for Women Infants, and Children

Exhibit A: Financial Statements
AUDIT REPORT 27401-35-Hy 7
FOOD AND NUTRITION SERVICE
FISCAL YEARS 2010 and 2009
FINANCIAL STATEMENTS
PREPARED BY FNS

FINANCIAL REPORT – U. S. D. A. – F. N. S. – FY 2010 MANAGEMENT DISCUSSION AND ANALYSIS
MANAGEMENT DISCUSSION AND ANALYSIS
SECTION 1: MISSION, ORGANIZATIONAL STRUCTURE AND PROGRAMS
The Food and Nutrition Service (FNS) is an agency within the U.S. Department of Agriculture (USDA). FNS was established August 8, 1969, by Secretary's Memorandum No. 1659 and Supplement 1 pursuant to the authority contained in 5 U.S.C. 301 and Reorganization Plan No. 2 of 1953.
FNS is the Federal agency responsible for managing the domestic nutrition assistance programs. Its mission is to increase food security and reduce hunger in partnership with cooperating organizations by providing children and low-income people access to food, a healthful diet, and nutrition education in a manner that supports American agriculture and inspires public confidence.
The FNS annual appropriation for administrative funds includes a very small percentage of funds for the administration of the Center for Nutrition Policy and Promotion (CNPP). CNPP links scientific research to the nutrition needs of consumers through science-based dietary guidance, nutrition policy coordination, and nutrition education. CNPP develops integrated nutrition research, education, and promotion programs and provides science-based dietary guidance.
FNS FY 2010 Organization Chart
Page 1 of 53
FINANCIAL REPORT – U. S. D. A. – F. N. S. – FY 2010 MANAGEMENT DISCUSSION AND ANALYSIS
Page 2 of 53
Descriptions of FNS Programs:
Over the past half-century – beginning with the National School Lunch Program in 1946 – the Nation has
gradually built an array of nutrition assistance programs designed to help the most vulnerable populations
meet their food needs. Taken together, the current programs form a nationwide safety net supporting low-
income families and individuals in their efforts to escape food insecurity and hunger and achieve healthy,
nutritious diets. Currently, the programs administered by FNS touch the lives of one in five Americans
over the course of a year.
The nutrition assistance programs described below works both individually and in concert with one
another to improve the Nation’s nutrition and health by improving the diets of children and low-income
households.
· Supplemental Nutrition Assistance Program (SNAP): Authorized by the Food and Nutrition Act of 2008, SNAP serves as the primary source of nutrition assistance for over 40.2 million low-income people. It enables participants, about 49 percent of whom are children, to improve their diets by increasing food purchasing power using benefits that are redeemed at authorized retail grocery stores across the country. State agencies are responsible for the administration of the program according to national eligibility and benefit standards set by Federal law and regulations. Benefits are 100 percent Federally-financed, while administrative costs are shared between the Federal and State Governments.
SNAP provides the basic nutrition assistance benefit for low-income people in the United States;
other FNS programs supplement this program with benefits targeted to special populations, dietary
needs and delivery settings. (Puerto Rico, the Commonwealth of the Northern Mariana Islands and
American Samoa receive grant funds with which to provide food and nutrition assistance in lieu of
SNAP.)
· Food Distribution Program on Indian Reservations (FDPIR): FDPIR distributes USDA-purchased foods as an alternative to SNAP for Indian households on or near reservations. State agencies and Indian Tribal Organizations (ITOs) that operate the program are responsible for certifying recipient eligibility, nutrition education, local warehousing and transportation of food, distribution of food to recipient households, and program integrity. The Federal Government pays 100 percent of the cost of commodities distributed through the program, and cash payments for administrative expenses.
· Child Nutrition Programs (CNP): The Child Nutrition Programs - National School Lunch (NSLP), School Breakfast (SBP), Special Milk (SMP), Child and Adult Care Food (CACFP), and Summer Food Service (SFSP) - provide reimbursement to State and local governments for nutritious meals and snacks served to over 32 million children in schools, child care institutions, adult day care centers, and after school care programs. FNS provides cash and USDA purchased food on a per-meal basis to offset the cost of food service at the local level and a significant portion of State and local administrative expense, and provides training, technical assistance, and nutrition education. Payments are substantially higher for meals served free or at a reduced price to children from low-income families.

FINANCIAL REPORT – U. S. D. A. – F. N. S. – FY 2010 MANAGEMENT DISCUSSION AND ANALYSIS
· Special Supplemental Nutrition Program for Women, Infants and Children (WIC): WIC addresses the supplemental nutritional needs of at-risk, low-income pregnant, breastfeeding and postpartum women, infants and children up to five years of age. It provides participants monthly supplemental food packages targeted to their dietary needs, nutrition education, and referrals to a range of health and social services – benefits that promote a healthy pregnancy for mothers and a healthy start for
their children. Appropriated funds are provided to States for food packages and nutrition services and
administration for the program; States operate the program pursuant to plans approved by FNS. WIC
is augmented in some localities by the Farmers’ Market Nutrition Program, funded within the
Commodity Assistance Program account, and authorized by the WIC Farmers’ Market Nutrition Act
of 1992, which provides fresh produce to WIC participants.
· The Emergency Food Assistance Program (TEFAP): This program supports the emergency food
organization network by distributing USDA-purchased food for use by emergency feeding
organizations including soup kitchens, food recovery organizations, and food banks. TEFAP also
provides administrative funds to defray costs associated with processing, repackaging, storage, and
distribution of Federal and privately donated food. The allocation of both Federal food and
administrative grants to States is based on a formula that considers the States’ unemployment levels
and the number of persons with income below the poverty level.
· The Commodity Supplemental Food Program (CSFP): This program provides foods purchased by
USDA to low-income infants and children up to age six, low-income pregnant and postpartum
women, and to low-income senior citizens. In recent years, there has been a shift towards low-
income elderly in this program; in FY 2008, elderly participation comprised approximately 93 percent
of total participation. Foods are distributed through State agencies to supplement food acquired by
recipients from other sources. The CSFP is operated as a Federal/State partnership under agreements
between FNS and State health care, agricultural or education agencies. Currently, 39 States, the
District of Columbia, and two Indian reservations operate CSFP.
· Senior Farmers’ Market Nutrition Program (SFMNP): This program provides coupons to low-
income seniors that can be exchanged for fresh, nutritious, unprepared, locally grown fruits,
vegetables and herbs at farmers’ market, roadside stands, and community-supported agriculture
programs.
· Pacific Island and Disaster Assistance: Pacific Island Assistance includes assistance to the nuclear-
affected zones of the Republic of the Marshall Islands in the form of USDA purchased food, or cash-
in-lieu of food, and administrative funds and is authorized under the Compact of Free Association
Amendments Act of 2003, (P.L. 108-188). Disaster relief funds are provided for use in non-
Presidentially declared disasters.
Federal nutrition assistance programs operate as partnerships between FNS and the State and local organizations that interact directly with program participants. States voluntarily enter into agreements with the Federal Government to operate programs according to Federal standards in exchange for program funds that cover all benefit costs, and a significant portion of administrative expenses.
Under these agreements, FNS is responsible for implementing statutory requirements that set national program standards for eligibility and benefits, providing Federal funding to State and local partners, and monitoring and evaluating to make sure that program structures and policies are properly implemented
Page 3 of 53

FINANCIAL REPORT – U. S. D. A. – F. N. S. – FY 2010 MANAGEMENT DISCUSSION AND ANALYSIS
and effective in meeting program missions. State and local organizations are responsible for delivering benefits efficiently, effectively, and in a manner consistent with national requirements.
FNS Staff:
Page 4 of 53
The public servants of FNS are an important resource for advancing the key outcomes sought through the nutrition assistance programs. The agency staff serves to ensure and leverage the effective use of the other program appropriations.
Approximately 77percent of FNS staff is funded primarily out of the Nutrition Programs Administration account, which represents approximately one-third of one percent of the total FNS budget. The balance of the FNS staff is funded from program accounts. The agency employment level represents less than two percent of the total employment within USDA and is similarly small in proportion to the total State-level staff needed to operate the programs. The agency employs people from a variety of disciplines, including policy and management analysts, nutritionists, computer and communication experts, accountants, investigators, and program evaluators. Because of the small size of the agency’s staff relative to the
resources it manages, FNS has created clear and specific performance measures and must focus its
management efforts in a limited number of high-priority areas.
Program operations are managed through FNS’ seven regional offices and 65 field offices/satellite
locations. A regional administrator directs each regional office. These offices maintain direct contact
with State agencies that administer the FNS programs. The agency’s regional offices also conduct on-site
management reviews of State operations and monitor the nearly 200,000 stores authorized to redeem
SNAP benefits.
As of September 30, 2010, there were 1,349 full-time permanent employees in the agency. There were
522 employees in the Washington headquarters office; and 827 in the field, which includes seven regional
offices; 65 field offices; four SNAP compliance offices in Illinois, California, New Jersey, and
Tennessee; and a computer support center in Minneapolis, Minnesota. The chart below displays staff
year utilization.
Project 2009
Actual 2010
Actual 2011
Requested Supplemental Nutrition Assistance Program Child Nutrition Programs Commodity Assistance Supplemental Nutrition Program _WIC Nutrition Programs Administration
104 158
2 _
977
112 164
2 22
999
116 176
2 22
1084 Center for Nutrition Policy and Promotion 28 34 43 Total Available 1,269 1,333 1,443

FINANCIAL REPORT – U. S. D. A. – F. N. S. – FY 2010 MANAGEMENT DISCUSSION AND ANALYSIS
SECTION 2. PERFORMANCE GOALS, OBJECTIVES and RESULTS
The FNS agency goals and objectives are fully integrated into USDA’s Strategic Goal 4 with three related
Department Strategic objectives. Each Department Strategic Objective has a key outcome and indicator,
as discussed below.
Page 5 of 53
USDA Strategic Goal
USDA Strategic Objective
Programs that Contribute1 Key Outcomes Key Indicators
USDA Goal 4: Ensure That All of America’s Children Have Access to Safe, Nutritious, and Balanced Meals
USDA Strategic Objective 4.1: Increase Access to Nutritious Food
SNAP, CN, WIC, CAP, FDPIR, TEFAP
Key Outcome 1: Reduce hunger and improve nutrition.
Program Participation Rates
USDA Strategic Objective 4.2: Promote Healthy Diet and Physical Activity Behaviors
SNAP, CN, WIC
CNPP2
Key Outcome 2: Promote more healthful eating and physical activity across the Nation.
Nutrition Guidance Distribution Volume
USDA Strategic Objective 4.3: Protect Public Health by Ensuring Food is Safe
SNAP, CN, WIC Key Outcome 3: Maintain a high level of integrity in the nutrition assistance programs.
SNAP Payment Accuracy Rate
STRATEGIC GOAL 4: ENSURE THAT ALL OF AMERICA’S CHILDREN HAVE ACCESS TO SAFE, NUTRITIOUS, AND BALANCED MEALS
Nutrition is the link between agriculture and the Nation’s health, and the Department made strong
progress in advancing our nutrition and health goal in 2010. USDA’s leadership of the Federal nutrition
assistance programs made a healthier diet available for millions of children and low-income families.
And the cutting-edge nutrition promotion efforts of the Center for Nutrition Policy and Promotion
harnessed interactive technologies to motivate all Americans to make positive dietary behavioral changes
consistent with the Dietary Guidelines for Americans and the HealthierUS initiative. Key 2010
accomplishments include:
Promoting access to the Supplemental Nutrition Assistance Program (SNAP). Formerly the Food Stamp Program, SNAP is the Nation’s largest nutrition assistance program, serving a record high 40.2 million people each month and growing. The latest information on the rate of participation among eligible people showed that in 2007, 66 percent of all who were eligible participated as compared with 54 percent in 2001.
Promoting Nutrition Education by Using the MyPyramid Food Guidance System. MyPyramid—a network of nutrition education tools that translates the Dietary Guidelines for Americans into understandable concepts for consumers—offers the American public an individualized approach to nutritional well-being and active living. MyPyramid.gov’s web-based educational tools help
1 SNAP = Supplemental Nutrition Assistance Program (formerly the Food Stamp Program), CN=Child Nutrition (includes the National School Lunch Program, the School Breakfast Program, and the Special Milk Program), WIC = Special Supplemental Nutrition Program for Women, Infants & Children, CAP = Commodity Assistance Programs, FDPIR = Food Distribution Program on Indian Reservations, TEFAP = The Emergency Food Assistance Program 2 CNPP = Center for Nutrition Policy & Promotion (Partner agency to FNS within USDA)

FINANCIAL REPORT – U. S. D. A. – F. N. S. – FY 2010 MANAGEMENT DISCUSSION AND ANALYSIS
Americans assess and personalize their diet and physical activity plans. . The newest tool was the MyPyramid for Preschoolers (ages 2 to 5 years old) to help parents use MyPyramid to help their young children eat well, be active, and be healthy. Consumers continue to respond enthusiastically to this educational approach; thus, CNPP continues to develop new educational tools to promote nutrition education to specific population groups to help stem the trends in obesity and nutrition-related diseases. In 2010, MyPyramid.gov and other nutrition related web-based tools were accessed or used by over 3.5 billion times bringing the overall total since April 2005 to 7.5 billion.
Continuing to ensure that SNAP benefits are accurately issued. The SNAP payment accuracy rate for FY 2009, announced in 2010, was 95.64 percent, a new record high that reflects effective partnerships with State administering agencies, and extensive use of policy options to streamline program adminstration while improving access for working families.
In FY 2010, USDA continued to improve the quality of Americans’ diets through research-based nutrition
enhancements to the Nation’s food supply, and better knowledge and education to promote healthier food
choices. In FY 2010, USDA pursued national policies and programs to ensure that everyone has access to
a healthy diet regardless of income, and that the information is available to support and encourage good
nutrition choices.
USDA’s success in promoting public health through good nutrition and the effectiveness of its nutrition
assistance education programs relies heavily on research. The research provides critical knowledge of
what we need to eat to stay healthy and how that knowledge can be conveyed to the public in a manner
that leads to true changes in our diets. Research also supports development of new healthy and tasty food
products providing another avenue for helping consumers eat well.
STRATEGIC GOAL 4: ENSURE THAT ALL OF AMERICA’S CHILDREN HAVE ACCESS
TO SAFE, NUTRITIOUS AND BALANCED MEALS
OBJECTIVE 4.1: INCREASE ACCESS TO NUTRITIOUS FOODS
Page 6 of 53
4.1.1 Participation levels for major Federal nutrition assistance programs SNAP. (Millions per month)
Overview
The Supplemental Nutrition Assistance Program (SNAP) is the foundation of America’s nutrition
assistance program system. SNAP provides benefits that can be used to purchase food at authorized
retailers for preparation and consumption at home. It makes resources that can be used for food available
to most households with little income. Benefit levels are based on the Thrifty Food Plan, a representative
healthful and minimal cost meal plan that shows how a nutritious diet may be achieved with limited
resources. The benefit levels are adjusted based on the economic circumstances of participating
households.

FINANCIAL REPORT – U. S. D. A. – F. N. S. – FY 2010 MANAGEMENT DISCUSSION AND ANALYSIS
Analysis of Results
In FY 2010, the Department and its program delivery partners sustained effective access to SNAP. Average monthly participation reached 40.2 million in 2010, within the range (37.5 million-40.8 million) for the 2010 target of 40.5 million.
Program participation increased almost 19 percent during FY 2010. USDA’s efforts to support and
encourage SNAP participation included:
· Continued efforts with States to develop outreach strategies. Forty-four out of 53 State agencies – up
from 40 in FY 2009 -- now have formal outreach plans or other documented outreach activity;
· Supported innovative State practices to promote access by simplifying the application process. Twenty-six States use an Internet-based application filing system. Nearly 30 States allow telephone interviews. Twenty-seven States use call centers;
· Implemented the Defense Appropriations Act of 2010 to provide $400 million in administrative funding to States in further response to the downturn; and
· Provided numerous strategies to help States manage workloads because of increasing participation and decreasing State resources due to the economic downturn. These strategies include policy waivers; a workload management matrix tool; a program access toolkit; and encouragement of broad-based categorical eligibility to improve access to applicants and simplify policies for State administration.
USDA also estimates the number of people eligible for the program along with the rate at which eligible people are participating. The latest study shows that, in 2008, 67 percent of all persons eligible for SNAP participated. While the number of those eligible continued to grow rapidly in 2008, increasing by 5.5 percent over the 2007 level, the number of participants increased by 7 percent. Also in 2008, participants received 84 percent of all benefits available if every eligible person participated. This number indicates that the program is effectively reaching those most in need.
Page 7 of 53
Annual Performance Goals, Indicators
and Trends 2006 2007 2008 2009 Fiscal Year 2010
Target Actual Result 4.1.1 Participation levels for the major Federal
nutrition assistance programs (millions per month): Supplemental Nutrition Assistance Program Avg.(Monthly) participation (millions)
26.7 26.5 28.4 33.5 40.5 39.8 Met
Rationale for Met Range: Thresholds for 4.1.1 reflect the margin of error in forecasts of future participation. For Supplemental Nutrition Assistance Program (SNAP) participation, results from 2 independent assessments suggest that predictions of the number of SNAP participants are accurate to within plus-or-minus 7.5 percent (on average). This reflects the pattern of variance between actual and target performance during the past 5 years. · For 2010, this percentage thus allows for actual performance that meets the target in the range (in millions) of 37.5-43.5 million for
SNAP.
Data Assessment of Performance Measure 4.1.1
SNAP participation data are drawn from USDA administrative records. State agency reports are certified accurate and submitted to regional offices. There, they are reviewed for completeness and consistency. If the data are acceptable, the regional analyst posts them to the National Data Bank (NDB) Preload System. NDB is a holding area for data review prior to release. Otherwise, regional-office personnel reject the report and the State agency is contacted. Data posted by regional personnel into NDB are reviewed at FNS. If data are reasonable and consistent with previous reports, they will be downloaded to NDB for public release. If not, the FNS works with regional offices and States to resolve problems and inconsistencies. This process of review and revision ensures that the data are as accurate and

FINANCIAL REPORT – U. S. D. A. – F. N. S. – FY 2010 MANAGEMENT DISCUSSION AND ANALYSIS
Page 8 of 53
Annual Performance Goals, Indicators and Trends
2006 2007 2008 2009 Fiscal Year 2010
Target Actual Resultreliable as possible
Completeness of Data— Figures represent 12-month, fiscal year averages. Participation data are collected and validated monthly before being declared annual data. Reported estimates are based on data through April 30, 2010, as available July 1, 2010.
Reliability of Data— The data are highly reliable. Participation-data reporting is used to support program financial operations. All of the data are used in published analyses, studies and reports. They also are used to support dialogue with and information requests from the Government Accountability Office, the Office of Inspector General, and the Office of Management and Budget.
Quality of Data— As described above, the data used to develop this measure are used widely for multiple purposes, both within and outside USDA. The measure itself is reported in stand-alone publications as an important, high-quality indicator of program performance.
Challenges for the Future
Studies and analyses show that one reason that SNAP-eligible people who do not participate are that they may not be aware of their eligibility. Efforts to improve access to and promote awareness of SNAP, and seek improvements in policy and operations that make applying easier are ongoing challenges.
The quality of program delivery by third parties—hundreds of thousands of State and local Government
workers and their cooperators—is critical to USDA’s efforts to reduce hunger and improve nutrition.
Proper program administration, including timely determination of eligibility, is of special concern.
4.1.2 Improve SNAP payment accuracy
Overview
Ensuring that SNAP and other Federal nutrition assistance programs are administered with integrity is
central to USDA’s mission. Waste and abuse draw scarce resources away from the children who need
them the most. Just as importantly, the programs are ultimately not sustainable without public confidence
that benefits go to those who qualify, are used appropriately, and achieve their intended purposes. The
Department seeks to increase food security and reduce hunger in a manner that inspires public confidence
that taxpayer dollars are used wisely.
Designed to respond to economic conditions, participation in the program has recently grown and benefits
have increased, yet USDA remains strongly committed to program integrity. The Department takes its
stewardship responsibilities for tax payer dollars seriously through an established Quality Control (QC)
system and long-standing support for payment accuracy initiatives. The Department continuously works
to improve payment accuracy through partnerships with States, and regulatory and statutory requirements
for a system that rewards exemplary program performance while holding low-performing States
accountable. It also uses an early detection system to target States that may be experiencing a higher
incidence of errors based on preliminary QC data. Actions then are taken by regional offices to address
these situations in the individual States.
Analysis of Results
SNAP payment accuracy reached a record-high 95.64 percent in 2009, the latest for which data are
available. The number reflects the excellent performance by State agencies in administering the program.
This combined rate reflects 3.53 percent in overpayments and 0.83 percent in underpayments for a total of
4.36 in erroneous payments.

FINANCIAL REPORT – U. S. D. A. – F. N. S. – FY 2010 MANAGEMENT DISCUSSION AND ANALYSIS
Forty-seven States had a payment accuracy rate greater than 94 percent, including 29 States with rates greater than 96 percent. These figures are up from the 35 States with 94-percent accuracy and 15 with 96-percent accuracy the previous year.
Page 9 of 53
Annual Performance Goals, Indicators
and Trends 2006 2007 2008 2009 Fiscal Year 2010
Target Actual Result 4.1.2 Improve SNAP Payment Accuracy Rate 94.2% 94.4% 94.3% 94.9% 95% Not
Available Deferred
FY 2010 data will be available in 2011. Rationale for Met Range: The 95.0 percent confidence interval around the estimate of payment accuracy is ±.33.
· For 2010, this confidence level allows for actual performance that meets the target in the range 94.7-95.3 percent.
Data Assessment of Performance Measure 4.1.2
The Supplemental Nutrition Assistance Program (SNAP), formerly the Food Stamp Program, uses annual payment accuracy data from the Quality Control (QC) process to support SNAP management. The data are based upon statistically valid methodology. The QC process uses a systematic random sampling of SNAP participants to determine a combined payment error rate for each State. The combined error rate is composed of over-issuances and under-issuances of SNAP benefits. A regression formula is applied to the results of the reviews to calculate official error rates. State agencies review selected cases monthly to determine the accuracy of the eligibility and benefit-level determination. The process includes a client interview and verification of all elements of eligibility and the basis of issuance. Federal reviewers validate a sample of the State’s reviews by conducting a re-review. The process has proven to be a sound method of calculating
reliable data.
Completeness of Data—The most current data available for this measure are for FY 2009. The payment accuracy rate of 95.6 percent
exceeded the performance goal/measure target. FY 2010 performance will be deferred until next year’s report. Reliability of Data— QC data are valid and accepted by State SNAP agencies as a basis for performance-incentive payments and
penalties. The U.S. Government Accountability Office and the Office of Inspector General also use it regularly.
Quality of Data— As described above, the data used to develop this measure are used widely for multiple purposes, both within and
outside USDA. The measure itself is frequently cited as an important, high-quality indicator of program performance.
Challenges for the Future
The most critical challenge impacting future success is continuing resource limitations for State agencies. State budgets have been and will continue to be extremely tight. This factor could hurt State performance in payment accuracy. USDA will continue to provide technical assistance and support to maintain payment accuracy in the context of this difficult program environment.
4.1.3 Participation levels for the school meals programs (millions of children per
school day)
Overview
The National School Lunch Program (NSLP) and the School Breakfast Program (SBP) support schools in ensuring access to nutritious food for the children they serve. The programs provide per-meal reimbursement to State and local Governments for meals and snacks served. All meals must meet Federal nutrition standards to qualify for reimbursement.
NSLP serves lunches and snacks in more than 101,000 schools and residential child-care facilities. More than 60 percent of meals are served to low-income children for free or at reduced price.

FINANCIAL REPORT – U. S. D. A. – F. N. S. – FY 2010 MANAGEMENT DISCUSSION AND ANALYSIS
SBP helps school children start the day ready to learn by serving breakfast in more than 88,000 schools and residential child-care facilities. More than 80 percent of meals are served free or at reduced price to low-income children, with more than 75 percent of participating schools serving low-income areas.
Analysis of Results
In FY 2010, USDA and its program delivery partners sustained effective access to school meals. The increased use of direct certification for free school meals for children enrolled in means-tested programs such as SNAP or the Temporary Assistance for Needy Families (TANF) program has helped to provide easy access to school meal benefits. During the 2008-09 school year, 78 percent of school districts used direct certification, up from 67 percent in the prior year. TANF provides financial assistance for children and their parents or relatives who are living with them.
NSLP participation levels reached 31.8 million in FY 2010; within the Met range (30.5 million-33.7 million) for the 2010 target of 31.8 million. Participation increased slightly from FY 2009, continuing the trend of increases in recent years. SBP participation levels reached 11.6 million in FY 2010; within the Met range (11.1 million-12.3 million) for the 2010 target of 11.7 million. These numbers also continue a trend of increases during the last several years.
Page 10 of 53
Annual Performance Goals, Indicators and Trends
2006 2007 2008 2009 Fiscal Year 2010
Target Actual Result 4.1.3 Participation levels for the school meals
programs (millions) Met
· National School Lunch Program Avg.(Daily)
30.1 30.5 30.9 31.6 32.1 31.7
· School Breakfast Program Avg. (Daily) 9.8 10.1 10.6 11.0 11.7 11.7 Rationale for Met Range: Thresholds for 4.1.3 reflect the margin of error in forecasts of future participation, estimated at 7.5 percent for the school meals programs. This reflects the pattern of variance between actual and target performance for both programs during the past 5 years. · For 2010, this percentage range allows for actual performance that meets the targets in the range of 30.5- 33.7 million for the National
School Lunch Program and 11.1-12.3 million for the School Breakfast Program.
Data Assessment of Performance Measure 4.1.3
School meals participation data are drawn from USDA administrative records. State agency reports are certified accurate and submitted to regional offices. There, they are reviewed for completeness and consistency. If the data are acceptable, the regional analyst posts them to the National Data Bank (NDB) Preload System. NDB is a holding area for data review prior to release. Otherwise, regional-office personnel reject the report and the State agency is contacted. Data posted by regional personnel into NDB are reviewed at USDA. If data are reasonable and consistent with previous reports, they will be downloaded to NDB for public release. If not, USDA works with regional offices and States to resolve problems and inconsistencies. This process of review and revision ensures that the data are as accurate and reliable as possible.
Completeness of Data— Figures for NSLP and SBP are based on 9-month (school year) averages. Participation data are collected and validated monthly before being declared annual data. Reported estimates are based on data through April 30, 2010, as available July 1, 2010.
Reliability of Data— The data are highly reliable. Participation-data reporting is used to support program financial operations. All of the data are used in published analyses, studies and reports. They also are used to support dialogue with and information requests from the Government Accountability Office, the Office of Inspector General, and the Office of Management and Budget.
Quality of Data— As described above, the data used to develop this measure are used widely for multiple purposes, both within and outside USDA. The measure itself is reported in stand-alone publications as an important, high-quality indicator of program performance.
FINANCIAL REPORT – U. S. D. A. – F. N. S. – FY 2010 MANAGEMENT DISCUSSION AND ANALYSIS
Challenges for the Future
While almost all school children have access to Federally-subsidized school lunches, significantly fewer schools operate SBP. USDA will continue to pursue strategies to ensure that all students are able to start the day with a nutritious breakfast, at home or at school.
As with other nutrition assistance programs, the Department relies on its partnerships with third parties—
hundreds of thousands of State and local Government workers and their cooperators— to sustain effective
school meals program delivery.
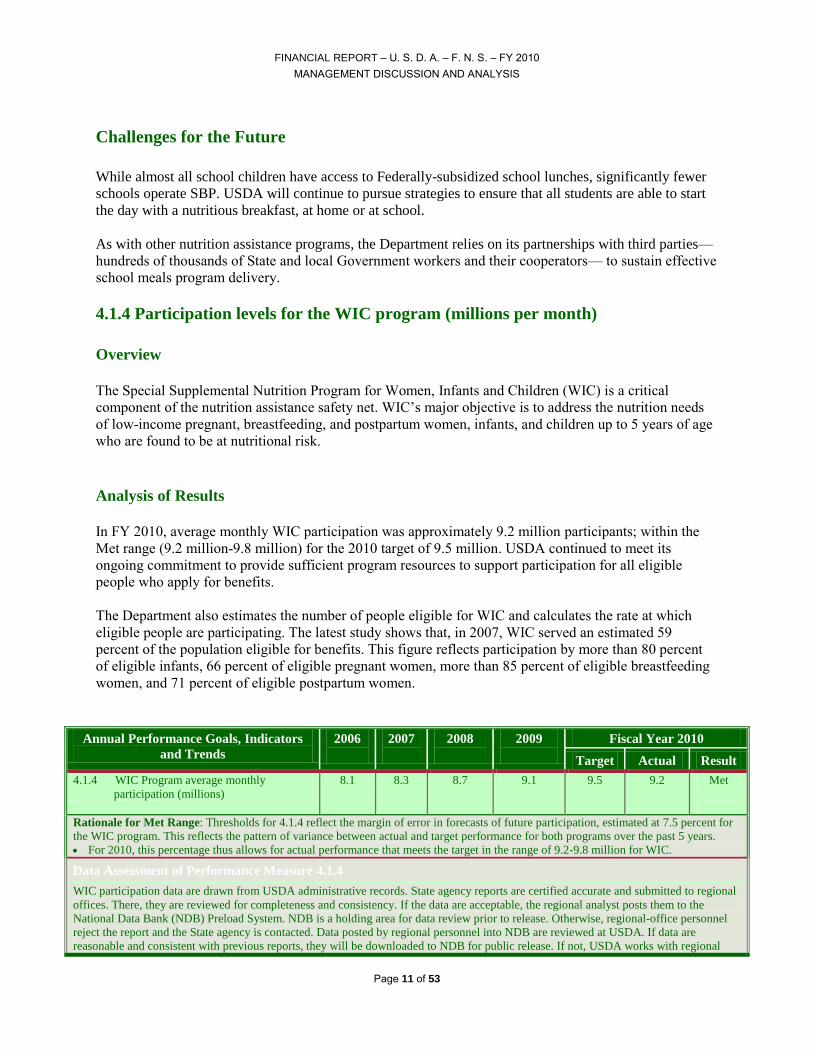
4.1.4 Participation levels for the WIC program (millions per month)
Overview
The Special Supplemental Nutrition Program for Women, Infants and Children (WIC) is a critical
component of the nutrition assistance safety net. WIC’s major objective is to address the nutrition needs
of low-income pregnant, breastfeeding, and postpartum women, infants, and children up to 5 years of age
who are found to be at nutritional risk.
Analysis of Results
In FY 2010, average monthly WIC participation was approximately 9.2 million participants; within the
Met range (9.2 million-9.8 million) for the 2010 target of 9.5 million. USDA continued to meet its
ongoing commitment to provide sufficient program resources to support participation for all eligible
people who apply for benefits.
The Department also estimates the number of people eligible for WIC and calculates the rate at which
eligible people are participating. The latest study shows that, in 2007, WIC served an estimated 59
percent of the population eligible for benefits. This figure reflects participation by more than 80 percent
of eligible infants, 66 percent of eligible pregnant women, more than 85 percent of eligible breastfeeding
women, and 71 percent of eligible postpartum women.
Page 11 of 53
Annual Performance Goals, Indicators
and Trends 2006 2007 2008 2009 Fiscal Year 2010
Target Actual Result 4.1.4 WIC Program average monthly
participation (millions) 8.1 8.3 8.7 9.1 9.5 9.2 Met
Rationale for Met Range: Thresholds for 4.1.4 reflect the margin of error in forecasts of future participation, estimated at 7.5 percent for the WIC program. This reflects the pattern of variance between actual and target performance for both programs over the past 5 years. · For 2010, this percentage thus allows for actual performance that meets the target in the range of 9.2-9.8 million for WIC.
Data Assessment of Performance Measure 4.1.4
WIC participation data are drawn from USDA administrative records. State agency reports are certified accurate and submitted to regional offices. There, they are reviewed for completeness and consistency. If the data are acceptable, the regional analyst posts them to the National Data Bank (NDB) Preload System. NDB is a holding area for data review prior to release. Otherwise, regional-office personnel reject the report and the State agency is contacted. Data posted by regional personnel into NDB are reviewed at USDA. If data are reasonable and consistent with previous reports, they will be downloaded to NDB for public release. If not, USDA works with regional

FINANCIAL REPORT – U. S. D. A. – F. N. S. – FY 2010 MANAGEMENT DISCUSSION AND ANALYSIS
Page 12 of 53
Annual Performance Goals, Indicators and Trends
2006 2007 2008 2009 Fiscal Year 2010
Target Actual Resultoffices and States to resolve problems and inconsistencies. This process of review and revision ensures that the data are as accurate and reliable as possible.
Completeness of Data— Figures represent 12-month, fiscal year averages. Participation data are collected and validated monthly before being declared annual data. Reported estimates are based on data through April 30, 2010, as available July 1, 2010.
Reliability of Data— The data are highly reliable. Participation-data reporting is used to support program financial operations. All of the data are used in published analyses, studies and reports. They also are used to support dialogue with and information requests from the Government Accountability Office, the Office of Inspector General, and the Office of Management and Budget.
Quality of Data—As described above, the data used to develop this measure are used widely for multiple purposes, both within and
outside USDA. The measure itself is reported in stand-alone publications as an important, high-quality indicator of program performance.
Challenges for the Future
Ensuring that adequate, timely funding is available to USDA’s program partners to support participation
among all eligible applicants is an ongoing challenge. The Department and its partners must continue to
work together to manage funds carefully and maintain efficient operations to serve all those in need.
OBJECTIVE 4.2: PROMOTE HEALTHY DIET AND PHYSICAL ACTIVITY BEHAVIOR
4.2.1Application and usage level of nutritional guidance tools.
Overview
Good nutrition and physical activity are important throughout the life cycle. Both, combined, are major forces to be used to help reduce the rates of obesity among different segments of the U.S. population, especially among children. Good nutrition and physical activity will help reduce the obesity epidemic and help prevent the chronic diseases associated with unhealthful dietary practices, such as diabetes, cardiovascular disease, and high blood pressure. To encourage Americans to eat well and be more physically active, USDA uses Federal nutrition policy and nutrition education -- both for the general public and those served by nutrition assistance programs. This work helps provide scientifically based information about healthful diets and lifestyles.
The Department values the trust the public has in the information it provides—information that is based
on the most recent, credible science. In addition, during the past few decades, evidence-based systematic
reviews have replaced expert opinion as the predominant basis for health-related treatment guidelines and
policy. In response, USDA created the Nutrition Evidence Library to specialize in conducting systematic
reviews to inform nutrition policy and programs. For the first time, the Department and the U.S.
Department of Health and Human Services used the Nutrition Evidence Library to update the 2010
Dietary Guidelines for Americans.
USDA uses the Dietary Guidelines and the MyPyramid food guidance system to advise people in the U.S. on how to improve their overall health through proper nutrition. MyPyramid, located at www.mypyramid.gov, implements the guidelines through a network of educational tools. The Department will continue to use the Nutrition Evidence Library to conduct systematic reviews of the science that represents the foundation of its policy and nutrition education tools. It also will continue encouraging partners and “information multipliers” – such as healthcare providers, supermarkets, and school teachers

FINANCIAL REPORT – U. S. D. A. – F. N. S. – FY 2010 MANAGEMENT DISCUSSION AND ANALYSIS
– to maximize the reach and impact of nutrition education messages, both within Federal nutrition-
assistance programs and with the general public.
Other key FY 2010 accomplishments include:
· Continuing the collaborative effort to increase all communication of dietary and physical activity guidance messages. Partnering with MyPyramid, with more than 230 members, showcases the role of various industries and others (e.g., youth groups) as Government partners to encourage healthier eating and physical activity behaviors among families. The partnership is designed to empower nutrition gatekeepers by providing easy to apply guidance for modeling a healthy lifestyle. It also provides information to help them make healthy food choices for themselves and their families where they prepare food, work, play, and purchase food; and
· USDA released its newest educational tool: MyFood-A-Pedia. Located at www.MyPyramid.gov
Page 13 of 53
, this mobile tool provides consumers quick access to nutrition information for more than a thousand foods. Consumers can check calorie amounts, the contribution of a food to the food groups, and the amount of extra calories from solid fats, added sugars, and alcohol in a food.
Analysis of Results
USDA continued its leadership role in promoting nutrition guidance through educational tools designed to motivate people to live healthier. The Department distributed more than 1.6 billion pieces of nutrition guidance materials via the Web and in print. Since the implementation of the 2005 Dietary Guidelines for Americans, USDA distributed more than 22 billion pieces of nutrition guidance materials. The 2010 distribution level, while substantial, fell short of USDA’s goal – a change from the years immediately
following the release of the 2005 Dietary Guidelines for Americans. During that time, distribution
performance typically exceeded goals. The number of nutrition education materials distributed via the
Web and print materials is a direct measure of the degree to which people will seek information that will
help them make prudent decisions about their diet and lifestyle. Typically, a drop in the numbers of
requests is anticipated prior to the release of the next edition of the Dietary Guidelines (in this case, the
2010 Dietary Guidelines for Americans). In 2010, the tremendous public, press, and nutrition community
interest in the concluding activities of the 2010 Dietary Guidelines Advisory Committee, and the release
of its advisory report resulted in a larger drop in requests than expected with the view that new
information was looming. However, with the upcoming release of the 2010 Dietary Guidelines policy
document, the publicized future release of a revamped food pyramid icon, and the pending updated
educational materials and modernized on-line nutrition education tools in 2011, USDA expects to exceed
its target for Web-accessed and print materials in 2011.

FINANCIAL REPORT – U. S. D. A. – F. N. S. – FY 2010 MANAGEMENT DISCUSSION AND ANALYSIS
Page 14 of 53
Annual Performance Goals, Indicators and Trends
2006 2007 2008 2009 Fiscal Year 2010
Target Actual Result 4.2.1 Nutrition guidance, education and
promotion materials distributed (e-hits and print materials) (billions)
1.5 2.6 3.2 3.5 3.0 1.7 Unmet
Rationale for Met Range: Thresholds reflect trends of MyPyramid.gov “hits” and print materials distributed (MyPyramid and the Dietary Guidelines for Americans). · • The precision of USDA’s tracking systems and forecasting methods allow for actual figures to meet the 2010 target in the range 2.8-
3.2 billion.
Data Assessment of Performance Measure 4.2.1
Data on the application and usage level of nutrition guidance tools are drawn from electronic records associated with MyPyramid.gov,
survey analysis, and from inventory records of print materials. Completeness of Data—Data related to MyPyramid.gov are collected instantaneously, indicating the number of e-hits to the Web site
and the number of registrations to MyPyramid Tracker. However, data for October-December 2009 were not available for all parts of the
site due to system problems. Estimates based on prior year performance were used for this portion of the performance period. For print
materials, data from national headquarters represent counts of what was distributed among divisions of FNCS. Reliability of Data—The data are highly reliable. The number of hits is instantaneously recorded, the online survey is continual and
well-tested, and the number of distributed print materials is tracked.
Quality of Data—The data are used to report on the success of the MyPyramid Food Guidance System. Because of the simultaneous
recording of MyPyramid.gov usage, and the thoroughness and continual nature of the customer satisfaction survey, usage and customer
satisfaction levels are a high-quality indicator of the degree to which USDA promotes, and customers respond to, interactive tools and
print materials designed to help Americans personalize their diets. With a change in the system used to record MyPyramid.gov usage, the
Department will again be able to rely on the quality of the data to report whether performance goals have been met.
Challenges for the Future
A major task before USDA is that of crafting actionable, understandable, science-based, and consistent nutrition messages and nutrition education programs in a way that promotes positive behavioral change to help people make better food choices. People must understand current choices of food and then an awareness of the relationships between choices and attitudes toward knowledge of diet/health links. The data that can address this information gap, however, are limited.
The ability of existing nutrition guidance and promotional materials to achieve behavior change remains challenging. Limited resources are available for nutrition promotion relative to other messages, products and practices in the food marketplace. Physical activity and other lifestyle issues also significantly impact body weight and health.
USDA tracks its annual performance in promoting healthful eating and physical activity by monitoring its annual distribution of nutrition education materials. Over the longer term, the Department assesses the effect of these efforts with its Healthy Eating Index (HEI). HEI assesses the conformance to Federal dietary guidance and is based on nutrition surveillance data.

FINANCIAL REPORT – U. S. D. A. – F. N. S. – FY 2010 MANAGEMENT DISCUSSION AND ANALYSIS
Page 15 of 53
SECTION 3. ANALYSIS OF SYSTEMS, CONTROLS, AND LEGAL COMPLIANCE The information in this section is consistent with the findings of the USDA OIG’s FY 2010 financial
statements audit report.
Federal Managers’ Financial Integrity Act (FMFIA) Assurance
Management is responsible for developing and maintaining internal controls to ensure the effectiveness of operations, reliability of reporting, compliance with applicable laws and regulations and safeguarding of assets. Internal control encompasses accounting and administrative controls. Such controls include program, operational and administrative areas as well as accounting and financial management.
FNS has conducted its assessment of internal control and financial systems pursuant to Sections 2 and 4 of FMFIA, for the period ending September 30, 2010. Based on the results of this evaluation, FNS can provide reasonable assurance that internal controls are operating effectively. For FY 2009, FNS had no existing material weaknesses or significant deficiencies on which to report. No new material weaknesses or significant deficiencies were identified for FY 2010.
Federal Financial Management Improvement Act (FFMIA) Assurance
FNS has evaluated its financial management systems under FFMIA for the period ended September 30, 2010. Based on the result of our evaluation, the agency is in substantial compliance with the FFMIA for the following sections:
1. Federal Financial Management System Requirements, 2. Applicable Federal Accounting Standards, 3. Standard General Ledger at the Transaction Level, and 4. Information Security, Policies, Procedures, and Practices
FNS has no areas of substantial non-compliance.
Assurance for Internal Control over Financial Reporting
FNS conducted its assessment of the effectiveness of internal control over financial reporting as of June 30, 2010, in accordance with USDA’s Implementation Guide and as required by the Office of
Management and Budget Circular A-123, Appendix A.
This assessment included an evaluation of entity level controls, risk assessments, process descriptions and
flowcharts, documentation of key controls, an assessment of the design of key controls, tests of

FINANCIAL REPORT – U. S. D. A. – F. N. S. – FY 2010 MANAGEMENT DISCUSSION AND ANALYSIS
effectiveness of properly designed controls, summary of deficiencies and the development of corrective action plans for control deficiencies.
Although no new material weaknesses were identified, FNS did identify one control deficiency that is part of a Department-wide material weakness on Unliquidated Obligations. To date, the deficiency has not been remediated. Therefore, a revised corrective action plan was submitted and approved by the Department. Las year, seven significant deficiencies related to Agency financial management systems were identified. All of the significant deficiencies have been remediated.
While FNS can currently provide reasonable assurance relating to internal controls, financial reporting and financial systems for FY 2010, we have identified an area of concern that will require continued vigilance and efforts relating to the operations of the Agency.
· USDA Data Center Consolidation Initiative – This initiative seeks to leverage technology by consolidating automated systems in a single physical location with significant cost savings. The lack of funding has significantly hampered our ability to implement this and other Department-wide infrastructure initiatives.
Page 16 of 53
OIG Audit Handling Process and Performance
USDA’s Office of the Inspector General (OIG) performs audits of FNS programs, systems and
operations. The results of this work are reports detailing, at a minimum, what was examined, findings that
should be addressed and recommendations for changes/improvements. Upon release of each final report,
FNS submits to OIG a written corrective action plan listing actions planned and dates by which these
actions will occur. Management decision is reached when OIG accepts FNS’s proposed corrective
actions.
Upon reaching management decision, FNS’s Financial Management organization oversees follow-up
activities to assure that planned actions for each recommendation are implemented and completed. As this
occurs, FNS notifies the Department’s Office of the Chief Financial Officer (OCFO) and requests
concurrence that all actions described in the management decision agreement have occurred. Final action
is achieved for each finding/recommendation when all actions necessary to fulfill the management
decision agreement have been performed.
Delays in reaching Final Action status most often occur for two categories of reasons:
o The amount of time needed to complete certain activities cannot be accurately estimated.
Examples of these are:
· Specific legislation, policy or guidance needs to be developed; · An investigation, negotiation, or administrative appeal action must be completed; · An automated system needs to be developed, implemented, or enhanced; · The results of additional monitoring or program review activity must be completed; · Disallowed costs must be collected;
· Legal advice or opinion from the Office of General Counsel is needed; or
· Certain external (state) or administrative actions must occur.

FINANCIAL REPORT – U. S. D. A. – F. N. S. – FY 2010 MANAGEMENT DISCUSSION AND ANALYSIS
o Changes that could not be anticipated at the time management decision was reached: · A change must be made to the management decision agreement. For example, the agreed
upon management decision calls on the Agency to publish a regulation, but Congress initiates a moratorium on regulations.
· Additional information, explanation, advice or action from OIG is needed.
USDA agencies submit quarterly progress reports to OCFO for all audits that remain open more than one year past the management decision date. These interim reports show incremental progress toward completion of planned actions, changes in planned actions, actual or revised completion dates, and explanations for revised dates.
Page 17 of 53

FINANCIAL REPORT – U. S. D. A. – F. N. S. – FY 2010 MANAGEMENT DISCUSSION AND ANALYSIS
Page 18 of 53
In FY 2010, audit numbers 27010-6-KC, CACFP Wildwood – Phase II; 27601-35-CH, CACFP Supper Meals
Served in Schools; 27099-63-AT, SFSP Operated by the State of Georgia; and 27501-2-HY, Application Control
Review of FNS’s Store Tracking and Redemption System II were closed. The Inspector General Act Amendments
of 1988 requires the accompanying data for an annual report on the status of audits.
Audits Without Final Action More Than One Year Past the Management Decision Date
Audit Number Date Issued Audit Title Completion Date
for Actions (est) Reason for Lack of Final
Action
27601-3-CH 3-22-96 SNAP Disqualified Recipient System 12-31-10 Awaiting publication of
regulations
27010-19-SF 11-18-99 Smart Start, Inc. 8-31-11 Awaiting collection of disallowed costs
27010-3-KC 3-22-00 CACFP-Wildwood 10-31-11 Pending collection (repayment plan)
27010-6-KC 11-21-01 CACFP Wildwood – Phase II 12-31-09 Agency requesting final action
27601-18-CH 10-28-05 Monitoring of CACFP Providers in Minnesota N/A
Awaiting collection of disallowed costs-- under court ordered restitution
27099-34-SF 8-17-07 SSNAP California and Nevada 12-31-10 Pending legal action on
complaint
27099-49-TE 9-4-07
Disaster Supplemental Nutrition Assistance Program for Hurricanes Katrina and Rita
11-30-11 Awaiting publication of regulations
27601-32-CH 9-28-04 Compliance With Improper Payments Reporting Requirements
6-30-11 Awaiting OMB clearance
27099-68-HY 6-20-08 Electronic Benefits transfer System State of Colorado 12-31-10 Pending billing issue and
administrative action
27601-16-AT 3-31-08 Food Stamp Employment and Training Program 8-31-12 Awaiting publication if
regulations

FINANCIAL REPORT – U. S. D. A. – F. N. S. – FY 2010 MANAGEMENT DISCUSSION AND ANALYSIS
SECTION 4. IMPROPER PAYMENTS INFORMATION ACT (IPIA) The Improper Payments Information Act (IPIA) requires all agencies to 1) review all programs and activities, 2) identify those that may be susceptible to significant improper payments, 3) estimate the annual amount of improper payments for each program and activity and 4) report results.
Appendix C of OMB Circular A-123 defines significant improper payments as an annual amount that exceeds both 2.5% of program payments and $10,000,000. For programs/payments that fit this description, agencies must:
· Measure and reduce the improper payments, · Identify the causes and take action to correct them, · Implement necessary infrastructure to support activities, · Develop proposals to obtain necessary infrastructure, and · Hold managers accountable for results.
FNS assessed all food assistance programs as well as its Nutrition Programs Administration (NPA) funding, which support FNS’s Federal administrative operations. Assessments were conducted in
conjunction with USDA-coordinated procedures. FNS, with OMB concurrence, has designated five
programs as susceptible to significant improper payments: the Supplemental Nutrition Assistance
Program (SNAP), the Special Supplemental Nutrition Program for Women, Infants and Children (WIC),
the Child and Adult Care Food Program (CACFP), the National School Lunch Program (NSLP) and the
School Breakfast Program (SBP). Improper payment measurement activities for each are described
briefly below.
· The Supplemental Nutrition Assistance Program (SNAP – formerly known as the Food Stamp Program), sampling and erroneous payment measurement processes, the accepted hallmark of the IPIA environment, has been a legislative mandate for more than 30 years. This process compares the certification criteria upon which a household’s benefit issuance is determined with the
household’s circumstances at the time of issuance. All case results are accumulated by state. The
state results are validated and the validated results are combined into a national cumulative
(overpayments plus underpayments) error rate. No other payment lifecycle steps are included.
Improper payment measurement activities predate the passage of the IPIA. SNAP processes
were compliant with the intent of the law when it was passed. State agencies are required to
establish and collect SNAP claims in accordance with the requirements found in the Program
regulations. Debts that become delinquent are subsequently submitted by the State agencies for
collection through the Treasury Offset Program. In past years, FNS has used target measures to
gauge the success of recipient claims activity. Claims collection by States is ongoing, however,
success in this area can be challenging, since collections are to a large extent tied to the ability of
each individual State to pursue and collect erroneous payments. To complicate matters, State
error rates fluctuate over time with changes in the economy and in the numbers of the recipient
population
· In the Special Supplemental Nutrition Program for Women, Infants and Children (WIC), work is underway to report improper payment error rates on two segments of the program:
certification error and vendor error.
Page 19 of 53

FINANCIAL REPORT – U. S. D. A. – F. N. S. – FY 2010 MANAGEMENT DISCUSSION AND ANALYSIS
o FNS first reported a vendor improper payment error rate in FY 2006. Over and under payment rates for FY 2005 were developed through a nationally representative study of a probability sample of WIC vendors. Data from this study is then in conjunction with information on vendor investigations by State WIC Agencies to prepare a statistically estimated improper payment amount for each subsequent year. Until the next study is completed, the 2005 rates will be aged using data generated by State undercover investigators who attempt to make WIC purchases using valid WIC food instruments. The charges submitted by each sampled vendor are compared to the undercover purchase activity to estimate overcharging, and other sanctionable violations. Case results are accumulated by State and used to age the estimates.
o Certification rate: WIC households are interviewed and compared to the certification criteria upon which a household’s benefit issuance was determined with the household’s
circumstances at the time of issuance. However, delays in the study will result in data
collection being delayed until FY 2009. A preliminary estimate of erroneous payments
associated with certification actions will be available in 2011.
Current statutory authority allows USDA to recover improper payments from state agencies when identified through reviews, audits or other operational oversight activities. This authority does not support collection of improper payments identified on the basis of a statistical sample or estimation procedure, as is used to develop the national estimates of improper payments reported here.
· The Child and Adult Care Food Program (CACFP) has three distinct parts: Child Care Centers, Adult Day Care facilities and Family Day Care Homes (FDCHs). Overall program funding is provided to state agencies which provide funds to sponsoring organizations to pay for claims for reimbursable meals served at provider sites. Sites can be as large as an institution or as small as a household. Each part of CACFP has its own reimbursement structure.
Payments and claim information are transferred among FNS, State agencies, program sponsors and program sites; each such transaction represents a risk for improper payment. Because requirements vary significantly for each different type of program sponsor and site, a comprehensive assessment of improper payments is extremely complex.
The original plan was to develop a program-wide study which would examine reimbursements for meals served and develop program error measurements that complied with the requirements of the IPIA. Because of the complexities of the program, FNS estimated that it would cost $20 million to measure improper payments at the precision required by IPIA. This amount has not been appropriated.
FNS has identified the FDCH component of this program as potentially high risk, and measures error in this part of the program in lieu of the unfunded comprehensive measure. FDCHs participate in CACFP through public or private nonprofit sponsoring organizations. FDCH improper payments are most likely caused by sponsor error in determining a participating home’s
reimbursement tier (tiering error) or by FDCH error in reporting the number of meals which are eligible for reimbursement (claiming error).
Page 20 of 53

FINANCIAL REPORT – U. S. D. A. – F. N. S. – FY 2010 MANAGEMENT DISCUSSION AND ANALYSIS
Two activities are underway which provide information on improper payments in the FDCH component of CACFP. A third activity is being pilot tested.
o CCAP
Page 21 of 53
– In the spring of 2004, FNS began the Child Care Assessment Project (CCAP). This project was designed to measure the effectiveness of efforts to improve the integrity of CACFP family day care homes and provide information from a broadly representative national sample of sponsors and providers. Data were collected by the Food and Nutrition Service (FNS), in cooperation with State agencies and sponsors administering the Child and Adult Care Food Program, during the period 2004-2007. The CCAP process was designed to measure whether the two interim management improvement rules issued by FNS in 2002 and 2004 had been properly implemented, and whether the rules had effectively addressed the serious program management and integrity problems that had been uncovered in the 1990s. In the three and one-half years during which assessments were conducted, FNS gathered the program records of 58 family day care home (FDCH) sponsors and over 3,000 of their providers. A final report was issued in July 2009. Overall, the findings indicated that the serious problems which had prompted the previous legislative and regulatory action were not common in 2004-2007. However, some concerns were identified, including the accuracy of recordkeeping by family day care home providers and the use of the serious deficiency process by program sponsors. FNS is currently developing an action plan to address those CCAP findings which suggest a need for additional measures to improve Program administration in the FDCH component of CACFP at the local, State, and Federal levels. This action plan will take into account the very real challenges of providing Federally-supported nutrition assistance in approximately 140,000 private residences across the country. Therefore, any changes to Program procedures and requirements recommended in the action plan will consider this unique aspect of administering the CACFP
o Sponsor error – FNS has developed an annual sponsor tiering error measure and tested it. CACFP sponsors are responsible for determining whether family day care homes receive meal reimbursement at the higher rate (Tier 1) or lower rate (Tier 2). In FY 2005, the first annual data collection began to determine a nationally representative sponsor tiering determination error rate. Results for FY2005, FY2006 and FY2007 have been reported. FY 2008 estimates were available in August 2010.
o Claiming error - In its 2006 measurement plan, FNS proposed to test the feasibility of estimating the risk of claiming errors. FNS proposed to select a random sample of sponsoring organizations and, from each, use a random selection of the sponsor’s
monitoring visits of FDCHs. FNS would compare the number of meals claimed with the
number of children observed at the time of the visit. If feasible to conduct, it was
assumed that this comparison would provide an estimate of the risk of overpayment.
FNS staff collected data in 11 family day sponsors around the country, gathering a
random sample of 268 FDCH sponsor monitoring visit records. For each, FNS gathered
the FDCH’s meal claim data for the month of the monitoring visit and the month before.
Results were analyzed and released in a report in May 2009; FNS found that the tested
method does not provide a reliable estimate of family day care meal claiming error.
FNS developed and pilot tested additional alternatives to determine the feasibility of
estimating the risk of claiming error by methods such as direct observation of FDCHs or

FINANCIAL REPORT – U. S. D. A. – F. N. S. – FY 2010 MANAGEMENT DISCUSSION AND ANALYSIS
by contacting parents to determine if children were really present at a FDCH when claimed. This test found that parent recall surveys are worthy of further evaluation as the method most likely to yield reliable information on improper payments related to meal claiming errors. A report on the feasibility study was released in September 2009.
Improper payments identified through the course of a review, audit, or through other operationaloversight activities can be recovered either through direct billing or through an offset of future program payments earned. Current statutes only provide authority to recover improper payments identified through reviews, audits or other operational oversight activity. Program regulations allow States to waive claims against a single institution for improper payments of up to $600 in a single fiscal year. CACFP does not have authority to pursue collection of improper payments identified on the basis of a statistical sample or estimation procedure.
· The National School Lunch Program and School Breakfast Program do not have a sampling and erroneous payment measurement process comparable to SNAP. Instead, FNS relies on nationally representative studies to produce estimates of erroneous payments. The most recent study was reported in 2007. Contingent upon available funding, FNS will produce an erroneous payment measurement by updating this study every five years. Also, as part of this same project, FNS developed a methodology that uses data available from other sources to estimate erroneous payments due to certification error on an annual basis. Current statutory authority allows USDA to recover improper payments from state agencies when identified through review, audits or other operational oversight activities. Current statutory authority does not support collection of improper payments identified on the basis of a statistical sample or estimation procedure, as is used to develop the national estimates of improper payments reported here.
Nationally-Representative Study: The sampling plan for the large national study of erroneous payments in NSLP and SBP called for the selection of a national probability sample of School Food Authorities (SFAs), schools, certified students and households that applied and were denied NSLP and SBP benefits in school year 2005-06. A stratified random sample of 78 unique public SFAs was selected in the first stage of sampling. Stratification variables included geographic region, prevalence of schools with SBP and those using Provision 2/3, and a poverty indicator. For SFAs that do not have Provision 2/3 schools, three schools, on average, were selected for inclusion in the studying the second stage of sampling. Schools were stratified into two groups: (1) elementary schools and (2) middle and high-schools. The school sample included both public and private schools. A total of 264 schools participated in the study (216 non-Provision 2/3 schools, 24 Provision 2/3 schools in their base year, and 24 Provision 2/3 schools not in their base year). For the third stage of sampling, samples of households were selected in 240 of these schools to yield completed interviews for about 3,000 students certified for free and reduced-price meals and about 400 denied applicant households. The sample of approved and denied applicant households was augmented by sampling of applications from Provision 2/3 schools in which household surveys were not conducted. Application reviews of about 6,800 students approved for free and reduced-price meals and over 1,000 denied applicants were conducted to estimate the case error rate due to administrative error. All schools selected for application reviews would also include data collection for counting and claiming errors. Field staff observed approximately 100 lunch transactions at each of 245 schools participating in the NSLP and 50 breakfast transactions at each of 218 schools participating in the SBP on randomly selected school days. Cashier error was estimated using information from these meal transactions. Data on school-recorded daily meal totals across all points of sale, aggregated meal counts reported to the district,
Page 22 of 53

FINANCIAL REPORT – U. S. D. A. – F. N. S. – FY 2010 MANAGEMENT DISCUSSION AND ANALYSIS
and total meals submitted to the State Agency for reimbursement were examined to determine claiming errors.
Interim Estimation: To update the erroneous payment rate estimates in NSLP without having to conduct another full round of primary data collection, a series of econometric models were developed that captured the relationship between characteristics of the districts that participated in the APEC study and their estimated rates of certification error. Estimated coefficients from these models were used in conjunction with updated values of district characteristics obtained from the School Food Authorities Verification Summary Reports (Form FNS-742) to predict certification error. Certification error rates were then translated into amounts and rates of erroneous payments in each district. Aggregating the district level estimates produced a national measure of predicted erroneous payments.
Page 23 of 53
Additional information on FNS’ Improper Payments Information Act (IPIA) activities can be found in the
USDA Performance and Accountability Report.
The tables below summarize the results of measurement activities for FNS programs identified as subject
to a significant risk of improper payments. The first table shows improper payment rates for the last two
years and the second table reflects future reduction targets. All results reported each year represent
measures of outlays and program activity for the previous year.

FINANCIAL REPORT – U. S. D. A. – F. N. S. – FY 2010 MANAGEMENT DISCUSSION AND ANALYSIS
Preliminary Data as of 7/31/10 – FNS Measures for IPIA Reporting
2008 Performance and Accountability Report
Page 24 of 53
Improper Payment Sampling Results ($ in millions)
Program Results
Reported in FY 2009 Results
Reported in FY 2010 Outlays IP% IP$ Outlays IP% IP$
Supplemental Nutrition Assistance Program, FNS 34,611 5.01% 1,733 50,360 4.36% 2,195 National School Lunch Program, FNS 9,436 16.44% 1,551 8,925 16.28% 1,453 School Breakfast Program, FNS 2,273 24.62% 560 2,534 24.87% 630 Women, Infants and Children, FNS Total Program Certificación Error Component Vendor Error Component
4,483 4,483 4,483
N/A N/A
1.27%
N/A N/A
57
6480 6480 6480
N/A N/A
1.17%
N/A N/A
76 Child and Adult Care Food Program, FNS Total Program FDC Homes – Tiering Decisions FDC Homes – Meal Claims
2,214 713 713
N/A 2.07%
N/A
N/A 14.7 N/A
2,461 911 911
N/A .99%
N/A
N/A 9
N/A
Detailed Breakout of Improper Payment Rates reported in FY 2010 ($ in millions) Total
Payments IP% Over-payments
Under- payments Other
Supplemental Nutrition Assistance Program, FNS 50,360 4.36% 4.36% .82% N/A National School Lunch Program, FNS 8,925 16.28% 7.09% 2.31% N/A School Breakfast Program, FNS 2,534 24.87% 7.02% 2.06% N/A Women, Infants and Children, FNS Vendor Error Component 6480 1.17% 0.86% 0.31% N/A Child and Adult Care Food Program, FNS FDC Homes – Tiering 911 .99% .99% 0.00% N/A
Improper Payment Reduction Outlook ($ in millions)
Program FY 2010 Reporting FY 2011 Reporting FY 2012 Reporting
Outlays IP% IP$ Outlays IP% IP$ Outlays IP% IP$ Supplemental Nutrition Assistance Program, FNS 50,360 4.36% 2,195 72,577 5.0% N/A 76,030 5.0% National School Lunch Program, FNS 8,925 16.28% 1,453 2,823 24.06% 10,456 15.37% School Breakfast Program, FNS
2,534 24.87% 630 2,823 23.03% 650 2,959 23.27%
Women, Infants and Children, FNS 6480 1.17% 76 7,704 .97% 575 7,467 0.77% 57 Child and Adult Care Food Program, FNS 911 .99% .99 896 .92% 18.2 908 .87% 8

FINANCIAL REPORT – U. S. D. A. – F. N. S. – FY 2010 MANAGEMENT DISCUSSION AND ANALYSIS
SECTION 5. LIMITATIONS OF FINANCIAL STATEMENTS
The principal financial statements have been prepared to report the financial position and results of operations of the Food and Nutrition Services (FNS), an agency of the United States Department of Agriculture, pursuant to the requirements of 31 U.S.C. 3515 (b). While the statements have been prepared from the books and records of FNS in accordance with GAAP for Federal entities and the formats prescribed by OMB, the statements are in addition to the financial reports used to monitor and control budgetary resources which are prepared from the same books and records.
The statements should be read with the realization that they are for a component of the U.S. Government, a Sovereign entity.
Page 25 of 53
SECTION 6. FINANCIAL STATEMENTS HIGHLIGHTS AND ANALYSIS
FNS’ FY 2010 financial statements reflect the nutrition assistance programs’ responsiveness to the
Nations’ economic performance. By design, the level of activity within the nutrition assistance programs
varies with the level of need experience by the populations we serve. A key determinant of this level of
need is the condition of the economy. In FY 2009 the economy performed weaker than was anticipated by
the President’s FY 2009 budget request. As a result, program participation and costs, as reflected in the
financial statements are, on average, higher than was anticipated.
In accordance with the US Standard General Ledger and the Treasury Financial Manual 1TFM 4700, in
FY 2008 FNS clarified its reporting of the Grant Award (GAD) Accrual. FNS performed an analysis of
the GAD Accrual and determined that the GAD Accrual consisted of Entitlement Benefits and Non
Entitlement Benefits. For the FY 2010 Financial Statements FNS will report Entitlement Benefits as
“Benefits Due and Payable” and report Non Entitlement Benefits as “Other Liabilities” on the Balance
Sheet and related footnotes. The classifications of these accruals have no impact on the amounts reported
for Total Liabilities.
Balance Sheet
2010 2009 Dollars (mil) Percent Dollars(mil) Percent
Fund Balance With Treasury 20,851 96.31% 20,820 96.44% Accounts Receivable 310 1.43% 324 1.50% General PP& E 2 0.01% 4 0.02% Other 486 2.25% 441 2.04%
Total Assets 21,649 100.00% 21,589 100.00%
Accounts Payable 2 0.01% 4 0.02% Employee Benefits 6 0.03% 6 0.03% Benefits Due and Payable 3,356 15.50% 3,120 14.45% Other Liabilities 1,625 7.51% 1,166 5.40%
Total Liabilities 4,989 23.05% 4,296 19.90%

FINANCIAL REPORT – U. S. D. A. – F. N. S. – FY 2010 MANAGEMENT DISCUSSION AND ANALYSIS
Page 26 of 53
Unexpended Appropriations 16,393 75.72% 17,008 78.78%
Cumulative Results of Operations 267 1.23% 285 1.32%
Total Net Position 16,660 76.95% 17,293 80.10% Total Liabilities & Net Position 21,649 100% 21,589 100%
The Balance Sheet composition (comparative composition of account balances to the totals) remained substantially the same in FY 2010 as the prior year. The vast majority of FNS assets are held in Fund Balance with Treasury (FBWT) - approximately 96% in FY 2010 and FY 2009. This cash-like account largely represents the aggregate amount of funds in the FNS accounts with the U.S. Treasury from which the agency is authorized to make expenditures and pay liabilities. As financial statement Note 3 presents, a substantial portion of the fund balance is unavailable as they are associated with either expired years or are contingency funds which were not made available.
“Other assets” remained at levels consistent with the prior year. Accounts receivable levels also remained
consistent with the prior year.
Benefits Due and Payable represents the largest liability of the agency, typically representing amounts
that are currently payable to grantees on Entitlement Benefits Programs. The FY 2010 and FY 2009 Net
Position of the agency is concentrated in Unexpended Appropriations.
Statement of Net Cost
2010 2009
Dollars(mil) Percent Dollars(mil) Percent Gross Cost 95,590 100.05% 79,430 100.05% Less: Earned Revenue (51) -0.05% (42) -0.05% Net Cost of Operations 95,539 100.00% 79,388 100.00%
The FNS mission addresses USDA Strategic Goal 4 “To Improve the Nation’s Nutrition and Health”. All
program costs are reported under that strategic goal. Gross Costs increased from $79,430 million in FY
2009 to $95,590 million in FY 2010, reflecting the overall increase in programs participation levels. .
As the chart above displays, Earned Revenue represents an extremely small offset to Gross Costs (less
than one percent), in both fiscal years. Earned revenue largely represents funds from the State Option
Supplemental Nutrition Assistance Program authorized under P.L. 105-18. States participating in this
program (California, Wisconsin, and Nebraska) reimburse FNS for benefits paid to legal immigrants who
do not qualify for the Federal Supplemental Nutrition Assistance Program to whom the States have
“opted” to provide benefits. Additional earned revenue is received from other Federal agencies for
reimbursement of expenses related to information technology services and facility-related services
including WBSCM, Commodity Improvement Initiative and Whole Grain Study.
The Net Cost of Operations increased from $79,388 million in FY 2009 to $95,539 million in FY 2010.

FINANCIAL REPORT – U. S. D. A. – F. N. S. – FY 2010 MANAGEMENT DISCUSSION AND ANALYSIS
Statement of Changes in Net Position
Page 27 of 53
2010 2009
Dollars(mil) Percent Dollars(mil) Percent Cumulative Results of Operations Beginning Balance 285 223 Appropriations Used 87,434 91.53% 71,833 90.41%
Transfers In (Out) without Reimbursements 7,036 7.37% 6,588 8.29% Other Budgetary Financing Sources 0 0.00% 0 0.00% Imputed Financing 1,050 1.00% 1,029 1.30% Total Financing Sources 95,520 100.00% 79,450 100.00% Less: Net Cost of Operations 95,539 79,388 Ending Balance 267 285 Net Change
(18) 62 Unexpended Appropriations Beginning Balance 17,008 15,311 Appropriations Received 87,132 75,649 Adjustments (313) (2119) Appropriations Used (87,434) (71,833) Total: Financing Sources (615) 1,697 Ending Balance 16,393 17,008
Total Net Position 16,660 17,293
The Statement of Changes in Net Position explains the changes in the two components of Net Position of the Balance Sheet from year to year, the Cumulative Results of Operations and the Unexpended Appropriations.
The FY 2010 appropriations used was $87,434 million, increased $15,601 million from FY 2009, based on actual participation levels and food costs.
Cumulative Results of Operations decreased $18 million, from $285 million in FY 2009 to $267 million in FY 2010, as the net cost of operations is greater than the total financing sources. The proportional distribution of financing sources among appropriations, transfers, and imputed financing remained relatively unchanged from FY 2009 to FY 2010. Transfers are largely made up a single large transfer made in the annual appropriations act from funds available to the Secretary under Section 32 of the Act of 1935 for support of Child Nutrition programs. Additionally, FNS received transfers from the Commodity Credit Corporation for the Senior Farmers Market Program. Transfers represented approximately eight percent and ten percent of total financing sources in FY 2010 and FY 2009 respectively.

FINANCIAL REPORT – U. S. D. A. – F. N. S. – FY 2010 MANAGEMENT DISCUSSION AND ANALYSIS
Unexpended Appropriations decreased from $17,008 million in FY 2009 to $16,393 million in FY 2010as more carryover appropriation balances were expended in the current year. Adjustments decreased from $2,119 million in FY 2009 to $313 million in FY 2010 are due to cancellations of expired accounts.
Statement of Budgetary Resources
Page 28 of 53
2010 2009
Dollars(mil) Percent Dollars(mil) Percent Budgetary Resources Beginning Unobligated Balance 15,473 14.01% 14,258 15.01% Recoveries 990 0.90% 507 0.53% Appropriations 87,130 78.89% 75,647 79.66% Collections 129 0.11% 85 0.09%
Change in unfilled customer orders 0 0.00% 0 0.00% Transfers 7038 6.37% 6,590 6.94% Less: Permanently Not Available -313 -.28% -2,119 -2.23%
Total Budgetary Resources 110,447 100.00% 94,968 100.00%
Status of Budgetary Resources Direct Obligations 95,816 86.75% 79,453 83.66% Reimbursable Obligations 51 0.05% 42 0.04% Apportioned- Unobligated 3,775 3.42% 1,520 1.60% Unobligated- Not Available 10,805 9.78% 13,953 14.69%
Total: Status of Budgetary Resources 110,447 100.00% 94,968 100.00%
Net Outlays 93,822 84.95% 77,844 81.97%
The Statement of Budgetary Resources displays the source of all budgetary resources for the fiscal year as well as the status of those resources as of the end of the fiscal year.
Appropriations were increased from $75,647 millions in FY 2009 to $87,130 millions in FY 2010. Total budgetary resources were higher than prior year due to increase in Appropriations for the year. FNS had $110,447million in total budgetary resources during FY 2010, largely from appropriations received, but also from recoveries and available unobligated balances from prior periods. In addition FNS has included in the FY 2010 financial statements the ARRA supplemental appropriations used to stimulate the U.S. economy. The ARRA appropriations for FY 2010 totaled $10.7 billion
Permanently Not Available decreased from $2,119 million in FY 2009 to $313 million in FY 2010 is due to cancellations of expired accounts.

FINANCIAL REPORT – U. S. D. A. – F. N. S. – FY 2010 MANAGEMENT DISCUSSION AND ANALYSIS
At fiscal yearend 2010, most ($95,816) million or 86%) of those resources were obligated, though $3,775 million or 3% remained unobligated and available, and another $10,805 million (9%) was unobligated and not available (including apportioned unavailable Contingency Reserve funds for WIC and SNAP). In FY 2010, Net Outlays represented 82% of Total Budgetary Resources, compared to 80% in FY 2009.
Page 29 of 53

FINANCIAL REPORT – U. S. D. A. – F. N. S. – FY 2010 FINANCIAL STATEMENTS
Page 30 of 53
Food and Nutrition Service
CONSOLIDATED BALANCE SHEET As of September 30, 2010 (CY) and 2009 (PY)
(Dollars in Millions)
FY 2010 FY 2009 (CY) (PY)
Assets (Note 2): Intragovernmental:
Fund Balance with Treasury $ 20,851 $ 20,820 Other (Note 6) 486 441
Total Intragovernmental 21,337 21,261 Accounts Receivable, net (Note 4) 310 324 General Plant, Property, and Equipment, net (Note 5) 2 4 Other (Note 6) - -
Total Assets $ 21,649 $ 21,589
Liabilities (Note 7): Intragovernmental:
Accounts Payable $ - $ 2 Other (Note 8) 36 32
Total Intragovernmental 36 34
Accounts Payable 2 2 Federal Employee and Veterans Benefits 6 6 Benefits Due and Payable 3,356 3,120 Other (Note 8) 1,589 1,134
Total Liabilities 4,989 4,296
Net Position: Unexpended Appropriations -Other Funds 16,393 17,008 Cumulative Results of Operations - Other Funds 267 285
Total Net Position $ 16,660 $ 17,293 Total Liabilities and Net Position $ 21,649 $ 21,589
The accompanying notes are an integral part of these statements.
Note: CY denotes Current Year; PY denotes Prior Year.

FINANCIAL REPORT – U. S. D. A. – F. N. S. – FY 2010 FINANCIAL STATEMENTS
Page 31 of 53
Food and Nutrition Service CONSOLIDATED STATEMENTS OF NET COST
For the Years Ended September 30, 2010 (CY) and 2009 (PY) (Dollars in Millions)
FY 2010 FY 2009 (CY) (PY)
Program Costs: Strategic Goal:
Improve the Nation's Nutrition and Health:
Gross Costs (Note 10) $ 95,590 $ 79,430 Less: Earned Revenue 51 42 Net Program Costs 95,539 79,388
Net Cost of Operations $ 95,539 $ 79,388
The accompanying notes are an integral part of these statements.

FINANCIAL REPORT – U. S. D. A. – F. N. S. – FY 2010 FINANCIAL STATEMENTS
Page 32 of 53
Food and Nutrition Service CONSOLIDATED STATEMENTS OF CHANGES IN NET POSITION
As of September 30, 2010 (CY) and 2009 (PY) (Dollars in Millions)
FY 2010 FY 2009 (CY) (PY)
Cumulative Results of Operations: Beginning Balance $ 285 $ 223 Beginning Balance, as adjusted 285 223
Budgetary Financing Sources: Appropriations Used 87,434 71,833 Transfers in/out without reimbursement 7,036 6,588 Other - -
Other Financing Sources (Non-Exchange):
Imputed Financing 1,050 1,029
Total Financing Sources 95,520 79,450 Less: Net Cost of Operations 95,539 79,388 Net Change (19) 62
Cumulative Results of Operations 267 285
Unexpended Appropriations: Beginning Balance 17,008 15,311 Beginning Balance, as adjusted: 17,008 15,311
Budgetary Financing Sources: Appropriations Received 87,130 75,647 Appropriations Transferred in/out 2 2 Other Adjustments (313) (2,119) Appropriations Used (87,434) (71,833) Total Budgetary Financing Sources (615) 1,697
Total Unexpended Appropriations 16,393 17,008
Net Position $ 16,660 $ 17,293
The accompanying notes are an integral part of these statements.

FINANCIAL REPORT – U. S. D. A. – F. N. S. – FY 2010 FINANCIAL STATEMENTS
Page 33 of 53
Food and Nutrition Service CONSOLIDATED STATEMENTS OF BUDGETARY RESOURCES
For the years ended September 30, 2010 (CY) and 2009 (PY)
(Dollars in Millions) FY 2010 FY 2009 (CY) (PY)
Budgetary Resources: Unobligated balance, brought forward, October 1: $ 15,473 $ 14,258 Recoveries of prior year unpaid obligations 990 507 Budget authority
Appropriation 87,130 75,647 Spending authority from offsetting collections
Earned Collected 129 85
Change in unfilled customer orders Advance received (0) - Without advance from Federal sources (0) -
Subtotal 87,259 75,732 Non-expenditure transfers, net, anticipated and actual 7,038 6,590 Permanently not available (313) (2,119) Total Budgetary Resources $110,447 $ 94,968
Status of Budgetary Resources: Obligations Incurred:
Direct $ 95,816 $ 79,453 Reimbursable 51 42 Subtotal 95,867 79,495
Unobligated balance: Apportioned 3,775 1,520 Subtotal 3,775 1,520
Unobligated balance not available 10,805 13,953 Total status of budgetary resources $110,447 $ 94,968
Change in Obligated Balances: Obligated balance, net
Unpaid obligations, brought forward, October 1 $ 5,347 $ 4,288 Total unpaid obligated balance, net 5,347 4,288
Obligations incurred net (+/-) 95,866 79,495 Gross outlays (93,951) (77,929) Recoveries of prior year unpaid obligations, actual (990) (507) Change in uncollected customer payments from Federal sources (+/-) (0) - Obligated balance, net, end of period
Unpaid obligations 6,272 5,347 Uncollected customer payments from Federal sources - - Total unpaid obligated balance, net, end of period 6,272 5,347

FINANCIAL REPORT – U. S. D. A. – F. N. S. – FY 2010 FINANCIAL STATEMENTS
Page 34 of 53
Net Outlays: Gross outlays 93,951 77,929 Offsetting Collections (129) (85) Distributed offsetting receipts - - Net Outlays $ 93,822 $ 77,844
The accompanying notes are an integral part of these statements.
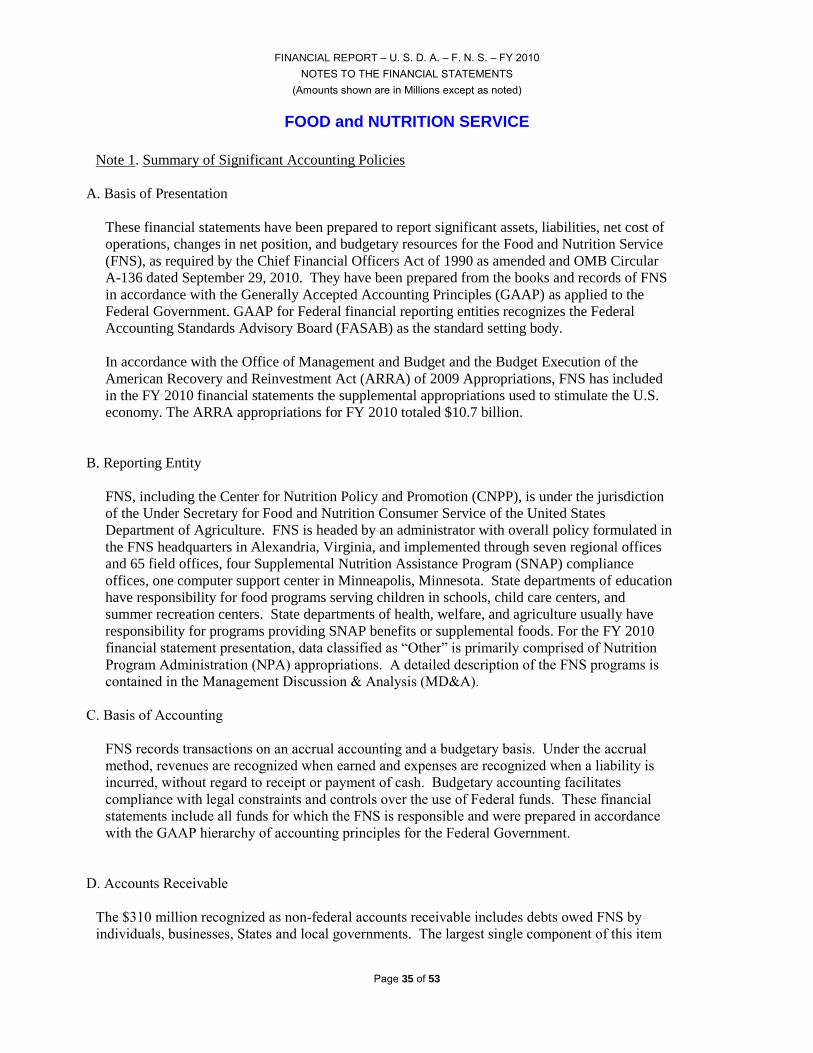
FINANCIAL REPORT – U. S. D. A. – F. N. S. – FY 2010 NOTES TO THE FINANCIAL STATEMENTS
(Amounts shown are in Millions except as noted)
FOOD and NUTRITION SERVICE
Note 1
Page 35 of 53
. Summary of Significant Accounting Policies
A. Basis of Presentation
These financial statements have been prepared to report significant assets, liabilities, net cost of operations, changes in net position, and budgetary resources for the Food and Nutrition Service (FNS), as required by the Chief Financial Officers Act of 1990 as amended and OMB Circular A-136 dated September 29, 2010. They have been prepared from the books and records of FNS in accordance with the Generally Accepted Accounting Principles (GAAP) as applied to the Federal Government. GAAP for Federal financial reporting entities recognizes the Federal Accounting Standards Advisory Board (FASAB) as the standard setting body.
In accordance with the Office of Management and Budget and the Budget Execution of the American Recovery and Reinvestment Act (ARRA) of 2009 Appropriations, FNS has included in the FY 2010 financial statements the supplemental appropriations used to stimulate the U.S. economy. The ARRA appropriations for FY 2010 totaled $10.7 billion.
B. Reporting Entity
FNS, including the Center for Nutrition Policy and Promotion (CNPP), is under the jurisdiction of the Under Secretary for Food and Nutrition Consumer Service of the United States Department of Agriculture. FNS is headed by an administrator with overall policy formulated in the FNS headquarters in Alexandria, Virginia, and implemented through seven regional offices and 65 field offices, four Supplemental Nutrition Assistance Program (SNAP) compliance offices, one computer support center in Minneapolis, Minnesota. State departments of education have responsibility for food programs serving children in schools, child care centers, and summer recreation centers. State departments of health, welfare, and agriculture usually have responsibility for programs providing SNAP benefits or supplemental foods. For the FY 2010 financial statement presentation, data classified as “Other” is primarily comprised of Nutrition
Program Administration (NPA) appropriations. A detailed description of the FNS programs is
contained in the Management Discussion & Analysis (MD&A).
C. Basis of Accounting
FNS records transactions on an accrual accounting and a budgetary basis. Under the accrual
method, revenues are recognized when earned and expenses are recognized when a liability is
incurred, without regard to receipt or payment of cash. Budgetary accounting facilitates
compliance with legal constraints and controls over the use of Federal funds. These financial
statements include all funds for which the FNS is responsible and were prepared in accordance
with the GAAP hierarchy of accounting principles for the Federal Government.
D. Accounts Receivable
The $310 million recognized as non-federal accounts receivable includes debts owed FNS by
individuals, businesses, States and local governments. The largest single component of this item

FINANCIAL REPORT – U. S. D. A. – F. N. S. – FY 2010 NOTES TO THE FINANCIAL STATEMENTS
(Amounts shown are in Millions except as noted)
consists of SNAP recipient claims. States establish claims against households to recover over issued food stamp benefits. States are responsible for pursuing collection of such claims. Collections, less an authorized State retention amount, are remitted to FNS. The portion of total net realizable receivables consisting of SNAP recipient claims is the expected amount of such remittance from States. The data generated by the State systems of gross account receivables has been determined to be unreliable. Accordingly, FNS does not know what the State gross account receivable is. FNS have an alternative method for acquiring reliable State receivable information.
FNS estimates net realizable SNAP accounts receivable through a regression-based statistical model. This model estimates future collections by the States, which the States will remit to the Federal Government as of the end of the accounting period based on the actual SNAP issuance and net claims collections for prior years. The forecasting model draws its predictive power from the strong historical relationship between the level of SNAP benefit issuance and the level of recipient claims collections by States. Applying the model to actual data covering the periods FY 1984 through FY 2010, the model explains 96 percent of the variation in claims collections. Historically, collections projected by the model have proved to be accurate within approximately 4 percent of actual net collections. Because the expected cash flow from collections of such claims beyond one year is not expected to be material, FNS does not estimate collections after the initial year or discount the estimate produced by the statistical model to its present value.
The SNAP has a system for monitoring and controlling program issuance called the Quality Control (QC) system. It is an ongoing, comprehensive monitoring system required by the SNAP Act to promote program integrity. A statistically valid sample of cases, consisting of active cases and “negative case actions” (terminations and denials of benefits), is chosen each month. State
officials review the sampled case records to measure and verify the accuracy of eligibility and
benefits determinations, made by State eligibility workers, against Program standards for the
month under review. QC errors detected through the review process include both under issuance
and over issuance to eligible households and issuance to households that are not eligible for
benefits.
Because reliable data is not available addressing gross FNS accounts receivable, the SNAP QC
estimate of SNAP benefits over issued nationwide provide the best statistically valid estimate of
invalid program payments. Fiscal Year 2009 QC error rates were announced in June 2010. Using
this methodology, FNS estimates the value of benefit over issuance in Fiscal Year 2009 (the most
recent year for which data are available) at $1.780 billion. Statement of Federal Financial
Accounting Standards (SFFAS) #1 permits Federal entities to estimate its accounts receivable.
The QC error rate over issuance estimate is considered the best estimate available. However,
since this is an estimate of all SNAP overpayments, the actual State gross account receivable
amount would be lower but the variance cannot be quantified. The amount of over issued benefits
is included in the total program cost of the SNAP as reflected in the Statement of Net Cost.
Page 36 of 53
FNS does not receive information to calculate States’ QC liabilities for approximately 7 months after the
end of the fiscal year; therefore, current information is not available for the FY 2010 financial statements.
For FY 2009, four States were assessed amounts for having excessive error rates for two consecutive
years. The aggregate total of the liability was $6 million. The four States signed payment agreements in
lieu of immediately repaying in cash. The agreements called for each State to invest 50 percent of its
liability in program improvement activities. The remaining 50 percent of the liability was placed at risk
pending future improved performance.

FINANCIAL REPORT – U. S. D. A. – F. N. S. – FY 2010 NOTES TO THE FINANCIAL STATEMENTS
(Amounts shown are in Millions except as noted)
Page 37 of 53
The QC over Issuance error rate data for the past 3 years follows:
Fiscal Year Rate Amount Total $ (Billions) 2009 3.53 % $ 1.780 2008 4.01 % $ 1.387 2007 4.58 % $ 1.392
E. Grants and Program Benefits
FNS records grant obligations based on the grant awards and SNAP benefits based on the issuance of benefits to AMA. Funds for FNS grant programs and SNAP electronic benefits transfer (EBT) benefits are provided to States through a Letter of Credit process. This process allows the grantees or the EBT processor to draw on established credit balances, as needed, to pay expenses associated with their grants or SNAP EBT transactions at retailers. This allows the U. S. Treasury to hold funds until the actually grantees need the funds to pay program expenses or until the SNAP EBT benefits are actually used. Expenses are recognized and obligations liquidated as grantees or EBT processors drawdown on the Letter of Credit.
F. Annual, Sick, and Other Leave
Annual leave is accrued as it is earned and the accrual is reduced as leave is taken. Each year, the balance in the accrued annual leave account is adjusted to reflect current pay rates. To the extent that current or prior year appropriations are not available to fund annual leave earned but not taken, funding will be obtained from current or future financing sources. Sick leave and other types of non-vested leave are expensed as taken.
G. Retirement Plan
FNS employees participate in both the Civil Service Retirement System (CSRS) and the Federal Employees Retirement System (FERS). FNS makes matching contributions to the CSRS total plan equal to 8.5 percent of pay, while contributions to the FERS total plan are 10.7 percent of pay. For most employees hired since December 31, 1983, FNS also contributes the employer's matching share for Social Security. FERS went into effect pursuant to Public Law 99-335 on January 1, 1987. Most employees hired after December 31, 1983, are automatically covered by FERS and Social Security. A primary feature of FERS is that it offers a savings plan to which FNS automatically contributes 1 percent of pay and matches any employee contribution up to an additional 4 percent of pay. FNS makes these and other contributions to employee retirement plans as shown in the following table:

FINANCIAL REPORT – U. S. D. A. – F. N. S. – FY 2010 NOTES TO THE FINANCIAL STATEMENTS
(Amounts shown are in Millions except as noted)
Page 38 of 53
These contributions are reported as expenses in the Statement of Net Cost. FNS does not report CSRS and FERS assets, accumulated plan benefits, or unfunded liabilities, if any, applicable to its employees. Reporting such amounts is the responsibility of the Office of Personnel Management's Federal Retirement System.
Statement of Federal Financial Accounting Standards No. 5, Accounting for Liabilities of the Federal Government, requires Federal entities to recognize an expense for pensions and other retirement benefits at the time the employee’s services are rendered. The purpose of recognizing this expense is to record and
report the full cost of each entity’s operation. Corresponding revenue, Imputed Financing Sources, is
recognized to the extent pension and other retirement benefit expenses exceed the amount paid to the
Office of Personnel Management (OPM).
H. Recognition of Financing Sources and Appropriations Used
FNS receives the majority of the funding it needs to support its programs through annual and
multi-year appropriations. FNS recognizes appropriations as used at the time that program or
administrative expenses are delivered and recognized. FNS recognizes appropriations expended
for capitalized property or equipment as expenses when the assets are consumed in operations.
Appropriations used are the amount of appropriations expended during the current period to fund
FNS’ nutrition programs. This includes the NPA appropriation, which provides funds for salaries
and administrative expenses.
At the time grant awards are made, FNS records obligations for the full amount of expected
expenses as unexpended obligations-unpaid (undelivered orders). Reductions in unexpended
obligations occur as expenses are incurred by grantees. At year-end, grant obligations are accrued
and reflected on the financial statements as accounts payable. At grant closeout, the unused
portions of grant awards are deobligated; increasing the unobligated balances and is shown on the
balance sheet as part of unexpended appropriations. Unobligated balances available for future
periods are also shown as unexpended appropriations.
I. Fund Balance with Treasury Accounts
The Fund Balance with Treasury represents the aggregate amount of funds in the FNS accounts with
Treasury for which the agency is authorized to make expenditures and pay liabilities. The FNS Fund
Balance with Treasury is primarily appropriated funds.
J. Direct versus Reimbursable Obligations Incurred

FINANCIAL REPORT – U. S. D. A. – F. N. S. – FY 2010 NOTES TO THE FINANCIAL STATEMENTS
(Amounts shown are in Millions except as noted)
Page 39 of 53
As of FY 2010, FNS’ direct and reimbursable obligations incurred are represented as amounts
apportioned under category A and B. The amounts apportioned by Fiscal Quarter consist of FNS’
category A obligations and the amounts apportioned for Special Activities consist of category B
obligations as reported on the agency’s year-end SF133s, Report on Budget Execution and Budgetary
Resources, and lines 8a and 8b of the Statement of Budgetary Resources.
Note 2. Non-Entity Assets
FNS’ Non-Entity Assets related to Accounts Receivable consists of FNS’ Miscellaneous Receipts,
Interest, Fines & Penalties, and Miscellaneous Receipts for Cancelled Years.

FINANCIAL REPORT – U. S. D. A. – F. N. S. – FY 2010 NOTES TO THE FINANCIAL STATEMENTS
(Amounts shown are in Millions except as noted)
Page 40 of 53
Note 3. Fund Balance with Treasury
Note 4. Accounts Receivable, Net
FY 2010 Gross Accounts Receivable
Allowance for Uncollectible Accounts
Accounts Receivable, Net
Intragovernmental $ - $ - $ - With the Public $ 314 $ 3 $ 310 Total $ 314 $ 3 $ 310
FY 2009 Gross Accounts Receivable
Allowance for Uncollectible Accounts
Accounts Receivable, Net
Intragovernmental $ - $ - $ - With the Public $ 327 $ 3 $ 324 Total $ 327 $ 3 $ 324
(1) See Note 1.D. for further explanation of FNS’ accounts receivable activity with the public.

FINANCIAL REPORT – U. S. D. A. – F. N. S. – FY 2010 NOTES TO THE FINANCIAL STATEMENTS
(Amounts shown are in Millions except as noted)
Page 41 of 53
Note 5. General Property, Plant and Equipment
Property and equipment are depreciated over their useful economic lives, which average 5-10 years, using the straight-line method. For FY 2010 FNS’ capitalization threshold for property
and equipment is $25 thousand. FNS’ capitalization threshold for internal-use software is $100
thousand. FNS owns no buildings or land. FNS follows recognition and measurement criteria in
SFFAS No. 6 as amended by SFFAS No. 11 and 23, and USDA Departmental Regulation 2200-
002, dated December 24, 2003. At year end, balances for Property, Plant, and Equipment were as
follows:

FINANCIAL REPORT – U. S. D. A. – F. N. S. – FY 2010 NOTES TO THE FINANCIAL STATEMENTS
(Amounts shown are in Millions except as noted)
Page 42 of 53
Note 6. Other Assets
FNS’ “Intragovernmental-Other Assets” consist of Advances to Farm Service Agency/Commodity Credit
Corporation for the purchase of commodities.

FINANCIAL REPORT – U. S. D. A. – F. N. S. – FY 2010 NOTES TO THE FINANCIAL STATEMENTS
(Amounts shown are in Millions except as noted)
Page 43 of 53
Note 7. Liabilities Not Covered by Budgetary Resources
FNS’ “Intragovernmental-Other Liabilities” consist of Unfunded FECA Liability. FNS’ “With
the Public-Other Liabilities” consist of Custodial Liability and Unfunded Leave.

FINANCIAL REPORT – U. S. D. A. – F. N. S. – FY 2010 NOTES TO THE FINANCIAL STATEMENTS
(Amounts shown are in Millions except as noted)
Note 8. Other Liabilities
Page 44 of 53

FINANCIAL REPORT – U. S. D. A. – F. N. S. – FY 2010 NOTES TO THE FINANCIAL STATEMENTS
(Amounts shown are in Millions except as noted)
Page 45 of 53

FINANCIAL REPORT – U. S. D. A. – F. N. S. – FY 2010 NOTES TO THE FINANCIAL STATEMENTS
(Amounts shown are in Millions except as noted)
Page 46 of 53
Note 9. Leases
Entity as Leasee:
Operating Lease (amounts shown are in thousands):
Description of Lease Arrangements: FNS’ holds one operating lease that includes office space leased from
May 1, 2009 through April 30, 2019. The cost of the lease is $612 per year until May 1, 2014. From May 1, 2014,
through April 30, 2019; the office space annual rent is reduced to $393 per year. The lease may be renewed at the option
of the Government for one 5 year term with the Government having the right to terminate, in whole or in part, at anytime,
by giving at least 120 days notice in writing to the Lessor.
Future Payments Due:
Asset Category
Fiscal Year Office Space
Year 2 $ 357
Year 3 $ 612
Year 4 $ 612
Year 5 $ 612
After 5 years $1,965
Total future lease payments $4,158

FINANCIAL REPORT – U. S. D. A. – F. N. S. – FY 2010 NOTES TO THE FINANCIAL STATEMENTS
(Amounts shown are in Millions except as noted)
Note 10. Intragovernmental Cost and Exchange Revenue
Page 47 of 53

FINANCIAL REPORT – U. S. D. A. – F. N. S. – FY 2010 NOTES TO THE FINANCIAL STATEMENTS
(Amounts shown are in Millions except as noted)
Page 48 of 53
FNS’ intragovernmental costs are exchange transactions made between FNS and another entity within the Federal
government. FNS cost with the public are exchange transactions made between FNS and a non-Federal entity. FNS’
intragovernmental exchange revenues are exchange transactions made between FNS and another entity within the Federal
government. FNS exchange revenues with the public are exchange transactions made between FNS and a non-Federal
entity.
Note 11. Program Costs By Segment

FINANCIAL REPORT – U. S. D. A. – F. N. S. – FY 2010 NOTES TO THE FINANCIAL STATEMENTS
(Amounts shown are in Millions except as noted)
Note 12. Exchange Revenues
Page 49 of 53
FNS’ earned revenue from nonfederal parties consists largely of the $50 from the state option
Supplemental Nutrition Assistance Program.
On June 12, 1997, the President signed into law the Supplemental Appropriations Act, Public Law 105-
18. This law authorized the state option Supplemental Nutrition Assistance Program. In this program,
States issue SNAP benefits through the Federal government for use in a State-funded food assistance
program for legal immigrants, and childless, able-bodied adults ineligible for the Supplemental Nutrition
Assistance Program.
States operating a state option Supplemental Nutrition Assistance Program utilize FNS’ SNAP
infrastructure. That is, they utilized electronic benefits transfer (EBT) issued benefits from FNS which
are transacted at FNS authorized SNAP retailers. These benefits are subsequently redeemed through the
Federal Reserve Banking (FRB) system.
Prior to issuance, States are required to remit payment to FNS for the amount of the benefits issued as
well as reimburse FNS for the costs of redeeming benefits. During fiscal year 2010, 3 States participated
in this program, which generated earned revenues of $50.
Note 13. Apportionment Categories of Obligations Incurred: Direct vs. Reimbursable Obligations
Note 14.Explanation of Differences between the Statement of Budgetary Resources and the Budget of the United
States Government
Differences exist between FNS’ FY 2009 Statement of Budgetary Resources (SBR) (as provided to the
Department for consolidation purposes) and the FY 2009 actual numbers presented in the FY 2011
Budget of the United State Government (Budget). These differences are summarized below:
Description Budgetary Resources Outlays 2009 SBR $ 94,967 $77,844
Less: Expired Accounts not
Included in Budget $9,259 $0
Add: Parent Child
Relationship (NIFA) $10 $3
Add: Differences due to
Rounding $1 $1
Budget of the U.S.
Government $85,719 $77,848

FINANCIAL REPORT – U. S. D. A. – F. N. S. – FY 2010 NOTES TO THE FINANCIAL STATEMENTS
(Amounts shown are in Millions except as noted)
The actual numbers for the FY President’s Budget have not yet been published as of FNS’ FY 2010
financial statements, and it is expected that the actual numbers will be published in February of the
following fiscal year and will be available on the website at www.whitehouse.gov.
Note 15. Undelivered Orders at the end of the Period
Page 50 of 53
Budgetary resources obligated for undelivered orders as of September 30, 2010 and 2009 was $1.4 billion and $1.2
billion, respectively.
Note 16. Incidental Custodial Collections
FNS’ FY 2010 custodial activity represents all accounts receivable activity related to cancel year
appropriations for interest, fines & penalties assessed and collected. For example; civil money penalties,
interest, retailer and wholesaler fines and penalties. (See Note 1D., “Accounts Receivable”, for further
disclosures on FNS’ collection activities). FNS transfers these types of collections to the Department of
Treasury. FNS’ custodial collection activities are considered immaterial and incidental to the mission of
FNS.

FINANCIAL REPORT – U. S. D. A. – F. N. S. – FY 2010 NOTES TO THE FINANCIAL STATEMENTS
(Amounts shown are in Millions except as noted)
Note 17. Reconciliation of Net Cost of Operations (proprietary) to Budget (formerly the Statement of
Page 51 of 53
Financing)
Resources Used to Finance Activities: FY 2010 FY2009
Budgetary Resources Obligated
Obligations Incurred $ 95,866 $ 79,495 Less: Spending authority from offsetting collections and recoveries 1,118 591 ------------ ----------- Obligations net of offsetting collections and recoveries 94,748 78,904 Less: Distributed Offsetting Receipts - - ------------ ----------- Net Obligations 94,748 78,904 ------------ ----------- Other Resources Donations and forfeitures of property - - Transfers in (out) without reimbursement - - Imputed financing from costs absorbed by others 1,050 1,029 Other - - ------------ -----------Net other resources used to finance activities 1,050 1,029
FY 2010 FY 2009
Total resources used to finance activities 95,798 79,933
Resources Used to Finance Items not Part of the Net Cost of Operations: Change in budgetary resources obligated for goods, services and benefits ordered but not yet provided (278) (483) Resources that fund expenses recognized in prior periods - (1) Budgetary offsetting collections and receipts that do not
affect net cost of operations Credit Program collections which increases liabilities for loan guarantees or allowances for subsidy - - Change in Unfilled Customer Orders - - Decrease in exchange revenue receivable from the public - - Other - -
Resources that finance the acquisition of assets - (1) Other resources or adjustments to net obligated resources that
do not affect net cost of operations - - ----------- ------------
Total resources used to finance items not part of the net cost of operations (278) (485)
----------- ------------
Total resources used to finance the net cost of operations 95,520 79,448 Components of the Net Cost of Operations that will not require or

FINANCIAL REPORT – U. S. D. A. – F. N. S. – FY 2010 NOTES TO THE FINANCIAL STATEMENTS
(Amounts shown are in Millions except as noted)
Generate Resources in the Current Period: Components Requiring or Generating Resources in Future Periods:
Increase in annual leave liability 1 1 Increase in environmental and disposal liability - - Upward/Downward re-estimates of credit subsidy expense - - Increase in exchange revenue receivable from the public - - Other 16 (67) ---------- ----------- Total components of Net Cost of Operations that will require or
generate resources in future periods 17 (66) Components not Requiring or Generating Resources:
Depreciation and amortization 2 6 Revaluation of assets or liabilities - - Other Components not Requiring or Generating Resources: Bad Debt Expense - - Cost of Goods Sold - - Other - - ----------- ---------- Total components of Net Cost of Operations that will not require
or generate resources 2 6 ----------- ----------
Page 52 of 53
Total components of Net Cost of Operations that will not require
or generate resources in the current period 19 (60) ---------- ----------
Net Cost of Operations $ 95,539 $79,388 ======

FINANCIAL REPORT – U. S. D. A. – F. N. S. – FY 2010 NOTES TO THE FINANCIAL STATEMENTS
(Amounts shown are in Millions except as noted)
FOOD AND NUTRITION SERVICE REQUIRED SUPPLEMENTARY STEWARDHIP INFORMATION
STEWARDSHIP INVESTMENTS (Amounts shown are in millions)
Page 53 of 53
Human Capital
1. A. Supplemental Nutrition Assistance Program (SNAP).
B. Program Expense 2010 2009
1. Employment and Training $63 $19
FNS’ human capital consists of employment and training (E&T) for the Supplemental Nutrition Assistance Program.
The E&T program requires recipients of SNAP benefits to participate in an employment and training program as a
condition to SNAP eligibility.
Outcome data for the E&T program is only available through the third quarter. As of this period, FNS’ E&T
program has placed 812,318 work registrants subject to the 3 - month SNAP participant limit and 1,503,052 work
registrants not subject to the limit in either job-search, job-training, job-workfare, education, or work experience.
Nonfederal Physical Property
1. A. Supplemental Nutrition Assistance Program
B. Program Expense 2010 2009
1. ADP Equipment & Systems $41 $55
FNS’ nonfederal physical property consists of computer systems and other equipment obtained by the State and
local governments for the purpose of administering the Supplemental Nutrition Assistance Program. The total SNAP
Expense for ADP Equipment & Systems has been reported as of the date of FNS’ financial statements.
2. A. Special Supplemental Nutrition Program for Women, Infants and Children (WIC)
B. Program Expense 2010 2009
1. ADP Equipment & Systems $17 $15
FNS’ nonfederal physical property also consists of computer systems and other equipment obtained by the State and
local governments for the purpose of administering the Special Supplemental Nutrition Program for Women, Infants
and Children.