Embed Size (px)
Citation preview

Audit or Valuation of Audit or Valuation of Facilities, Events or Facilities, Events or
ProgramsPrograms
Presented ByDeborah Wilson
Performance Sponsorship Group
www.performancesponsorship.com

SponsorshipSponsorship
Sponsorship can be defined as the exchange of cash or in-kind services for a commercial reward. Corporate sponsorship is most often driven through the marketing department and typically the corporation receives crediting on marketing and advertising materials, hospitality opportunities and on-site sales promotions in exchange for the sponsorship fee. Tax receipts are not offered for corporate sponsorships.
.
Page 2 of 29

PhilanthropyPhilanthropy
Philanthropy can be defined as the exchange of cash or in-kind services for little to no commercial advantage. Within corporations, this type of charitable giving most often originates with corporate affairs, or in larger organizations, with a specific donations department. The corporation receives limited crediting and visibility for its gift but unlike sponsorship, the corporation may receive a tax receipt. Traditionally, Naming Gifts have been made in perpetuity but now some donations are being made over a limited term.
Page 3 of 29
Asset AnalysisAsset AnalysisIdentification of Tangible and Intangible AssetsIdentification of Tangible and Intangible Assets
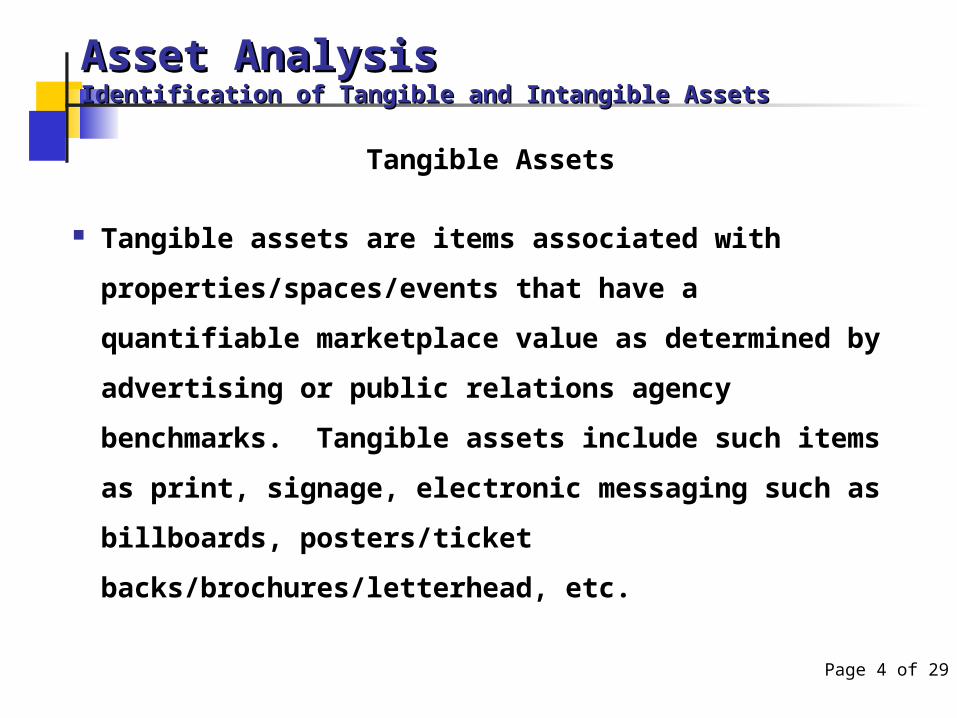
Tangible Assets
Tangible assets are items associated with
properties/spaces/events that have a quantifiable
marketplace value as determined by advertising or
public relations agency benchmarks. Tangible
assets include such items as print, signage,
electronic messaging such as billboards,
posters/ticket backs/brochures/letterhead, etc.
Page 4 of 29

Asset AnalysisAsset AnalysisIdentification of Tangible and Intangible Assets Identification of Tangible and Intangible Assets Continued…..Continued…..
Intangible Assets
Intangible assets are items associated with properties/spaces/events
that have no quantifiable marketplace value. Intangible assets
include items such as prestige of property, geographic reach,
leadership, value of exclusivity, etc. Some advertising agencies will
not accept a value for intangible assets that is any higher than 50% of
the value of the tangible assets. An argument could be made that in
some projects intangible assets outweigh the value of the tangible
assets. Typically, valuation criteria is determined, a subjective
judgment occurs grading that criteria relative to the established
criteria, the criteria is weighted within the industry classification, and
a total value is assigned to be used as a percentage of the tangible
asset total. Page 5 of 29
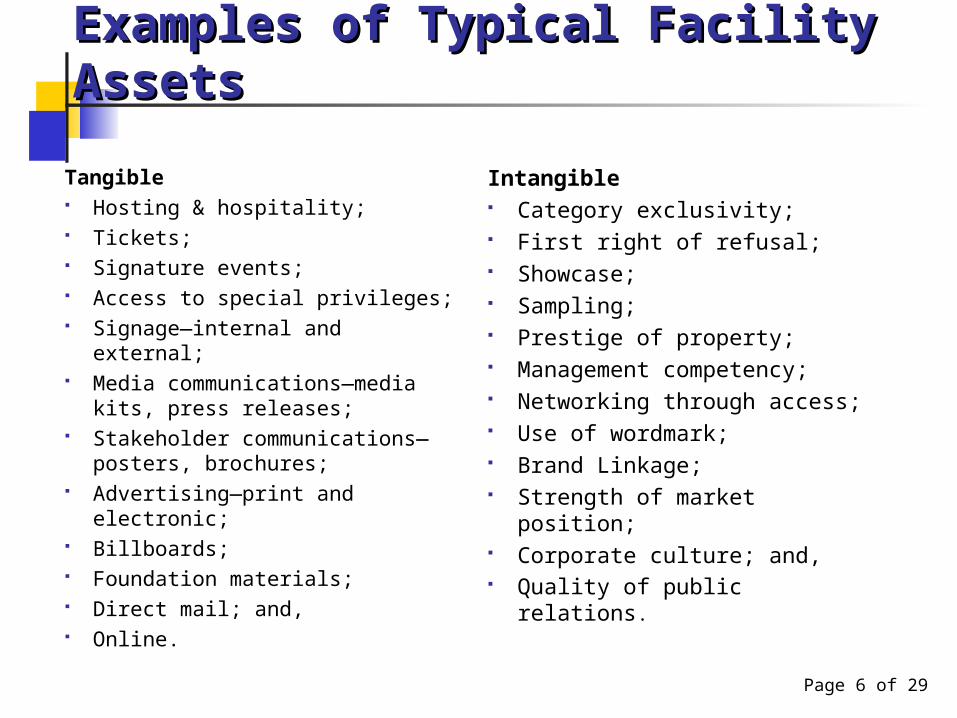
Examples of Typical Facility Examples of Typical Facility AssetsAssets
Tangible Hosting & hospitality; Tickets; Signature events; Access to special privileges; Signage—internal and external; Media communications—media
kits, press releases; Stakeholder communications—
posters, brochures; Advertising—print and electronic; Billboards; Foundation materials; Direct mail; and, Online.
Intangible Category exclusivity; First right of refusal; Showcase; Sampling; Prestige of property; Management competency; Networking through access; Use of wordmark; Brand Linkage; Strength of market position; Corporate culture; and, Quality of public relations.
Page 6 of 29

Return on InvestmentReturn on Investment
In Canada, it is common to offer a return on investment for Naming
Rights of facilities in the range of 3:1 - 5:1 or for every $1 spent in
sponsorship, the sponsor receives the value of $3 or $5 in return.
Events and activities generally have an ROI of 2:1.
This ROI prevents sponsors from ‘cherry picking’ through a proposal,
discarding benefits that are of little to no interest to
the corporate agenda and thus decreasing the asking price.
Page 7 of 29
Case StudyCase Study
Woolwich Dairy Golf Classic
Event Owner: Family Transition Place (FTP), a not-for-profit organization which assists women and children who are suffering from abuse.
Page 8 of 29

Event Background
The Family Transition Golf Classic has been held for 3 years at a variety of sites in Dufferin County. The event has traditionally been operated at approximately 80% participation rates. Included in the event is an 18-hole shotgun golf tournament, a boxed lunch, a dinner following the golf and a silent auction.
The annual net profit from the event is approximately $15,000 - $20,000 annually.
The event is operated by 6 staff and 20 volunteers with the staff running the golf event and the volunteers helping with the golf event and running the silent auction.
In order to increase revenue, FTP wanted to attract a sponsorship agency or sponsorship individual to assist the organization with securing event sponsorship. PSG provided pro bono services to FTP for a three year period.
Page 9 of 29

PSG Sponsorship Goal, Strategy and Tactics PSG arbitrarily established an annual net profit target of $50,000 for
Year 1, $60,000 for Year 2 and $80,000 for Year 3
Strategy to achieve the sponsorship goal:
1) sell Title rights to the event;
2) develop a number of ancillary activities/events that could be titled or packaged and sold to corporate sponsors;
3) secure media partners for cash and services if possible but for services only if cash is not possible; and,
4) secure media partners prior to auditing and packaging the event.
Page 10 of 29

Tactics Develop additional activities and events that could be sold.
Develop a rate card that illustrates the valuation of assets.
Develop a full event audit that justifies the sponsorship fee, based upon a solid return on investment (ROI).
Review participant list from previous events in order to help create a new prospect list.
Involve Board members in the creation of a prospect list.
Sell all sponsorships for a three-year term based upon performance criteria of full participation, achieving net profit goal, and survey analysis to illustrate sponsor name retention.
Page 11 of 29
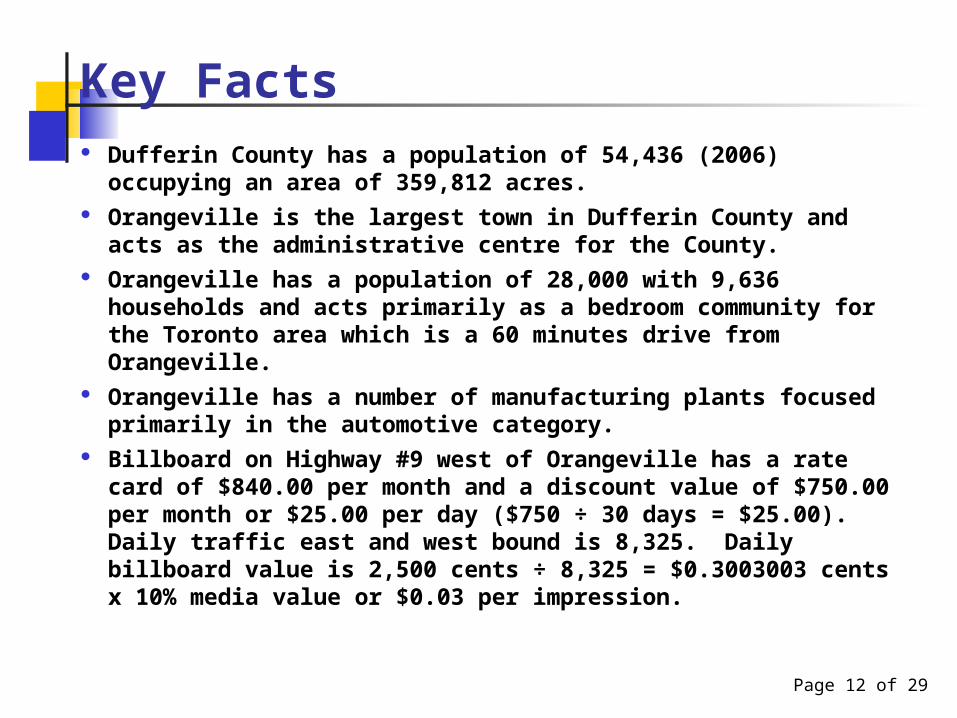
Key Facts Dufferin County has a population of 54,436 (2006) occupying an area
of 359,812 acres. Orangeville is the largest town in Dufferin County and acts as the
administrative centre for the County. Orangeville has a population of 28,000 with 9,636 households and
acts primarily as a bedroom community for the Toronto area which is a 60 minutes drive from Orangeville.
Orangeville has a number of manufacturing plants focused primarily in the automotive category.
Billboard on Highway #9 west of Orangeville has a rate card of $840.00 per month and a discount value of $750.00 per month or $25.00 per day ($750 ÷ 30 days = $25.00). Daily traffic east and west bound is 8,325. Daily billboard value is 2,500 cents ÷ 8,325 = $0.3003003 cents x 10% media value or $0.03 per impression.
Page 12 of 29
Key Facts Continued…..FTP
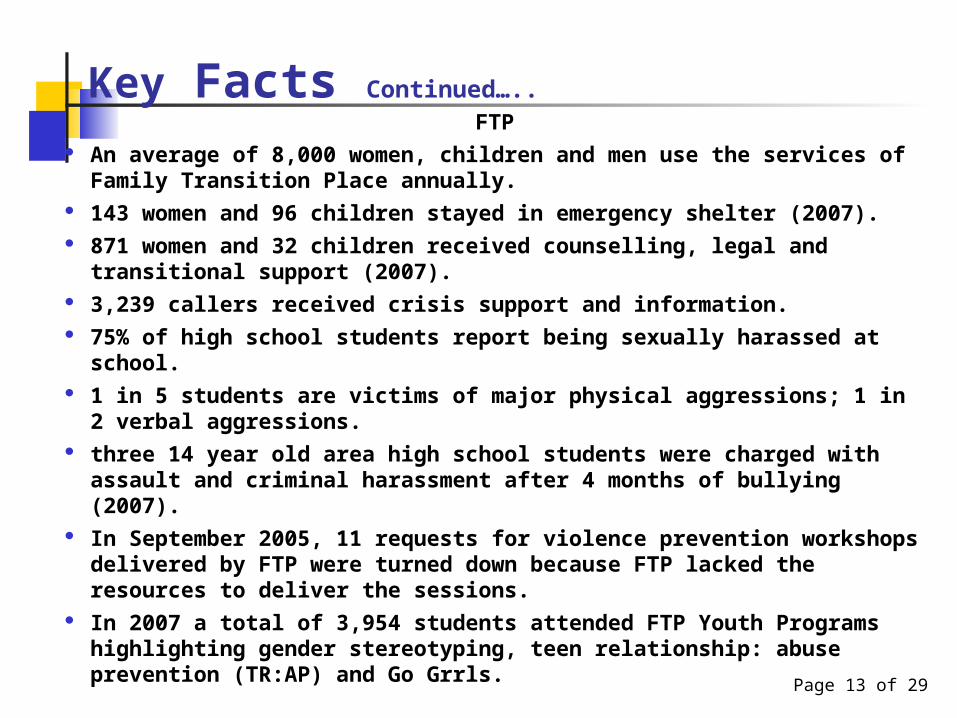
An average of 8,000 women, children and men use the services of Family Transition Place annually.
143 women and 96 children stayed in emergency shelter (2007). 871 women and 32 children received counselling, legal and transitional
support (2007). 3,239 callers received crisis support and information. 75% of high school students report being sexually harassed at school. 1 in 5 students are victims of major physical aggressions; 1 in 2 verbal
aggressions. three 14 year old area high school students were charged with assault
and criminal harassment after 4 months of bullying (2007). In September 2005, 11 requests for violence prevention workshops
delivered by FTP were turned down because FTP lacked the resources to deliver the sessions.
In 2007 a total of 3,954 students attended FTP Youth Programs highlighting gender stereotyping, teen relationship: abuse prevention (TR:AP) and Go Grrls. Page 13 of 29

Audit of AssetsAsset Asset
Description
Number of Impressions
Unit Value
% of Audience
Total Value
roadway signage (vehicular and pedestrian)
pixel board sign at 1st St. and Broadway – duration 4 weeks
6,000 daily x 7 days x 4 weeks = 168,000
$0.03 25% 1,260.00
Temporary banner (vehicular)
On-building banner 10’ x 3’ – duration 8 weeks
800 daily x 7 days x 8 weeks = 44,800
$0.03 20% 268.80
Town hall backlit sign (vehicular and pedestrian)
Rotating sign at Town Hall – 2 hours daily for 21 days (veh 300/hr, ped 150/hr)
Vehicular = 600 Pedestrian = 300Total of 900 daily
$0.03 Average of 40% 226.80
Golf course sign Pixel board sign 5’ x 5’ – 2 weeks prior to event – hwy #124
12,000 daily x 14 days for total of 168,000 impressions
$0.03 25% 1,260.00
On-site signage 10 signs around course (1 week prior)
1,000 daily x 7 days x 10 signs = 70,000
$0.03 75% 1,575.00
Web site Home page and email blast to donors, event participants, media
Hits 30,000 (6 months), email blast total of 3,000
$0.02 20% for web = $120.00, 80% for email blast = $48.00
168.00Page 14 of 29
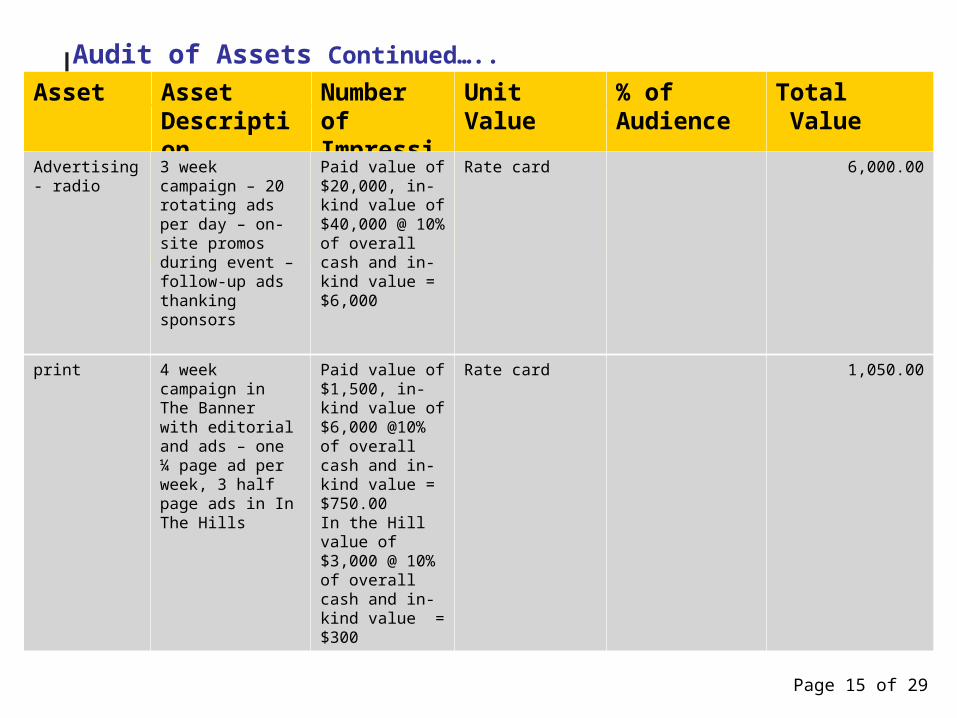
Audit of Assets Continued….. Asset Asset
Description
Number of Impressions
Unit Value
% of Audience
Total Value
Page 15 of 29
Advertising - radio
3 week campaign – 20 rotating ads per day – on-site promos during event – follow-up ads thanking sponsors
Paid value of $20,000, in-kind value of $40,000 @ 10% of overall cash and in-kind value = $6,000
Rate card 6,000.00
print 4 week campaign in The Banner with editorial and ads – one ¼ page ad per week, 3 half page ads in In The Hills
Paid value of $1,500, in-kind value of $6,000 @10% of overall cash and in-kind value = $750.00In the Hill value of $3,000 @ 10% of overall cash and in-kind value = $300
Rate card 1,050.00

Audit of Assets Continued…..Asset Asset
Description
Number of Impressions
Unit Value
% of Audience
Total Value
Street flags/banners
4 week campaign with 30 flags/banners in Orangeville
10 ,000 vehicles/pedestrian per day x 7 days x 4 weeks = 280,000
$0.03 60% 5,040.00
3rd party Sponsor tagged advertising
Assume value of $30,000 @ 10% of value = $3,000
3,000.00
newsletter Distribution to donors, sponsors, media, government, schools, health care clinics, hospitals, police, lawyers,
4 annually for total of 40,000
$0.02 20% 160.00
Page 16 of 29

Audit of Assets Continued…..
Asset Asset Description
Number of Impressions
Unit Value
% of Audience
Total Value
brochure School brochure 1,000 $0.03 30% 9.00
poster Event poster distributed throughout Orangeville, Mono, Bellfountain, Grand Valley, Bolton, Caledon, 4 wks prior
200 posters x 4 weeks x 2,000 /wk = 1,600,000
$0.01 20% 3,200.00
press conference
To be held at Town Hall
Intangible value
press kit Intangible value
Page 17 of 29

Audit of Assets Continued…..
Asset Asset Description
Number of Impressions
Unit Value
% of Audience
Total Value
press releases Intangible value
hats/t-shirts/bags Hats and logoed golf balls
Total of 600 items
$0.02 80% 9.60
VIP services Valet parking, bag pickup, sleeve of balls
144 participants $2.00 90% 259.20
Total Tangible Assets
23,486.40
Page 18 of 29

Intangible Assets Criteria Score (1-10, 1 is low) Weighting Total Rights and Privileges 3 20 601. Use of logo/wordmark2. Category exclusivity3. Product display Brand Linkage 4 10 401. Leading edge, prestige of property Quality of Experience 5 35 1751. Signage, advertising, access to database2. Hospitality, ID in media buy Strength of Market Position 8 20 1601. Leadership, efficiency2. Level of customer satisfaction3. Service failure rates Community Involvement 8 15 1201. Ability to attract users, retain staff Total 28 100 555
Page 19 of 29

Summary Intangible assets are graded on the following scale1. Totals of 750 + receive a score of 50%2. Totals of 600 – 750 receive a score of 40%3. Totals of 500 – 600 receive a score of 30%
Value of Tangible Assets $23,486.40 Value of Intangible Assets 40% of $23,486.40 $ 9,394.56 Total Value of Tangible & Intangible Assets
$32,880.96
ROI of 2:1 demonstrates a fee of $16,440.48 Recommended Title Rights Fee $20,000.00
Page 20 of 29
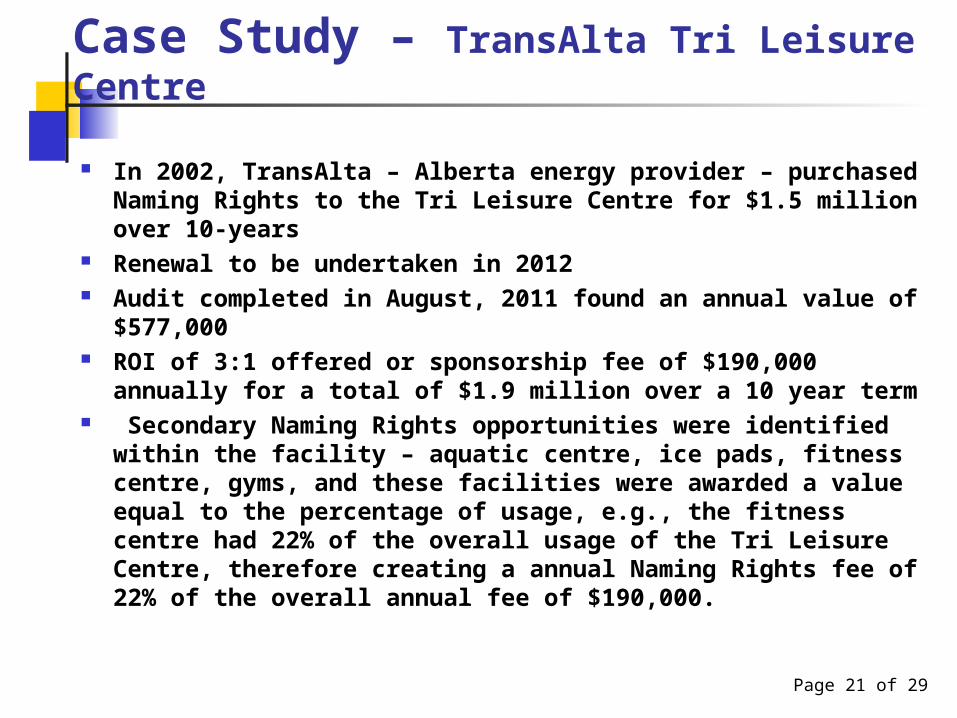
Case Study – TransAlta Tri Leisure Centre
In 2002, TransAlta – Alberta energy provider – purchased Naming Rights to the Tri Leisure Centre for $1.5 million over 10-years
Renewal to be undertaken in 2012 Audit completed in August, 2011 found an annual value of $577,000 ROI of 3:1 offered or sponsorship fee of $190,000 annually for a total of
$1.9 million over a 10 year term Secondary Naming Rights opportunities were identified within the
facility – aquatic centre, ice pads, fitness centre, gyms, and these facilities were awarded a value equal to the percentage of usage, e.g., the fitness centre had 22% of the overall usage of the Tri Leisure Centre, therefore creating a annual Naming Rights fee of 22% of the overall annual fee of $190,000.
Page 21 of 29

Summary of Naming Rights Values
Signage – external $227,774.15
Signage – internal $167,841.07
Communications Material $ 5,945.65
Advertising $ 6,500.00
Special Events/Third Party $ 4,596.00
Total Tangible Assets $412,656.87
Total Intangible Assets @ 40% of Tangible Assets $165,062.75
Total Naming Rights Value $577,719.62
Return on Investment of 3:1 $192,573.21
Recommended Total Annual Naming Rights Fee $190,000.00
Page 22 of 29

Asset Asset Description
# of Impressions
Cost per Impression
% of Audience
Total Value
Traffic Vehicular – northbound
3,876,300 $0.02 60% 46,515.60
Vehicular - southbound
3,960,615 $0.02 60% 47,527.38
On-building
7,836,915 $0.02 20% 31,347,66
Traffic – pedestrian
North and south bound
12,500 $0.02 80% 200.00
On-building
12,500 $0.02 80% 200.00
Free-standing
Message board
2,023,143 $0.02 15% 6,069.43
On-vehicle TLC truck 1,000,000 $0.02 10% 2,000.00
On-vehicle Zamboni 515,502 $0.02 30% 3,093.01
Page 23 of 29
Sample Audit – Sample Audit – External Signage External Signage TLCTLC
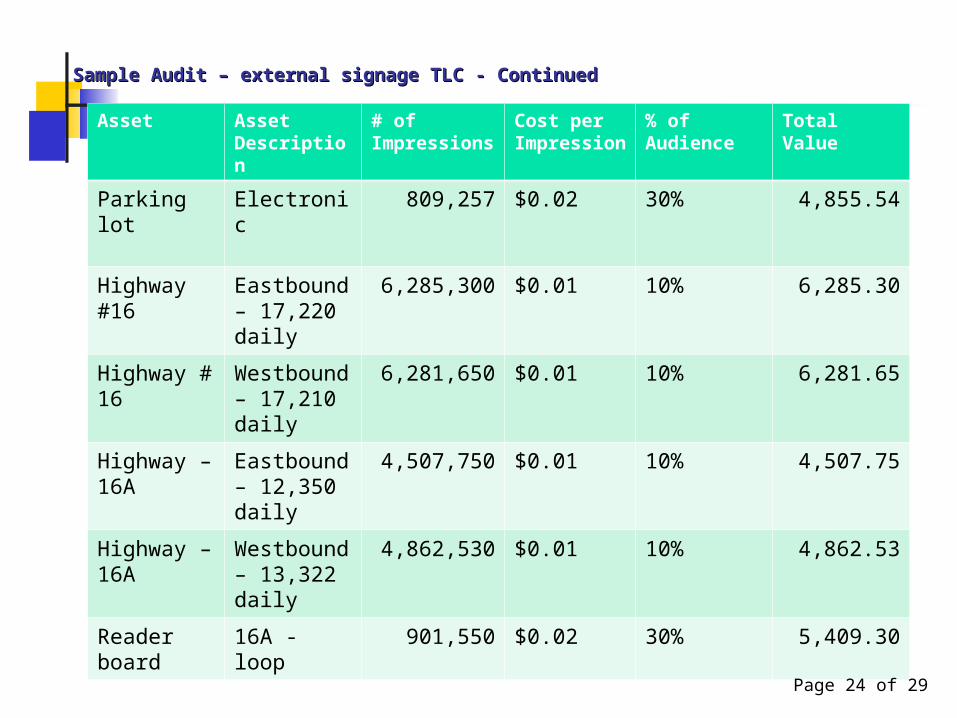
Sample Audit – external signage TLC - ContinuedSample Audit – external signage TLC - Continued
Asset Asset Description
# of Impressions
Cost per Impression
% of Audience
Total Value
Parking lot Electronic 809,257 $0.02 30% 4,855.54
Highway #16
Eastbound – 17,220 daily
6,285,300 $0.01 10% 6,285.30
Highway # 16
Westbound– 17,210 daily
6,281,650 $0.01 10% 6,281.65
Highway – 16A
Eastbound – 12,350 daily
4,507,750 $0.01 10% 4,507.75
Highway – 16A
Westbound– 13,322 daily
4,862,530 $0.01 10% 4,862.53
Reader board
16A - loop 901,550 $0.02 30% 5,409.30
Page 24 of 29

Sample Audit – external signage TLC - ContinuedSample Audit – external signage TLC - Continued
Asset Asset Description
# of Impressions
Cost per Impression
% of Audience
Total Value
Reader board
Zone 3 Acheson
328,500 $0.02 30% 1,971.00
Flags and banners
2,023,143 28,324,002 $0.02 10% 56,648.00
Page 25 of 29
Total $227,774.15

Methodology to Determine Key Methodology to Determine Key ValuesValues
In determining the value of external signage, a ‘typical’ TransAlta Tri Leisure Centre sign has been compared to the Pattison Outdoor signage reduced rate card of $1,400 per billboard (regular cost of $2,800 per month). A per unit cost of $0.02 can be determined - $1,400 reduced rate card rate/30 days or $46.67 per day (4,667 cents per day) divided by 19,420 vehicles per day = $0.24 per day per vehicle with the TLC brand message receiving the standard media equivalency of 10% of the overall value ($0.24 x 10% ) or $0.02 per impressions for brand visibility.
For all advertising, use 10% of the overall media buy as the sponsorship value. For example, if the media buy is $100,000 the value to the sponsor is $10,000 or 10% of the total buy.
Determine which asset is the key component, develop a valuation methodology for that asset and compare all other assets to the key asset. For example, if external signage is the key asset and it’s value is $0.02 per impression, a poster would be $0.01. You don’t have to vary the price per impression too much because you can vary the % of audience seeing that asset.
Page 26 of 29
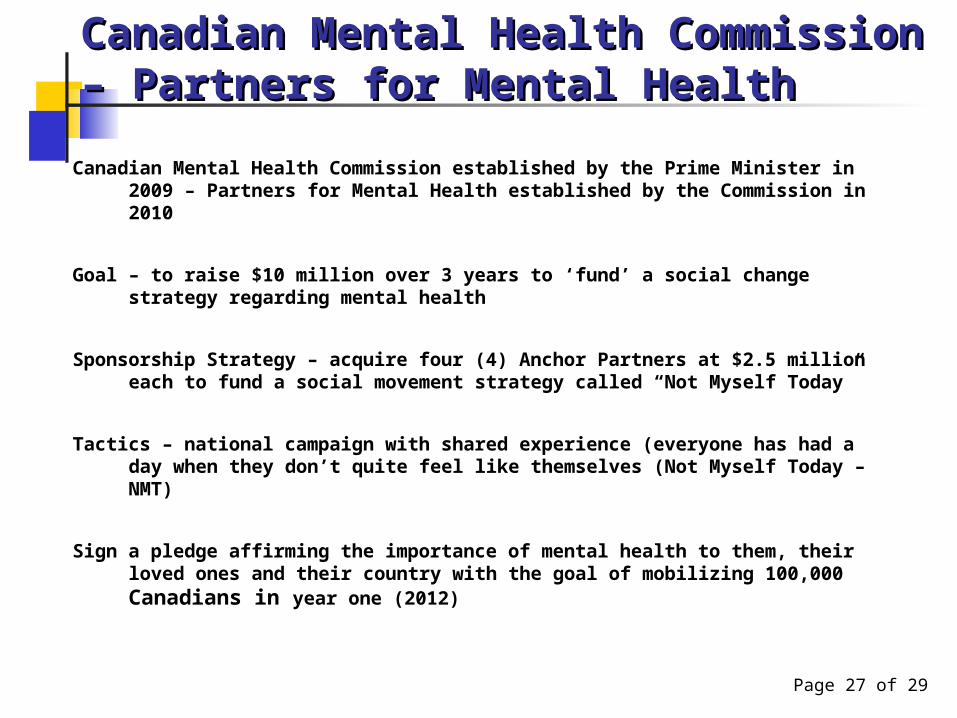
Canadian Mental Health Canadian Mental Health Commission – Partners for Mental Commission – Partners for Mental HealthHealth
Canadian Mental Health Commission established by the Prime Minister in 2009 – Partners for Mental Health established by the Commission in 2010
Goal – to raise $10 million over 3 years to ‘fund’ a social change strategy regarding mental health
Sponsorship Strategy – acquire four (4) Anchor Partners at $2.5 million each to fund a social movement strategy called “Not Myself Today”
Tactics – national campaign with shared experience (everyone has had a day when they don’t quite feel like themselves (Not Myself Today – NMT)
Sign a pledge affirming the importance of mental health to them, their loved ones and their country with the goal of mobilizing 100,000 Canadians in year one (2012)
Page 27 of 29

Day of Action Day of Action to focus on mental health, to acknowledge that dealing
with NMT is dealing with mental health and mental illness, to demonstrate compassion and solidarity for those who know mental illness firsthand, to learn about mental health and mental illness and to create an annual mental health day
Three phases over a six-week timeframe Pre NMT - comprised of advertising, campaign promotions, direct
Marketing/Outreach, mobilizing pledges, make a donation On NMT - workplace and campus events, media events and
programming, legislature events, mobilizing pledges Post NMT – announce results, campaign close communications, deliver
pledge to government tied to national mental health strategy launch
The Anchor Partners will receive: Prominent involvement in the launch campaign of NMT Involvement in a least two (2) high-profile marketing campaigns
each year, including at least one (1) major annual fundraising event of a national scope, at which they will have significant name presence
Continuing presence in all ongoing activities, including customer relationship management, the website and social media
Page 28 of 29

Cost and Benefits Cost: $600,000 annually for 3 years plus in-kind support
through Hockey Night in Canada, CFL and integration into activities and events such as Photography Festival, Nuit Blanche, national junior hockey programs, etc.
Benefits: Paid media (an estimated $750,000 buy each year, expected
to deliver at 2:1, including online, print, direct marketing and other collateral) expected to reach 12 million Canadians
30-second PSAs in Cineplex and Empire theatres for the NMT launch – enabling movie-goers to receive points for signing the NMT pledge
Media relations targeting major news outlets Social and online media Contests, promotional activities and merchandise
Page 29 of 29