Embed Size (px)
Citation preview

Journal of Finance and Accountancy
An examination of audit, Page 1
Audit fee determinants in the nonprofit sector: A study of
community action agencies
Yvonne Ellis Columbus State University
Quinton L. Booker
Jackson State University ABSTRACT
There is a growing interest in the pricing of audits in the nonprofit (NPO) sector; however, there is a lack of sufficient research to support the interest. The purpose of this study is to investigate the determinants of audit fees in the Community Action Agency (anti-poverty fighting nonfederal organizations) segment of the NPO sector of the audit market. An external audit fee model is developed using a national sample of 274 Community Action Agencies. Ordinary least square regression is used to test the model. The findings indicate that the model is highly significant and explains the majority of the cross-sectional variance in audit fees. Consistent with prior studies, the size and complexity variables explain the majority of variance in fees. Contrary to prior studies, there is a weak association between the proxies for risk and fees and there is a low concentration of Big audit firms. This segment of the audit market is dominated by small (nonTop 100) audit firms. The results of this study may be useful to managers, policy makers, donors and other stakeholders to assess audit fees in an environment similar to CAAs. Keywords: Audit fees, Community Action Agencies, Single Audit Act, nonprofit sector, Federal Audit Clearing House, federal awards.

Journal of Finance and Accountancy
An examination of audit, Page 2
INTRODUCTION
There is an increasing interest in issues related to external audits of non-profit organizations (NPOs) in our society, but little empirical evidence exist (Vermeer, Raghunandan, & Forgione, 2009). The NPO audit market is comprised of many diverse organizations. This sector includes over 1.5 million NPOs, employs 12.9 million Americans (9.7 percent of the workforce), and provides five percent of the gross domestic product (Wing, Pollack, & Blackwood, 2008). In addition, some organizations provide nonreciprocal services to the citizens of our society. For instance, a very important group of nonfederal anti-poverty fighting organizations known as Community Action Agencies (CAAs)1 provide valuable services to clients in all states and trust territories of the U.S. According to the National Association of Community Action Partnership (2010), there are 1100 CCAs providing annual services to 17 million Americans living in poverty. Similar to other NPOs, CAAs are required to have an annual external audit conducted according to the requirements set forth by the Single Audit Act Amendments of 19962 (the Act hereafter). Audits are an important legal accountability tool used by resource providers (donors, grantors, and others) to assure that resources are spent by nonprofit organizations in accordance with the resource provider’s intentions (Keating, Fisher, Gordon, & Greenlee, 2005). However, there is a lack of audit pricing literature for this important group of organizations.
The purpose of this study is to gain an understanding of audit pricing in the CAA segment of the audit market. Specifically, this study investigates the determinants of audit fees and develops an external audit fee model using a national sample of 274 CAAs. The model introduces new variables and redefines the measurement of others as necessary to capture the unique operating environment of CAAs. Prior fee models may not be appropriate to assess fees in the CAA market since researchers note that fee determinants in one sector of the audit market might not be appropriate for another sector because of differences in operating or regulatory requirements (Rubin, 1988; Khumawala & Gordon, 1997). In addition, Roberts and Glezen (1990) assert that there may be differences within a sector, which can affect the determinants of fees.
The data were obtained using a survey questionnaire sent to the chief financial officer for each CAA and an external audit report obtained from the Federal Audit Clearinghouse (FAC) database3. Ordinary least squares (OLS) regression is used to empirically test the model. The results of the study indicate that the fee model is highly significant and explains a majority of the cross-sectional variance in audit fees across CAAs. Consistent with the results of prior studies, size and complexity variables explain the majority of the variance in fees (Francis, 1984;
1 The Economic Opportunity Act of 1964 established CAAs as nonfederal, nonprofit, anti-poverty fighting organizations with a primary goal of providing economic equality to all citizens. The service area of CAAs covers almost all U.S. states and territories. Some of the most widely-known programs administered by a CAA are Women, Infants and Children (WIC), Head Start, Meal on Wheels, Job Readiness Training and Home Weatherization, etc. 2 By federal law (Title 31 U.S.C. Chapter 75), nonfederal entities that expend $300,000 ($500,000 after 12/31/2003) or more in federal awards annually are required to have audits conducted in accordance with Government Auditing Standards (commonly referred to as the Yellow Book) and revised OMB Circular A-133, Audits of States, Local Governments, and Non-profit Organizations, and the Single Audit Act Amendments of 1996. 3 The Federal Audit Clearinghouse database acts as an agent for the Office of Management and Budget (OMB). Its primary purposes are to (1) establish and maintain a government-wide database of single audit results and federal awards information, (2) serves as a federal repository of single audit reports, and (3) distributes single audit reports to federal agencies.

Journal of Finance and Accountancy
An examination of audit, Page 3
Palmrose, 1986; Francis & Simon, 1987; Rubin, 1988; Vermeer et al., 2009). Contrary to the results of prior studies, the current study finds a weak association between the proxies for audit risk and fees. Also, nonTop100 audit firms dominate this segment of the audit market.
The remainder of this paper is structured as follows. The second section discusses the relevant literature and hypothesis development. The third section discusses the methodology used to develop and test the model. The fourth section discusses the results and the final section provides the conclusion.
LITERATURE REVIEW AND HYPOTHESIS DEVELOPMENT
Prior Studies
The first external audit fee models were developed in the private and public sectors of the
audit market (Simunic, 1980; Francis, 1984; Firth, 1985; Palmrose, 1986; Rubin, 1988; O’Keefe, King, & Gaver, 1994; Pong & Whittington, 1994). Simunic (1980) was the first to develop an empirical audit fee model in the private sector using publicly traded companies on the stock exchange. The results indicate that price competition is present in the audit market of publicly held companies. Francis (1984) extends the study by Simunic using pooled cross sectional data of publicly held companies in the Australian market. The results show that Big Eight firms have scale economies and product differentiation, which are similar to the results found by Simunic. In addition, the results of other studies show that audit pricing is similar across different countries (Low, Tan, & Koh, 1990; Pong & Whittingham, 1994)
In the public sector, Rubin (1988) develops a fee model using a national sample of cities. He addresses the issue that the public sector might differ from the private sector based on the accounting systems, types of financial reports, financial statement users and contracting procedures. New variables were introduced to capture the operating environment of the city government. Several other studies have extended the audit pricing literature in the public sector (Baber, Brooks, & Ricks, 1987; Copley & Doucet, 1993; Ward, Elder, & Kattelus, 1994). A more recent municipal audit fee model by Giroux and McLelland (2008) uses structural equation modeling versus OLS to examine the interrelations across important variables. However, the authors note that OLS is appropriate if the interest is only in the direct effect of independent variables on fees, which is the case in the present study.
As noted earlier, there is a paucity of research on audit fees in the NPO sector. Pearson, Brooks, and Neidermeyer (1998) develop a monitoring cost model that addressed both internal and external auditing costs for a large heterogeneous group of NPOs. The results show that monitoring costs are higher for NPOs subject to the Single Audit Act, has large amounts in inventory and receivables, large expenses for program support services and compensation to officers. Also, Beattie, Goodacre, Pratt, and Stevenson (2001) develop a fee model in the nonprofit sector using organizations in the United Kingdom. The results found that nonprofit organizations across different countries still had similar characteristics. Size, complexity, nonaudit fees, and nature of the charity were found to have a significant affect on audit fees. Vermeer et al. (2009) develop a fee model in the NPO sector using 125 of the U.S. largest nonprofit organizations. The results show that size, complexity, liquidity, and resource dependency are associated with audit fees.
In this study, the fee model includes variables from prior studies and introduces new variables to capture the unique operating environment of CAAs. Roberts and Glezen (1990)

Journal of Finance and Accountancy
An examination of audit, Page 4
assert that there may be differences within a sector, which can affect the determinants of fees which may cause fee determinants to vary from one sector to another and within a sector. Furthermore, Khumawala and Gordon (1997, p. 46) suggest that accountability by NPOs entail unique issues because these organizations are subject to neither the electoral control, which holds governments responsible, nor the market forces, which discipline business organizations. The next section of the paper discusses the audit fee model which captures the unique operating environment of CAAs.
CAA Audit Fee Model
The following external audit fee model is used to examine the cross-sectional variance in
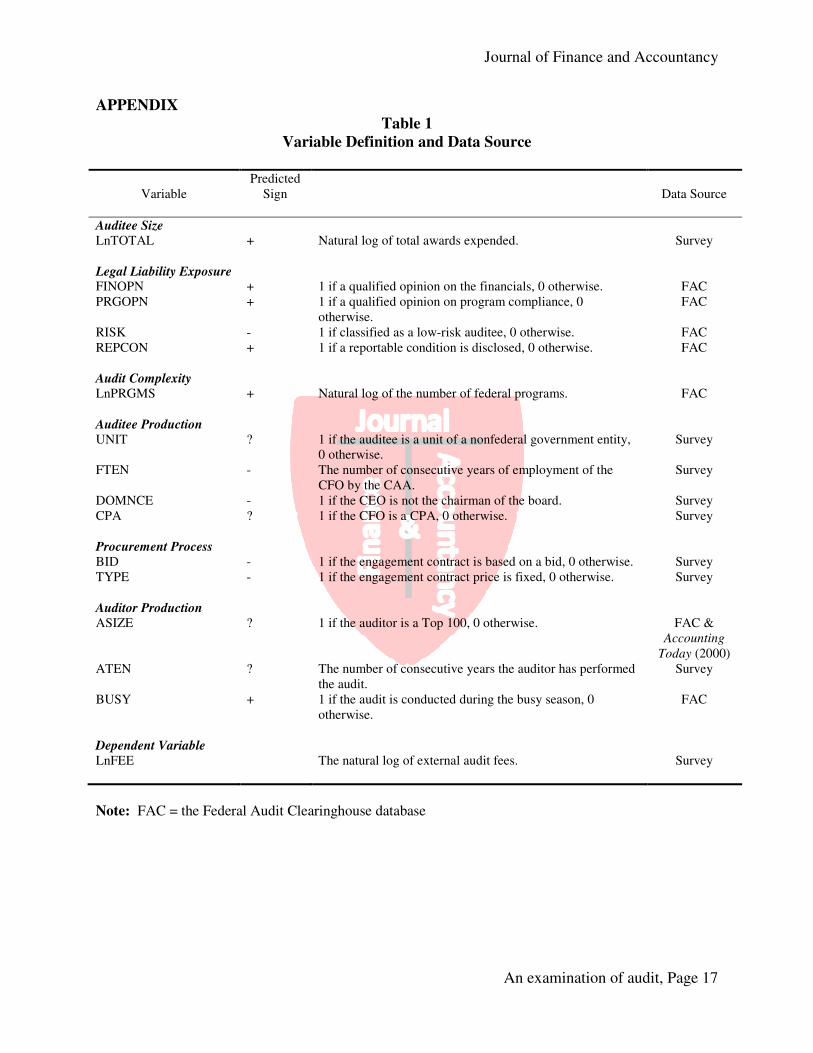
fees across CAAs. The model includes one dependent variable and 15 explanatory variables partitioned into six categories. The categories are: (1) auditee size, (2) legal liability exposure, (3) audit complexity, (4) auditee production, (5) procurement process, and (6) auditor production.
LnFEE = α + β1LnTOTAL + β2FINOPN + β3 PRGOPN + β4 RISK + β5 REPCON + β6
LnPRGMS + β7 UNIT + β8 FTEN + β9 DOMNCE + β10 CPA + β11BID
+ β12 TYPE + β13 ASIZE + β14 ATEN + β15 BUSY + + ε
The variables are defined as follows:
Intercept = constant term; LnFEE = Natural log of external audit fees;
LnTOTAL= Natural log of total awards expended;
FINOPN = 1 if a qualified opinion on the financials, 0 otherwise;
PRGOPN = 1 if a qualified opinion on program compliance, 0 otherwise;
RISK = 1 if the auditee is classified as low-risk, 0 otherwise;
REPCON = 1 if the auditee discloses a reportable condition, 0 otherwise;
LnPRGMS= Natural log of the number of federal programs;
UNIT = 1 if the auditee is a unit of a nonfederal governmental entity, 0 otherwise;
FTEN = The number of consecutive years of employment of the CFO at the CAA;
DOMNCE= 1 if the CFO is not the chairman of the board, and 0 otherwise;
CPA = 1 if the CFO is a CPA, 0 otherwise;
BID = 1 if the engagement contract is based on a bid, 0 otherwise;
TYPE = 1 if the contract is fixed, 0 otherwise;
ASIZE = 1 if the auditor is Top 100, 0 otherwise;
ATEN = the number of consecutive years the auditor has performed the audit, 0 otherwise; and
BUSY = 1 if the audit is conducted during the auditor’s busy season, 0 otherwise.
Ε = error term
Dependent Variable
The variable of interest in this study is external audit fees, the dependent variable. Audit fees are measured as the dollar amount paid to an external auditor for year-end audit work.

Journal of Finance and Accountancy
An examination of audit, Page 5
Similar to previous studies, the natural log transformation of audit fees (LNFEE) is the dependent variable (Francis, 1984; Francis & Stokes, 1986; Palmrose, 1986; Rubin, 1988). Auditee Size
Previous audit pricing studies show that the size of an organization accounts for the
majority of the variance in audit fees (Francis, 1984; Francis & Stokes, 1986; Palmrose, 1986; Rubin, 1988). Theoretically, the larger an organization, the more audit effort is needed to verify transactions and balances, which result in higher fees. Prior proxies used for size include total assets, revenues, and population of a government (Simunic, 1980; Rubin, 1988; Geiger & Raghunandan, 2002). In this study, the natural log of the total amount of federal awards expended (LnTOTAL) is used as the proxy for size, since CAAs neither generates operating revenues like for-profit organizations, nor generates taxes like governmental entities. Using awards expended versus awards received eliminates timing differences since awards received in one fiscal year may be expended across two or more fiscal years based on when the federal program4 is administered. Also, federal awards expended will allow auditors to better examine an auditee’s compliance with program spending requirements (Wood & Koebele, 1998, p. 49). The expected positive association between size and fees results in the following hypothesis.
H1: The higher the dollar amount of total awards expended the higher audit fees.
Legal Liability Exposure
Several different factors have been used to assess risk exposure to auditors. Johnstone (2000) developed a client-acceptance decision model, which included financial viability and internal control as two factors used to evaluate client related risk. Theoretically, riskier client pays higher fees to cover the likelihood that the auditor will suffer the possibility of a future lawsuit as a result of an audit failure. In this study, the proxies for loss exposure include the auditor’s opinion on the financials (FINOPN), the auditor’s opinion on program compliance (PRGOPN), the classification of the auditee as a low-risk auditee (RISK), and the presence of a reportable condition (REPCON).
The Act requires that an auditor render an opinion on the financial statements, the schedule of federal awards, and an opinion as whether the auditee is in compliance with laws, regulations, and the provisions of contracts or grant agreements. Low program compliance may lead to additional work by the auditor. In this study, the FINOPN and PRGOPN are both dummy variables, “1” indicates if a qualified opinion is rendered and “0” if not. Some researchers note that a “subject to” or “qualified” opinion indicates increased risk, which leads to additional work by the auditor resulting in higher fees (Simunic, 1980; Firth, 1985; Giroux & McLelland, 2008). The following hypotheses are tested.
H2a: A qualified opinion on the financial statements results in higher audit fees.
4 According to Circular A-133, which governs audits of states, local governments, and non-profit organizations states that a federal program means all Federal awards to a non-federal entity assigned a single number in the Catalog of Federal Domestic Assistance.

Journal of Finance and Accountancy
An examination of audit, Page 6
H2b: A qualified opinion on program compliance results in higher audit fees. In addition to rendering an opinion on the financial statements, the schedule of federal
awards and compliance reports, the Act also requires the auditor to attest to the client’s level of risk based on a risk-based approach. A CAA may be considered a low-risk auditee if it meets certain requirements set forth by Circular A-133. 5 A low-risk auditee may be eligible for reduced audit coverage of federal awards expended from 50% coverage of expenditures down to 25% coverage. The dummy variable RISK is “1” if the client is considered a low-risk auditee, and “0” if not. The above discussion leads to the following hypothesis.
H2c: A CAA classified as a low-risk auditee will have lower audit fees.
In addition to the above requirements, the Act requires that the auditor attest to the
adequacy of the internal control system. Raman and Wilson (1992, p. 271) emphasize that audits conducted under the Single Audit Act go beyond the traditional financial statements audit by placing additional emphasis on the review and evaluation of internal controls and testing of compliance with laws and regulations. An auditor is required to disclose reportable conditions when they are considered a material weakness. In a study by Keating at al. (2005, p. 296), reportable conditions were disclosed in 15.7 percent of the single audits and 29.1 percent of these conditions were considered to be a material weakness in internal control. The presence of a reportable condition normally requires the auditor to perform additional tests, which may require additional audit effort, which can lead to higher audit fees. The dummy variable REPCON is “1” if a reportable condition is disclosed and “0” if not. The following hypothesis is tested.
H2d: The presence and reporting of a reportable condition will result in higher audit fees.
Audit Complexity
Theoretically, more complex organizations require additional audit effort because of coordination costs and increased variety of transactions and internal control systems that the auditor might need to study and evaluate (Rubin, 1988, p. 222). The purpose of a CAA is similar to the purpose of a local government, which is to provide service to citizens. The number of federal programs a CAA administers is used as the proxy for complexity. The measure of complexity is conducted using the natural log transformation of the number of federal programs (LnPRGMS), which leads to the following hypothesis.
H3: The larger the number of federal programs a CAA administers, the higher
audit fees.
5 Circular A-133 (section 530) classifies an entity as a low-risk auditee based on certain requirements for each of the preceding two years: (1) the entity had single audits performed and received unqualified opinions on the financials and the schedule of federal awards, and (2) had no major audit findings (internal control deficiencies, major noncompliance, and type A programs had no audit findings).

Journal of Finance and Accountancy
An examination of audit, Page 7
Auditee Production
Prior studies show that auditee characteristics do affect audit fees (Palmrose, 1989; O’Keefe, King, & Gaver, 1994). The current study uses four variables to capture the characteristics of the auditee. The variables are the component unit status (UNIT), the chief financial officer tenure (FTEN), the chief executive officer dominance (DOMNCE), and whether the chief financial officer is a CPA (CPA). A CAA can legally be classified as private, nonprofit, community-based organization or a unit of a local government (NACAA, 2000, p. 18)6. The variable UNIT is a dummy variable, which is “1” if the CAA is public and “0” if not. Often, a local government may conduct interim audit work of a component unit. The external auditor may rely on this work to reduce its audit effort and pass the cost savings on to client. Similar to Rubin (1988), this study also includes the retention of the chief financial officer as a proxy for the stability of personnel. The variable FTEN is measured as the number of consecutive years the chief financial officer has been employed with the CAA.
The Act requires that every CAA have a governing board, which directs its overall mission and goals. The chief financial officer of a CAA does not have to be independent of the board, which is contrary to what Sarbanes Oxley Act (SOX) 2002 mandates (board members must be independent) for publicly traded companies. Defond and Francis (2005, p. 18) suggest that the decision by SOX to require all board members to be independent follows the conventional wisdom that independent directors are better able to monitor management behavior than nonindependent directors. Also, results by Tsui, Jaggi, and Gul (2001, p. 189) suggest that if the chief financial officer did not dominate the corporate board then there is lower control risk, resulting in lower audit effort and fees. The present study includes the variable DOMNCE, which equals “1” if the chief financial officer is not the chairman of the board, and “0” otherwise. Also, as a proxy for expertise, the CPA variable equals “1” if the CFO is a CPA and “0” if not. Williams (2005) study shows that many public organizations both large and small have been able to hire and retain audit committee experts. Sweeney, Barne, and Thornburg (2010) argue that high quality accountants can signal their superior knowledge by obtaining the CPA certification.
Procurement Process
The procurement process examines whether the contractual engagement agreement
between the client and the auditor affect fees. Two dummy variables are use to capture the effect of the procurement process are BID, which measures whether the engagement contract includes a bid or not, and TYPE, which measures whether the engagement contract is based on a fixed fee or not. Copley and Doucet (1993) provide evidence that entities receiving bids are more likely to have better quality audits and that competition will decrease audit fees. The variable BID is “1” if the contract involves a bidding process and “0” if not, which leads to the following hypothesis.
H4a. An engagement contract based on a bidding process should result in lower fees.
6 A CAA that is considered a component unit of a local government is called a public CAA according to the requirements set forth by GASB Statement No. 39: Determining Whether Certain Organizations Are Component Units. In FY 2000, 127 eligible organizations are classified as units of the local governments (The Center for Community Action Research [CCAR], 2000, p. 18). All other CAAs are considered private nonprofit, community-based organizations.

Journal of Finance and Accountancy
An examination of audit, Page 8
In addition, an engagement based on a fixed fee contract should result in lower fees. Consistent findings by Palmrose (1989, p. 492) of both public and closely-held companies and Thorne, Holmes, McGowan, Strand, and Strawer (2001) of counties and cities in North Carolina provide evidence that an engagement contract negotiated on a fixed fee basis results in lower fees. The variable TYPE equals “1” if the contract price is fixed and “0” if not, which leads to the following hypothesis.
H4b. An engagement contract based on a fixed fee basis should result in lower fees.
Auditor Production
Three variables are included in the model to capture auditor production characteristics.
The variables are auditor size (ASIZE), auditor tenure (ATEN), and the busy season (BUSY). The auditor size variable is normally segmented into large and small auditors. According to Yardley, Kauffman, Cairney, and Albrecht (1992), the suppliers of audit services are grouped into two types, Big 8 and nonBig 8 (currently Big 4 and nonBig 4). Large firms participate in both market segments (large-client and small-client), and all other CPA firms generally participate only in the small-client segment. An examination of the audit reports from the FAC database reveals that Big 5 firms conducted only six of the 675 audits inn this study, Therefore, this study includes a different auditor size grouping, Top 100 versus nonTop 100. based on annual sale revenues from Accounting Today’s rankings. Auditor size (ASIZE) equals “1” if Top 100, and “0” if not.
There are mixed results concerning the association between audit fees and auditor tenure. Some studies argue that the incumbent auditors earn quasi-rents because of the high start-up costs of new engagements (DeAngelo, 1981; Geiger & Raghumamdan, 2002). In contrast, Simunic (1980) and Daniel and Terrell (1995, p. 628) argue that a long tenure can be associated with the learning-curve theory, which creates efficient and effective methods of conducting the audit, resulting in cost savings that are passed on to the auditee. The auditor tenure (ATEN) variable is a measure of the number of consecutive years the current auditor has audited the CAA. The last variable (BUSY) is associated with the timing of the audit work. Theoretically, audits conducted during the busy season (January thru April) are higher in fees. The BUSY variable is “1” if the audit is conducted during the busy season, and “0” if not.
METHOD
Sample Selection
Table 1 (Appendix) shows that the data were obtained using the FAC database, which
serves as a repository for audits conducted under the Act, along with a survey questionnaire. The following steps were employed to obtain the sample. First, a national list of all CAAs (1100) for fiscal year 2000 was obtained from the National Association for State Community Service Programs7. Second, the sample was restricted to CAAs that met the following selection criteria: (1) the CAA must have had an annual audit conducted according to the Act, and (2) the annual audit must have been conducted by an independent public accountant who meets the
7 National Association for State Community Service Programs is a premier national association advocating and enhancing the leadership roles of states in preventing and reducing poverty.
Journal of Finance and Accountancy
An examination of audit, Page 9
independence requirements set forth by Section 7501 of the Act. Third, a search by name of the FAC database identified 675 CAAs. Next, a survey questionnaire (two mailings) was sent to the chief executive officer for each of the 675 CAAs obtaining information for nine of the 16 variables in the model as shown in Table 1(Appendix). In the final step, the completed questionnaires were matched to the audit reports obtained from the FAC database. Table 2 (Appendix) shows the summary of the final sample, 274 CAAs (41% response rate). Of the 675 CAAs in the initial sample, 401 are not included due to nonresponse or incomplete data.
A test of nonresponse bias was performed to determine whether the sample was representative of its population. The test included a method recommended by Oppenheim (1966), which compares the characteristics of early (first mailing) versus late (second mailing) respondents. The test indicates no response bias.
Descriptive Statistics
Table 3 (Appendix) presents untransformed descriptive statistics for the full sample. The
mean audit fee is $21,218 with a range from $3,000 to $140,000. The mean of awards expended is $8,475,358 with a range from $32,480 to $108,633,146. Approximately 90% of the contract engagements are based on fixed fee contracts with 51.8% of the contracts receiving bids. To closer examine the characteristics of CAAs, the sample was partitioned based on total awards expended into large and small CAAs. Small CAAs represent the top one-third of the sample and large CAAs represent the bottom one-third of the sample. Table 4 (Appendix) presents the descriptive data for the large and small CAAs. The data show that the mean audit fee ($31,391) for a large CAA is more than double the mean audit fee ($13,171) for a small CAA. Furthermore, the mean amount of total awards expended ($17,313,810) for a large CAA, is more than seven times greater than the mean amount of total awards expended ($2,221,151) for a small CAA. Also, large CAAs administer almost twice as many programs than small CAAs (17 and 9, respectively).
Diagnostic Procedures
Three methods are used to test for collinearity. The first method is the bivariate
correlation matrix. As Table 5 (Appendix) shows, the bivariate correlation matrix with the highest correlation (.651) is between the dependent variable (FEE) and the size variable (LnTOTAL). This high correlation is expected since the size variable has been previously documented as explaining the majority of variance in audit fees (Rubin, 1988; Roberts & Glezen, 1990; Beattie et al., 2001). The second method is the variance inflation factor (VIF). The results show that values range from 1.02 to 1.48, which does not exceed the VIF threshold value of 10. According to Hair, Anderson, Tatham and Black (1998, p.193), any VIF value above 10 denotes high collinearity. The third method is an examination of the condition index and the regression coefficient variance-decomposition matrix. An examination of the regression coefficient variance- decomposition matrix does not indicate any condition indices above the normal threshold (range between 15 and 30) and a variance proportion above .90. Again, there is no indication of the presence of collinearity. In addition to the above tests, the Levene test and residual plots are used to test for heteroscedasticity and found no violations of this assumption using transformed data. Thus, the above diagnostic procedures indicate that the results of the regression model are not influenced by violations of the OLS assumptions.

Journal of Finance and Accountancy
An examination of audit, Page 10
RESULTS
Full Regression Model
An OLS regression model is used to predict the cross-sectional variance in audit fees across 274 CAAs. Table 6 (Appendix) shows the results of the full regression model. The model is significant with an F value equal to 20.774 and an adjusted R2 equal to .547. The explanatory variables explain a majority of the cross-sectional variance in fees across CAAs. The size (LnTOTAL), financial statement opinion (FINOPN), complexity (LnPRGMS), contract type (TYPE), auditor size (ASIZE), and auditor tenure (ATEN) variables are statistically significant at the .10 level or better. Fee Determinants
Size
Consistent with prior studies, there is support for H1, which predicts that the higher the amount of total awards expended the higher audit fees. The size variable (LnTOTAL) is positive (coeff. = .360) and significant (p = .000) and explains the majority of variance in fees across CAAs. The interpretation is that the larger a CAA, the higher fees.
Legal Liability Exposure
Hypothesis 2a predicts that the FINOPN variable is positively associated with audit fees. The results show that the financial opinion (FINOPN) variable is statistically significant (p = .025) with a negative coefficient (-.209), which is contrary to expectation. A possible explanation for the unexpected sign may be that the auditors did perform additional procedures; however, the additional cost is borne by the auditor, since the majority (89.4 %) of the audit engagement contracts are based on a fixed fee basis. Palmrose (1989, p. 489) asserts that under fixed fee contracting, fees are set in advance of performance and tasks uncertainty risk shifts to auditors. Auditors bear the consequences of deviations between expected and actual evidence acquisition.
Hypothesis 2b predicts that the PRGOPN variable is positively associated with audit fees. The results show that hypothesis 2b is not supported. Also, there is no support for H2c, which predicts that a low-risk auditee (RISK) will have lower audit fees. The findings show that RISK has a positive coefficient (.009) and is not significant. The Act states that a low-risk auditee may be eligible for reduced audit coverage of federal awards expended from 50% coverage to 25% coverage. The results suggest that (1) auditors are not reducing the scope of the audit work or reducing the coverage of federal awards expended when a CAA is classified as a low-risk auditee, or (2) it could be that the auditors are not passing along the benefits of the reduced work to clients in lower fees. Furthermore, the weak association between the loss exposure variables and audit fees may be due to the unique operating environment of CAAs. Recall that CAAs do not have third party investors like organizations in the private (e.g., bondholders and stockholders) or public (e.g., bondholders) sectors. Raman and Wilson (1992, p. 279) assert that federal agencies, unlike corporate investors, do not look to the auditor as a potential deep pocket for loss recovery. Thus, the results indicate that level of risk undertaken by the auditor in the

Journal of Finance and Accountancy
An examination of audit, Page 11
NPO sector may be somewhat lower than the level of risk undertaken by the auditor in both the private and public sectors.
Complexity
Similar to the results of prior audit fee studies, there is support for H3, which predicts that the more complex an organization is the higher audit fees. The proxy for complexity, the LnPRGMS, is statistically significant (p =. 007) and the coefficient is positive (.161). In addition, LnPRGMS accounts for a significant amount of variance across CAAs. The results of this study indicate that the larger the number of federal programs a CAA administers the higher audit fees.
Auditee Production
The results of the full sample do not show a significant relationship between the auditee characteristic variables (UNIT, FTEN, DOMNCE, and CPA) and fees. However, after partitioning the sample into large and small CAAs, the UNIT variable becomes significant for small CAAs. This finding suggests that small CAAs, which are normally component units of a local government entity, will have lower audit fees. When the local government serves as an oversight agency it often performs interim audit functions. Thus, the results indicate that external auditors do rely on some of the monitoring work conducted by local governments. The results indicate that this reduction in work by the auditor is passed on to a client in the form of lower audit fees. Procurement Process
There is no support for hypothesis 4a, which predicts that a contract based on a bidding process will result in lower fees. However, Table 3 (Appendix) shows that a large percentage (51.8%) of CAAs did solicit bids. Support is found hypothesis 4b, which states that an engagement contract based on a fixed fee basis will result in lower fees. The TYPE variable is found to be statistically significant (p =. 000) and has a negative correlation (-.349) with fees as expected. The finding indicates that an engagement contract based on a fixed fee basis should result in lower audit fees, which is consistent with previous results found by Palmrose (1989) and Thorne at al. (2001).
Auditor Production
As expected, the auditor size (ASIZE) variable is positive and statistically significant (p =. 063) and has a significant effect on fees. The positive coefficient (.173) indicates that large firms (Top 100) are associated with higher audit fees. Since the results show a weak association between loss exposure variables and fees by large firms it implies that higher fees are attributable to potential loss exposure. The higher fees by the Top100 firms may be due to product differentiation. In addition, the auditor tenure variable (ATEN) is statistically significant (p = .000) and is positively associated with fees. This can be interpret that the longer the auditor tenure the higher fees. As Table 2 (Appendix) shows there is a very broad auditor tenure range from 1 to 37 years, with a mean tenure of 7.11 years. Also, the results show that the BUSY variable is not significant; however, Table 3 (Appendix) shows that 42.3% of the audits are

Journal of Finance and Accountancy
An examination of audit, Page 12
conducted during the busy season. In addition, the constant term is positive (4.112) and statistically significant (p = .000).
Partitioned Regression Model
To determine whether size differentiation would significantly affect the determination of
audit fees, the sample was partitioned into large and small CAAs using a method similar to Rubin (1988). The upper one-third of the sample represents small CAAs and the lower one-third of the sample represents large CAAs. Table 7 (Appendix) presents the results of the regression models for the large and small CAAs. The results show that both models are significant with a major portion of variance being explained by both small CAAs (adjusted R square = .318) and large CAAs (the adjusted R square = .257). Also, the findings indicate that both models show basically the same significant variables (LnTOTAL, TYPE, and ATEN), except for the variable PRGOPN found only in the large CAA model, and the variable LnPRGMS found only in the small CAA model. Overall, the results show that the size differentiation has a little affect on fee determinants.
Sensitivity Analysis
To assess the sensitivity of the results, additional regressions were run for the reduced model, elimination of influential observations, and forward addition and backwards elimination methods. The purpose of the reduced model is to determine whether the six significant variables (LnTOTAL, FINOPN, LnPRGMS, TYPE, ASIZE, and ATEN) found in the full model would remain significant after the deleting the nonsignificant variables. Table 8 (Appendix) shows that the reduced model includes the same six significant variables with an adjusted R2 equal to .515, which is similar to the adjusted R2 of .547 for the full model. Another sensitivity test concerns influential observations. According to Tabachnick and Fidell (1996) influential observations are all cases with a standardized residual of more than 3.3 or less than –3.3. This test identified five high and four low influential observations. After eliminating the influential observations, the regression results show an adjusted R2 equal to .463, which is slightly lower than the adjusted R2 of .547 found in the basic model. Since the explanatory power of the model did not change significantly the variables are retained in the sample. To determine whether the method of entering the variables in the model affect the results, two additional regressions were run using the forward addition and the backward elimination methods. The forward addition method produces the same six significant variables with a slightly lower adjusted R2 equal to .515. The backward elimination method shows that UNIT variable is significant in addition to the other six significant variables. Although this model produces an additional significant variable, it shows a slight decrease in the explanatory power of the model, R2 square equals .518. Based on the above results, the basic regression model is the most parsimonious model. CONCLUSION
The purpose of this study was to investigate fee determinants in the NPO sector of the audit market using a national sample of 274 CAAs. The external audit fee model includes variables based on prior literature as well as three new variables (awards expended, the number

Journal of Finance and Accountancy
An examination of audit, Page 13
of federal programs, and a low-risk auditee) to capture the unique operating environment of CAAs. Overall, the model is significant with six significant variables explaining a significant amount of cross-sectional variance in fees across CAAs. Furthermore, the findings show that audit fee pricing in the nonprofit sector is similar and different in some aspects to audit pricing in both the private and public sectors.
Consistent with previous results, the size and complexity variables are found to be statistically significant and account for the majority of cross-sectional variance in audit fees. A notable difference found is the association between loss exposure and fees. Previous studies show a positive and significant relationship between risk and fees. However, in this study only one of four loss exposure variables, FINOPN (qualified opinion on the financials) was found to be significantly associated with fees; however, the sign (-) is contrary to expectation. This is consistent with results found by Rubin (1988), who argues that a qualified opinion reduces the auditor’s risk because of the warning signal provided to financial statement users. Another possible explanation for the weak association found between risk and fees may be due to the unique operating environment CAAs. Recall, the NPO sector does not have third party investors like businesses in the private (e.g., bondholders and stockholders) and public (e.g., bondholders) sectors. Therefore, the auditors may assess risk at a lower level in the NPO sector versus the private and public sectors. Another factor that could be driving the results of our study could be the auditor size. Yardley et al. (1992) assert that Big firms operate in both the large-client and small-client segments of the audit market. In the CAA segment there is not a large concentration of Big firms; therefore a different auditor size grouping was used, the Top 100 firms versus others (nonTop100). The results show that the CAA segment has a high concentration of nonTop 100 auditors.
The implication from this study is that different fee determinants may be needed to capture the unique operating environments of the diverse organizations in the NPO sector. This paper contributes to the existing audit pricing literature in two ways. First, it develops an external audit fee model that identifies fee determinants in the CAA segment of the audit market. Second, it introduces new variables to capture the unique operating characteristics of CAAs. In addition to the contributions, two limitations are worth mentioning in this study. First, the sample includes only organizations (CAAs) from one segment of the NPO sector; therefore, generalizability of the results might be limited only to CAAs or other organizations that operate on a similar basis. Second, the CAA segment of the audit market does not have a large concentration of big auditors; therefore, the auditor size may be affecting the results of this study. There are many opportunities for future research in the NPO sector considering the large number and diversity of organizations that comprise this sector.

Journal of Finance and Accountancy
An examination of audit, Page 14
REFERENCES
Accountants Media Group (AMG). (2003, August). Accounting Today’s Top 100 Firms. Accounting Today, 3.
Baber, W. R., Brooks, E. H., & Ricks, W. E. (1987). An empirical investigation of the market for audit services in the public sector. Journal of Accounting Research 25(2), 293-305.
Beattie, V., Goodacre, A., Pratt, K., & Stevenson, J. (2001). The determinants of audit fees: Evidence from the voluntary sector. Accounting and Business Research 31(4), 243-274.
Community Action Partnership: The National Association (2010). About CAAs. Washington, D.C. Retrieved March 21, 2010, from www.communityactionpartnership.com.
Copley, P. A., & Doucet, M. S. (1993). The impact of competition on the quality of governmental audits. Auditing: A Journal of Practice & Theory 12(1), 88-98.
Daniel, W. W., & Terrell, J. C. (1995). Business Statistics for Management and Economics, 7th ed. Boston: Houghton Mifflin Company.
DeAngelo, L. E. (1981). Auditor size and audit quality. Journal of Accounting and Economics
(3), 183-199. DeFond, M. L., & Francis, J. R. (2005). Audit research after Sarbanes-Oxley. Auditing:
Journal of Practice & Theory 24(Supplement), 5-30. Firth, M. (1985). An analysis of audit fees and their determinants in New Zealand. Auditing: A Journal of Practice & Theory 4(2), 23-37. Francis, J. R. (1984). The effect of audit firm size on audit prices: A study of the
Australian market. Journal of Accounting & Economics 6, 133-151. Francis, J. R., & Simon, D. (1987). A test of audit pricing in the small-client segment of the U.S. audit market. The Accounting Review 17(1), 145-157. Francis, J. R., & Stokes, D. J. (1986). Audit prices, product differentiation, and scale
economies: Further evidence from the Australian market. Journal of Accounting
Research, 24(2), 383-393. Geiger, M. A., & Raghunandan, K. (2002). Auditor tenure and audit reporting failures. Auditing: A Journal of Practice & Theory, 21: 67-78. Giroux, G., & McLelland, A. (2008). A municipal audit fee model using structural equation
modeling. The Journal of Applied Business Research, 24(3), 135-146. Governmental Accounting Standards Board (GASB). (2002). Statement No. 39.
Determining whether certain organizations are component units-an amendment of GASB Statement No.14. Norwalk, Ct: GASB.
Hair, J. F. Jr., Anderson, R. E., Tatham, R. L., & Black, W. C. (1998). Multivariate Data
Analysis ( 5th ed.). New Jersey: Prentice Hall. Johnstone, K. M. (2000). Client-acceptance decisions: Simultaneous effects of client business risk, audit risk, auditor business risk, and risk adaptation. Auditing: A Journal of Practice
&Theory, 19(2), 1-25. Keating, K., Fischer, M., Gordon, T. P., & Greenlee, J. (2005). The Single Audit Act: How compliant are nonprofit organizations? Journal of Public Budgeting, Accounting &
Financial Management, 17(3), 285-309. Khumawala, S. B., & Gordon, T. P. (1997). Bridging the credibility of GAAP: Individual
donors. Accounting Horizons, 11(3), 45-68. Low, L., Tan, P. H., & Koh, H. (1990). The determination of audit fees: An analysis in the
Singapore context. Journal of Business Finance & Accounting, 17(2), 285-295.
Journal of Finance and Accountancy
An examination of audit, Page 15
National Association of Community Action Agencies (NACCA). (2000). CAA
Executives’ Handbook. Washington, D.C.: NACCA. Office of Management and Budget (OMB). (2003). Circular A-133 Revised June 27, 2003.
Audits of states, local governments, and non-profit organizations. Washington, D.C.: OMB.
O’Keefe, T. B., King, R. D., & Gaver, K. M. (1994). Audit fees, industry specialization, and compliance with GAAS reporting standards. Auditing: A Journal of Practice & Theory,
13(2), 41-55. Oppeheim, A. M. (1966). Questionnaire Design and Attitude Measurements. New York: Basic
Books. Palmrose, Z. (1986). Audit fees and auditor size: Further evidence. Journal of Accounting
Research, 24(1), 97-110. __________. (1989). The relation of audit contract type to audit fees and hours. The Accounting Review, 64(3), 488-499. Pearson, T. A., Brooks, R. C., & Neidermeyer, A. A. (1998). The determinants of
monitoring costs in not-for-profit organizations. Journal of Public Budgeting,
Accounting & Financial Management, 10(4), 499-512. Pong, C. M., & Whittington, G. (1994). The determinants of audit fees: Some
empirical models. Journal of Business Finance & Accounting 21(8), 1071-1095. Raman, K. K., & Wilson, E. R. (1992). An empirical investigation of the market for “single audit” services. Journal of Accounting and Public Policy, 11, 271-295. Roberts, R. W., & Glezen, G. W. (1990). Determinants of school district audit fees.
Research in Governmental and Nonprofit Accounting, 6, 127-147. Rubin, M. A. (1988). Municipal audit fee determinants. The Accounting Review 18(2),
219-236. Sarbanes Oxley Act (SOX). (2002). Public Law No. 107-204. Washington, D.C.: Government Printing Office. Simunic, D. A. (1980). The pricing of audit services: Theory and evidence. Journal of
Accounting Research 18(1), 161-190. Sweeney, J.T., Barne-Aldred, C., & Thornburg, S. (2010). Pricing in the accountant labor
market. Journal of Finance and Accountancy 4, 1-24. Tabachnick, B., & Fidell, L. (1996). Using Multivariate Statistics( 3rd ed.). New York:
HarperCollins. The Center for Community Action Research (CCAR). (2000). The Community Services
Block Grant Statistical Report. Washington, D. C.: CCAR. Thorne, J., Holmes, S. A., McGowan, C. A., Strand, C. A., & Strawer, R. H. (2001). The relationship between audit price and audit contract type: A public sector analysis. The
Journal of Accounting and Public Policy, 20(3): 189-215. Tsui, J. S. L., Jaggi, B., & Gul, F. A. (2001). CEO domination, growth opportunities,
and their impact on audit fees. Journal of Accounting, Auditing & Finance, 16
(3), 189-207. Vermeer, T. E., Raghunandan, K., & Forgione, D. A. (2009). Audit fees at U.S. non-profit organizations. Auditing: A Journal of Practice & Theory 28(2), 289-303. Ward, D. D., Elder, R. J., & Kattelus, S. C. (1994). Further evidence on the determinants
of municipal audit fees. The Accounting Review 69(2), 399-411. Williams, S. P. (2005). Meet the experts. Accounting Horizons 19(4), 255-265.

Journal of Finance and Accountancy
An examination of audit, Page 16
Wing, K. T., Pollack, T. H., & Blackwood, A. (2008). The Nonprofit Almanac 2008. Washington, D.C: The Urban Institute Press.
Wood, V. M., & Koebele, D. A. (1998). The new single audit. The CPA Journal (October), 46-57.
Yardley, J. A., Kauffman, N. L., Cairney, T. D., & Albrecht, W. D. (1992). Supplier behavior in the U.S. audits market. Journal of Accounting Literature 11, 151-176.
Journal of Finance and Accountancy
An examination of audit, Page 17
APPENDIX
Table 1
Variable Definition and Data Source
Variable Predicted
Sign
Data Source
Auditee Size LnTOTAL + Natural log of total awards expended. Survey Legal Liability Exposure FINOPN + 1 if a qualified opinion on the financials, 0 otherwise. FAC PRGOPN + 1 if a qualified opinion on program compliance, 0
otherwise. FAC
RISK - 1 if classified as a low-risk auditee, 0 otherwise. FAC REPCON + 1 if a reportable condition is disclosed, 0 otherwise. FAC Audit Complexity LnPRGMS + Natural log of the number of federal programs. FAC Auditee Production UNIT ? 1 if the auditee is a unit of a nonfederal government entity,
0 otherwise. Survey
FTEN - The number of consecutive years of employment of the CFO by the CAA.
Survey
DOMNCE - 1 if the CEO is not the chairman of the board. Survey CPA ? 1 if the CFO is a CPA, 0 otherwise. Survey Procurement Process BID - 1 if the engagement contract is based on a bid, 0 otherwise. Survey TYPE - 1 if the engagement contract price is fixed, 0 otherwise. Survey Auditor Production ASIZE ? 1 if the auditor is a Top 100, 0 otherwise. FAC &
Accounting
Today (2000) ATEN ? The number of consecutive years the auditor has performed
the audit. Survey
BUSY + 1 if the audit is conducted during the busy season, 0 otherwise.
FAC
Dependent Variable LnFEE The natural log of external audit fees. Survey
Note: FAC = the Federal Audit Clearinghouse database

Journal of Finance and Accountancy
An examination of audit, Page 18
Table 2
Summary of the Sample
Number
Surveys Mailed
Responses Received
Response
Rate
Responses Eliminated
Usable
Responses
Final Response
Rate
First Mailing
675
242
36%
43
199
30%
Second Mailing
458
75
11%
0
75
11%
Totals
317
====
47%
====
43
====
274
====
41%
====
Note: We mailed surveys to each CEO of 675 CAAs. The final response rate is calculated by dividing the usable responses by the surveys mailed. Forty-three responses are eliminated from the first mailing due to incomplete information or undeliverable addresses. Our second mailing is for 458 (675-199 -18) surveys. We resent 25 of the 43 surveys eliminated during the first mailing after making address corrections. We did not resend the remaining 18 due to incomplete information.

Journal of Finance and Accountancy
An examination of audit, Page 19
Table 3
Descriptive Statistics (Full Sample)
VARIABLE
N
MEAN
STD
MIN
MAX
FEE 274 $21,218 $15,301 $3,000 $140,000
TOTAL 274 $8,475,358 $10,532,544 $324,800 $108,633,146
FINOPN 274 10.6% 0 1
PRGOPN 274 9.1% 0 1
RISK 274 60.2% 0 1
REPCON 274 17.5% 0 1
PRGMS 274 13.51 6.59 1 39
UNIT 274 5.1% 0 1
FTEN 274 10.17 8.95 1 46
DOMNCE 274 1.5% 0 1
CPA 274 21.9% 0 1
BID 274 51.8% 0 1
TYPE) 274 89.4% 0 1
ASIZE 274 9.9% 0 1
ATEN 274 7.11 6.59 1 37
BUSY 274 42.3% 0 1
______________________
n = the number of observations STD = standard deviation See Table 1 for variable measurement and definitions

Journal of Finance and Accountancy
An examination of audit, Page 20
Table 4
Descriptive Statistics (Partitioned Sample: Large and Small CAAs)
Mean (Standard Deviations)
VARIABLE Large CAAs
(N = 91)
Small CAAs
(n = 91) FEE
$31,391 (18,738)
$13,171 (8,724)
TOTAL $17,313,810 (14,417,018)
$2,221,151 (972,308)
FINOPN (% with a qualified opinion)
8.89% 10.9%
PRGOPN (% with a qualified opinion
13.2% 5.4%
RISK (% of low-risk auditee)
61.5% 63.0%
REPCON (% with reportable condition)
14.3% 19.6%
PRGMS
17.30 (6.73)
9.64 (4.91)
UNIT (% component units)
1.1% 8.7%
FTEN
10.23 (8.33)
10.45 (9.44)
DOMNCE (% CEO and chairman independent)
100.00% 97.8%
CPA (% of CFOs with CPA)
20.9% 23.9%
BID (% bid contracts)
52.7% 54.3%
TYPE (% of fixed contracts)
86.8% 92.4%
ASIZE (% of Top 100 auditors)
12.1% 4.3%
ATEN
7.67 (7.15)
6.85 (7.12)
BUSY (% audits during busy season)
56.0% 54.3%
See Table 1 for variable measurement and definitions.

Journal of Finance and Accountancy
An examination of audit, Page 21
Table 5
Inter-Correlation Coefficients
Variables
1
2
3
4
5
6
7
8
9
10
11
12
13
14
15
16
1. FEE 1 2. TOTAL .651** 1 3. FINOPN -.099 -.054 1 4. RGOPN -.001 .044 .179** 1 5. RISK .085 .045 -.229** -.079 1 6. REPCON -.055 -.092 .060 .321** -.214** 1 7. PRGMS .381** .446** -.001 -.042 .064 -.082 1 8. UNIT -.126*** -.084 -.080 -.016 -.015 .024 -.106 1 9. FTEN -.048 -.003 -.013 -.036 .127*** -124*** .039 .155* 1 10. DOMN .051 .048 .042 .039 .025 .056 .070 -.110 -.059 1 11. CPA .068 .075 -.096 -.015 -.020 .011 .073 -.003 -.095 .064 1 12. BID -.091 -.008 -.024 .026 -.008 .041 .028 .025 -.016 -.056 -.019 1 13. TYPE -.268** -.109 .003 -138*** .084 -.091 -.013 .026 .113 -.042 -.047 .048 1 14. ASIZE .181** .185** .006 .065 .044 .041 .032 -.077 -.021 .040 .032 -.073 .034 1 15. ATEN .256** .115 -.024 -.021 .070 -127*** .110 -.016 .133*** -.067 .018 -.072 -.011 -.072 1 16. BUSY .027 .042 -.007 .011 -.043 .013 .068 .036 -.024 -.019 .064 -.017 .007 .039 -.050 1
Notes: ***,**,* indicates correlations are significant at the 0.01, 0.05, and 0.10 levels, respectively (two-tailed tests).
See Table 1 for measurement and definitions of the variables.

Journal of Finance and Accountancy
An examination of audit, Page 22
Table 6
CAA Audit Fee Model
Regression Results of the Full Model
Variables
Predicted
Sign
Coefficient
Standard
Error
P value
Intercept 4.112
.536 .000***
LnTOTAL + .360
.034 .000***
FINOPN + -.209
.093 .025**
PRGOPN + -.117
.102 .255
RISK - .009
.059 .122
REPCON + .009
.078 .225
LnPRGMS + .161
.059 .007***
UNIT ? -.198
.127 .120
FTEN - -.001
.003 .112
DOMNCE - -.110
.231 .634
CPA ? -.004
.066 .470
BID - -.007
.055 .162
TYPE - -.349
.090 .000***
ASIZE ? .173
.093 .063*
ATEN ? .001
.004 .000***
BUSY
+ .002 .055 .615
F value = 20.774; adj. R2 = .547; Sig. = .000 *, **, *** represent significance at the 10%, 5%, and 1% levels, respectively (two-tailed tests)

Journal of Finance and Accountancy
An examination of audit, Page 23
Table 7
CAA Audit Fee Model
Regression Results of the Partitioned Sample (Large and Small CAAs)
Regression Coefficients (Standard Error)
Variables
Hyp. Sign
Large CAAs
(n = 91)
Small CAAs
(n = 91)
Intercept 3.446** (1.56)
5.324* (1.127)
LnTOTAL + .434* (.097)
.255** (.078)
FINOPN + -.098 (.161)
-.237 (.179)
PRGOPN + -.282*** (.158)
.133 (.245)
RISK - .052 (.103)
.192 (.123)
REPCON + .196 (.151)
.122 (.136)
LnPRGMS + -.039 (.101)
.235** (.106)
UNIT ? -.074 (.442)
-.248 (.197)
FTEN - -.000 (.006)
-.009 (.006)
DOMNCE - .080 (.476)
-.331 (.385)
CPA ? -.081 (.116)
-.037 (.123)
BID - -.071 (.092)
-.054 (.105)
TYPE - -.416* (.136)
-.399** (.195)
ASIZE ? .067 (.138)
.065 (.254)
ATEN ? .012*** (.006)
.028* (.007)
BUSY
+ .038 (.090)
-.016 (.105)
F Value = 3.22 3.83
R2 = .372 .431 Adj. R2 = .257 .318
Sig. = .001 .000 *, **, ***represent significance at the 1%, 5%, and 10% levels, respectively (two-tailed tests)

Journal of Finance and Accountancy
An examination of audit, Page 24
Table 8
Summary of Regression Estimates (Reduced Model)
Regression Coefficients and (Standard Error)
LnFEE = α + β1 LnTOTAL + β2 FINOPN + β3 LnPRGMS + + β4 TYPE
+ β5 ASIZE + β6 ATEN + ε
Variables
Hyp. Sign
Coefficient
(Standard Error)
Intercept 3.973***
(.467) LnTOTAL + .359***
(.033) FINOPN + -.235***
(.088) LnPRGMS + .164***
(.059) TYPE - -.354***
(.089)
ASIZE ? .199*** (.092)
ATEN ? .001*** (.004)
F value = 57.40 R2 = .525 adj. R square = .515
*, **, ***represent significance at the 1%, 5%, and 10% levels, respectively (two-tailed tests) See Table 1 for a measurement and definitions of the variables.