Embed Size (px)
Citation preview

i
Audit Committee Effectiveness: Australia and Saudi Arabia
Ibrahim Al-Lehaidan B.Acc (King Saud) M.Acc (Gonzaga)
A thesis submitted in fulfilment of the requirements For the degree of
Doctor of Philosophy
School of Accounting and Finance Faculty of Business and Law
Victoria University
July 2006

ii
Declaration
I, Ibrahim Al-Lehaidan, declare that the PhD thesis entitled Audit Committee
Effectiveness: Australia and Saudi Arabia, is no more than 100,000 words in length,
exclusive of tables, figures, appendices, references, headers and footnotes. This thesis
does not include any material that has been submitted previously, in whole or in part,
for the award of any other academic degree. Except where otherwise stated, this thesis
is my own work.

iii
Abstract
The mere presence of the audit committee does not necessarily translate into an effective monitoring body. As a result, the search for mechanisms to enhance corporate governance and increase the quality of financial reports has mostly focused on the structure of audit committees.
This thesis empirically investigates whether there is an association between audit committee effectiveness (ACE) and the selection of a high quality auditor for both Australian and Saudi listed companies using their local guidelines to enhance ACE as benchmarks. In addition, the association between ACE and non-audit services (NAS) purchases is examined only for Australian listed company as providing such services by the incumbent auditors is not allowed for Saudi listed companies.
Moreover, this thesis also empirically examine the relationships between six audit committee characteristics, namely, independence, size, activity, charter, expertise and literacy and the selection of a high quality auditor for both Australian and Saudi listed companies. Also the relationships between the six audit committee characteristics and NAS purchases are empirically tested only for Australian listed companies.
While there was a positive (negative) association between ACE and the selection of a specialist auditor (the magnitude of NAS purchases) for the Australian Stock Exchange (ASX) listed companies, there was no association between ACE and the selection of a specialist auditor for the Saudi Stock Market listed companies. Because both countries have very similar recommendations regarding enhancing audit committee effectiveness, the findings of this thesis indicate that there are other factors such as different audit committee framework, different market development and cultural factors that might affect ACE.
In addition, the findings indicate that audit committee independence is the most important determinant of both audit quality and NAS purchases for the ASX listed companies. Because complying with audit committee recommendations is costly especially for small companies, which have limited resources, audit committee independence should have the priority when locating the limited resources.

iv
Acknowledgment
This thesis would not have been possible without the support and encouragement of
my family, advisors and friends. First and foremost I want to thank my wife, Nouf, for
her solid support. I am also grateful for my daughter, Yara, who made me forget all
the difficulties that I faced when I saw her smile. In addition, I want to thank my
parents, brothers and sisters for their encouragement.
I had outstanding supervisor, Dr. Robert Clift, and co-supervisor, Dr. Albie Brooks. I
am deeply grateful for their patience, guidance and support from the date that I started
my course until I submit my thesis.

v
Table of Contents
Chapter 1: Introduction
1.1 Introduction....................................................................................................1
1.2 Research Objectives.......................................................................................3
1.3 Research Motivations.....................................................................................4
1.4 Contribution to Knowledge............................................................................5
1.5 The Structure of the Thesis ............................................................................5
1.6 Summary ........................................................................................................7
Chapter 2: The Development of Audit Committees
2.1 Introduction....................................................................................................8
2.2 The Development of Audit Committees ........................................................9
2.2.1 The development of audit committees in the USA................................9
2.2.2 Development of Audit Committees in Canada ....................................18
2.2.3 Development of Audit Committees in the UK ....................................23
2.2.4 Development of Audit Committees in Australia .................................27
2.2.5 Audit committees in Saudi Arabia.......................................................31
2.3 Summary ......................................................................................................35
Chapter 3: literature review
3.1 Introduction..................................................................................................36
3.2 General Review............................................................................................37
3.2.1 Audit Committee Formation ................................................................37
3.2.2 Audit Committees Effectiveness (ACE)..............................................41
3.3 Roles of Audit Committees..........................................................................52

vi
3.3.1 Auditor Selection .................................................................................53
3.3.2 Auditor independence ..........................................................................60
3.4 Summary ......................................................................................................66
Chapter 4: Theoretical Framework
4.1 Introduction..................................................................................................67
4.2 Australia and Saudi Arabia Compared ........................................................67
4.2.1 Audit Committee Framework ..............................................................67
4.2.2 Market Development ...........................................................................70
4.3 Audit Committee Theories...........................................................................72
4.3.1 Agency Theory.....................................................................................72
4.3.2 Institutional Theory..............................................................................73
4.3.3 Actor-Network Theory.........................................................................75
4.3.4 Power Theory.......................................................................................76
4.4 Theoretical Framework................................................................................78
4.5 Hypotheses Development ............................................................................83
4.5.1 Independence .......................................................................................88
4.5.2 Size.......................................................................................................89
4.5.3 Activity ................................................................................................90
4.5.4 Charter..................................................................................................91
4.5.5 Expertise ..............................................................................................91
4.5.6 Financial Literacy ................................................................................92
4.6 Summary ......................................................................................................93
Chapter 5: Methodology

vii
5.1 Introduction..................................................................................................94
5.2 Brief Review of Research Approaches and Methods ..................................94
5.2.1 Quantitative Approach .........................................................................94
5.2.2 Qualitative Approach ...........................................................................95
5.3 Brief Review of Data Collection Techniques ..............................................96
5.4 The Research Approach in This Study ........................................................97
5.4.1 Research Methods................................................................................98
5.4.2 Questionnaire (Research Technique) .................................................100
5.4.3 Sample Selection................................................................................108
5.4.4 Research Design.................................................................................113
5.5 Summary ....................................................................................................131
Chapter 6: Descriptive Data Analysis
6.1 Introduction................................................................................................133
6.2 Descriptive statistics review ......................................................................133
6.3 Software Programs and Data Entry Validity Procedures...........................135
6.4 Descriptive Statistics for the Australian and Saudi Samples .....................135
6.4.1 Dependent Variables..........................................................................136
6.4.2 Test Variables ....................................................................................148
6.4.3 Control Variables ...............................................................................157
6.5 Summary ....................................................................................................169
Chapter 7: Empirical Analysis
7.1 Introduction................................................................................................171
7.2 Univariate Analysis....................................................................................171

viii
7.2.1 Correlation Analysis ..........................................................................171
7.2.2 Equality of Means Analysis ...............................................................176
7.3 Multivariate Analysis.................................................................................182
7.3.1 Main Regression Analysis .................................................................183
7.4 Additional Test...........................................................................................200
7.4.1 Audit Quality .....................................................................................200
7.4.2 NAS Purchases...................................................................................204
7.5 Summary ....................................................................................................208
Chapter 8: sensistivity tests
8.1 Introduction................................................................................................210
8.2 Reduced Samples .......................................................................................210
8.2.1 Audit Quality .....................................................................................210
8.2.2 NAS Purchases...................................................................................213
8.3 Different Periods of Time to Comply ........................................................214
8.3.1 Audit quality ......................................................................................215
8.3.2 NAS Purchases...................................................................................217
8.4 Alternative Proxy for Audit Quality ..........................................................219
8.4.1 Audit Committee Effectiveness .........................................................219
8.4.2 Audit Committee Characteristics.......................................................220
8.5 Alternative Methods for Identifying Specialist Auditors...........................221
8.5.1 AQ_Craswell......................................................................................222
8.5.2 AQ_Palmrose.....................................................................................225
8.6 Alternative Measure for the Composition of the Board.............................229

ix
8.6.1 Audit quality ......................................................................................229
8.6.2 NAS Purchases...................................................................................232
8.7 Omitting A Control Variable (IN_OWN)..................................................233
8.7.1 Audit Committee Effectiveness .........................................................234
8.7.2 Audit Committee Characteristics.......................................................235
8.8 An Additional Control Variable.................................................................236
8.8.1 Audit Committee Effectiveness .........................................................236
8.8.2 Audit Committee Characteristics.......................................................237
8.9 Alternative Measures of NAS Specialization ............................................238
8.9.1 NAS_Craswell ...................................................................................239
8.9.2 NAS_Palmrose...................................................................................241
8.10 Summary ....................................................................................................243
Chapter 9: Conclusion
9.1 Introduction................................................................................................244
9.2 Overview....................................................................................................245
9.3 The Principal Findings...............................................................................246
9.4 Recommendations of the Study .................................................................248
9.5 Limitations of the Study.............................................................................249
9.6 Future Research Opportunities ..................................................................251
9.7 Summary ....................................................................................................252
References..................................................................................................................253
Appendixes
Appendix 1:Questionnaire- English.......................................................................280

x
Appendix 2: Questionnaire- Arabic .......................................................................285

xi
List of Tables
Table 5-1 Advantages and disadvantages of questionnaire and interviews techniques
..............................................................................................................................99
Table 5-2 Pilot Study Response Rates .......................................................................102
Table 5-3 Questions classified according to different audit committee characteristics
............................................................................................................................104
Table 5-4 Classification of questionnaire’s questions in term of question’s style ....104
Table 5-5 the initial and final two sub-populations ...................................................110
Table 5-6 the Three Australian Samples Classified by the ASX 4-digit industry group
categories ...........................................................................................................111
Table 5-7 the SSM sample classified into five different sectors ...............................113
Table 5-8 Proxies, methods and regressions used to model audit quality .................118
Table 6-1 The Frequencies Using Auditor Size as a Proxy for Audit Quality ..........136
Table 6-2 Descriptive Statistics Using AQ_Continuous as a Proxy for Audit Quality
............................................................................................................................137
Table 6-3 Specialist Auditors in the ASX Industries Using AQ_Craswell at Three
Different Cut-off Points .....................................................................................139
Table 6-4 Specialist Auditors in the SSM Sectors Using AQ_Craswell at Three
Different Cut-off Points .....................................................................................140
Table 6-5 Frequencies Using AQ_Craswell for all the three cut-off points for the SSM
and ASX.............................................................................................................142
Table 6-6 Specialist Auditors in the ASX Industries Using AQ_Palmrose’s Three
Different Cut-off Points .....................................................................................144
Table 6-7 Specialist Auditors in the SSM Sectors Using AQ_Palmrose’s Three
Different Cut-off Points .....................................................................................145

xii
Table 6-8 Frequencies Using AQ_Palmrose for all the Three Cut-off Points for the
SSM and ASX....................................................................................................146
Table 6-9 Descriptive Statistics for NAS_RATIO, NAS Fees and Audit Fees for the
ASX Sample.......................................................................................................147
Table 6-10 Frequencies for Audit Committee Effectiveness for the SSM and ASX
Samples ..............................................................................................................148
Table 6-11 Frequencies for Audit Committee Independence for the SSM and ASX 149
Table 6-12 Frequencies for Audit Committee Independence for the SSM and ASX 150
Table 6-13 Descriptive Statistics for Audit Committee Size for the SSM and ASX
Samples ..............................................................................................................151
Table 6-14 Frequencies for Audit Committee Minimum Size for the SSM and ASX
Samples ..............................................................................................................151
Table 6-15 Descriptive Statistics for the Number of Audit Committee Meetings for
the SSM and ASX Samples ...............................................................................152
Table 6-16 Frequencies for Audit Committee Minimum Activity for the SSM and
ASX Samples .....................................................................................................154
Table 6-17 Frequencies for Audit Committee Charter for the SSM and ASX Samples
............................................................................................................................154
Table 6-18 Frequencies for Audit Committee Expertise for the SSM and ASX
Samples ..............................................................................................................155
Table 6-19 Frequencies for Audit Committee Literacy for the SSM and ASX Samples
............................................................................................................................156
Table 6-20 Descriptive Statistics for the Percentage of Non-executive directors For
the SSM and ASX..............................................................................................157
Table 6-21 Descriptive Statistics for Total Number of Directors and Total Number of
Non-executive directors for the SSM and ASX.................................................158

xiii
Table 6-22 Descriptive Statistics for Total Number and Percentage of Independent
directors on the Board for the ASX ...................................................................159
Table 6-23 Frequencies for the Minimum Percentage of Independent Directors on the
Board for the ASX .............................................................................................160
Table 6-24 Descriptive Statistics of management ownership for the ASX ...............161
Table 6-25 Descriptive Statistics of the Percentage of Leverage for the SSM and ASX
............................................................................................................................161
Table 6-26 Descriptive Statistics of the Percentage of New Funds for the SSM and
ASX....................................................................................................................162
Table 6-27 Descriptive Statistics of the Number of Business Segments for the SSM
and ASX.............................................................................................................163
Table 6-28 Descriptive Statistics of the Return on Total Assets for the SSM and ASX
............................................................................................................................164
Table 6-29 Descriptive Statistics of Sales for the SSM and ASX .............................165
Table 6-30 Descriptive Statistics of the Percentage of Foreign Sales for the SSM and
ASX....................................................................................................................166
Table 6-31 Descriptive Statistics of the Number of Geographical Segments for the
SSM and ASX....................................................................................................166
Table 6-32 Descriptive Statistics of the Number of Shareholders Blocks for the ASX
............................................................................................................................167
Table 6-33 Descriptive Statistics of the NAS specialization Using Continuous Method
for the ASX........................................................................................................168
Table 6-34 Frequencies of the NAS specialization Using Craswell and Palmrose
Methods for the ASX Sample ............................................................................169
Table 7-1 Correlations Matrix for the Saudi (SSM) Sample .....................................173
Table 7-2 Correlations Matrix for the Australian (ASX) Sample..............................175

xiv
Table 7-3 Equality of Means Using AQ_Continuous for the SSM ...........................177
Table 7-4 Equality of Means Using AQ_Continuous for the ASX ...........................179
Table 7-5 Equality of Means Using NAS Ratio for the ASX....................................181
Table 7-6 The Results of the Linear Regression Using AQ_Continuous and ACE for
the SSM and ASX samples ................................................................................184
Table 7-7 The Results of the Linear Regression Using squared residuals as the
dependent variable for the SSM (Parker test) ....................................................188
Table 7-8 The Results of the Linear Regression Using AQ_Continuous and ACCS for
the SSM and ASX..............................................................................................189
Table 7-9 The Results of the Linear Regression Using squared residuals as the
dependent variable for the SSM (Parker test) ....................................................194
Table 7-10 The Results of the Linear Regression Using NAS Ratio and ACE for the
ASX....................................................................................................................196
Table 7-11 The Results of the Linear Regression Using NAS Ratio and ACCS for the
ASX....................................................................................................................197
Table 7-12 The Results of the Linear Regression Using AQ_Continuous and ACE for
the ASXT and ASXNT ......................................................................................201
Table 7-13 The Results of the Linear Regression Using AQ_Continuous and ACCS
for the ASXT and ASXNT ................................................................................203
Table 7-14 The Results of the Linear Regression Using NAS Ratio and ACE for the
ASXT and ASXNT............................................................................................205
Table 7-15 The Results of the Linear Regression Using NAS ratio and ACCS for the
ASXT and ASXNT............................................................................................206
Table 8-1 The Results of the Linear Regression Using AQ_Continuous and ACE for
the RSM and RASX...........................................................................................211
Table 8-2 The Results of the Linear Regression Using AQ_Continuous and ACCS for
the RSM and RASX...........................................................................................212

xv
Table 8-3 The Results of the Linear Regression Using NAS ratio and ACE for the
Reduced ASX.....................................................................................................213
Table 8-4 The Results of the Linear Regression Using NAS ratio and ACCS and for
the Reduced ASX...............................................................................................214
Table 8-5 The Results of the Linear Regression Using AQ_Continuous, ACE, for the
ASX June ...........................................................................................................216
Table 8-6 The Results of the Linear Regression Using AQ_Continuous and ACCS for
the ASX June .....................................................................................................217
Table 8-7 The Results of the Linear Regression Using NAS ratio and ACE for the
ASX June ...........................................................................................................218
Table 8-8 The Results of the Linear Regression Using NAS ratio and ACCS and for
the ASX June .....................................................................................................219
Table 8-9 The Results of the Logistic Regression Using Auditor Size for the SSM and
ASX....................................................................................................................220
Table 8-10 The Results of the Logistic Regression Using Auditor Size and ACCS for
the SSM and ASX..............................................................................................221
Table 8-11 The Results of the Logistic Regression Using AQ_Craswell (10%, 20%
and 30%) and ACE for the SSM........................................................................222
Table 8-12 The Results of the Logistic Regression Using AQ_Craswell (10%, 20%
and 30%) and ACE for the ASX........................................................................223
Table 8-13 The Results of the Logistic Regression Using AQ_Craswell (10%, 20%
and 30%) and ACCS for the SSM .....................................................................224
Table 8-14 The Results of the Logistic Regression Using AQ_Craswell (10%, 20%
and 30% and ACCS for the ASX.......................................................................225
Table 8-15 The Results of the Logistic Regression Using AQ_Palmrose (10%, 15%
and 25%) and ACE for the SSM........................................................................226

xvi
Table 8-16 The Results of the Logistic Regression Using AQ_Palmrose (5%, 15% and
25%) and ACE for the ASX...............................................................................226
Table 8-17 The Results of the Logistic Regression Using AQ_Palmrose (5%, 15% and
25%) and ACCS for the SSM ............................................................................227
Table 8-18 The Results of the Logistic Regression Using AQ_Palmrose (5%, 15% and
25%) and ACCS for the ASX ............................................................................228
Table 8-19 The Results of the Linear Regression Using AQ_Continuous, ACE, and
BOR_IND for the ASX......................................................................................230
Table 8-20 The Results of the Linear Regression Using AQ_Continuous, ACCS and
BOR_IND for the ASX......................................................................................231
Table 8-21 The Results of the Linear Regression Using NAS ratio, ACE, and
BOR_IND for the ASX......................................................................................232
Table 8-22 The Results of the Linear Regression Using NAS ratio, ACCS and
BOR_IND for the ASX......................................................................................233
Table 8-23 The Results of the Linear Regression Using AQ_Continuous and ACE
without IN_OWN for the ASX ..........................................................................234
Table 8-24 The Results of the Linear Regression Using AQ_Continuous and ACCS
without IN_OWN for the ASX ..........................................................................235
Table 8-25 The Results of the Linear Regression Using AQ_Continuous and ACE
with the Additional Control Variable NAS_RATIO for the ASX.....................237
Table 8-26 The Results of the Linear Regression Using AQ_Continuous and ACCS
with the Additional Control Variable NAS_RATIO for the ASX.....................238
Table 8-27 The Results of the Linear Regression Using NAS ratio, ACE and
NAS_Craswell method at three different cut-off points for the ASX ...............239
Table 8-28 The Results of the Linear Regression Using NAS Ratio, ACCS and
NAS_Craswell Method at three different cut-off points for the ASX ...............240

xvii
Table 8-29 The Results of the Linear Regression Using NAS ratio, ACE and
NAS_Palmrose method at three different cut-off points for the ASX...............241
Table 8-30 The Results of the Linear Regression Using NAS Ratio, ACCS and
NAS_Palmrose method at three different cut-off points for the ASX...............242

xviii
List of Figures
Figure 1: the relationships between ACE and audit committee characteristics and both
Audit Quality and the magnitude of NAS Purchases...........................................85

Chapter 1: Introduction Victoria University
1
CHAPTER 1: INTRODUCTION
1.1 Introduction
Recent high profile corporate collapses worldwide (e.g., Enron Corp. and WorldCom
in U.S; HIH Insurance Group in Australia) have captured the attention of investors,
regulators and academics not only in countries that suffered from such corporate
collapses, but also in countries that have never experienced such crises. As a result,
more attention has been given to enhance corporate governance worldwide in order to
prevent or at least reduce the probability of the occurrence of financial failures and to
restore the confidence in capital markets after they were shocked by the collapse of
giant companies.
However, the search for mechanisms to enhance corporate governance and increase
the quality of financial reports has mostly focused on the structure of audit
committees. For example, Levitt (1998), the former US Securities and Exchange
Commission chairman (SEC), stated that:
“Qualified, independent and tough minded audit committees represent the
most reliable guardians of the public interest”.
In response to Levitt’s call and the public pressure, the Blue Robin Committee (BRC)
was formed by the New York Stock Exchange (NYSE) and the National Association
of Securities Dealers (NASD). The BRC issued 10 recommendations for
strengthening audit committee effectiveness (ACE).
A number of studies has investigated the efficacy of the BRC recommendations in
enhancing ACE. For example, Abbott et al. (2002) investigated the relationship
between ACE and financial reporting misstatements using the BRC recommendations
as benchmarks. They found that companies with an audit committee, which was
independent and active, were less likely to have financial reporting misstatements.
Their results support the BRC recommendations and provide indicators for the
efficacy of such recommendations in enhancing audit committee ability to discharge
its duties effectively.

Chapter 1: Introduction Victoria University
2
In Australia, the ASX Corporate Governance Council (ASX CGC) was formed on 15
August 2002, bringing together 21 groups from disparate business backgrounds and
carrying the varying aims and priorities that accompany those constituencies
(Australian Stock Exchange Corporate Governance Council 2003).
In March 2003, the ASX adopted the new principles and recommendations of the
ASX CGC aimed at improving corporate governance, in general, and audit
committees, in particular, to ensure the integrity of financial reports (Australian Stock
Exchange Corporate Governance Council 2003).
On the other hand, the Saudi Ministry of Commerce (SMC) issued its first regulation
and a set of recommendations regarding audit committees in 1994 aimed at
strengthening audit quality and the integrity of financial reports (Saudi Ministry of
Commerce 1994). The Saudi market has not yet experienced any corporate collapses.
However, very limited research has been done to evaluate ACE in Australia and Saudi
Arabia using their own set of principles and recommendations as benchmarks. As a
result, very little is known about the efficacy of such principles and recommendations
in these two countries.
This study is focused on the audit committee's roles in auditor selection and protection
of auditor independence by limiting NAS purchases because of two reasons. First, a
number of researchers, regulators and professional bodies (e.g., Birkett 1986, Braiotta
1994, SMC 1994, Blue Robin Committee 1999, Ramsay 2001, Australian Stock
Exchange Corporate Governance Council 2003) has considered the nomination and
selection of external auditors and the protection of their independence to be the
primary responsibilities of the audit committee. Second, independent audit committee
members have incentives to protect their reputational capital by assuming significant
responsibility for the engagement of the audit firm and the protection of its
independence (Fama and Jensen 1983).
As a result, this study investigates the efficacy of the ASX CGC and SMC best
practices and recommendations regarding audit committees in the context of auditor
selection. In addition, only the efficacy of the ASX best practices and
recommendations regarding audit committee in the NAS purchases will be evaluated
because providing NAS is not allowed for incumbent auditors in Saudi Arabia.
Chapter 1: Introduction Victoria University
3
It should be noted that NAS purchases throughout this thesis include only NAS
purchases from the incumbent auditor.
This introductory chapter presents the rationale and the basis for this thesis. This
chapter is divided into five sections. Section 1 presents the research objectives. In
Section 2, a number of motivations that justify the conduct of this study are provided.
Section 3 identifies the contribution to knowledge of this study. In Section 4, the
structure of this thesis will be presented briefly. Finally, Section 5 provides a short
summary for this chapter.
1.2 Research Objectives
In order to evaluate the efficacy of the ASX CGC and SMC best practices and
recommendations regarding audit committees in the context of auditor selection and
the efficacy of the ASX best practices and recommendations in the context of NAS
purchases, the following primary objectives must be achieved using such best
practices and recommendations as benchmarks.
• Investigate the association between audit committee effectiveness (ACE) and
the auditor selection process for Australian and Saudi listed companies
• Determine which audit committee characteristic is the most important
determinant of audit quality for Australian and Saudi listed companies.
• Investigate the association between ACE and the magnitude of NAS
purchases for Australian listed companies only because providing such
services are not allowed for incumbent auditors in Saudi Arabia.
• Determine which audit committee characteristic is the most important
determinant of the magnitude of NAS purchases for Australian listed
companies only.
Moreover, despite the fact that the ASX CGC and SMC best practices and
recommendations aimed at improving ACE are quite similar in their requirements and
their aims, differences in audit committee frameworks and market developments still
exist between Australia and Saudi Arabia.

Chapter 1: Introduction Victoria University
4
Therefore, by comparing the results of the determinants of audit quality between
Australia and Saudi Arabia, the differences in audit committee frameworks and
market developments between the two countries could be used as possible
explanations for any mixed results.
1.3 Research Motivations
A number of motivations justify the importance of this research. First, it will be the
first study- to my knowledge- that evaluates the efficacy of the ASX CGC and SMC
best practices and recommendations in the context of auditor selection. Second, it will
be the first study- to my knowledge- that evaluates the efficacy of the ASX CGC best
practices and recommendations in the context of NAS purchases.
Third, it will be the first study– to my knowledge – that uses six different audit
committee characteristics to evaluate ACE in the context of auditor selection and
NAS purchases as most of the prior studies used only two or three audit committee
characteristics. For example, while Abbott and Parker (2000) used only audit
committee independence and activity to examine the impact of having effective audit
committee on audit quality, Chen et al (2005) used audit committee independence,
activity and expertise to examine the same issue.
Fourth, it will be the first study– to my knowledge – that uses the term “ independent
directors” instead of the term “non-executive directors” to identify audit committee
independence to examine the association between ACE and the auditor selection
process. Prior studies ignored the area of grey directors who are not executive
directors, but have a direct or indirect interest with the company when determining the
independence of the audit committee. For example, Abbott and Parker (2000) and
Chen et al (2005) considered an audit committee to be independent if all its members
were non-executive directors ignoring the presence of grey directors in such
committee.
Finally, it will be the first study– to my knowledge – that identifies the most
important determinant of audit quality and NAS purchases among the six audit
committee characteristics examined by comparing the coefficients of the significant
audit committee characteristics. This will be very useful especially for small firms that

Chapter 1: Introduction Victoria University
5
lack the availability of sufficient resources to meet all the best practices and
recommendations regarding audit committees because it will help such firms to
allocate their limited resources to the most important determinants of audit quality and
NAS purchases.
1.4 Contribution to Knowledge
Kalbers and Fogarty (1993) reported that little empirical research has been conducted
to investigate ACE and concluded that the evidence collected to date was weak. In
addition, Collier (1996) and Collier and Gregory (1999) argued that the evidence
collected on audit committee effectiveness is limited.
Consequently, the research into ACE within Australian and Saudi listed companies in
the context of auditor selection and NAS purchases will contribute to the existing
ACE literature in different ways. First, this study will examine some audit committee
characteristics, namely, audit committee size, charter, expertise and literacy, which
have never been investigated before, in their relationship to audit quality and NAS
purchases in Saudi Arabia. Prior studies used only audit committee independence and
activity to investigate the relationships between these variables and both auditor
selection and NAS purchases (e.g., Abbott and Parker 2000; Abbott et al. 2003 and
Chen et al. 2005).
Second, this study will evaluate the influence of having different audit committee
frameworks and market developments on ACE in the context of auditor selection by
comparing the results of the two countries as both countries have almost similar best
practices and recommendations regarding audit committees.
Finally, this study has the potential to contribute further to the ACE literature through
the database that will be developed especially for Australian listed companies. This
database could be used to study other issues and could be used by others to study
similar issues.
1.5 The Structure of the Thesis
This thesis has nine chapters including this introduction. Chapter 2 reviews audit
committee developments over-time for a number of different countries including the

Chapter 1: Introduction Victoria University
6
US, UK, Canada, Australia and Saudi Arabia. Chapter 3 presents a review of the audit
committee literature in general and ACE literature in particular. In addition, this
chapter focuses on the audit committee literature related to the auditor selection and
controlling NAS purchases. Finally, a number of gaps in ACE literature will be
identified and six research questions will be stated.
Chapter 4 identifies the differences between Australia and Saudi Arabia in terms of
audit committee frameworks and market developments. Moreover, audit committee
theories are reviewed and the advantages and disadvantages of such theories are
discussed. Furthermore, the theoretical framework of this study is developed and
presented in Figure 4.1. Finally, 14 different hypotheses that will be tested in this
study will be developed and stated.
Chapter 5 focuses on the methodology adopted in this research and provides
justification for the use of specific research methods and data collection techniques. In
addition, dependent, independent and control variables will be defined and
operationalized. Finally, a number of regressions that will be conducted to examine
the hypotheses of this study will be presented and discussed.
Chapter 6 presents the descriptive data analysis for the full Australian and Saudi
samples. In Chapter 7, the univariate and multivariate analysis will be presented and
discussed in detail. The univariate analysis explores the presence of multicollinearity
by examining the correlations among the independent variables (correlation analysis).
In addition, the univariate analysis uses the t-test of two-independent samples
(groups) to identify if the differences in means between two-independent groups occur
only by chance or not. This chapter presents the main regression analysis that will be
used to test the hypotheses of this study. The main regression analysis is divided into
two parts. While Part 1 models audit quality and explores the determinants of such
quality, Part 2 investigate the determinants of the magnitude of NAS purchases.
Finally, an additional test to examine the impact of having different compliance
requirements for companies within the ASX on the results of the main regression
analysis is provided.
Chapter 8 presents a number of sensitivity tests that should be performed to insure
that the results of the main regression analysis in Chapter 7 were not driven by

Chapter 1: Introduction Victoria University
7
changing a number of factors that might affect such results. Finally, Chapter 9
provides a summary of the most important findings for this study. In addition, a
number of recommendations, limitations and future research opportunities has been
identified and discussed in this chapter.
1.6 Summary
The increased number of corporate collapses in the last few years (e.g., Enron Corp.
and WorldCom in U.S; HIH Insurance Group in Australia) put pressure on regulators
and academics to find ways to improve corporate governance mechanisms in general
and audit committee in particular. As a result, both the ASX CGC and SMC issued
the best practices and recommendations aimed to improve ACE.
The aim of this study is to evaluate the efficacy of the ASX CGC and SMC best
practices and recommendations in the context of auditor selection and to explore the
efficacy of ASX CGC best practices and recommendations in the context of the
magnitude of NAS purchases.
In addition, a number of research objectives, motivations and contributions to
knowledge were identified and discussed. Finally, the organization of this thesis was
reviewed in this chapter.

Chapter 2: The Development of Audit Committees Victoria University
8
CHAPTER 2: THE DEVELOPMENT OF AUDIT COMMITTEES
2.1 Introduction
Audit committees are an essential element of corporate governance (Green, 1994). In
defining an audit committee emphasis is usually placed on its composition and
functions. For instance, Canadian Institute of Chartered Accountants (CICA, 1992:
20) defined audit committee as:
“A committee of directors of an organization whose specific responsibility is
to review the annual financial statements before submission to the board of
directors. The committee generally acts as liaison between the auditor and the
board of directors and its activities may include the review of nomination of
the auditor, overall scope of the audit, results of the audit, internal financial
controls, and financial information for publication”
In the view of Marrian (1988: 2), it is:
“A committee of the board normally comprising three to five directors with no
operating responsibility in financial management. Its primary tasks are to
review the financial statements, the effectiveness of the company’s accounting
and internal control systems, and the findings of the auditors, and to make
recommendations on the appointment and remuneration of the external
auditors”
According to Rickard (1993: 35):
“An audit committee consists of a group of senior staff, chaired by the chief
executive officer or his deputy. The committee’s responsibility is to safeguard
the independence of the internal audit function and ensure continual
improvement in management performance and accountability by seeking
action on internal audit and external audit reports”
All the above definitions agree that an audit committee is a sub-committee of the main
board of directors of a company, usually formed from non-executive directors, and

Chapter 2: The Development of Audit Committees Victoria University
9
charged with matters relating to financial reporting, internal control systems and audit
and to act as a link between the board of directors, internal and external auditors.
Similarly, Dilworth (1989) argued that audit committees are one mechanism through
which auditors are held accountable for the scope, nature and quality of their work.
Audit committees can thus exert a powerful influence on auditors through their role in
conducting a specific inquiry into the scope, nature and quality of the audit work
done.
2.2 The Development of Audit Committees
In recent years, the accounting profession, users of financial statements and the
government have expressed concern over the incidence of fraudulent financial
reporting. One response on the part of companies to this concern has been the
establishment of audit committees (McMullen 1996).
A historical review of the development of audit committees in the US, Canada, the
UK, Australia, and Saudi Arabia will highlight the importance of such committees to
ensure reliable, high quality financial reporting and thus by implication the need for
an effective audit committee to enhance the integrity of companies’ financial reports.
2.2.1 The development of audit committees in the USA
McKee (1979) claimed that prior to the rise of the auditing profession in the United
States, committees such as the audit committee of the East Tennessee and Western
North Carolina Railroad frequently handled the auditing task in 1870. On 28 February
1870, shareholders of the ET&WNCRR appointed a special committee, which was
required to inspect the accounts of the offices of the Board of Directors of the
company and report at the next meeting (McKee 1979). The author remarked that this
might be one of the earliest documented instances in the United States of an audit
committee reporting to the board of directors of a corporation.
However, the concept of audit committees and their responsibilities have evolved
dramatically since they were first proposed in the late 1930s. This concept is not new
as, according to Birkett (1986) audit committees first attracted attention in the early
1930s when the SEC and New York Stock Exchange (NYSE) encouraged their
establishment after the McKesson and Robbins case. Rittenberg and Nair (1994)

Chapter 2: The Development of Audit Committees Victoria University
10
however pointed out that audit committees were first proposed by the American
Institute Certified of Public Accountants (AICPA) as early as 1937 and have been
endorsed by the SEC since 1940.
One interesting trend uncovered during a review of relevant literature suggests that, in
all of the countries where they have become established, audit committees have been
stimulated by unexpected company failures and/or corporate malpractice (Vanasco,
1994; Guthrie and Turnbull, 1995; Wolnizer, 1995; Teoh and Lim, 1996; Porter and
Gendall, 1998).
In addition, Green (1994) noted that corporate audit committees have developed and
evolved as a result of dissatisfaction with methods of corporate governance.
Abdolmohammadi and Levy (1992) point out that audit committees have been under
pressure to accept increasingly higher levels of responsibility over the past decade
because of the increasing public pressure for greater corporate accountability.
The volume of research on audit committees is more in the US than in other countries.
Perhaps, this is due to the fact that the history of audit committees in the United States
is longer than elsewhere (Spira 1999). During the 1970s, the role of audit committees
received a great deal of attention because of demands for greater corporate
accountability and governance. In view of the increasing size of corporations and the
separation of ownership and management, shareholders and other constituencies
needed more assurance with respect to the integrity of the internal and external
auditing process and the financial reporting process (Spangler and Braiotta, 1990).
In addition, Woolf (1997) mentioned that the appointment of an audit committee is an
important development intended to enhance the communication between the board of
directors and both the internal and external auditors. It is widely accepted that the idea
of audit committees as discussed by Cadbury Committee (1992) derived from North
American experience (Collier, 1996).
The SEC has supported the establishment of audit committees for many years and has
strongly recommended that its registrants establish audit committees since the early
1940s (Birkett, 1986). Although the term “audit committee” had not been used yet,
the SEC discussed the need to establish a specific group, composed of non-executive
directors, to take on specific functions such as the selection of external auditors. The

Chapter 2: The Development of Audit Committees Victoria University
11
SEC decided not to make this a requirement because it would have placed a large
burden on small companies (Abdolmohammadi and Levy, 1992).
The first reference to this special group of directors is found in Accounting Series
Release No. 19 (ASR No. 19), in the Matter of Mckesson & Robbins, Inc (Reinstein
and Luecke, 2001). In that ASR, the SEC recommended using audit committees to:
• Oversee the performance of internal and external auditors;
• Facilitate the organization’s relationship with the external audit firm;
• Coordinate the financial audit;
• Negotiate audit fees; and
• Improve the financial reporting process.
In addition, in response to the McKesson & Robbins case, the NYSE also
recommended that a special committee of the board composed of directors who are
not officers of the company select the external auditors (Maassen 2004).
However, audit committees did not receive much attention until the late 1960s and
1970s (Collier, 1996; Kalbers and Fogarty, 1998). Williams (1977) noted that in July
1967 the Executive Committee of the American Institute of Certified Public
Accountants (AICPA) recommended that all publicly owned companies should have
audit committees composed of non-executive directors with whom the external
auditors could communicate whenever a significant question having a material effect
on the company’s financial reports could not be resolved at the management level.
A survey by Mautz and Neumann (1970) showed that 32 percent of the corporations
responding had audit committees. The Bar Chris Case in 1968 and the post-
Watergate findings in the early 1970s resulted in the audit committees being
promoted once again to increase confidence in financial reporting (Solomon 1978). In
response, the SEC issued Accounting Series Release No. 123 (SEC 1972) titled
Standing Audit Committees Composed on Non-executive Directors, which stated.
“…SEC endorses the establishment by all publicly held companies of audit
committees composed of non-executive directors …to assist in providing the

Chapter 2: The Development of Audit Committees Victoria University
12
greatest possible protection for investors who rely on such financial
statements”
The NYSE issued a White Paper in 1973 that contained a similar recommendation
(Rittenberg and Nair, 1994). Rittenberg and Nair (1994) noted that the White Paper
viewed the audit committee as a necessary corporate mechanism instead of being only
a corporate luxury.
In the 1970s, massive financial disclosure problems at companies such as Lockheed
and Penn Central created a debate as some blamed financial accounting irregularities
on too-familiar relationships between corporate boards and outside auditors (Solomon
1978). To mitigate the problem, The US Congress passed the Foreign Corrupt
Practice Act of 1977, and securities exchanges adopted rules requiring a corporate
board to have an independent audit committee (Abdel-Khalik 1983). This Act also
imposed a statutory liability on directors of quoted companies to maintain adequate
internal control systems.
In the light of the increased scandals in the late 1970s and early 1980s, the voluntary
adoption of audit committees in US public companies has increased dramatically (Al-
Moataz 2003). Kalbers and Fogarty (1998) found that the percentage of firms with
audit committees has gone from nearly ten percent in 1958 to nearly forty percent in
1972 and to over ninety percent in 1982.
Commission on Auditor’s Responsibilities (1978) emphasized the importance of audit
committees and independent directors in achieving a proper balance between the
auditor and management and in protecting the shareholders' interest.
In 1985, five sponsoring private sector organisations, namely, AICPA, American
Accounting Association, National Association of Accountants, Institute of Internal
Auditors, and Financial Executive Institute created the Independent National
Commission on Fraudulent Financial Reporting (NCFFR), commonly known as the
Treadway Commission (Cottell and Rankin, 1988).
Rezaee and Lander (1993) noted that during the approximately two years span
between the commission’s formation and the release of its final recommendations, the

Chapter 2: The Development of Audit Committees Victoria University
13
Treadway Commission reviewed dozens of studies that were conducted by major
universities and organisations. These studies focused on the areas of lawsuits brought
against auditors, management, and companies for business failures and fraudulent
activities, the role of the SEC in financial reporting, corporate codes of conduct,
accounting education, opinion shopping, audit committees, quality assurance, and
many other areas.
Although most groups had made recommendations on the establishment and general
composition of the audit committee, The Report by the Treadway Commission (1987)
was the first to provide specific guidelines on the roles and structure of audit
committees. The Treadway Commission’s Report offered 11 specific
recommendations designed to enhance the effectiveness of audit committees:
1. Audit committees should have adequate resources and authority to discharge
their responsibilities.
2. Audit committees should be informed, vigilant, and effective overseers of the
company’s financial reporting process and its internal control system.
3. Audit committees should review management’s evaluation of the
independence of the company’s public accountants.
4. Audit committees should oversee the quarterly as well as the annual reporting
process.
5. The SEC should mandate the establishment of an audit committee composed
solely of independent directors in all public companies.
6. The SEC should require committees to issue a report describing their
responsibilities and activities during the year in the company’s annual report to
shareholders.
7. A written charter for the committee should be developed. The full board
should approve, review, and revise it when necessary.
8. Before the beginning of each year, audit committees should review
management’s plan to engage the company’s independent public accountant to
perform management advisory services.
9. Management should inform audit committees of any second opinions sought
on significant accounting issues.

Chapter 2: The Development of Audit Committees Victoria University
14
10. Together with top management, the audit committee should ensure that the
internal auditing involvement in the entire financial reporting process is
appropriate and properly co-ordinated with the independent auditor.
11. Annually, audit committees should review the program that management
establishes to monitor compliance with the company’s code of ethics.
This report further recommended that all public companies be required by the SEC to
establish audit committees composed solely of non-executive directors. However, the
SEC did not respond to such recommendation (Solomon 1978). The release of the
Treadway Report positioned the audit committee as the “keystone” of corporate
financial governance (Vanasco, 1994).
Furthermore, the National Association of Securities Dealers Automated Quotations
(NASDAQ) adopted a requirement in 1989 that audit committees should be
established and the majority of the members of which shall be independent directors
(Rittenberg and Nair, 1994).
DeZoort (1997) noted that a number of the US stock exchanges reacted quickly to the
heightened interest in boards of directors and audit committees. The NYSE mandated
audit committees for companies traded on its exchange in 1978. In 1989, the National
Association of Securities Dealers joined the NYSE in requiring audit committees for
companies listed on NASDAQ/NMS.
The American Stock Exchange (AMEX), while not requiring audit committees for its
listed companies, began in 1979 to strongly recommend audit committees with
members that are independent of management.
In 1989, the AICPA established a requirement for external auditors to communicate
formally with audit committees as a standard part of the audit (DeZoort 1997). This
movement toward the establishment of audit committees, as Cottell and Rankin
(1988) described, is largely the result of institutional pressures on corporations both to
strengthen corporate governance and to enhance the external auditor’s independence
and performance.
During the 1990s, as some companies increasingly began to manage their financial
disclosures, the practice prompted some to question the integrity of financial

Chapter 2: The Development of Audit Committees Victoria University
15
statements. The SEC Chairman, Levitt (1998), addressed this concern in his well-
known speech “The Numbers Game”. He called for a committee to examine the
financial reporting system. As a result, The SEC encouraged the NYSE and the
NASD to form a private sector body to investigate the problems the SEC perceived.
On October 1998 the NYSE and the NASD formed the Blue Robin Committee (BRC)
on improving the effectiveness of corporate audit committees. The objective of this
Committee was to evaluate U.S. corporate financial reporting and specifically to
assess the current mechanisms for oversight and accountability among corporate audit
committees, independent auditors, and financial and senior management (Millstein,
1999).
The Committee highlighted that audit committee disclosures should be an important
part of a firm’s financial disclosures (Hurtt et al, 1999). The Committee issued a
report known as the BRC Report in February 1999 (Blue Robin Committee, 1999).
The Report provided ten recommendations aimed at improving the audit committee
effectiveness. These recommendations are grouped in three general categories to
enhance the process through which the audit committee carries out its duties
(Millstein, 1999; Reinstein and Luecke, 2001):
1) Strengthening the independence of the audit committee;
2) Making the operation of the audit committee more effective; and
3) Improving the mechanisms for discussion and accountability among the audit
committee, the outside auditors, and the management.
As such, audit committee disclosures are an important part of a company’s financial
disclosures. On 10 January 2000, the SEC adopted Release No. 34.42266 titled “Audit
Committee Disclosure”, which required that companies include in their proxy
statements certain disclosures about their audit committees (SEC 2000). These
required disclosures included whether the committee had:
Reviewed and discussed the audited financial statements with management;
Discussed with the external auditor the matters required to be discussed by
Statement on Auditing Standards No. 61 (American Institute of Certified
Public Accountants, 1981); and

Chapter 2: The Development of Audit Committees Victoria University
16
Received from the external auditor the disclosures required by Independence
Standard Board’s Standard No. 1 and discussed with the external auditor the
auditor’s independence.
In addition, The Release required audit committees to disclose within the “annual
proxy statement” whether the board of directors has adopted a written charter for the
audit committee. If such a charter does exist, the company is required to include a
copy of the charter as an appendix to the company’s proxy statement at least once in
every three years.
In 2001, the collapse of Enron Corp, the biggest in the corporate history of the United
States, has captured the attention of regulators, professional bodies and investors and
has rekindled the debate on corporate accountability and raised fears that the
corporate system in the US is rotting at its core (Sridhar 2002).
As a result, the US Congress passed legislation, the Sarbanes-Oxley Act (2002) that
establishes many new requirements, including those governing the composition and
responsibilities of audit committees. Most observers would agree that the Sarbanes-
Oxley Act 2002 is the single most important piece of legislation affecting corporate
governance, financial disclosure and the practice of public accounting since the US
securities laws of the early 1930s (PriceWaterhouseCoopers 2002).
In this Act, special attention was given to the audit committee as one of the most
important corporate mechanisms to enhance the integrity of financial reports. In
Section 301, the following requirements are recommended:
• Each member of the audit committee shall be a member of the board of
directors, and shall otherwise be independent.
• The audit committee shall be directly responsible for the appointment,
compensation, and oversight of the work of the external auditor.
• The audit committee shall establish procedures for the "receipt, retention, and
treatment of complaints" received by the firm regarding accounting, internal
controls, and auditing.
• Each audit committee shall have the authority to engage independent counsel
or other advisors, as it determines necessary to carry out its duties.

Chapter 2: The Development of Audit Committees Victoria University
17
• Each firm shall provide appropriate funding to the audit committee.
In addition, Section 407 required that the SEC issue rules to require public companies
to disclose whether at least one member of its audit committee is a financial expert.
On 24 January 2003, the SEC adopted Release Nos. 33-8177; 34-47235 titled
“Disclosure Required by Sections 406 and 407 of the Sarbanes-Oxley Act of 2002”
requiring public companies, other than registered investment companies, to disclose in
the annual report whether they have at least one audit committee financial expert
serving on the audit committee and whether such person is independent (SEC 2003a).
In addition, the Release indicated that if the issuer does not have an audit committee
financial expert serving on the audit committee, the issuer must explain why it does
not.
On 10 April 2003, the SEC adopted Release Nos. 33-8220; 34-47654 titled
“Standards Relating to Listed Company Audit Committees” directing the national
securities exchanges and national securities associations such as the NYSE and
NASDAQ Stock Markets to prohibit the listing of any firm that is not complying with
the audit committee requirements established by Sarbanes-Oxley Act (SEC 2003b).
The rule applies to public companies that have their stock listed on a national
securities exchange or on an automated inter-dealer quotation system of a national
securities association (e.g., NASDAQ National or SmallCap Markets). Moreover, the
SEC recently adopted another rule that requires audit committees in public companies
to pre-approve all permissible non-audit services provided to the issuer by the auditor
(SEC 2003c). This final rule will apply to the provision of non-audit services by the
auditor beginning on 6 May 2003.
In summary, the story of audit committees started in the US in the 1940s when both
the SEC and the NYSE recommended the establishment of audit committees as a
means to protect investors and other interested parties. In the 1960s and 1970s,
recommendations regarding the establishment of audit committees continued to be
made by the SEC, NYSE and professional bodies such as AICPA. The Treadway
Commission (1987) was the first to provide specific guidelines on the roles and
structure of audit committees. In 1999, the BRC issued its recommendations that

Chapter 2: The Development of Audit Committees Victoria University
18
aimed at improving the effectiveness of audit committees as one of the most important
corporate governance mechanisms.
These recommendations have later been adopted by the SEC and major stock
exchanges such as the NYSE and NASDAQ. Subsequent to the collapse of Enron
(2001), the first legislation regarding audit committees was introduced by the US
Congress (Sarbanes-Oxley Act 2002), which required all public companies to
establish audit committees and recommended that the SEC introduces new listing
rules that will lead to more disclosures regarding audit committees. Most recently, the
SEC adopted such recommendations and issued a number of releases such as Release
No. 33-8220 (SEC 2003b).
2.2.2 Development of Audit Committees in Canada
In Canada, the pressure for audit committees arose from corporate collapses in the
mid 1960s. The bankruptcy of Atlantic Acceptance Corporation Limited in 1965,
which was a major event in the history of accounting in Canada, has been equated to
the McKesson & Robbins Case in the United States (Green, 1994). This event had
considerable repercussions for Canadian financial practices (Green, 1994; Collier,
1996) and led to the issuance of the Canadian Royal Commission Report in 1965,
which recommended that all public companies should establish an audit committee.
In 1967, the Lawrence Commission, an Ontario Select Committee on Company Law,
recommended that the establishment of an audit committee should be mandatory for
all public companies (Canadian Institute of Chartered Accountants 1981). The
Lawrence Committee Report concluded that audit committees would make it easier
for auditors to retain their independence with clients, and this report identified the
audit committee as an important communication link between the auditor and the
board of directors (Canadian Institute of Chartered Accountants 1981).
The Ontario Business Committees Corporation Act 1970 introduced legislation that
made audit committees mandatory for all public companies (Vanasco 1994). Basically
this Act sets out:
• Composition of the committee and chairman;
• The fact that the committee is to be elected annually;

Chapter 2: The Development of Audit Committees Victoria University
19
• Review function of committee prior to accounts being presented to the full
board;
• Auditor’s position including the right to appear, to be heard, and to attend
when required; and
• Auditor’s right to have the chairman of the audit committee convene a
meeting to consider matters the auditor feels should be brought to the attention
of the board of directors or shareholders.
In 1971, the Canadian Central Government adopted the legislation of the Ontario
Business Committees Corporation Act 1970 (Solomon 1978). This Act was amended
in 1975 to require all public companies to have an audit committee whose duty is to
approve the financial statements prior to the submission to the main board of directors
for approval. In 1978, Adams Report made further recommendations with respect to
the responsibilities of the audit committees (Vanasco 1994).
In 1986, the Macdonald Commission, established by the CICA, concluded that one
way of increasing the auditor's leverage with regard to management was to strengthen
the performance of the audit committee. In 1988, the Macdonald Commission
released the report entitled “ Macdonald Report”, which made several
recommendations regarding audit committees (Macdonald Commission 1987), which
include:
• All public companies should establish an audit committee composed primarily
of non-executive directors;
• Audit committees should report annually to shareholders;
• Audit committees should review both the interim and annual financial
statements prior to publication.
Another significant contribution to audit committee development came with the
release of a Notice on Audit Committees in 1990 by the Canadian Securities
Administrators (Hansell 2002). It dealt not only with issues of independence and the
conduct of audit committees, but also addressed the mandate of the audit committee in
considerable detail. For example, it recommended that the audit committee review

Chapter 2: The Development of Audit Committees Victoria University
20
non-audit engagements between the corporation and the external auditor and consider
the impact of those engagements on the auditor's independence.
The Bank Act, the Trust and Loan Companies Act and the Insurance Companies Act
were all amended in 1992 to ensure that the audit committee be composed of at least
three non-executive directors of whom none should be officers or employees of the
company or its subsidiaries. These Acts also set out specific duties and responsibilities
for such committees, which include:
• Reviewing annual financial statements prior to board approval;
• Ensuring that appropriate internal control is used;
• Meeting with external auditors to discuss the financial statements or any
matters that may affect the company; and
• Meeting with chief internal auditors and management to discuss the
effectiveness of control procedures.
In 1993, the Toronto Stock Exchange (TSX) established a Committee on Corporate
Governance, which aimed at improving corporate governance to enhance the integrity
of the market (Hansell 2002). In December 1994, the Committee released the report
entitled “Where Were the Directors?” also known as the “Dey Report” (Toronto Stock
Exchange 1994). This Report proposed fourteen guidelines for corporate governance.
For, fiscal years ending on or after 30 June 1995, the TSX has implemented a
requirement that TSX-listed firms report on their corporate governance system and on
whether their system was accordance with the fourteen guidelines.
The TSX guidelines suggest that a firm’s board of directors should assume
responsibility for stewardship, including strategic planning, risk management and
internal control. The guidelines also suggest that the board of directors should be
constituted with a majority of independent directors and that the firm should disclose
whether the majority of the board members are independent. In addition, the
guidelines discuss orientation and training for new board members, compensation
committees, the composition and responsibilities of audit committees and related
matters. However, the implementation of such guidelines was voluntary.

Chapter 2: The Development of Audit Committees Victoria University
21
As a follow-up to the Dey Report, the TSX and the Institute of Corporate Directors
(ICD) surveyed senior executives of TSX-listed firms in 1998 to assess how much
progress had been made in improving the quality of corporate governance since the
release of the Dey Report (Hansell 2002). In June 1999, the results of this survey were
released in the report entitled “Report on Corporate Governance, 1999: Five Years to
the Dey” (Hansell 2002).
Moreover, the extent of compliance with the TSX corporate governance guidelines
was evaluated by the authors by reviewing the corporate governance disclosures of all
300 TSX firms for the 1997 fiscal year. Results indicated that 94 percent of TSX 300
firms made corporate governance disclosures as required by the TSX. However, the
quantity and the quality of the disclosures made varied widely.
In October 1999, responding to one of the recommendations arising out of that survey,
the TSX amended its corporate governance disclosure requirements (Bujaki and
McConomy 2002). For years ending on or after 31 December 1999, TSX-listed firms
are required not only to describe their approach to corporate governance on an annual
basis, but also to specifically address each of the fourteen guidelines. The impact of
this change can be seen most readily in the expanded corporate governance disclosure
sections in the 1999 annual reports of many TSX-listed companies (Bujaki and
McConomy 2002).
In July 2000, the TSX, the Canadian Venture Exchange (CDNX) and the CICA
established the Joint Committee on Corporate Governance (JCCG) (Bujaki and
McConomy 2002). The objective of such committee is to review the current state of
corporate governance in Canada, compare Canadian and international best practices
and make recommendations for changes that will ensure Canadian corporate
governance is among the best in the world. In November 2001, the JCCG issued its
final report “ Beyond Compliance: Building a Governance Culture” (Joint Committee
on Corporate Governance 2001).
This report focuses on three key issues that go beyond compliance and are
fundamental to building a healthy governance culture. These are:
1. Measures that can be taken to strengthen the capacity of the board to engage in
a mature and constructive relationship with management – one that is

Chapter 2: The Development of Audit Committees Victoria University
22
grounded in a mutual understanding of respective roles and the ability of the
board to act independently in fulfilling its responsibilities.
2. The critical role that the board must play in choosing the CEO of the company,
in actively contributing to the company’s strategic direction, approving a
strategic plan and monitoring performance against agreed benchmarks.
3. Particular issues that independent directors must face in corporations that have
significant shareholders.
It also contains fifteen practical recommendations aimed at raising the standard of
quality in practice of corporate governance in Canada and improving the effectiveness
of governance in Canadian public corporations (Stevenson et al 2002). It proposed
modifications to the TSX disclosure requirements and governance guidelines that
were introduced in 1995 following the recommendations of the Dey Report. The new
modified disclosure requirements and governance guidelines should apply to all
companies regardless of their size.
While all TSX-listed companies are required to provide full and complete governance
disclosures regarding the fifteen recommendations, the requirements are quite
different for CDNX-listed companies. These companies are classified into Tier 1
(large firms) and Tier 2 (small firms) and not required to comply with any corporate
governance guideline.
As a result, the final report by JCCG recommends that the CDNX should set
reasonable time frames for full and complete governance disclosures and should work
with Tier 1 companies to assist them in developing the capacity to comply with the
Guidelines. Moreover, CDNX should encourage Tier 2 companies to disclose and
comply with the Guidelines.
The most important change regarding audit committees in the JCCG report was the
introduction of financial literacy and accounting expertise requirements for audit
committee members. On 26 March 2002 the TSX approved amendments of the
corporate governance disclosure guidelines applicable to TSX listed companies.
These amendments are in response to the recommendations by the JCCG.
Hansell (2002) provided a summary of the responsibilities of an audit committee
under Canadian corporate and securities laws. These responsibilities include:

Chapter 2: The Development of Audit Committees Victoria University
23
The audit committee is required to review the annual financial statements
before they are approved by the board of directors;
Financial statements included in a prospectus must be approved by the audit
committee before they are approved by the board;
Ontario securities laws require the board of directors to review the unaudited
interim financial statements, but permit the board to delegate this
responsibility to the audit committee;
Securities regulators encourage audit committees to review the corporation's
management discussion and analysis and are proposing to introduce a
requirement that they do so as part of the national instrument being proposed
by the Canadian Securities Administrators; and
The Canadian Securities Administrators recommended that the board of
directors or audit committee review earnings guidance and news releases
containing financial information based on the company's financial statements
before the release of those statements.
In summary, the legal requirements imposed on audit committees in Canada are
minimal. Generally, they must be composed of at least three directors. A majority of
whom must be outside directors. Although the legal framework for audit committees
has changed very little over the years, best practice standards have evolved
significantly. Best practices means, for this purpose, a set of recommended practices
developed by a body or organization with broadly-recognized standing or expertise in
the area of audit committee effectiveness.
2.2.3 Development of Audit Committees in the UK
The support for audit committees has gained impetus in the last two decades primarily
as a result of corporation failures due to poor corporate controls and low confidence in
the credibility of financial statements, independence and effectiveness of the external
audit function. In the light of these problems, more attention was given to the
establishment of audit committees and their role to enhance the reliability and quality
of financial statements.
Despite the fact that there is still no statutory requirement to have an audit committee
in the UK, public sector initiatives are in evidence from as early as 1973. The internal

Chapter 2: The Development of Audit Committees Victoria University
24
audit in the Civil Service noted the advantage of having an audit committee that
included the discussion of audit plans and results as one of its roles. Private sector
initiatives have been most active in the last two decades. In 1977, the Companies Bill
tried to advocate for legislation on the establishment of audit committees. However,
its efforts were unsuccessful (Dafinone 2001).
In 1982, Pro-Ned, an organization for the promotion of non-executive directors, was
set up by the Bank of England, CBI, and other financial institutions (Goobey, 2001).
In 1987, Pro-Ned published the Code of Recommended Best Practice (Pro-Ned, 1987)
which included the recommendation that
“…the appointment of non-executive directors… to facilitate the establishment
of audit committees in large quoted companies”
In 1986, an Institute of Chartered Accountants of England and Wales working party
recommended that audit committees be responsible for both the appointment and
remuneration of auditors, the approval of audit plans and the review of management
reports issued by auditors. In 1987, the Bank of England issued a paper entitled “the
Role of Audit Committees in Banks” that recommended that all banks have to
establish an audit committee (Vanasco, 1994b). In the same year, the London Stock
Exchange also recommended that all listed companies should establish audit
committees composed of non-executive directors.
On May 1991, the Financial Reporting Council, the London Stock Exchange and the
Accountancy Profession established the Committee on the Financial Aspects of
Corporate Governance to address the financial aspects of corporate governance. In
1992, this committee published its recommendations in a Code of Best Practice- The
Cadbury Report (Cadbury Committee 1992).
This report required that all companies listed on the Stock Exchange should disclose,
as a continuing listing obligation, a statement of compliance with the Code of Best
Practice. It further recommended that the external auditors should review the
statement of compliance and they were also required to state if the company had
complied with the Code of Best Practice. Paragraph 4.3 of the Code of Best Practice
recommended that the Board should establish an audit committee of at least 3 non-

Chapter 2: The Development of Audit Committees Victoria University
25
executive directors with written terms of reference, which deal clearly with its
authority and duties (Cadbury Committee 1992).
The Hampel Report (1998) restated the recommendations with respect to the
establishment, structure, role and duties of audit committees in the UK. The
recommendations of both reports (Cadbury Committee and Hampel Report) were
included in the Combined Code on Corporate Governance.
The Turnbull Report (1999) considered the role of audit committees and highlighted
that the annual review of the effectiveness of internal control could be delegated to the
audit committee. However, the definition of internal control in this report was
widened to include all controls rather than just financial controls. The delegation of
this review to the audit committee therefore inferred that audit committee roles could
be extended to include an assessment of the overall risk to the organization.
In late July 2002, the Government asked the Financial Reporting Council (FRC) to
put in hand the development of the existing Combined Code guidance on audit
committees. On 12 September the FRC issued a Press Notice announcing the
establishment of the FRC-Appointed Group. A report by this group was submitted to
the FRC in December 2002 and published in January 2003. This report is well known
as the Smith Guidance on Audit Committees. This guidance is designed to assist
companies in making suitable arrangements for their audit committees and to assist
directors serving on the board of audit committees in carrying out their role.
This guidance includes certain essential requirements that every audit committee
should meet. Compliance with these is necessary for compliance with the Code.
Listed companies that do not comply with these requirements should include an
explanation as to why they have not complied with these requirements in the
statement required by the Listing Rules. It is recognized that some of the requirements
may be inappropriate for some listed companies. In particular, many smaller
companies may have fewer than three non-executive and independent directors. All
listed companies are encouraged to meet the requirements but if they cannot, or if they
believe that a requirement is inappropriate in the circumstances of the company, the
right course is to explain the position. Finally, this guidance applies to all the UK-

Chapter 2: The Development of Audit Committees Victoria University
26
listed companies and shall apply in respect of accounting periods starting on or after 1
January 2003.
In April 2002, the Secretary of State, Patricia Hewitt, and the Chancellor, Gordon
Brown, appointed Derek Higgs to lead a short independent review of the role and
effectiveness of non-executive directors. Higgs published his report in January 2003
(Higgs 2003).
Whereas in the US most governance discussion has focused on corporate malpractice,
in the UK sharp loss of shareholder value is more common than fraud or corporate
collapse. The fall in stock markets in the period 2000-2002 has thrown up some harsh
examples. In recent cases of corporate under performance in the UK, the role of the
board and its committees has been called into question. Thus, Higgs Report focuses
on enhancing the competence and effectiveness of boards and on issues of
accountability.
In July 2003, the FRC issued its latest report regarding Corporate Governance entitled
the Combined Code on Corporate Governance. This Code supersedes and replaces the
Combined Code issued by the Hampel Committee (1998) on Corporate Governance.
It derives from a review of the role and effectiveness of non-executive directors
(Higgs 2003) and a review of audit committees. It is intended that the new Code will
apply for reporting years beginning on or after 1 November 2003.
The Code contains main and supporting principles and provisions. The existing
Listing Rules require listed companies to make a disclosure statement in two parts in
relation to the Code. In the first part of the statement, the company has to report on
how it applies the principles in the Code. In future this will need to cover both main
and supporting principles.
The form and content of this part of the statement are not prescribed, the intention
being that companies should have a free hand to explain their governance policies in
the light of the principles, including any special circumstances, applying to them
which have lead to a particular approach.
In the second part of the statement the company has either to confirm that it complies
with the Code’s provisions or – where it does not – to provide an explanation. This

Chapter 2: The Development of Audit Committees Victoria University
27
‘Comply or Explain’ approach has been in operation for over ten years and the
flexibility it offers has been widely welcomed both by company boards and by
investors. It is for shareholders and others to evaluate the company’s statement.
While it is expected that listed companies will comply with the Code’s provisions
most of the time, it is recognized that departure from the provisions of the Code may
be justified in particular circumstances. Every company must review each provision
carefully and give a considered explanation if it departs from the Code provisions.
In summary, despite the fact that the establishment of audit committees is not
mandated by statute in the UK, the self-regulation approach, which has been taken by
government through the FRC, requires all listed companies to disclose in their annual
reports the degree of compliance with the Combined Code on Corporate Governance.
It is felt that a statutory regime would not be as flexible and adaptable as a self-
regulatory system (Financial Reporting Council, 2003).
2.2.4 Development of Audit Committees in Australia
The development of audit committees in Australia could be traced to the 1970s
following the great company crashes in the seventies, which badly shocked the
confidence in Australian companies (Jamieson 1980).
In 1978, a sub-committee of the N.S.W Division of the Security Institute of Australia
(SIA) completed a study of the relevance of audit committees to Australia and
provided the following recommendations (Turnbull 1980):
Positive efforts should be made by the SIA, Professional Accounting Bodies,
the Stock Exchanges and the Australian Institute of Management to encourage
listed companies to appoint audit committees and publicise their existence and
membership;
Professional bodies should be encouraged to present a balanced view on audit
committees in an effort to increase their incidence in public companies;
No attempt should be made at this time, either by statute or stock exchange
requirement, to legislate the appointment or responsibilities of audit
committees; and
Audit committees should be composed of only nom-executive directors.

Chapter 2: The Development of Audit Committees Victoria University
28
The Company Directors Association of Australia Limited supported corporate self-
regulation through the establishment of a special audit or appraisal committee of non-
executive directors in its Press Release entitled “Audit Committees and Corporate
Self-Regulation” (Turnbull 1980).
The results of a survey by Christofi (1978) indicated that 28 percent of fifty
Australian companies surveyed had audit committees and another 10 percent intended
to establish an audit committee. In addition, the survey revealed that the practices
regarding size, composition and frequency of meetings were similar to those of
companies listed on the NYSE.
In 1989, The Cooney Committee, a parliamentary committee, recommended that
listed companies be required to establish audit committees (Grice 1993). Two years
later, the same recommendation was made by another parliamentary committee called
the Lavarch Committee (Grice 1993).
In addition, the accountancy bodies in Australia have reinforced their strong support
for audit committees by approving the issue by the Auditing Standards Board in May
1991 of the Statement of Auditing Practice AUP 31 entitled “Communication with an
Audit Committee” (Grice 1993). In addition, a survey by Arthur Andersen (1994) of
all listed companies in Australia found that 48 percent of companies had audit
committees.
In 1992, The Australian Stock Exchange (ASX) released the 1992 Exposure Draft
regarding mandating audit committees to all listed companies (Vanasco 1994).
However, the ASX decided not to do so because the submissions in response to the
1992 Exposure Draft indicated that such requirement would be burdensome for many
listed companies (Baxter and Pragasam 1999).
Instead of mandating audit committees, the ASX introduced its first requirements
regarding audit committees in 1993 through the release of two listing rules (Ramsay
2001). Rule 4.10.2 requires a company to indicate in its annual report information
whether the entity had an audit committee at the date of the directors’ report and, if it
did not, it must explain why (Ramsay 2001).

Chapter 2: The Development of Audit Committees Victoria University
29
In addition, Rule 4.10.3 requires a company to include in its annual report a statement
of the main corporate governance practices that the entity had in place during the
reporting period (Ramsay 2001).
Among the matters that must be addressed is outlining the procedures for the
nomination of external auditors and for reviewing the adequacy of existing external
audit arrangements and the role of audit committees in such procedures (Ramsay
2001).
In 1993, the Hilmer Committee was established to remodel the corporate governance
debate (Hilmer Report 1993). This committee suggested that an audit committee
should be comprised of non-executive directors of which the chairperson and majority
should be independent directors. Moreover, in 1996, Working Group of Corporate
Practices and Conduct also suggested that an audit committee should have a majority
of independent directors (Sarre et al 2001). The Australian Investment Managers’
Association (1996) developed guidelines to enhance audit committee effectiveness.
These guidelines suggest that a company should establish an audit committee that
should be chaired by an independent director and comprise only non-executive
directors with a majority of independent directors.
Ramsay (2001) provided a number of recommendations to enhance audit committee
effectiveness. These recommendations could be summarised as follows:
• Listed companies must have a qualified audit committee;
• The audit committee must have a written charter;
• The audit committee must be structured to be independent, literate and has at
least one member who has accounting and financial expertise;
• The audit committee should meet regularly with pre-arranged dates;
• The audit committee should report to the board of directors and in the external
reports; and
• The audit committee should review and assess the external reporting of the
company, related party transactions, internal control, risk management, the
external and internal audit of the company

Chapter 2: The Development of Audit Committees Victoria University
30
There is no legal requirement at present for a company or its board of directors to
form an audit committee. However, the Corporation Law Economic Reform Program
9 (CLERP 9) proposals place a strong emphasis on reinforcing the Australian
principle-based approach to addressing governance matters and on achieving a
balance between regulation and co-regulation (Commonwealth Treasury 2002).
While CLERP 9 proposes mandatory audit committees for the top 500 listed
companies, Other companies would be able to apply the principles that suit their
individual circumstances. Strong support has been given by CLERP 9 for the ASX to
develop best practice standards for corporate governance.
As a result, the ASX Corporate Governance Council (ASX CGC) was formed on 15
August 2002 from 21 different groups that have disparate business backgrounds (The
Australian Stock Exchange Corporate Governance Council 2003). Despite the fact
that these groups have different perspectives and aims, the common mission for such
council was to develop and deliver an industry-wide, supportable and supported
framework for corporate governance that could offer a practical guide for listed
companies, shareholders, the market and the Australian community (The Australian
Stock Exchange Corporate Governance Council 2003).
In March 2003, ASX CGC issued 10 principles aimed at enhancing corporate
governance in Australia (The Australian Stock Exchange Corporate Governance
Council 2003). Principle 4 has focused on audit committee establishment and
structure. It provides recommendations and guidelines to improve ACE. These
recommendations and guidelines could be summarised as follows:
• The board should establish an audit committee;
• The audit committee should be structured to consist of:
Only non-executive directors
A majority of independent directors
An independent director, who is not the chairperson of the board
Has at least three members
At least one member who has financial expertise

Chapter 2: The Development of Audit Committees Victoria University
31
Literate audit committee members
• The audit committee should have a formal charter; and
• Reporting on the compliance with Principle 4 and its recommendations.
The ASX Listing Rule 12.7 requires companies listed on the ASX Top 500 to comply
with the ASX CGC recommendations concerning the composition, operation and
responsibility of audit committees by 1 January 2005 (Australian Stock Exchange
Corporate Governance Council 2003). However, the ASX CGC Implementation
Review Group (IRG) recognized that the additional costs of having an effective audit
committee might be more than the benefits of such committee especially for small
firms (The Australian Stock Exchange Corporate Governance Council
Implementation Review Group 2004).
As a result, the IRG suggested that while the ASX Top 500 are still required to
establish a formal audit committee, only the ASX Top 300 need to establish an
effective audit committee that complies with all the recommendations of the ASX
CGC (Australian Stock Exchange Corporate Governance Council Implementation
Review Group 2004).
On the other hand, all the ASX Non-Top 300 are required to report if they have an
audit committee or not and if not to answer why? The disclosure regarding the audit
committee and other corporate governance mechanisms should be reported in a
special section in the annual report called corporate governance report (Australian
Stock Exchange Corporate Governance Council 2003).
In summary, the Australia audit committee framework is sourced only from listing
rules and codes of best practices and guidelines due to the absence of any legal
requirements regarding audit committees.
2.2.5 Audit committees in Saudi Arabia
Despite the fact that Saudi Arabia has never experienced any corporate collapses,
worldwide collapses (e.g., Enron 2001) and the poor performance of a number of
Saudi companies in the early 90s had lead to increased concerns regarding corporate
governance in Saudi Arabia. The first step that was taken to address these concerns

Chapter 2: The Development of Audit Committees Victoria University
32
was the Royal Consent in 1991 for the establishment of the Saudi Organization of
Certified Public Accountants (SOCPA) to handle the regulation of the auditing and
accountancy profession.
Recognizing the importance of audit committees as a major tool to increase
confidence in financial statements the Minister of Commerce issued a resolution in
January 1994 (Saudi Ministry of Commerce 1994), mandating all public companies to
establish audit committees.
The resolution for the establishment of audit committee in S.A. comprised guidance to
control the selection of their members. These guidelines are:
1) The member should be a shareholder of at least 20 shares and the number of
the members should be odd and not less than three;
2) The member should not be a member of the executive board of directors or
handle a technical, managerial or consultancy work;
3) The member should have a good command of financial and accounting
practices and standards, preferably having appropriate qualifications in this
field; and
4) The member should not have a direct or indirect interest in the transactions
and contracts of the company.
Ultimately the general assembly of shareholders (the annual general meeting) of the
company has responsibility for the selection of the members of the audit committee.
The audit committee has the responsibility for nominating the external auditor to carry
out the external audit and for receiving reports from the auditor. The audit committee
should nominate five audit firms from those licensed to carry out such work in Saudi
Arabia. The nominated audit firms are then asked to submit proposals and on the basis
of these, the audit committee recommends one or more than one firm where
appropriate.
This recommendation will then be taken by the directors to the general assembly,
which has the ultimate responsibility for appointing the external auditor, determining
the audit fee and the tenure of office. Subject to the requirements in the resolution, if

Chapter 2: The Development of Audit Committees Victoria University
33
only one audit firm is appointed, then the audit committee does not recommence the
nomination process until three years after the audit firm commenced the audit. When
more than one audit firm is appointed, the nomination process does not recommence
until five years after the audit firms commenced their audit (Saudi Ministry of
Commerce, 1994).
Following various cases of the misinterpretation of the resolution by many
corporations (such as the level of a good command of financial and accounting
practices, the appropriate qualifications and other duties and authorities of audit
committees), critics such as Abulkhair (1995); Arrubaish (1995); and Shabani (1995)
have published their views in the Saudi print media.
In Saudi banks, the matter is further slightly complicated as there are two regulatory
bodies that exercise control, namely, the Ministry of Commerce and the Saudi
Arabian Monetary Agency (Al-Moataz 2003). In 1994, Saudi Arabian Monetary
Agency (SAMA) issued rules for banks in Saudi Arabia for organising audit
committees (Saudi Arabian Monetary Agency 1994). In the Saudi Arabian Monetary
Agency’s rules (1994: 3) regarding audit committees, the board of directors should
appoint one of its members as a chairman of the audit committee for a minimum of
three years and his independence from the executive and the management is of utmost
importance for his effectiveness. In addition, the chairman of an audit committee is
the one who ultimately determines its effectiveness and success, because he normally
sets its tone, agenda and style. For this reason, the selection of the chairman of the
audit committee must conform to the following criteria:
1. He should not be the chairman of the board.
2. He should not be related to the other members of the board or have any
financial relationship with them.
3. He should not have any relationship with the senior management of the bank.
Membership of audit committees should range between three and five members and
the majority of the members are required to attend each meeting. An audit committee
may include qualified members from the board, ex-board members and outsiders.
However, the committee must be composed mostly of outsiders who are not board

Chapter 2: The Development of Audit Committees Victoria University
34
members, senior managers, officers, employees, major customers or agents of the
bank or its affiliates.
The number of meetings an audit committee should hold is determined by the size and
nature of the bank and the scope of the committee’s activities. For a committee with
normal activities, there should be at least four meetings each year. This should include
an annual meeting with the board of directors. The frequency of the committee’s
meetings with external auditors will depend on its needs and the requests from them.
The meetings with external auditors should not be in the minimum requirements of
four meetings in a year (Saudi Arabian Monetary Agency 1994: 3-4).
It can be seen from the previous rules that the requirements for the audit committees
and its membership and other responsibilities that are mentioned in the SAMA rules
are significantly different from the resolution of Ministry of Commerce 1994, which
did not explain in detail how these committees would be established. It should be
noted that Al-Twaijry et al (2002) held some interviews in 1998 with academics and
external and internal auditors to examine the role of audit committees in the Saudi
Arabian corporate sector. The interviewees expressed concerns about the terms of
reference of audit committees and the scope of work undertaken. The independence
and expertise of audit committee members were called into question. The
interviewees were of the opinion that there was a clear need for the Ministry of
Commerce to issue further regulations in order to improve the effectiveness of audit
committees in Saudi corporations. However, the members of audit committees have
not participated in these interviews.
In 2002, the Internal Audit Committee (IAC), which was one of the SOCPA
committees, reviewed the SMC best practices and recommendations aimed to enhance
audit committee effectiveness in the light of the criticisms for such best practices and
recommendations and in the light of the recent developments in a number of countries
in general and the US in particular (Saudi Organization of Certified Public
Accountants 2003). On 11 March 2003, this committee announced its first draft of the
new best practices and recommendations to improve the effectiveness of audit
committees in public companies. Unlike the SMC best practices and
recommendations regarding audit committees, the new best practices and

Chapter 2: The Development of Audit Committees Victoria University
35
recommendations are very clear and comprehensive. The most important best
practices and recommendations in this first draft were as follows.
• All public companies are required to establish audit committees;
• The audit committee should have at least four members all of whom must be
independent directors;
• The audit committee should meet at least four times per year;
• The chairperson of the audit committee must not be a member of the board of
directors;
• The audit committee should have at least one expert who has at least bachelor
degree in accounting or finance; and
• The audit committee should have a formal charter.
The IAC sent this first draft to academics, external auditors, internal auditors and
other interested parties to comment on these new best practices and recommendations.
However, up to this point, no changes have been made on the first draft and it is not
clear if such best practices and recommendations will be adopted by the SSEC or
SMC or not.
In summary, the audit committee framework in Saudi Arabia is a combination of
statute and codes of best practice and guidelines as such framework lacks any listing
rules by the SSEC regarding the establishment or the structures of audit committees.
2.3 Summary
In this chapter, a number of alternative definitions of an audit committee, which have
been used in the audit committee literature, was offered. In addition, the development
of audit committees over time in five different countries including Australia and Saudi
Arabia were reviewed and discussed with detail.

Chapter 3: Literature Review Victoria University
36
CHAPTER 3:
LITERATURE REVIEW
3.1 Introduction
Audit committee literature has experienced a rapid growth in the recent years as a
result of the rising concerns about corporate governance and the emphasis on the
importance of audit committees to enhance the quality of financial reporting (DeZoort
et al. 2002)
Audit committee literature could be described as diverse literature as it investigates a
variety of issues relating to audit committees. In addition, such literature is expansive
indicating that although much research has been conducted in this area, there are still
many future research opportunities related to audit committee that need to be
investigated (Spira 2002). Moreover, most of the studies that have been conducted in
the area of audit committees used American data and, as a result, audit committee
literature could be described as a U.S. based literature (Spira 2002).
This chapter has two sections. The first section reviews the general audit committee
literature. It covers two streams of research, namely, audit committee formation and
audit committee effectiveness (ACE). While, the first stream of research has focused
on the purposes of the audit committee and has investigated the factors (incentives)
that affect the formation of such committees, the second stream of research has
focused on the fundamental determinants of ACE.
In the second section, a brief review of audit committee roles is presented and then
this section is divided into two parts to provide a comprehensive review of audit
committee literature related to audit quality and the protection of auditor
independence. The first part reviews audit quality literature and identifies the
determinants of such quality. In addition, a number of studies that investigated the
influence of ACE and different audit committee characteristics on audit quality is
comprehensively presented, discussed and critiqued. Moreover, gaps in the literature
in this area are identified and three research questions related to audit committees and
auditor selection are stated in this part.

Chapter 3: Literature Review Victoria University
37
The second part reviews auditor independence literature and identifies the threats that
could impair such independence. Moreover, the provision of non-audit services
literature related to auditor independence is reviewed. Finally, the studies that
examine the impact of ACE and audit committee characteristics on the NAS
purchases are discussed and critiqued in detail. Moreover, gaps in the literature in this
area are identified and three research questions related to audit committee and NAS
purchases are stated in this part.
3.2 General Review
3.2.1 Audit Committee Formation
As discussed in the previous chapter, audit committee development in most countries
has been driven by concerns about the credibility of financial reporting as a result of
the high profile corporate collapses. The US context provides great opportunity for
exploring the reasons for the establishment of audit committees because they have a
longer history of development than elsewhere (Spira 1999).
Pomeranz (1977) argued that the popularity of audit committees is due not only to the
fact that they protect shareholders’ interests, but also because they help guide
management and enhance corporate credibility. In addition, the author highlighted the
important role of audit committees in the selection and protection of external auditors.
Finally, the author emphasised that the first step in forming an audit committee is to
draw up a charter broadly expressing its objectives.
Cobb (1993) investigated the purposes of the audit committee in the US during the
1980s and found some disagreement among commentators regarding such purposes.
However, the author was able to identify four main objectives for the formation of
such committees, namely, reduction of board liability, establishing links between the
external auditor and the board, the reduction of illegal activity and the prevention of
fraudulent financial reporting.
The Treadway Report (Treadway Commission 1987) had ranked the reduction of
illegal activity and the prevention of fraudulent financial reporting as the primary
roles of the audit committee.

Chapter 3: Literature Review Victoria University
38
In addition, Spangler and Braiotta (1990) found that the reduction of illegal activity
and the prevention of fraudulent financial reporting were described by the audit
committee members and those working with them as the primary roles of audit
committees.
However, a number of studies has also been conducted in other countries such as the
UK, New Zealand, Australia, Saudi Arabia and Malaysia to explore the purposes of
the audit committee.
Marrian (1988) conducted a survey to investigate the reasons for the formation of
audit committees in the UK. The results of this survey revealed that financial
collapses and the following of fashion were the most important reasons for such
formation.
In addition, Collier (1992) conducted a more detailed survey to examine the
incentives for the formation of the audit committee in UK firms. This study provided
the following list of reasons for establishment of an audit committee ranked in order
starting with the most frequent ones.
1. Good corporate practice
2. Strengthen the role and effectiveness of non-executive directors
3. Help directors in discharging their statutory responsibilities regarding the
financial reporting
4. Protect and enhance the independence of internal auditors
5. Help the auditors in the reporting of any serious weaknesses in the control
system or management
6. Improve communications between the board and both internal and external
auditors
7. Increase the public confidence in the credibility and objectivity of the financial
reports
8. Assist management to discharge its responsibilities to prevent fraud and errors

Chapter 3: Literature Review Victoria University
39
9. Increase the confidence of investment analysts in the credibility and
objectivity of the financial reports
10. Provide an opportunity for negotiation between management and auditors
11. Possibility of legislative pressure
Despite the fact that the report of the Cadbury Committee (Cadbury Committee 1992)
provided an outline of audit committee structure and a range of duties for such
committees, it did not provide explicit statements regarding the purposes of the audit
committee (Ezzamel and Watson 1997).
Moreover, Bradbury (1990) suggested that audit committees in New Zealand are
established to increase the credibility of audited financial statements, to help boards of
directors in meeting their responsibilities and to enhance auditor independence.
Guthrie and Turnbull (1995) argued that audit committees in Australia were
developed not only to protect investors by increasing the credibility of the financial
reports, but also to protect non-executive directors on the board from being misled by
management.
In Saudi Arabia, the development of audit committees was driven by concerns about
the gap between the external auditor and auditee and the auditing problems of large,
public companies (Al-Moataz 2003). Al-Twaijry et al (2002) indicated that the role of
the audit committee and the scope of its work vary widely across Saudi public
companies because of the different interpretations of the guidelines provided by
Ministerial Resolve 903, which lacked clarity. Teoh and Lim (1996) also indicated
that the establishment of audit committees in Malaysia was a response to corporate
scandals.
On the other hand, a number of studies has described audit committee formation as a
mechanism to reduce agency costs (Turley and Zaman 2004). These studies have used
the agency framework to identify the incentives of the voluntary formation of audit
committees (Eichenseher and Shields 1985; Pincus et al. 1989; Collier 1993;
Bradbury 1990; Willekens et al. 2004). For example, using a random sample of
National Association of Securities Dealers Automated Quotes (NASDAQ) over-the-
counter companies, Pincus et al. (1989) identified a number of different factors that

Chapter 3: Literature Review Victoria University
40
had direct impact on the voluntary formation of such committees. Those factors were
managerial ownership, firm size, leverage, audit firm size, proportion of outside
directors and participation in the National Market System.
In addition, Collier (1993) found that while there was no association between
company size and the formation of an audit committee, leverage and management
ownership were very important determinants of the formation of audit committees.
However, using a sample of 135 firms listed on the New Zealand Stock Exchange,
Bradbury (1990) analysed the incentives for voluntary formation of audit committees.
The results of this study indicated that while agency costs variables and audit firm
size had no associations with audit committee formation, the number of directors on
the board and intercorporate ownership were found to be important determinants of
voluntary audit committees.
Willekens et al (2004) investigated the associations between the voluntary formation
of audit committees and some factors that could influence such formation using data
from Belgian listed companies. They found that while the proportion of independent
directors on the board and the size of the external audit firm were positively
associated with the voluntary formation of audit committees, agency costs and board
size were not related to the voluntary formation of such committees.
Eichenseher and Shields (1985) suggested that the increase in audit committee
formation in the US during the late 1970s could be explained by the increase in
director liability as a result of the Foreign Corrupt Practices Act (FCPA) of 1977.
However, this legal protection may not be a universal explanation of the audit
committee formation as it is influenced by the legal context, which differs from
country to country (Turley and Zaman 2004).
In summary, despite the fact that audit committee literature has provided a long list of
purposes (reasons) for audit committee formation, most of the studies in this area
consider providing credible financial reports as the primary purpose or responsibility
of such committee. In addition, examining the incentives of the audit committee
formation has produced mixed and inconclusive results.

Chapter 3: Literature Review Victoria University
41
3.2.2 Audit Committees Effectiveness (ACE)
Most of the ACE literature has focused on one or more of the fundamental
determinants of ACE, namely, composition, authority, resources and diligence. These
four fundamental determinants have been used frequently in the literature to evaluate
ACE in different contexts. DeZoort et al. (2002) provided a comprehensive summary
of the empirical ACE literature by dividing such literature into four streams of
research, which represent four fundamental determinants of ACE.
3.2.2.1 Composition
Buckby et al (1996) investigated the association between the composition of the audit
committee and ACE using survey responses from the audit committee chairperson,
non-executive director and internal audit manger of a sample of Australian listed
companies. The results of this study indicated that audit committee independence,
expertise and financial literacy were all important determinants of ACE.
Vafeas (2001) examined audit committee composition in terms of independence and
experience (expertise) and tried to identify the determinants of audit committee
appointments. The results of this study indicate that while the likelihood of audit
committee appointment increases with the degree of outside directors’ independence,
such likelihood decreases with compensation committee membership, other
committee membership and the length of board tenure. However, audit committee
appointments were not related to equity holdings and the number of other
directorships.
Vafeas (2001) highlighted the need to examine the influence of audit committee
composition not only in terms of independence and expertise, but also in terms of
financial literacy, on audit committee performance and the quality of the financial
reports.
Prior literature has investigated the impact of audit committee independence, expertise
and literacy on the effectiveness of audit committees in different contexts using
different research methods.

Chapter 3: Literature Review Victoria University
42
3.2.2.1.1 Independence
A number of independence studies (e.g., Scarbrough et al. 1998; Abbott and Parker
2000; Archambeault and DeZoort 2001; Raghunandan et al. 2001; Chen et al 2005)
focused on the impact of independent audit committees on the audit function.
Abbott and Parker (2000) found that firms with independent audit committees were
more likely to select industry-specialist external auditors. This may reflect the desire
of such audit committees to reduce their members’ reputational losses, which, in turn,
will enhance audit quality.
Chen et al. (2005) examined the relationship between independent audit committees
and audit quality using the ASX Top 500 (at the time of testing the list contained 510
firms) in 2000. They found that the ASX Top 500 companies with high percentages of
non-executive directors on their audit committees were more likely to hire a specialist
(high quality) auditor compared to these with low percentages of non-executive
directors on their audit committees.
In addition, Archambeault and DeZoort (2001) examined the association between
audit committee independence and suspicious auditor switches1. They found that
companies with a suspicious audit change had a smaller percentage of independent
directors on the audit committee compared to these with a non-suspicious auditor
change.
Moreover, both Scarbrough et al. (1998) and Raghunandan et al. (2001) used surveys
to examine the influence of audit committee independence on the relationships
between audit committee members and internal auditors. The results of these studies
indicate that independent audit committees were more likely to have stronger
relationships with internal auditors compared to dependent audit committees.
Other studies highlight the impact of audit committee independence on the quality of
financial reporting and earnings management. Abbott et al. (2002) found that
1 Suspicious auditor switches means changing auditors after disclosure of a reportable event, after
receiving a modified audit opinion (Archambeault and DeZoort 2001)

Chapter 3: Literature Review Victoria University
43
companies with independent audit committees were less likely to be sanctioned by the
SEC for fraudulent or misleading financial reporting.
Similarly, Beasley et al. (2000) found companies that committed fraud had less
independent audit committees compared to their counterparts that did not commit
fraud. In addition, McMullen and Raghunandan (1996) found that companies with
reporting problems were less likely to have independent audit committees.
Klein (2002a) found that audit committee independence was negatively associated
with abnormal accruals and that reductions in audit committee independence were
associated with large increases in abnormal accruals.
Bedard et al. (2004) investigated the association between different audit committee
characteristics and earnings management. They found that aggressive earnings
management is negatively associated with the presence of an independent audit
committee.
Other studies relate audit committee independence to governance and company
variables. Beasley and Salterio (2001) found that voluntary increases in the number of
outside audit committee members were associated with board size, board
independence, and the separation of the CEO and board chair roles. In addition, Klein
(2002b) found that audit committee independence was positively associated with
board size and board independence and negatively associated with growth
opportunities and firms with accounting losses.
It should be noted that the above independence literature has focused solely on inside
and outside directors when determining audit committee independence. However,
Vicknair et al. (1993) examined the level of grey directors, who are not insiders but
still have ties to management or the corporation, on the audit committees of a sample
of NYSE firms. They found that about a third of the members of the audit committees
were grey directors.
The results of this study highlighted the potential grey director issue in audit
committee independence and a number of studies has included grey directors in their
analysis of audit committee independence. For example, Carcello and Neal (2000)
examined the association between audit committee independence and the likelihood

Chapter 3: Literature Review Victoria University
44
of receiving a going concern opinion using a sample of financially distressed
companies. They found that companies with a high percentage of grey directors on the
audit committee were less likely to receive a going concern opinion compared to those
with a low percentage of grey directors on the audit committee.
In addition, Vafeas (2001) used a relatively broad approach to defining grey directors
in his study of audit committee appointments. Using an independence measure that
screened directors who were consultants, bank officers, lawyers, relatives of
management, or otherwise had any economic link to the company, he found that new
audit committee appointees were more independent than a control group of non-audit
committee directors.
3.2.2.1.2 Member Expertise
The audit committee composition literature regarding audit committee expertise was
dominated by survey and archival studies (e.g., Beasley and Salterio 2001; DeZoort
1997; GAO, 1991; Kalbers 1992a, 1992b; Lee and Stone 1997).
From the survey literature, a number of studies focused on audit committee members'
perceptions of their own expertise. For example, the General Accounting Office
(1991) revealed that approximately half of the 40 surveyed audit committee chairs
from large US banks perceived their audit committee as lacking the presence of any
expert in accounting, auditing and law.
In addition, DeZoort (1997) found that audit committee members believed that all
audit committee members should have sufficient expertise in oversight areas related to
accounting, auditing and the law.
Other studies investigated the perception of internal and external auditors about audit
committee member expertise. For example, Kalbers (1992a, 1992b) surveyed external
auditors and internal auditors and found both groups had significantly lower
perceptions of audit committee members' expertise than those of audit committee
members.
Raghunandan et al. (2001) surveyed chief internal auditors and found that audit
committees with at least one member possessing an accounting or finance background

Chapter 3: Literature Review Victoria University
45
were more likely to have longer meetings with their chief internal auditor, to provide
private access to him or her and to review internal audit proposals and results.
On the other hand, the archival literature addresses a wide variety of research
questions regarding audit committee expertise (McMullen and Raghunandan 1996;
Lee and Stone 1997; Archambeault and DeZoort 2001; Beasley and Salterio 2001).
McMullen and Raghunandan (1996) found that companies with financial reporting
problems were less likely to have members who have a Certified Public Accountant
(CPA) on their audit committees.
Bedard et al. (2004) found that aggressive earnings management is negatively
associated with the financial and governance expertise of audit committee members.
Lee and Stone (1997) studied 100 US multinational companies and described a
mismatch between audit committees' stated responsibilities and the levels of
instrumental experience (defined as skills related to accounting, auditing and control
issues) among members.
Moreover, Archambeault and DeZoort (2001) found that companies with suspicious
auditor switches had fewer experts on their audit committees compared to these with
non-suspicious audit switches.
DeFond et al. (2005) investigated the market reaction to the appointment of directors
with financial expertise to the audit committee. They found a positive market reaction
to the appointment of directors with financial expertise to the audit committee.
Furthermore, Beasley and Salterio (2001) studied Canadian boards and found that
voluntary increases in audit committee members' collective financial reporting and
audit committee knowledge and experience were related to board size, proportion of
outsiders on the board, and separation of board chair and CEO/president.
Despite the difficulty in accessing audit committee member expertise, a number of
experimental researches regarding audit committee expertise was conducted. For
example, DeZoort (1998) asked a sample of 87-audit committee members to complete
an internal control assessment task to investigate the influence of audit committee
members’ expertise on the quality of the their assessment. The results of this study

Chapter 3: Literature Review Victoria University
46
indicate that expert audit committee members made better assessment more like
criterion group auditor compared to less expert audit committee members.
In addition, DeZoort and Salterio (2001) conducted an experiment to examine the
association between audit committee expertise and the ability of such committees to
resolve auditor and management disputes. They found that audit committee expertise
was positively associated with audit committee member support for an auditor in
substance disputes.
McDaniel et al. (2002) conducted an experiment using audit firm managers and
executive MBA graduates to examine the influence of expertise on the assessment of
financial reporting quality. They found that experts made better assessment of
financial reporting quality compared to non-experts. They concluded that efforts to
enhance audit committee financial expertise might influence audit committees'
assessments of financial reporting quality.
3.2.2.1.3 Member Financial Literacy
Financial literacy has received less attention in the audit committee composition
literature than member independence and expertise. Little research has been
conducted in this area (Vafeas 2001).
One possible explanation may be the lack of benchmarks for member financial
literacy. Such benchmarks are necessary to facilitate the measurement of such a
variable in order to investigate its impact on ACE. Moreover, most of the member
expertise literature has mixed this variable with the member financial literacy
variable. It is important to distinguish these two variables and determine the possible
impact of each variable on the ACE.
McDaniel et al. (2002) conducted an experiment using audit firm managers and
executive MBA graduates to assess differences in the way financial experts and
financial literates evaluate financial reporting quality. They found that experts tended
to focus more on common, less-important issues, while literates focused more on less-
rare, significant issues.
Song and Windram (2000) found that UK companies with an audit committee with a
higher level of financial literacy are less likely to have financial reporting problems.

Chapter 3: Literature Review Victoria University
47
In summary, audit committee composition literature has focused on independence and
expertise with less attention given to financial literacy. In addition, this review has
shown evidence that member independence and expertise are perceived to be critical
components of ACE. They are associated with factors including audit committees
engaging higher quality auditors, interacting more with internal auditors, protecting
the external auditor from client pressure and a reduced incidence of financial
reporting problems.
3.2.2.2 Authority
The audit committee receives its authority from the full board of directors, corporation
laws and exchange listing requirements (DeZoort et al. 2002). Authority could be
described as a function of the responsibilities and influence of the audit committee.
Audit committee authority literature focused on audit committee oversight duties and
was dominated by the use of the survey method. This literature indicates that there is a
wide variation of responsibilities that could be performed by the audit committee and
highlights the importance of the audit committee charter in helping audit committee
members to understand their specific responsibilities (Kalbers and Fogarty 1993;
Coopers and Lybrand 1995). For example, Coopers and Lybrand (1995) investigated
the scope of audit committee responsibilities over the last 20 years. They found that
audit committee responsibilities had experienced a rapid growth indicating that audit
committees perform a wide range of duties.
DeZoort (1997) conducted a survey to determine the most important oversight
responsibilities of the audit committee. The results of this study indicate that audit
committee members ranked financial statement review, internal auditor assessment
and external auditor evaluation as the most important oversight responsibilities.
Moreover, Lee and Stone (1997) concluded that there is a mismatch between stated
audit committee responsibilities and the level of audit committee member experience
(i.e., skills in accounting, auditing and control issues).
Haka and Chalos (1990) conducted a survey to examine the perceptions of audit
committee chairs, management, external auditors and internal auditors about agency
conflict. They found evidence that agency conflicts exist between audit committees

Chapter 3: Literature Review Victoria University
48
and management in areas related to financial disclosure and discretionary accounting
procedures. However, the perceptions of audit committee chairs regarding issues
affecting accounting choices were different from these of internal and external
auditors.
In addition, Kalbers and Fogarty (1993) used the power theory to conduct a survey
using audit committee members from 90 corporations to investigate the relationships
between audit committee characteristics and ACE. The results of their analysis
indicated that effectiveness included oversight of financial reporting, external auditors
and internal control. Audit committee power within the organization came from a
combination of written authority and the clear support of top management.
Finally, Bedard et al. (2004) concluded that aggressive earnings management is
negatively associated with the presence of a clear mandate defining the
responsibilities of the audit committee.
In summary, audit committee responsibilities are diverse and appear to be expanding,
which makes it very hard for audit committee members to understand all these
responsibilities especially in the absence of an audit committee charter. In addition,
oversight of financial reporting, auditing and controls were the most important audit
committee oversight responsibilities.
3.2.2.3 Resources
The audit committee should be allowed to get access to all the necessary resources
that could be needed for such a committee to perform its responsibilities effectively.
Audit committee resources literature has focused on the role that both internal and
external auditors could play to support audit committees and on the size of the audit
committee as an important determinant of ACE (DeZoort et al. 2002).
A number of studies (Cohen and Hanno 2000; Knapp 1987 and 1991; Schroeder et al.
1986) highlighted the important role that external auditors could play in enhancing the
ACE. For example, Knapp (1987) conducted a study to identify the factors that could
influence the likelihood that audit committees will support auditors in their disputes
with management. The results of this study indicate that firms with an audit
Chapter 3: Literature Review Victoria University
49
committee were more likely to support the auditor in auditor-management disputes
compared with those with a non-Big 8 auditor.
More recently, Cohen and Hanno (2000) found that external auditors made less
favourable audit planning judgments in cases where the corporate governance
structure included an audit committee that lacked technical experience and regular
access to internal and external auditors without top management present.
DeZoort et al. (2000) concluded that internal audit directors believed structured
communications programs between internal auditors and audit committees could
improve the quality of corporate governance.
Few studies have examined the impact of audit committee size on the ACE in
different contexts. Archambeault and DeZoort (2001) investigated the impact of audit
committee size on suspicious auditor switching. They found a negative association
between audit committee size and suspicious auditor switching.
Felo et al (2003) found a positive association between audit committee size and
financial reporting quality. These studies provided support for the use of audit
committee size as a proxy for the available audit committee resources.
In summary, the audit committee resources literature highlighted the important impact
of the support of external and internal auditors to audit committee on ACE. In
addition, this literature provided evidence that audit committee size was an important
determinant of ACE.
3.2.2.4 Diligence
Audit committee diligence means the willingness of audit committee members to
discharge their responsibilities and duties. Kalbers and Fogarty (1993) argued that
audit committee diligence is the most important determinant of ACE. Because actual
audit committee diligence cannot be measured directly, audit committee diligence
literature was dominated by the use of the number of audit committee meetings per
year as a proxy for such diligence to investigate the impact of such diligence on the
ACE in different contexts (DeZoort et al. 2002). However, a few studies also consider
other proxies for diligence such as voluntary audit committee disclosures.

Chapter 3: Literature Review Victoria University
50
A number of researchers has focused on financial reporting quality. McMullen and
Raghunandan (1996) and Song and Windram (2000) found that companies with
reporting problems had less frequent audit committee meetings.
Beasley et al. (2000) examined the association between the number of audit
committee meetings and the likelihood of having fraud financial reports in the
technology and health-care industries. The results of their study indicate that there
was a negative relationship between the number of meetings and the likelihood of
fraud. Their study indicated that while fraud companies generally held one meeting
per year, non-fraud companies met two or three times each year. However, the
number of audit committee meetings in both groups of companies is still less than the
four meetings per year that was recommended by the Blue Robin Committee (BRC
1999).
Abbott et al. (2000) indicated that firms with audit committees that met at least twice
per year were less likely to be sanctioned by the SEC for financial reporting problems.
Finally, Abbott et al. (2002) found a significant and negative association between the
audit committees, which met at least four times per year, and the occurrence of
financial reporting restatement.
Other studies link the number of meetings with external auditor selection. Abbott and
Parker (2000) investigated the association between audit committee characteristics
and the selection of a high quality auditor using US data. The results of their study
indicate that firms with audit committees that met at least twice per year were not
more likely to use a specialist auditor.
In addition, Archambeault and DeZoort (2001) concluded that companies with an
audit committee that met more frequently were less likely to commit a suspicious
auditor switch compared to companies with an audit committee that met less
frequently.
However, Abbott et al. (2003) investigated the association between active audit
committees (meet at least 4 times a year) and the NAS purchases. They found that
companies with audit committees that met at least four times a year were more likely
to have a lower NAS ratio compared to these with audit committees that met less than

Chapter 3: Literature Review Victoria University
51
four times a year. In other words, companies with an active audit committee were
more likely to limit NAS purchases compared to those with inactive audit committee.
Despite the fact that audit committee diligence literature is dominated by using audit
committee meetings as a proxy for diligence to examine ACE in different contexts,
such literature has also been extended to consider interactions with other audit
committee and company variables.
For example, Menon and Williams (1994) found a positive association between the
number of audit committee meetings and the percentage of outside directors, firm
size, and monitoring complexity. In addition, Collier and Gregory (1999) have
reached the same conclusion using two measures of audit committee activity, namely,
number and duration of audit committee meetings in their study of U.K. companies.
They found that while the presence of a dominant CEO and the inclusion of insiders
on the audit committee were negatively related to the level of activity, leverage and
the presence of a Big 6 auditor were positively associated with the level of activity.
On the other hand, a few studies have used different proxies for diligence. Kalbers
and Fogarty (1993) surveyed chief financial officers, chief internal auditors and
external audit partners to examine their perceptions of audit committee diligence.
They defined diligence as the level of preparation, care, independence and level of
activity of the audit committee chair and other members. They found a significant
positive relationship between diligence and perceived ACE.
Turpin and DeZoort (1998) have used voluntary disclosure of audit committee reports
as a proxy for audit committee diligence. They found that the voluntary disclosure of
audit committee reports is positively associated with company size, proportion of
outside directors, leverage and listing on a major stock exchange. However, their
results concluded that management (not audit committee) is more likely to drive the
decision for such voluntary audit committee disclosure.
Carcello et al. (2002) examined voluntary audit committee disclosures under the new
disclosure requirements implemented in 2001 by the SEC and the securities
exchanges such as NYSE. They found voluntary disclosure of audit committee
activities to be more common for depository institutions, larger companies, NYSE-
listed companies, and companies with more independent audit committees.

Chapter 3: Literature Review Victoria University
52
In summary, while audit committee diligence literature has been dominated by the use
of the number of audit committee meetings as a proxy for diligence to evaluate ACE
in different contexts, a few studies have used alternative proxies such as the voluntary
disclosure of audit committee reports. In addition, a number of studies has
investigated the association between some agency and corporate governance
variables, and the number of audit committee meetings.
In conclusion, the ACE literature has been dominated by US studies, and by the
perception-based approach method (survey method) and focused on one or two
determinants of ACE. It is important to examine the ACE in other countries such as
Australia and Saudi Arabia, which have very limited research in this area and
compare the results with those of the US to highlight the impact of different
institutional requirements, market developments and cultural and economic
differences on ACE.
Moreover, the perception-based method is often subject to academic criticism.
Response rates are notoriously low, leading to potential non-response bias (Ramsay
2001). Further, the theoretical setting lacks many elements and pressures of reality.
Finally, the results of such research can be driven by the characteristics of the subjects
(Gul 1990).
The new disclosure requirements regarding audit committees by the SEC and
Australian ASX provide unique, public data, which could be used to evaluate the
impact of the new recommendations regarding audit committees on their
effectiveness. The use of the archival research method will reduce the lack of
objectivity associated with the survey research method as mentioned above and will
also make the results more generalizable.
3.3 Roles of Audit Committees
Audit committees provide a focus and means for a fuller view and analysis of the
matters relating to auditing, internal controls and financial reporting. Wolnizer (1995)
summarised the functional audit committee recommendations of corporate
governance commissions and committees in the US, UK, Canada and Australia. He
Chapter 3: Literature Review Victoria University
53
demonstrated that audit committees are expected to perform almost exclusively in the
technical areas of auditing, internal control and financial reporting.
Verschoor (1993) studied the functions of audit committees disclosed by some of the
largest US firms. He concluded that audit committees operated in the technical areas
of external auditing, internal control assessment and financial reporting.
Despite the fact that there is a wide range of audit committee responsibilities and
duties, this study is focused on the audit committee’s role in auditor selection and
protection of auditor’s independence because they are the primary responsibilities of
audit committee (Birkett 1986; Braiotta 1994; SMC 1994; Blue Robin Committee
1999; Ramsay 2001; the Australian Stock Exchange Corporate Governance Council
2003). Moreover, audit committee members have incentives to protect their
reputational capital by assuming significant responsibility for the engagement of the
audit firm and the protection of its independence (Fama and Jensen 1983).
The following two sections review in detail the literature related to two primary
responsibilities of audit committee that have been mentioned above.
3.3.1 Auditor Selection
This section is focused on the audit committee’s role in the auditor selection process.
It has two parts. In the first part, a comprehensive summary of the literature on the
relationship between audit quality and auditor selection is provided. It identifies three
different, but related, sources of demand for audit quality and provides a list of
variables that have been identified as determinants of auditor selection. The second
part reviews in detail the literature of the association between the audit committee and
the auditor selection process and identifies gaps that will be addressed in this study.
3.3.1.1 Audit Quality and Auditor Selection
DeAngelo (1981) defined audit quality as the likelihood that financial statement errors
or omissions will be detected (Competence) and reported (Independence). DeAngelo
further argued that auditors would specialize in supplying different levels of quality.
This indicates that if a firm wishes to change audit quality it must also change
auditors. The idea of product differentiation in the market for audits was supported by
a number of studies (e.g., Francis and Wilson 1988; Firth and Smith 1992).

Chapter 3: Literature Review Victoria University
54
Audit quality literature has investigated the impact of different factors on the demand
for different levels of audit quality using a number of proxies to surrogate such
quality, because it cannot be observed directly (Francis and Wilson 1988; DeFond
1992; Beasley and Petroni 2001).
Beattie and Fearnley (1998) reviewed audit quality literature and identified three
primary sources of demand for audit quality, namely, agency costs demand,
information demand and insurance demand.
3.3.1.1.1 Agency Costs Demand
Agency costs arise from the separation of management (agent) from owners
(principals) because they have different incentive structures. Shareholders attempt to
encourage management to take actions on their behalf. However, they cannot observe
management's actions. Managers may therefore consume firm resources and/or make
decisions that are not in the best interests of the shareholders.
Watts and Zimmerman (1986) concluded that agency costs have lead to the
development of institutional arrangements such as auditing and management
compensation agreements to reduce such costs. Moreover, Jensen and Meckling
(1976) suggested that the use of auditing could mitigate agency costs by providing
credible financial reports.
In addition, a number of studies has investigated the impact of different agency costs
on the auditor selection process (e.g., Francis and Wilson 1988; DeFond 1992;
Beasley and Petroni 2001)
Francis and Wilson (1988) examined the association between agency costs and the
demand for different audit quality levels. The results indicated that size of the firm,
management ownership and leverage were very important determinants of the auditor
selection process.
In addition, DeFond (1992) explored the association between changes in auditor
quality and changes in agency costs around the time of the auditor change. The author
concluded that leverage, management ownership and size of short-term accruals are
associated with changes in audit quality.

Chapter 3: Literature Review Victoria University
55
Moreover, Beasley and Petroni (2001) investigated the role of outside members of the
board of directors in the selection of external auditor for property-liability insurance
companies. They found firm size to be a very important determinant of such selection
and an association between board composition and the selection of a specialist
external auditor. However, they did not find any association between board
composition and the selection of both non-specialist and non-Big 6 external auditors.
This indicated the importance of specialization in insurance companies.
3.3.1.1.2 Information Demand
Information (financing) demand is derived from the desires’ of other third parties to
protect themselves from financial losses by insuring the presence of information
asymmetry between them and management (Abbott and Parker 2000). As a result,
management may use the selection of high quality auditors to indicate the quality of
management’s representations regarding financial performance to help in obtaining
the needed finance (Abbott and Parker 2000). In addition, Dopuch and Simunic
(1982) argued that the information demand of audit quality is closely related to
agency demand.
A number of studies has investigated the influence of different variables related to
information demand on audit quality. For example, Francis and Wilson (1988) found
that the issue of public securities played an important role in the selection of external
auditors. They noted that a firm might change to a high quality external auditor before
issuing new securities to increase the chance that it will get the required finance. In
addition, Johnson and Lys (1990) found new acquisitions to be associated with the
selection of a high quality auditor.
3.3.1.1.3 Insurance Demand
Insurance demand is derived from investors' desires to protect themselves from
financial losses via the auditor's professional liability exposure. Wallace (1987) and
Chow et al. (1988) have contended that audits provide investors with a form of
insurance. If an investor purchases securities on the basis of audited financial
statements and subsequently sustains losses, which can be attributed to audit failure,
the law provides recourse for the investor against the auditor.

Chapter 3: Literature Review Victoria University
56
DeAngelo (1981) argued that big audit firms provide investors with more insurance
because such auditors are viewed as having deep pockets, which enable them to
compensate investors in case something goes wrong.
Craswell et al. (1995) suggested that specialist auditors among the Big 8 are viewed as
providing extra insurance to investors. This extra insurance is a product of two
components, namely, size and specialization. The size indicates that auditors with
deep pockets have the ability to compensate investors in case of financial losses. The
specialization indicates that specialist auditors are less likely to fail to discover and
report any breaches in the financial statements.
This explains the use of both size and specialization of auditors as proxies for audit
quality in prior literature (DeAngelo 1981; Craswell et al. 1995; Abbott and Parker
2000)
3.3.1.2 Audit Committee and Auditor Selection
Fama (1980) and Fama and Jensen (1983) highlighted the important role of the board
of directors in keeping an eye on the activities of management to insure that it will act
in the best interest of the shareholders. Outside directors are generally high-reputation
members of the business community who view the directorate as a means of further
developing their reputations as experts in decision control (Fama and Jensen 1983).
Outside directors bear reputational risks (and potential monetary losses) similar to
those of insiders, but receive far less direct compensation (Romano 1989)
Most of the previous studies, which have examined the role of audit committees in the
auditor choice process, have focused on the impact of the mere presence of an audit
committee on auditor selection (e.g., Pearson and Ryans 1982; Lynn 1985; Kunitake
1983; Cottel and Rankin 1988). The results of such studies revealed relatively little
impact of the mere presence of such committees on the selection process. For
example, Pearson and Ryans (1982) investigated the likelihood that management may
encourage audit committees to participate in the selection of the external auditor.
They found that management generally welcomed its audit committee to engage in the
auditor choice.
Chapter 3: Literature Review Victoria University
57
In addition, Lynn (1985) found that respondents from companies with an audit
committee focused more on the prestige and size of the audit firm compared to these
without an audit committee. However, the results of this study indicate that audit
committees did not significantly influence the audit selection process because firms
with an audit committee were more likely to rely on the recommendations of the
executive directors when hiring an external auditor compared to these without an
audit committee.
Kunitake (1983) investigated whether companies with an audit committee tend to
choose a Big Eight auditor over Non-Big Eight using a sample of 607 companies
mostly listed on the AMEX. The results of this study revealed that there were no
statistically significant differences in auditor changes between firms with an audit
committee and those without an audit committee.
Using 128 AMEX companies, Eicheneher and Shields (1985) conducted a study to
examine the association between having an audit committee and auditor changes
between 1973 and 1980. They found that companies with an audit committee were
more likely to switch to Big Eight compared to these without an audit committee.
A study of companies listed over-the-counter on the NASDAQ by Cottel and Rankin
(1989) found no significant evidence that audit committees cause a displacement of
small-sized auditors towards the Big Eight. They stressed that while their data
revealed some movement towards Big Eight auditors among NSADAQ-listed
companies, the existence of an audit committee does not explain the displacement.
In summary, studies that tried to investigate the impact of the mere presence of the
audit committee on auditor choice have produced mixed results. Therefore, the mere
presence of the audit committee does not necessarily translate into an effective
monitoring body (Sommer 1991; Abbott and Parker 2000). This highlights the
importance of different audit committee characteristics in evaluating audit committee
effectiveness in performing its duties.
Menon and Williams (1994) examined the association between the percentage of non-
executive directors and audit committee composition and activity. They found that
while there was a negative association between the proportion of non-executive
directors on the board and the percentage of insider directors on the audit committee

Chapter 3: Literature Review Victoria University
58
board, there was a positive relationship between the percentage of non-executive
directors on the board and the number of meeting held by the audit committee. These
findings indicate that non-executive directors have incentives to establish an active,
independent audit committee to reduce their liability concerns.
Formation of an effective audit committee may help mitigate outside director liability
in two ways. First, Reinstein et al. (1984) hypothesized that non-executive directors
on the board might be able to show accomplishment of their responsibilities and
duties by stating that they relied upon audit committee representations regarding the
adequacy of the firm's financial reporting. This indicates that non-executive directors
on the board may successfully shift risk to audit committee members (Reinstein et al.
1984).
Second, Abbott and Parker (2000) argued that the independence and integrity of
monitoring might be enhanced by having internal and external auditors report to a
sub-set of the board consisting solely of outside directors. Regardless of the number
of outside directors, the full board typically includes the CEO and perhaps other
officers of the company whose performance may be questioned by the auditors.
Adequate attention can be paid to the board functions of reviewing financial-reporting
policies and coordinating with auditors only if a sub-set of the board is charged with
these responsibilities (Merchant 1987).
Hun-Tong and Terence (2003) conducted an experiment to investigate the impact of
ACE on auditors' judgements in an auditor-client negotiation context. They found that
the presence of an effective audit committee influence auditors' judgements and help
them to resist their clients pressure to concede to the client's preferred position.
In the rest of this part, two studies that investigated the influences of different audit
committee characteristics on the auditor selection process will be discussed in detail
and critiqued in order to identify the gaps and form the first three research questions.
First, Abbott and Parker (2000) examined the relationships between audit committee
characteristics and the auditor selection process. They hypothesized that companies
with an effective audit committee were more likely to hire a high quality auditor
(specialist auditor). The results of this study indicated that there was a positive

Chapter 3: Literature Review Victoria University
59
association between an effective audit committee and the selection of a specialist
auditor.
However, they used only two of the audit committee characteristics, namely,
independence and activity and compounded them into a single variable called
effectiveness. Thus, they failed to establish individual relationships between the two
characteristics and the auditor selection process to identify which audit committee
characteristic contributes the most to audit quality.
Moreover, they posited that the audit committee would be independent if all its
members were non-executive directors ignoring the possibility of having grey
directors (affiliated directors) among the non-executive directors. Abbott et al (2003)
argued that grey directors are less likely to resist management pressures to act in its
own interest instead of the shareholders’ interest than the independent directors.
In addition, the Blue Robin Committee (1999) recommended that an audit committee
should meet at least 4 times a year to be able to fulfil its responsibilities and duties.
However, it used two audit committee meetings as the criterion in determining the
active audit committee and did not provide any justification for such selection.
Finally, they used data from 1994, which might not reflect the current situation of the
audit committee today, which has experienced dramatic changes in the last few years.
Second, Chen et al. (2005) conducted a study using 458 companies of the ASX Top
500 in 2000 to investigate the association between the composition of the audit
committee and the audit quality. However, they used only three audit committee
characteristics, namely, independence, expertise and activity. They found that audit
committee independence was the only audit committee characteristic that had a
positive association with the selection of a specialist auditor.
In addition, they considered an audit committee to be independent if all its members
were non-executive directors ignoring the possibility of having grey directors
(affiliated directors) among the non-executive directors, which might lead to
misleading conclusions. Finally, they did not investigate the influence of having an
effective audit committee on the auditor selection process.

Chapter 3: Literature Review Victoria University
60
It is clear from the above discussion that both studies have used the percentage of
non-executive directors as a measure of audit committee independence, which might
result in misleading conclusions. In addition, they used only two or three of the audit
committee characteristics to indicate the presence of an effective audit committee.
Finally, these two studies lack the use of benchmarks in order to evaluate their local
best practices and recommendations regarding audit committees.
Therefore, the following three research questions regarding audit quality are still not
addressed.
• What is the influence of having an effective audit committee, which meets all
the audit committee characteristics best practice and recommendations, on
audit quality?
• Which audit committee characteristic is the most important determinant of
audit quality?
• Are the ASX CGC and SMC best practices and recommendations regarding
audit committee efficient in the context of the auditor selection process?
3.3.2 Auditor independence
This section is focused on the audit committee’s role in protecting auditor
independence. It has two parts. In the first part, a conclusive summary of the non-
audit services (NAS) impairment to auditor independence literature is provided. The
second part reviews the literature that relates the audit committee to the protection of
auditor independence.
3.3.2.1 Non-audit Services and Auditor Independence
Despite the fact that there is a number of factors, which could compromise auditor
independence such as NAS, audit fees, tenure and employment relationship, this part
will focus only on the impact of NAS on auditor independence. There is uncertainty
about how close the relationship between the auditor and the management of the audit
client can be without creating, in fact or in perception, a mutuality of interest that
could impair the auditor’s independence (Sutton 1997). As the scope of NAS
performed for the client by the audit firm broadens, the relationship between

Chapter 3: Literature Review Victoria University
61
management and auditor becomes closer. Researches have debated the impact of the
provision of NAS on auditor independence.
Theorists generally hypothesize that the provision of NAS to audit clients poses a
threat to auditor independence. These arguments are based broadly on notions of
economic dependency and mutuality of interest (Wines 1994).
However, advocates of NAS list a number of benefits that could be obtained by the
auditors and their clients from providing such services. Providing NAS can reduce
total costs, increase technical competence and motivate more intense competition
(Arrunada 1999). In addition, advocates of NAS argue that NAS does not necessarily
impair auditor independence, and can improve the professional judgment of auditors
(Arrunada 1999).
Mikol and Standish (1998) argue that in the absence of restrictions, auditors have
incentives to create a competitive advantage by developing concentrations of
multiple-service expertise. The benefits, which could be obtained from the economies
of scope and increased client awareness, can reduce the costs of the audit firm, and, in
turn, the fees charged to the client for service provision (Mikol and Standish 1998).
The association between audit fee and NAS is important due to its potential to impact
on auditor independence. The link between management and auditor has been
analytically documented to increase with the provision of NAS.
For example, Beck et al. (1988) argued that providing NAS would result in cost
savings that may be distributed between the audit firm and the client. These cost
savings, which represent increased future economic benefits in the client, create
incentives for the auditor to resolve disputes in the client’s best interest (Davis et al.
1993).
Studies that tried to investigate the impact of NAS purchases on auditor independence
have produced mixed results. For example, Wines (1994) studied financial statements
to investigate the relationships between their content and the level of NAS purchases.
He found companies that did not receive a qualified opinion were associated with
higher level of NAS purchases indicating that the auditor independence in appearance
might be compromised by the high level of NAS purchases.

Chapter 3: Literature Review Victoria University
62
Gul et al. (2006) conducted a study to investigate the impact of NAS purchases on
auditor independence in appearance by examining the market perceptions in term of
the earning-returns model. They found that NAS purchases influence the market
perceptions in term of the earning-returns model, which indicates that there is a
negative relationship between NAS purchases and auditor independence in
appearance.
The results of Wines (1994) were consistent with earlier studies by Simunic (1984)
and Palmrose (1986). This stream of research was based on the notion that auditors
prioritize their own economic benefits over independence (Barnes and Huan 1993).
In addition, Simunic (1984) investigated the association between audit fees and NAS
purchases. He found a positive association between audit fees and the magnitude of
NAS purchases. Moreover, Palmrose (1986) examined the same issue and found the
same positive association between NAS and audit fees.
However, using a survey methodology, Abdel-Khalik (1990) argued that such positive
relationship does not exist. The author concluded that the level of NAS purchases has
no impact on the audit fees. Parkash and Venable (1993) stated that the
inconsistencies between the results of these could be attributed to methodological
faults such as survey response bias and inconsistent NAS definition.
The existence of a positive relationship between audit fees and NAS purchases
increases concerns because where the benefits of cost savings are retained by the
auditor; the auditor becomes more dependent on the client, posing a threat to
independence (Parkash and Venable 1993).
In light of the above inconsistencies, Barkess and Simnett (1994) tested the
relationship between audit fees and NAS purchases using a large Australian sample
from 1986 to 1990. In each year, between 371 and 466 of the Top 500 listed
companies were drawn into the sample, with a total of 2,094 observations. Using
regression analysis, the authors found a positive relationship between audit fees and
NAS purchases and found results consistent with the earlier studies by Simunic
(1984) and Palmrose (1986).

Chapter 3: Literature Review Victoria University
63
The existence of a positive relationship between NAS fees and audit fees has also
been documented in the UK. For example, Ezzamel et al. (1996) found that there was
a positive association between NAS purchases and audit fees.
A study by Frankel et al. (2001) provided empirical evidence on the influence of NAS
purchases on auditor independence. They investigated the market reaction of
disclosing NAS fees after the introduction of the new US disclosure requirement by
the SEC that requires all listed companies to disclose both audit and NAS fees. The
results of this study indicated that there was a significant negative market reaction
with respect to firms with the highest unexpected NAS fees.
Moreover, the authors found that companies with high levels of NAS fees were more
likely to meet or beat earnings benchmarks compared to these companies with low
levels of NAS fees. The authors concluded that the magnitude of NAS could threaten
auditor independence. However, although the number of observations was large, the
small sample period of four months may limit the ability to generalize these results.
Barkess and Simnett (1994) investigated the relationship between the magnitude of
NAS fees and the issuance of qualified audit reports. They found that there was no
association between the magnitude of NAS fees and the probability of receiving a
qualified audit report.
Barkess and Simnett (1994) examined the association between the stability of auditor
tenure and the magnitude of NAS fees. They concluded that there was no relationship
between the level of NAS fees and auditor tenure.
Craswell (1999) investigated the influence of the level of NAS fees on the nature of
the audit opinion using Australian data for 1984, 1987 and 1994. The author found
that there was no association between audit opinion and the level of NAS fees
indicating that the level of NAS fees might not create a threat to auditor
independence.
DeFond et al. (2002) investigated the relationship between NAS purchases and the
issuance of a going concern opinion to examine the influence of NAS purchases on
auditor independence. They found no evidence that NAS purchases impair auditor

Chapter 3: Literature Review Victoria University
64
independence and concluded that the recent SEC regulations based on concerns that
NAS purchases impair auditor independence, are unfounded.
Ashbaugh et al. (2003) examined the influence of NAS purchases on auditor
independence. They found no evidence that NAS purchases impair auditor
independence.
On the other hand, many other studies have examined the perceptions of external
parties to determine the impact of NAS provision on auditor independence. For
example, Pany and Reckers (1983) investigated the perceptions of shareholders and
financial analysts regarding the relationships between the perceived threats to auditor
independence and different types of NAS. They found that the perceived threats to
auditor independence vary with the type of NAS indicating that different types of
NAS might pose different level of threats to auditor independence.
However, these results were countered by those of Glezen and Millar (1985). They
compared auditor approval voting by stockholders before and after the SEC issued
ASR No 250. They concluded that the magnitude of NAS fees did not threaten the
appearance of auditor independence.
The mixed results found in the literature make it difficult to draw conclusions from
these sources regarding the influence of the magnitude of NAS fees on auditor
independence. Some theorists use this lack of conclusive evidence to conclude that
the available empirical evidence does not support the argument that auditor
independence is harmed by providing NAS (Arrunada 1999). Carmichael and
Swieringa (1968) argued that although the potential impairment of independence
exists, this does not necessarily imply that it can, or will, occur. Others concluded that
attention should be given to the evidence that does imply impairment to auditor
independence.
In summary, regardless of the eventuality of an actual impairment to independence in
fact, damage to independence in appearance has been documented (e.g. Shockley
1982). Thus, it is very important to investigate the role of audit committees in
controlling NAS purchases to ensure that such services will not impair auditor
independence, which is very important to ensure high quality audit.

Chapter 3: Literature Review Victoria University
65
3.3.2.2 Audit Committee and Auditor Independence
The literature on audit committees and auditor independence provides support that
audit committees undertake actions to protect auditor independence which will reduce
their reputational and litigation-related losses. For example, Carcello and Neal (2000)
found that financially distressed firms with independent audit committees were more
likely to receive a going-concern qualification.
In addition, Carcello and Neal (2003) found audit firms, which issued initial going-
concern reports, were less likely to be terminated when the audit committee is
composed entirely of independent directors. These researchers suggest that different
audit committee characteristics critically impact ACE in performing their functions
and responsibilities (Abbott et al. 2003).
Abbott et al. (2003) examined the relationship between two audit committee
characteristics, namely, independence and activity, and the relative magnitude of NAS
purchases. They found that firms with independent and active audit committees had a
lower ratio of NAS fees paid to the incumbent auditors relative to audit fees.
However, they compounded only two of the audit committee characteristics
(independence and activity) into a single variable called audit committee effectiveness
ignoring the influence of the rest of audit committee characteristics on ACE and
ultimately on the NAS purchases. In addition, they did not investigate which of the
two audit committee characteristics contributes more to the control of NAS purchases.
Moreover, they used 2001 as their test period, which was the first financial year after
the SEC required all listed companies to disclose their audit and NAS fees. This
indicates that limiting NAS purchases might be a result of management’s desires to
send a positive message to the external users of the financial reports that management
acts in the best interest of the shareholders and other third parties and not because of
the audit committee efforts to control such purchases. In other words, the results of
this study might be driven by the new disclosure requirement by the SEC and not by
the presence of an effective audit committee.

Chapter 3: Literature Review Victoria University
66
In Australia, all listed companies were required to disclose their audit and NAS fees
early in the 70’s (Clift 1982), which makes Australia a perfect place to examine the
influence of having an effective audit committee and the magnitude of NAS fees.
Therefore, the following three research questions regarding NAS purchases are still
not addressed.
• What is the influence of having an effective audit committee, which meets all
the audit committee characteristics best practice and recommendation, on the
magnitude of NAS purchases?
• Which audit committee characteristic is the most important determinant of the
magnitude of NAS purchases?
• Are the ASX CGC best practices and recommendations regarding audit
committee efficient in the context of NAS purchases?
3.4 Summary
The focus on the audit committee as an important mechanism to ensure high quality
financial reports has lead to a quick expansion in audit committee literature. Audit
committee literature could be described as varied, open and U.S. based.
This chapter has two sections. While two general streams of research known as audit
committee formation and audit committee effectiveness (ACE) were reviewed and
discussed in detail in Section 1, a comprehensive review of audit committee literature
related to audit quality and the protection of auditor independence was presented and
analysed in Section 2.
Section 2 has two main parts. In Part 1, audit quality literature and the determinants of
such quality were presented. In addition, gaps in the literature in this area are
identified and the first three research questions regarding auditor selection are stated.
On the other hand, auditor independence literature were discussed and presented in
Part 2. In addition, the studies that examine the impact of ACE and audit committee
characteristics on the NAS purchases are discussed and critiqued in detail. Moreover,
gaps in the literature in this area are identified and the second three research questions
regarding NAS purchases are stated.

Chapter 4: Theoretical Framework Victoria University
67
CHAPTER 4: THEORETICAL FRAMEWORK
4.1 Introduction
In the last few years following the collapse of giant firms worldwide, more attention
has been given to enhance audit committee effectiveness as an important means to
ensure high quality financial reports. This chapter has three sections. In the first
section, the differences in audit committee frameworks and market developments
between Australia and Saudi Arabia are reviewed and illustrated.
The second section has two parts. Part 1 summaries audit committee theories and
identifies the strengths and weaknesses of such theories. The second part develops the
framework and model for this study and summarizes them in Figure 4.1. In the third
section, the hypotheses of this study will be developed and stated.
4.2 Australia and Saudi Arabia Compared
Although the BRC, ASX CGC and SMC recommendations aimed at improving audit
committee effectiveness (ACE) are quite similar in their requirements and their aims,
differences in audit committee frameworks and market developments still exist
between Australia and Saudi Arabia.
4.2.1 Audit Committee Framework
Australia's audit committee framework is sourced from a combination of statute,
listing rules and industry and professional bodies' codes of practice, standards and
guidelines. There is no legal requirement at present for a company or its board of
directors to form an audit committee. However, the Corporations Law Economic
Reform Program 9 (CLERP 9) proposals place a strong emphasis on reinforcing the
Australian principle-based approach to addressing governance matters and on
achieving a balance between regulation and co-regulation (Commonwealth Treasury
2002). CLERP 9 proposes mandatory audit committees for the top 500 listed
companies. Other companies will be able to apply the principles to suit their

Chapter 4: Theoretical Framework Victoria University
68
individual circumstances. Strong support has been articulated for the ASX CGC to
develop best practice standards for audit committees.
On March 2003, ASX CGC issued 10 principles aimed at enhancing corporate
governance in Australia (Australian Stock Exchange Corporate Governance Council
2003). Principle 4 has focused on audit committee establishment and structure. It
provides recommendations and guidelines to improve ACE. Although complying with
such principles and recommendations is not compulsory, all companies are required to
report any departure from ASX CGC recommendations and explain why they did not
comply?
The ASX Listing Rules (Australian Stock Exchange Corporate Governance Council
2003) require that companies listed on the ASX Top 500 must comply with the CGC
recommendations regarding the composition, operation and responsibilities of their
audit committees by 1 January 2005. However, Australian Stock Exchange Corporate
Governance Council Implementation Review Group Implementation (ASX CGC
IRG) recognized that the additional costs of having an effective audit committee
might be more than the benefits of such committee especially for small firms
(Australian Stock Exchange Corporate Governance Council Implementation Review
Group 2004).
As a result, the IRG suggested while the ASX Top 500 are required to establish a
formal audit committee, only the ASX Top 300 need to establish an effective audit
committee that complies with all the recommendations of the ASX CGC (Australian
Stock Exchange Corporate Governance Council Implementation Review Group
2004). This indicates that in Australia only partial mandating of the establishment of
an audit committee is taken place for Australian listed companies.
On the other hand, all companies listed on the ASX and not included in the ASX Top
300 are required to report if they have an audit committee or not and if not to explain
why? The disclosure regarding the audit committee and other corporate governance
mechanisms should be reported in a special section in the annual report called
corporate governance report (Australian Stock Exchange Corporate Governance
Council 2003).

Chapter 4: Theoretical Framework Victoria University
69
Such new disclosure requirements by the ASX provide a unique set of information
that has never been available before. This information could be used to investigate not
only the ACE, but also the effectiveness of other corporate governance mechanisms
such as board of directors and internal audit.
On the other hand, Saudi's audit committee framework is sourced only from statute
and professional bodies’ codes of practice, standards and guidelines. SMC is
responsible for developing and up-dating the Corporations Law in Saudi Arabia,
which should be consistent with Islamic rules.
In 1994, SMC issued its first regulation regarding audit committees known as Act 931
(Saudi Ministry of Commerce 1994). This Act required all public companies to form
an audit committee and provided a set of recommendations and guidelines regarding
the composition, operation and responsibilities of the audit committee. However,
these recommendations were not compulsory.
Moreover, the Saudi financial market (Tadawul 2003) does not have any listing rules
regarding audit committees. Most recently, the Saudi Organization for Certified
Public Accountants (SOCPA) issued its first draft regarding the recommendations and
guidelines aimed at enhancing the role of audit committees in corporate governance
(Saudi Organization for Certified Public Accountants 2003), but it is not clear yet
when the final draft will be available or who will adopt such recommendations (SMC
or SSM).
Unlike US companies where audit committees have the sole authority to appoint or
replace auditors, in Australia and Saudi Arabia, it is the shareholders at members'
meetings that have the sole authority to appoint or replace auditors. In other words,
the role of the audit committee in Australia and Saudi Arabia is only to recommend
auditors, but not to appoint or replace them.
In summary, it is clear that there are differences in audit committee frameworks
between the two countries. While Australian’s audit committee framework is sourced
from statute, listing rules and codes of best practices and guidelines, the audit
committee framework in Saudi Arabia is a combination of statute and codes of best
practice and guidelines as such framework lacks any listing rules by the SSM

Chapter 4: Theoretical Framework Victoria University
70
regarding the establishment or the structures of audit committees. These differences
justify the choice of the two countries to conduct this study.
4.2.2 Market Development
The ASX was formed in 1987 by legislation of the Australian Parliament, which
enabled the amalgamation of six independent stock exchanges that formerly operated
in the State capital cities (Australian Stock Exchange 1987). Each of those exchanges
had a history of share trading dating back to the 19th century.
The ASX capitalization has increased from $198 billon to $1.2 trillion in the period
between 1992 and 2006 (Australian Stock Exchange 2006). It is a developed market
and is considered as one of the primary markets worldwide. In addition, ASX is a
unified market, which means that it is a comprehensive, national market administered
by a single agency (Australian Stock Exchange 1987).
On the other hand, the history of the Saudi Stock Market (SSM) could be traced to the
1930s when the first public firm, the Arab Automobile Company, was established in
1934. The SSM began to emerge in the late 1970s when the number of public
companies increased considerably. However, due to the lack of trading regulation at
the time, stock trading was fairly limited through the early 1980s when oil prices were
increasing, which, in turn, resulted in an increase in both volume of trading and
market capitalization.
In 1985, the Saudi government placed all stock trading under the supervision and
control of the Saudi Arabian Monetary Agency (SAMA) and discontinued the existing
broker-based stock trading system. The government then authorized the domestic
commercial banks to act as brokers in order to protect the market against the adverse
effects of speculation and to help it develop and mature. This was also done so that
the stock market could develop in a manner that would contribute to national
development and was consistent with its policy of greater private sector participation.
The SSM has been listed in a database supervised by the International Finance
Corporation (IFC). This supervision indicates the IFC's recognition of the importance
of the SSM, which occupies an advanced position amongst new markets in many

Chapter 4: Theoretical Framework Victoria University
71
important indicators, including market value, the daily average of shares value, and
the price percentage of the annual profit.
In 2001, Tadawul, the second generation of the electronic trading system, was
launched replacing the IFC. Although the new trading system has facilitated the
trading process, nothing much has been done to enhance the regulations and listing
rules to reduce the risks associated with the SSM.
As a result, the Saudi Stock Exchange Commission (SSEC) was formed on July 2003
by the Saudi Council of Ministers (SCM) to review and update the regulations and
listing rules of the SSM (Saudi Council of Ministers 2003). However, it is expected
that this revision and updating process will take time before it will be completed and
changes will be made.
Equity market growth between 1990 and 2006, the number of transactions, volume
and value traded increased dramatically. Market capitalization has increased by 189%
to reach AU$ 120 billion and the all share index has increased by 157%. However, the
SSM is still considered as a developing market for the following reasons.
It lacks a complete set of regulations and listing rules that protect investors and
provide them with quality financial reports.
Even though it has more than 70 years of history, it is considered as a new market
in comparison to the American and Australian markets.
It is still an unofficial market. However, following the establishment of the SSEC,
it is expected that this market will become an official market in the near future.
It has a very small size with only 73 listed companies and a capitalization of AU$
120 billion.
There is some evidence that supports the classification of the SSM as a developing
market. First, although there plenty of investment chances exist in the SSM, very
limited foreigner capital is involved in this market due to the high risk associated with
developing markets. Second, the late establishment of the SSEC indicates the need for
reviewing and updating the SSM regulations and listing rules to reduce the high risk
associated with the uncertainty and to attract foreign capital.

Chapter 4: Theoretical Framework Victoria University
72
In summary, even though recommendations regarding the audit committee are similar
in Australia and Saudi Arabia, it is expected that such differences in audit committee
frameworks and market developments between the two countries may affect the
efficacy of such recommendations and ultimately impact ACE. While the efficacy of
BRC recommendations has been supported by a number of researchers as mentioned
before, the efficacy of the ASX CGC and SMC recommendations is still unknown.
Therefore, the following interesting question will be highlighted.
“Do different audit committee frameworks and market developments affect audit
committee effectiveness?
However, in this thesis, the possible causes of difference have been noted but not
tested because of the difficulty of measuring such factors and including them in the
regression analysis.
4.3 Audit Committee Theories
Although most of the studies that have examined audit committee formation and
effectiveness have used the agency theory framework, other theories have been used
to evaluate ACE. In this part, the agency theory and three other theories, namely,
institutional theory, actor-network theory and power theory are discussed briefly.
4.3.1 Agency Theory
The separation of management from ownership in the modern corporation provides an
ideal context for the operation of agency theory. Shareholders act as the principal with
interests in deriving maximum utility from the actions of the agent (management).
Conflicts arise because of the separation of ownership and management and the
inability of principals to observe the actions of the agent (Jensen and Meckling 1976).
Principals and agents have economic incentives to invest in various information
systems and control mechanisms to reduce agency costs associated with information
asymmetry (Jensen and Meckling1976 and Fama and Jensen 1983). These control
mechanisms might offer maximum gains for all parties since the agent would
otherwise bear agency costs that occur when principals discount the value of the firm,
based on the likelihood of adverse selection, shirking and moral hazard (Alchian and
Demsetz 1972 and Jensen and Meckling 1976).

Chapter 4: Theoretical Framework Victoria University
73
Management may use various means to indicate to others the quality of the
information they are providing. Demands for monitoring may result in external audits
(d Anderson et al. 1993), the use of outside directors (Fama 1980 and Anderson et al.
1993) and audit committees (Pincus et al. 1989 and Bradbury 1990). The use of audit
committees can be considered an important part of the decision control system for
internal monitoring by boards of directors (Fama 1980 and Fama and Jensen 1983).
Using an agency theory framework, prior research, which investigated the
relationships between the formation of audit committees and different agency costs,
has produced mixed results (e.g., Pincus et al 1989; Bradbury 1990) and has failed to
systematically evaluate the activities or effectiveness of such committees (Kalbers and
Fogarty 1993). Therefore, the formation of an audit committee does not necessarily
translate into an effective monitoring body (Sommer 1991 and Abbott et al 2002).
4.3.2 Institutional Theory
Institutional theory suggests that organizational structures in such an environment
become symbolic displays of conformity and social accountability (Meyer and Rowan
1977). In other words, internal operating processes loosely coupled with the
observable structures accomplish the real work of the organization. As a result,
organizations with the appropriate structures in place avoid deep investigations of
their operating core by external parties (Meyer and Rowan 1977).
Organizations are subject to rules and regulations to which they must conform to
ensure their legitimacy, have access to resources and ensure their survival (DiMaggio
and Powell 1983). However, these rules and regulations do not necessarily ensure that
organizations will continue to operate efficiently (Meyer and Rowan 1977).
DiMaggio and Powell (1983) suggested that institutional pressures would drive
organizations to adopt similar characteristics through the desire to organize
themselves in a manner that is similar to other organizations in the same environment.
They argued that a process of isomorphism could take place in three ways, namely,
coercive isomorphism, mimetic isomorphism and normative isomorphism.
In the context of establishing audit committees within organizations, coercive
isomorphism includes pressures exerted to establish audit committees by regulators or

Chapter 4: Theoretical Framework Victoria University
74
stock exchanges (SEC, NYSE, ASX and SMC). As a consequence, an increasing
number of organizations have established audit committees.
DiMaggio and Powell (1983) argued that mimetic isomorphism is a process of change
initiated internally by the organization. Mimetic change will occur when organizations
perceive that audit committees will contribute to the corporate governance structures
within these organizations.
Normative isomorphism emanates from the professionalism of involved individuals.
Accountants and auditors, through their professional bodies such as the American
Institute of Certified Public Accountants (AICPA) and the Institute of Internal
Auditors (IIA), have pushed for the creation of audit committees and guidelines for
their activities.
Fogarty (1996) concluded that the key attribute of institutional theory lies in its ability
to highlight the distinction between what organizations actually accomplish and what
their structures suggest to the external environment. This indicates that this theory is
very useful for researchers who aim to compare the best practice for audit committees
with the actual performance for such committees.
The institutional theory suggests that audit committee effectiveness is more
attributable to internal factors such as topics covered by the audit committee than to
external factors such as agency variables (Kalbers and Fogarty 1998). As a result,
researchers (e.g., Kalbers and Fogarty 1998) who have used institutional theory
argued that publicly available information is of limited use in getting at the reality of
the audit committee as one of the most important corporate governance mechanisms
and its effectiveness.
Kalbers and Fogarty (1998) used both agency theory and institutional theory to
investigate ACE. They argued that the use of agency theory alone could not
differentiate qualitative degrees of the audit committee as a corporate control
mechanism. Moreover, they found that ACE is more attributable to internal factors
than to external factors such as agency variables. However, they did not examine or
name specific internal factors in their study. Instead, they considered the failure to
establish relationships between ACE and agency variables as an indicator of the great
impact that internal factors could play in ACE.

Chapter 4: Theoretical Framework Victoria University
75
Kalbers and Fogarty’s study (1998) suggests that neither theory alone is as useful as
their synthesis. As a result, they suggested the use of both theories in any attempt to
evaluate ACE, but they did not specify a theoretical framework that could link the two
theories together.
4.3.3 Actor-Network Theory
The ideas underlying actor-network theory (ANT) were initially developed by a group
of French sociologists (Spira 1999). Law (1992) argued that ANT is a form of
sociological analysis concerned with the mechanics of power. The theory suggests
that society, organizations, agents and mechanics are effects generated in patterned
networks of diverse materials (Law 1992).
These networks are not always visible in social interaction. This allows a network to
be represented by a single actor (Spira 1999). This representation of the network by a
single actor is known as the translation process (Callon 1986). Ezzamel (1994: 218)
described translation as:
“…the process through which an agency enrols other agencies in order to
forge alliances in situation of organisational struggles and conflicts. The
process of translation specifically refers to how agents transform phenomena
into resources and resources into networks of power which seek to form
alliances and coalitions, to engineer antagonism and to constitute interests”.
ANT focuses on the generation of power and influence within and between networks.
Spira (1999) argued that ANT offers a richer picture than other theoretical
frameworks used in audit committee literature because ANT recognises the instability
and disintegration of networks and enables researchers to examine the complex
relationships among audit committee participants.
Studies that have used ANT as a theoretical framework to investigate accounting
issues were selective (e.g., Ezzamel 1994). Spira (1999) used ANT to offer a possible
explanation for the repaid increase in the popularity of audit committees by examining
the roles of the audit committee through the stories of audit committee participants.
He examined the ceremonial performance of the audit committee meetings and
assumed that such performance serves as a network resource and in the end

Chapter 4: Theoretical Framework Victoria University
76
establishes company legitimacy through reassuring resource provided by the
demonstration of concern for high standards of corporate governance.
Due to the confidentiality issues associated with the direct observation of an actor in
any network, studies that have utilized ANT to evaluate ACE used the perception-
based approach. However, the use of such method is often subject to academic
criticism as mentioned before.
4.3.4 Power Theory
Weber (1968) defined power as the ability to act successfully even against the
resistance of others. Although this definition is only one of many found in the
literature, it indicates the situations in which one social actor prevails over others.
Power often is described as an implicit element in the control of organizational action
(Pfeffer 1982). Components of organizations, such as audit committees, must possess
power to discharge their responsibilities.
French and Raven (1959) developed a typology of power that approaches the
construct by classification and illustration. In their original work, they identified five
power types: reward, coercive, legitimate, expert and referent. Mintzberg (1983)
combined reward and coercive powers in one type of power called sanctionary. He
described it as control over resources. Raven (1974) subsequently added information
power to their list. There have been many attempts to define and classify types of
power, which indicates the importance of the typology of power (Kalbers and Fogarty
1993). Although complete agreement does not exist, there is significant consensus that
power represents control over resources (reward and coercive), control over
information and its content (information), personal attributes (expert and referent) and
formal mandates (legitimate).
In the context of audit committees, Kalbers and Fogarty (1993) identified six types of
power that could affect ACE. Legitimate power results from the fact that an audit
committee is established through delegations of responsibility from the corporate
board of directors. However, this board of directors is charged with ultimate
accountability for corporate management.

Chapter 4: Theoretical Framework Victoria University
77
Despite the fact that the work of the audit committee may be reviewed by the board of
directors, the audit committee still holds important decision-making authority.
Sanctionary power results from the ability of the audit committee in making decisions
that can have impacts on rewards and punishments to other parties such as corporate
officers, the internal auditors and external auditors.
Because audit committee members are most often outside directors, they are
dependent on management, internal auditors, and external auditors for information. As
a result, the success of such committee depends on the institutional support that it will
get from all the three parties. Decisions made by the audit committee are rationally
influenced by the members' ability to obtain information and to use it in a way most
likely to accomplish audit committee objectives (information power).
Because audit committees are composed of individuals, the personal attributes of
members cannot be ignored. Members skilled in areas such as accounting, finance and
corporate relations could be expected to contribute to the effectiveness of such
committees and ultimately contribute to ACE (expert power).
Referent power indicates that audit committee members with personalities capable of
influencing others are likely to make a difference and will contribute to ACE. Finally,
the desire to do the work of the audit committee with a high level of involvement and
concern could be an important factor in determining ACE (will power).
Kalbers and Fogarty (1993) investigated the contribution of the power of audit
committees in 90 US firms. They proposed that audit committee effectiveness is
perceived as a function of the types and extent of audit committee power. They
classified the six types of power into two categories, namely, institutional powers
(legitimate, sanctionary and information) and personal powers (expert, referent and
will). They found that formal, written authority and observable support from
management played the most important roles in ACE (institutional powers). In
addition, their results revealed that the will power (diligence) has the most impact on
ACE among the personal powers.
Chapter 4: Theoretical Framework Victoria University
78
4.4 Theoretical Framework
ACE has been defined in different ways and in different contexts. For example,
Kalbers and Fogarty (1993:27) defined it as” the competency with which the audit
committee carries out its specified oversight responsibilities”. On the other hand,
Rittenberg and Nair (1993:3) stated that” an effective audit committee is the one that
fulfils its responsibilities”.
Moreover, the National Association of Corporate Directors (NACD) (2000) defined it
as a committee that can add value to the board of directors and the firm. It is clear
from such definitions that an effective audit committee is the one that can perform its
roles and duties effectively and will ultimately add value to both the board of directors
and its firm.
However, none of these definitions states which factors could contribute to ACE. As
mentioned in section 3-2-2, prior literature has identified four fundamental
determinants of ACE, namely, composition, authority, resource and diligence.
Therefore, for the purpose of this study, an effective audit committee is defined as a
committee that has specific composition, authority, resources and diligence to ensure
reliable financial reports, internal controls and risk management.
Roles and responsibilities of audit committees have developed over the years with the
influence of the recommendations of the Treadway Commission, BRC, Cadbury
Committee, ASX CGC and SOCPA aimed to enhance ACE. Rezaee and Farmer
(1994) identified three important developments in the roles of audit committees over
time. Prior to the mid 1970s the primary function of the audit committee was to
enhance the external financial reporting process by improving the effectiveness and
efficiency of the audit function. Since the mid 1970s the potential for audit
committees to play a broad corporate governance role has been recognised.
Nowadays, although the roles normally performed by audit committees vary in
accordance with the charter granted to them by the board of directors, such roles can
be classified into three groups:
1. financial reporting process;
2. internal auditors responsibilities and the external auditors’ activities; and

Chapter 4: Theoretical Framework Victoria University
79
3. corporate governance responsibilities.
However, audit committees may face an overload of duties due to the increase in their
responsibilities, which could adversely affect their effectiveness (Felo et al. 2003). As
a result, it is important to identify the primary roles of such committees and to
evaluate ACE in performing such roles.
This study is focused on the audit committee's roles in auditor selection and protection
of auditor independence because of two reasons. First, a number of researchers,
regulators and professional bodies (e.g., Birkett 1986, Braiotta 1994,SMC 1994, Blue
Robin Committee 1999, Ramsay 2001, Australian Stock Exchange Corporate
Governance Council 2003) has considered the nomination and selection of external
auditors and the protection of their independence to be the primary responsibilities of
the audit committee. For example, Saudi Ministry of Commerce (1994) stated that the
primary role of the audit committee is to nominate external auditors and to determine
the scope and the fees of the audit function. In addition, SMC recommended that the
recommendations made by the audit committee regarding the engagement of the
external auditors should be given heavy weight in the selection process.
Moreover, Ramsay (2001) highlighted the important role that the audit committee
should play in the engagement of the external auditors and the protection of their
independence. This report argued that the audit committee should be used to control
non-audit services provided by the incumbent auditors to ensure the independence of
such auditors.
Further, the recommendations of BRC and ASX CGC have considered the
engagement of external auditors and the protection of their independence to be the
major duties of the audit committees (Blue Robin Committee 1999 and Australian
Stock Exchange Corporate Governance Council 2003).
Finally, the collapse of Enron in 2001 has lead the US Congress to pass its first
legislation, Sarbanes-Oxley Act 2002, aimed at improving corporate governance. This
Act requires that the audit committee of a public company be directly responsible for
the appointment, compensation, and oversight of the work of any registered public
accounting firm employed by that company (Sarbanes-Oxley Act 2002).

Chapter 4: Theoretical Framework Victoria University
80
Second, independent audit committee members have incentives to protect their
reputational capital by assuming significant responsibility for the engagement of the
audit firm and the protection of its independence (Fama and Jensen 1983). An
independent director is an outside director who does not have strong psychological
and/or economic dependence on firm management (Baysinger and Butler 1985).
Independent audit committee members are generally high-reputation members of the
business community who view the directorate as a means to develop their reputations
as experts in decision control.
In addition, independent directors bear reputational risks and potential monetary
losses similar to those of non-independent directors, but receive far less direct
compensation (Romano 1989). Sahlman (1990) indicated that directors might suffer
both reputational and monetary damage from board service. Sclafane (1997) noted
that 43 percent of the federal securities suits filed in 1996 alleged accounting
irregularities.
As a result, independent audit committees are more likely to confront management,
rather than agree with them all of the time in issues relating to the engagement of
external auditors and the protection of their independence. This strong commitment
in such issues will help to ensure high quality financial reports and ultimately reduce
the probability of any reputational damage and litigation losses for independent audit
committee members, which could result from any financial failures.
Prior literature has identified different factors that might adversely influence auditor
independence such as audit and non-audit services fees and employment relationships
(Ramsay 2001). However, this study is focused only on the role of the audit
committee in controlling non-audit services (NAS) in order to protect the
independence of incumbent auditors because of two reasons, namely, the increased
debate of the influence of NAS on auditor’s independence following the collapses of
giant companies and the dramatic increase of the ratio of NAS fees to the total audit
fees over the last three decades.
First, there is an increasing debate regarding the impact of NAS on the independence
of auditors in the last few years following the financial failures of giant companies
worldwide (e.g., Enron, WorldCom and HIH). Even though prior literature has failed

Chapter 4: Theoretical Framework Victoria University
81
to provide evidence of a negative impact of NAS on auditor’s independence, the
perceived threat of such services on the independence of auditors provides an audit
committee with incentives to control NAS purchases (Abbott et al. 2003).
This perceived threat has lead some regulators, academics and professional bodies to
prohibit NAS or to ask for active control for such services. For example, in Saudi
Arabia that has never experienced any financial failure for any of its listed companies,
SMC prohibits the incumbent auditors from providing any kind of NAS to their
clients (Saudi Ministry of Commerce 1980). This may give a strong indication that
some of the corporation failures might be attributed to high ratio of NAS to the total
audit fees.
In Australia, although Corporation Law does not prohibit any types of NAS, it
requires firms to disclose both audit and NAS fees and supports the immediate
application of Professional Statement F1. Professional Statement F1 is a new
international harmonised standard for professional independence, which was
approved, by both CPA Australia and the Institute of Chartered Accountants in
Australia (ICAA) in May 2002 (Australian Accounting Research Foundation 2002).
F1 classifies NAS into three groups, namely, allowed services, restricted services and
prohibited services (Australian Accounting Research Foundation 2002). Restricted
services are those services that may be provided in circumstances when there are
appropriate safeguards to ensure an acceptable level of auditor’s independence. In
contrast, prohibited services are those that lack the existence of such safeguards (CPA
Australia and ICAA 2002). It should be noted that F1 has been superseded by the
issuance from the Accounting Professional and Ethical Standards Board APESB in
2006.
In the US, SEC (2000) proposed that NAS should be restricted. However, in the final
rules, the SEC prohibited certain types of NAS and required SEC registrants to
publicly disclose audit and NAS fees paid to their auditors in 2000 (Abbott et al.
2003). In addition, Sarbanes-Oxley Act (2002) prohibited 8 specific types of NAS that
the auditor cannot perform. Moreover, this Act stated that the incumbent auditor
might perform other NAS if these services were approved by the audit committee.
However, such approval should be disclosed in the firm’s periodic reports.
Chapter 4: Theoretical Framework Victoria University
82
Second, the ratio of NAS to the total audit fees has experienced a dramatic increase
over the last three decades (Sharma and Sidhu 2001).
Using the agency theory framework is not enough to evaluate audit committee
effectiveness and to explain variations in audit committee characteristics because it
assumes that the audit committee is a function of management’s desire to signal its
intention to increase the visibility of its actions (Kalbers and Fogarty 1993). In
addition, the agency framework assumes the ability of management to manipulate the
audit committee (Abbott and Parker 2000).
Independent, qualified audit committee members have incentives to confront
management, rather than agree with them all of the time (Abbott and Parker 2000).
Therefore, once the audit committee is composed of independent, qualified members,
the ability of management to manipulate such committee is at least reduced if not
eliminated. This indicates that one of the important assumptions of agency theory is
violated and makes it fall short to explain variations in audit committee
characteristics. However, the agency theory framework is very important in
examining ACE because such effectiveness will result in reduction of the agency
costs and information asymmetry.
Moreover, the presence of an audit committee with independent, qualified directors,
who have the will to act in the interest of shareholders, is not enough to ensure that
such committee will perform its primary duties effectively. An audit committee needs
to have authority and resources to discharge its duties effectively.
The power literature has shown the lack of perfect agreement among researchers.
Such lack could be attributed to differences in terminology, disciplines or contexts in
which power has been investigated (Kalbers and Fogarty 1993). In order to apply the
power theory in the context of audit committees, it is important to reassess and
rename power categories.
For the purpose of this study, power is classified into six different categories.
Independence power arises from the ability of independent audit committee members
to confront management rather than agree with them (referent) and to make decisions
that could influence rewards and punishments to other parties such as executives and
external auditors (sanctionary). Institutional support power (information power) arises

Chapter 4: Theoretical Framework Victoria University
83
from the availability of resources to the audit committee. In this study, the number of
audit committee members, which has been used in the audit committee literature
(Archambeault and DeZoort 2001), will be used to proxy for the information power.
Diligence power (will power) indicates the audit committee’s will to act in the
interests of shareholders. Prior audit committee literature has used the number of audit
committee meetings as a proxy for diligence (Abbott and Parker 2000). Authority
power (legitimate power) results from the existence of an adequate written authority
for the audit committee (audit committee charter). Expertise power (expert power)
arises from the notion that the presence of skilled members in areas such as
accounting and finance, could be expected to contribute to ACE. Financial literacy
power (literate power) arises from the notion that the presence of audit committee
members who are financially literate could enhance ACE because they will be able to
understand financial reports and ultimately take actions to ensure having high quality
reports.
Therefore, this study will use both agency and power theories as an underpinning
framework in order to evaluate ACE in the context of auditor selection and the
magnitude of NAS purchases. Figure 4.1 presents the model that will be used in this
study to test its hypotheses.
4.5 Hypotheses Development
Although actual audit committee effectiveness cannot be observed directly (Kalbers
and Fogarty 1993), audit quality has been used in prior literature to infer audit
committee effectiveness in the monitoring of external audit (e.g., Reinstein 1980;
Braiotta 1986; Castellano et al. 1989; Kalbers and Fogarty 1993).
DeAngelo (1981) defined audit quality as the likelihood that financial statement errors
or omissions will be detected and reported. This definition indicates that audit quality
has two important components, namely, competence and independence. Competence
refers to the capability of external auditors to discover financial statement errors or
omissions. On the other hand, independence refers to the probability that external
auditors will report a discovered breach in the financial reports.

Chapter 4: Theoretical Framework Victoria University
84
Both size and specialization have been used as proxies for audit quality. DeAngelo
(1981) found that larger audit firms have more incentives to detect and report
financial misstatements because a larger client base reduces dependence on a single
auditee. On the other hand, Craswell et al. (1995) asserted that specialist auditors are
able to earn quasi-specific rents on investments in brand name, knowledge and
training. These rents provide specialist auditors with incentives to maintain their
quality reputation.
In the presence of such quality differences, prior literature has identified two reasons
why management may prefer not to employ a high quality auditor. First, management
may prefer to select a compliant auditor, who would allow management enough
flexibility to attain earnings goals, while having sufficient credibility to allow
management to appear to be a good warden of the shareholders’ investment (Williams
1988). A high quality auditor may be less compliant to management’s wishes due to a
high level of expertise or to a high reputational investment.
Second, management may prefer not to select high quality auditors to avoid paying
any fee premium that is required by such auditors to compensate them for their
investments in brand name, knowledge and training (Abbott and Parker 2000). By
doing such, management reduces the cost of the audit process and as a result may
increase its own compensations especially when its compensations depend on
financial performance measures such as net income. Moreover, management may
argue that such selection was made to save shareholders’ money and that the saving
benefits from such decision will offset any costs that may result for the selection of a
low quality auditor.

Chapter 4: Theoretical Framework Victoria University
85
Figure 1: the relationships between ACE and audit committee characteristics and both Audit
Quality and the magnitude of NAS Purchases.
Audit Committee
Effectiveness (ACE)
AC
Inde
pend
ence
AC
Act
ivity
AC
Exp
ertis
e
AC
Fin
anci
al L
itera
cy
AC
Siz
e
AC
Cha
rter
Control of NAS
Purchases
The Auditor Selection
Process
NA
S Q
ualit
y
Prof
itabi
lity
Age
ncy
Cos
t
Cor
pora
te
Gov
erna
nce
Audit Committee Characteristics (Powers)
Control Variables

Chapter 4: Theoretical Framework Victoria University
86
Despite the fact that the engagement of a high quality auditor can ensure a high
quality audit and produce reliable financial reports, it is important to protect the
incumbent auditor’s independence throughout the audit period. Unlike auditor’s
competence, which could be maintained throughout the audit period by ensuring the
utilization of the same audit team, auditor independence could change at any time by
the presence of any of the factors that could negatively affect the incumbent auditor’s
independence such as NAS.
On the other hand, management may prefer to seek NAS from their incumbent
auditors for two reasons. First, management may desire to attain cost savings
associated with the use of the incumbent auditor to provide NAS. Beck et al. (1988)
argued that knowledge spillovers, resulting from providing joint services (audit and
NAS) by the incumbent auditors, would create cost savings, which accumulate to the
incumbent auditors as economic rents.
However, in a competitive market, the incumbent auditors are motivated to share a
portion of the cost savings with their clients to prevent them seeking NAS from
competitors. Therefore, management’s decision with respect to NAS purchases will
involve a trade-off between the relative discount that they will get from using the
incumbent auditor to provide such services and the costs associated with the external
perception of lower auditor independence.
Second, management may purchase NAS from the incumbent auditor to create
additional economic pressure that could result in a more compliant auditor who would
allow management enough flexibility to reach their earning goals (William 1988).
Levitt (2000), a previous chairman of the SEC, expressed his fears about the possible,
negative impact of NAS on auditor independence. He said that:
“ Consulting and other services shorten the distance between the auditor and
management and that independence if not in fact, then certainly in appearance
becomes a more elusive proposition.”
Prior literature has supported the notion that an audit committee with specific
characteristics undertakes actions to ensure the engagement of high quality auditors
and the protection of their independence to reduce the probability of the audit

Chapter 4: Theoretical Framework Victoria University
87
committee director reputational and litigation-related losses. For example, Abbott and
Parker (2000) argued that audit committee characteristics and not only its formation
are related to the auditor selection process. They found that firms with an audit
committee, which comprises solely outside directors and meets twice a year, are more
likely to hire an industry-specialist auditor. However, that study has a number of
limitations that has been demonstrated in Section 3.3.1.2.
In addition, Carcello and Neal (2000) found that financially distressed firms with
independent audit committees are more likely to receive a going concern qualified
audit report. Carcello and Neal (2003) concluded that audit firms which issue initial
going concern audit reports are less likely to be terminated when the audit committees
are independent.
Moreover, Baysinger and Butler (1985) argued that an effective audit committee,
which is independent from management, is likely to be more willing to confront
management on a variety of issues, including NAS purchases. Abbott et al. (2003)
found that firms with an audit committee, which is composed of independent directors
and meets four times a year, are more likely to have a lower ratio of NAS fees to the
total audit fees. Although such study provided evidence that effective audit
committees undertake actions to protect auditor independence by limiting the NAS
purchases, it has a few limitations that have been identified in Chapter 3.
Finally, given that the two primary audit committee roles are selecting/retaining the
external auditor and ensuring the independence of the incumbent auditor, the results
of the above studies suggest that different audit committee characteristics critically
influence the way that such a committee performs its roles.
Therefore, in this study, it is proposed that companies with an effective audit
committee are more likely to hire a high quality auditor compared to these with a non-
effective audit committee. In addition, it is hypothesized that companies with an
effective audit committee are more likely to have a lower magnitude of NAS
purchases compared to those with a non-effective audit committee.
An audit committee is considered effective if it is independent, literate, active, has at
least three members, has at least one expert and has a written charter. As a result, the
following two hypotheses will be examined in this study.

Chapter 4: Theoretical Framework Victoria University
88
Firms with an effective audit committee are more likely to select high quality external
auditors compared to those with a non-effective audit committee.
Firms with an effective audit committee are more likely to have a lower ratio of NAS
paid to the incumbent auditor, relative to total audit fees compared to those with a
non-effective audit committee.
While both the ASX CGC and SMC recommendations will be used as benchmarks for
audit committee effectiveness to investigate its relationships with audit quality in
Australia and Saudi Arabia, respectively, only the ASX CGC recommendations will
be used as benchmarks for audit committee effectiveness to investigate its
relationships with NAS purchases in Australia because of the prohibition of NAS
being provided by the incumbent auditors to their clients in Saudi Arabia (SMC
1980).
In other words, one of the objectives of this study is to examine the efficacy of the
ASX CGC and SMC recommendations in the context of auditor selection and NAS
purchases whenever it is applicable and to provide recommendations that could
enhance ACE in both countries.
However, because complying with such recommendations is costly, especially for
small firms, which have limited resources (ASX CGC 2003), it is important to
determine which audit committee characteristics have more impact on the auditor
selection process and the NAS purchase decision.
Therefore, in addition to the two general hypotheses, the relationships between
individual audit committee characteristics and both auditor selection and the NAS
purchases will be investigated as follows.
4.5.1 Independence
Independent audit committee members have two motivations to select a high quality
auditor and to limit the NAS purchases to ensure an acceptable level of auditor
independence. First, the selection of a high quality auditor and the limitation of NAS
purchases will help audit committee members to build and maintain their reputations

Chapter 4: Theoretical Framework Victoria University
89
as decision experts by assuring the detection and reporting of any breaches in the
financial reports (Fama and Jensen 1983).
The second motivation is to reduce the litigation concerns. Even though the audit
committee members may be effectively shielded from personal financial liability by
insurance or indemnification, they face costs given the time involved in mounting a
defence (Sahlman 1990). Sori and Karbhari (2006) found that auditor independence
would be safeguarded by the presence of independent audit committee. Therefore, the
following hypotheses will be examined.
Firms with an independent audit committee are more likely to select high quality
external auditors compared to those with a non-independent audit committee.
Firms with an independent audit committee are more likely to have a lower ratio of
NAS paid to the incumbent auditor, relative to total audit fees compared to those with
a non-independent audit committee.
4.5.2 Size
The number of audit committee members could be used as an indication or proxy for
the amount of resources available for such committee. Most recommendations (e.g.,
the BRC, ASX CGC, SMC) suggested that the minimum number of audit committee
members should be three members.
If an audit committee has only one member, it will be easy for management to put
pressure on him to convince him to support management rather than auditors on any
dispute. However, convincing a number of people with different backgrounds will be
a hard task. If an audit committee has only two members, it will be hard to get a
majority decision, as there are only two members.
Archambeault and DeZoort (2001) investigated the impact of audit committee size on
suspicious auditor switching. They found a negative association between audit
committee size and suspicious auditor switching. In addition, Felo et al (2003) found a
positive association between audit committee size and financial reporting quality.
Therefore, the following hypotheses will be examined.

Chapter 4: Theoretical Framework Victoria University
90
Firms with a high number of audit committee members are more likely to select high
quality external auditors compared to those with a small number of audit committee
members.
Firms with a high number of audit committee members are more likely to have a
lower ratio of NAS paid to the incumbent auditor, relative to total audit fees
compared to those with a small number of audit committee members.
4.5.3 Activity
The number of audit committee meetings has been used frequently in audit committee
literature to surrogate for diligence (willing to act). McMullen and Raghunandan
(1996) and Song and Windram (2000) found that companies with reporting problems
had less frequent audit committee meetings. In addition, Beasley et al. (2000)
examined the association between the number of audit committee meetings and the
likelihood of having fraud financial reports in the technology and health care
industries. The results of their study indicate that there was a negative relationship
between the number of meetings and the likelihood of fraud.
While Abbott and Parker (2000) failed to detect any association between the number
of audit committee meetings and the selection of a specialist auditor, Abbott et al.
(2003) concluded that companies with an audit committee that met at least four times
a year were more likely to have a lower magnitude of NAS purchases compared to
these with an audit committee that met less than four times. A possible explanation for
not finding any association between the number of meetings and audit quality could
be attributed to the use of only two meetings instead of four meetings.
Therefore, it is proposed in this study that the more frequently the audit committee
meets, the more such committee will perform its duties effectively and the following
hypotheses will be tested.
Firms with a high number of audit committee meetings are more likely to select a high
quality external auditor compared to those with a low number of audit committee
meetings.
Chapter 4: Theoretical Framework Victoria University
91
Firms with a high number of audit committee meetings have a lower ratio of NAS
paid to the incumbent auditor, relative to total audit fees compared to those with a
low number of audit committee meetings.
4.5.4 Charter
Authority could be described as a function of the responsibilities and influence of the
audit committee. Audit committee authority literature indicates that there is a wide
variation of responsibilities that could be performed by the audit committee and
highlights the importance of the audit committee charter in helping audit committee
members understanding their specific responsibilities (Kalbers and Fogarty 1993;
Coopers and Lybrand 1995).
In addition, audit committee members could be sued if anything goes wrong if they
failed to discharge their duties that have been stated in the audit committee charter.
Therefore, the following hypotheses will be tested.
Firms with an audit committee with a written charter are more likely to select a high
quality external auditor compared to those without a written charter.
Firms with an audit committee with a written charter have a lower ratio of NAS paid
to the incumbent auditor, relative to total audit fees compared to those without a
written charter.
4.5.5 Expertise
It is expected that the audit committee members’ skills play an important role in the
way that they discharge their duties (Kalbers and Fogarty 1993). Knapp (1987) found
that auditors might discount the audit committee’s oversight role if they believe that
the audit committee does not possesses the knowledge necessary to understand
technical auditing and financial reporting matters.
McMullen and Raghunandan (1996) found that companies with financial reporting
problems were less likely to have members who have a Certified Public Accountant
(CPA) on their audit committees. In addition, Archambeault and DeZoort (2001)
found that companies with suspicious auditor switches had fewer experts on their

Chapter 4: Theoretical Framework Victoria University
92
audit committees compared to those with non-suspicious audit switches. Moreover,
Carcello (2006) concluded that firms that have financial experts in their audit
committees were more likely to reduce earnings management.
The above studies indicate that an audit committee with at least one expert has the
ability to take actions to ensure high quality audit and to protect auditor’s
independence. Therefore, the following hypotheses will be tested.
Firms with an audit committee with at least one expert are more likely to select a high
quality external auditor compared to those without any expert.
Firms with an audit committee with at least one expert have a lower ratio of NAS paid
to the incumbent auditor, relative to total audit fees compared to those without any
expert.
4.5.6 Financial Literacy
Literate audit committees are better equipped to understand financial reports, auditor
judgements and disputes between management and the external auditors (DeZoort
1998). Song and Windram (2000) found that UK companies with an audit committee
with a higher level of financial literacy are less likely to have financial reporting
problems. Weil (2005) found a positive relationship between audit committee
financial literacy and stock market return.
The above results indicate that literate audit committees have the ability and the
incentives to take action to ensure high quality financial reports. Therefore, the
following hypotheses will be tested.
Firms with a literate audit committee are more likely to select a high quality external
auditor compared to those with a non-literate audit committee.
Firms with a literate audit committee with at least one expert have a lower ratio of
NAS paid to the incumbent auditor, relative to total audit fees compared to those with
a non-literate audit committee.

Chapter 4: Theoretical Framework Victoria University
93
4.6 Summary
In this chapter, differences between Australia and Saudi Arabia in terms of audit
committee frameworks and market developments were reviewed and discussed in
detail. In addition, four different theories that have been used in the literature to
examine different issues related to audit committee were presented and analyzed.
Then the theoretical framework of this study was developed in the light of these
different theories. Finally, 14 different hypotheses were developed and stated in order
to answer the seven research questions.

Chapter 5: Methodology Victoria University
94
CHAPTER 5: METHODOLOGY
5.1 Introduction
Conducting a research project requires the development of an appropriate research
approach and the adoption of data collection techniques. The quality of the collected
data determines the quality of the findings of the research (Gill and Johnson 2000).
The use of a particular methodology for a research project depends on the scope,
purpose and target population of the study as well as the resources available to the
researcher. Therefore, it is fundamental that in order for researchers to achieve their
research objectives, they have to adopt the right methodology and select the right data
collection techniques through which they can collect the required data within their
available resources (Gill and Johnson 2000).
In this chapter, a brief review of research approaches and data collection techniques
are presented. In addition, the research approach, the data collection techniques and
the research design that will be used in this study are discussed in detail. This includes
sample selection, test period, variables (dependent, independent and control variables)
and regression.
5.2 Brief Review of Research Approaches and Methods
In social science, there are two general research approaches that are widely
recognized, namely, quantitative and qualitative approaches.
5.2.1 Quantitative Approach
The quantitative approach is an inquiry into an identified problem, based on testing a
theory (deductive), measured with numbers and analyzed using statistical techniques.
The goal of this approach is to determine whether the predictive generalizations of a
theory hold true (Frankfort-Nachmias and Nachmias 1996).
Because quantitative research is deductive, researchers deal directly with the
operationalisation, manipulation, prediction and testing of empirical variables.

Chapter 5: Methodology Victoria University
95
Therefore, quantitative research places great emphasis on methodology, procedure
and statistical measures of validity (Frankfort-Nachmias and Nachmias 1996).
Consequently, quantitative research should be organised to show a clear progression
from theory to operationalisation of concepts; from choice of methodology and
procedures to the data collected; and from statistical tests to findings and ultimately
conclusions (Frankfort-Nachmias and Nachmias, 1996).
There are four general types of quantitative methods (Smith 2003).
1. Experimental Method: Experimental research is characterized by random
assignment of subjects to experimental conditions and the use of experimental
controls.
2. Quasi-Experimental Method: Quasi-experimental researches share almost all
the features of experimental designs except that they involve non-randomized
assignment of subjects to experimental conditions.
3. Survey Method: Surveys include cross-sectional and longitudinal studies using
questionnaires or interviews for data collection with the intent of estimating
the characteristics of a large population of interest based on a smaller sample
from that population.
4. Archival Method: Archival research is based on historical (secondary) data
and uses cross-sectional or/and time-series data to investigate a problem.
5.2.2 Qualitative Approach
The qualitative approach is a process of inquiry with the goal of understanding a
social or human problem from multiple perspectives and conducted in a natural
setting with a goal of building a complex and holistic picture of the phenomenon of
interest. Quantitative data are all data that are collected in numerical form (Hussey
and Hussey 1997). One of the main advantages of a quantitative approach to data
collection is the relative ease and speed with which the research can be conducted.
On the other hand, qualitative research is inductive in nature. Qualitative researchers
use field research methods, primary case studies and participant observation within
natural settings. The report will present much descriptive material and should also
show how the observations prompted the researcher to analyse and isolate variables
Chapter 5: Methodology Victoria University
96
(induction) and how, in turn, these variables may be developed into a theory
(Frankfort-Nachmias and Nachmias, 1996). Qualitative data are concerned with
qualities and non-numerical characteristics.
Qualitative data collection methods can be expensive and time consuming, although it
can be argued that qualitative data in business research provides a more real basis for
analysis and interpretation. Moreover, a qualitative approach presents problems
relating to rigour and subjectivity (Hussey and Hussey, 1997).
There are three general types of qualitative methods (Mason 1996).
1. Case Studies: In a case study the researcher explores a single entity or
phenomenon bounded by time and activity (e.g., a program, event, institution,
or social group) and collects detailed information through a variety of data
collection procedures over a sustained period of time. The case study is a
descriptive record of an individual's experiences and/or behaviors kept by an
outside observer.
2. Ethnographic Studies: In ethnographic research the researcher studies an intact
cultural group in a natural setting over a specific period of time. A cultural
group can be any group of individuals who share a common social experience,
location, or other social characteristic of interest -- this could range from an
ethnographic study of rape victims in crisis shelters, to children in foster care,
to a study of a cultural group in Africa.
3. Phenomenological Studies: In a phenomenological study, human experiences
are examined through the detailed description of the people being studied --
the goal is to understand the ‘lived experience’ of the individuals being
studied. This approach involves researching a small group of people
intensively over a long period of time.
5.3 Brief Review of Data Collection Techniques
Searching for data can be a time-consuming and expensive activity, so it is essential
that researchers quickly develop the skills necessary to locate and use data sources
effectively (Smith 2003). In terms of nature, data could be classified into two
categories: primary data and secondary data. Primary data refer to information that is

Chapter 5: Methodology Victoria University
97
developed or gathered by the researcher specifically for the research project at hand.
Primary data may be obtained using different data collection techniques including
surveys, interviews, focus groups and observations.
Where the needed data do not exist, the researcher will have no choice but to obtain
those data directly. Although it may be more costly than using already existing data,
collecting new data has distinct advantages. Greater control can be achieved over the
measures that are used, as well as over the procedures and staff employed to collect
the data. The reliability and validity of these data may thereby be increased.
On the other hand, secondary data refer to information that has previously been
gathered by someone other than the researcher and/or for some other purpose than the
research project at hand. In other words, secondary data are existing, publicly
available data. Secondary data may be obtained using archival records technique.
These records could include literature, databases, public press, journals and
newspapers.
The most important advantage of secondary data is it is often inexpensive or even
provided free to the researcher (Patzer 1995). Another advantage is that secondary
data require a relatively short collection time (Patzer 1995). The disadvantage,
however, is that there may not be a perfect fit between what the researcher is trying to
measure and the purposes for which the data were collected (Patzer 1995).
To choose the most appropriate data collection technique, the researcher should assess
the relative advantages and disadvantages of data collection techniques and clarify the
nature of the trade-offs that are faced in such choice. The researcher’s inputs into the
decision should include the availability of needed data, the level of resources that may
be dedicated to collecting data, the constraints on time available to collect them and
the amount of confidence that the researcher needs to have in the results.
5.4 The Research Approach in This Study
This study uses the quantitative approach because its goal is to determine whether the
predictive generalizations of the power theory in the context of the audit committee
hold true. Therefore, this study is organised to show a clear progression from theory

Chapter 5: Methodology Victoria University
98
to operationalisation of variables, from choice of methodology and procedures to the
data collected and from statistical tests to findings and, ultimately, conclusions.
5.4.1 Research Methods
The archival research method will be used in the Australian context because the
nature of the required data to conduct this study on Australian listed companies
indicates that such data are publicly available (secondary data). The decision to rely
on secondary data sources was made for the following reasons.
Data availability. Given that the data required to conduct this study are
publicly available, it was not considered necessary to generate new data for
this specific research study.
Audit committees should be perceived as effective. The perception of
effectiveness is influenced by audit committee characteristics. The availability
of data within the public domain to evaluate audit committees is therefore
required.
Unlike using primary data, which is characterized as being time-consuming
and expensive, using secondary data is a more time- and cost- efficient
decision.
On the other hand, a combination of two research methods, namely, the archival and
survey research methods is used in the Saudi Arabian context because the nature of
the required data to conduct this study on Saudi listed companies highlights the need
of both primary and secondary data as the main data sources. While data regarding
external auditors, board of directors and agency cost variables for Saudi listed
companies are publicly available, data regarding different audit committee
characteristics for Saudi listed companies are not available within the public domain.
Despite the fact that there are different data collection techniques (e.g., mail-
questionnaire, E-mail questionnaire, interviews and internet) that have been used in
the survey literature, mail-questionnaire (questionnaire hereafter) and interview
techniques have been dominant in such literature (Smith 2003).

Chapter 5: Methodology Victoria University
99
The survey literature has identified a number of advantages and disadvantages
associated with the use of the two data collection techniques (e.g., Oppenheim, 2000
and Smith, 2003).
Table 5.1 provides a brief summary of the advantages and disadvantages of both mail-
questionnaire and interview techniques.
Table 5-1 Advantages and disadvantages of questionnaire and interviews techniques
Technique Advantages Disadvantages
Questionnaire * Less expensive to conduct * Bigger sample sizes are possible * Bias is not a problem
* Poor response rate * Only certain types of person respond to a questionnaire which may introduce a certain amount of bias
Interviews *Higher response rate * Explanation can be given to misunderstood questions * More information may be gained during the interview
* Possibility of the introduction of bias * Response rate may be low * Time consuming and costly
To choose between the two techniques, the researcher assessed their relative
advantages and disadvantages and the trade-offs involved in such decision. As a
result, the questionnaire was adopted to collect primary data regarding different audit
committee characteristics. The reasons for using a questionnaire in this research,
which are also consistent with the views of Foddy (1999) and Oppenheim (2000), are:
1- it is the most common method of data collection in survey research because it
assures the anonymity of respondents and enables them to respond more freely
and at their convenience. This has a positive effect on the credibility of the
research since the data gathered are believed to be representative of the
respondents’ knowledge of the subject;
2- it is suitable for an individual researcher who has limited resources in terms of
time and financial resources; and
3- it can be distributed to large numbers of respondents and a wider range of
respondents gives greater credibility to the data collected.

Chapter 5: Methodology Victoria University
100
5.4.2 Questionnaire (Research Technique)
The questionnaire is a technique for collecting data. It is the most frequently used
method in the social science field (Easterby-Smith et al 2002). It is a highly structured
method of collecting specific information as a response to highly directed questions. It
is simply a list of questions that take the form of closed-ended or/and open-ended
questions. Questionnaires tend to be used to explore attitudes and opinions about
certain issues and to obtain data that are not available within the public domain.
Therefore, the primary purpose of the questionnaire in this study was to collect data
regarding different audit committee characteristics in Saudi listed companies using the
SMC recommendations and guidelines as benchmarks.
5.4.2.1 Procedures of the questionnaire survey
During the planning stage of this study, it was essential to investigate the availability
of the required data to conduct this study in Australia and Saudi Arabia. This
investigation revealed that only data regarding different audit committee
characteristics in Saudi listed companies are not publicly available. Therefore, it was
important to conduct a questionnaire survey to collect such data because this method
is generally found to be the best technique to collect data from a large group of
respondents in a short time and provides the opportunity for the respondents to give
frank and precise answers.
In this study, audit committee members in Saudi listed companies were the key
informants because one of the aims of this study is to collect data regarding different
audit committee characteristics.
5.4.2.1.1 Questionnaire Design
Saunders et al. (2000) described conducting a questionnaire as the process of
translating concepts into measurable variables. The questionnaire was designed and
developed by the researcher after a review of the SMC recommendations and
guidelines aimed at improving the role of audit committees as means to enhance
corporate governance in Saudi public companies. The aim of the questionnaire was to
collect the data necessary to evaluate different audit committee characteristics using
the SMC recommendations and guidelines as benchmarks.

Chapter 5: Methodology Victoria University
101
In the design of the questionnaire attention was paid to the guidelines set out by
Bourque and Fielder (1995), in particular in terms of the number of questions, the
range of response categories, and the clarity of the instruction given. Bourque and
Fielder (1995) suggested that, in order to help the potential respondents to fill out the
questionnaire without need for assistance, the questions must be as easy as possible,
short and precise. Bourque and Fielder (1995, p. 17) stated that the questions on self-
administered questionnaires must be closed-ended ones. All the questions were
closed-ended and encouraged the identification of a specific response from a selection
given but in a number of questions there was scope for an answer outside the range
given.
Bourque and Fielder (1995) identified a number of benefits of incorporating different
styles of questions into the questionnaire. One is that it provides the questionnaire
with the necessary flexibility. Another is that it avoids undue uniformity in the
questionnaire and attracts the respondent’s attention. Therefore, different styles of
questions were used in the questionnaire, namely, yes/no style; 4 points scale style
and tick one or more of a list style.
The first draft consisted of 18 questions and was classified into two sections. While
the first section involved general questions regarding audit committees, the second
section sought specific data regarding audit committee members. This first draft was
then discussed with the researcher’s main supervisor and co-supervisor and a number
of comments and suggestions were made.
As a result, these comments and suggestions yielded the revised questionnaire, which
consisted of 16 questions. A third optional section was added for participants who
wish to receive a summary of the results of this study. The revised questionnaire was
then translated, pilot tested, edited and distributed.
Originally, the questionnaire was constructed in English. Because the general
language of the target population was Arabic, the questionnaire had to be translated
into their language. The purpose of the Arabic version of the questionnaire was to
permit respondents with little or no knowledge of English to participate in the survey.
This was a very important stage in this study since any mistakes in translation could
change the meaning and context of the questionnaire. A translation firm produced an

Chapter 5: Methodology Victoria University
102
official translation of the questionnaire. Then, the researcher made the necessary
corrections to the terminology. To ensure the accuracy of the translation, the
translated questionnaire was given to two specialists in the Arabic language and a
number of the researcher’s colleagues.
5.4.2.1.2 Pilot Study (Pre-Testing)
Social science researchers emphasize the importance of conducting a pilot study to
establish that the proposed questionnaire is understandable and clear to the members
of the target population. For example, Salant and Dillman (1994) argued that although
pre-testing a questionnaire is time-consuming, it is absolutely essential to ensure a
quality questionnaire.
In addition, Alreck and Settle (1995) stated that even well trained and highly
experienced researchers could find some changes that would improve the performance
of the questionnaire by conducting a pilot study.
In order to conduct the pilot study, the revised questionnaires were sent to four
accounting academics in Saudi Universities, two of whom are specialised in audit
committees, four audit committee members in Saudi listed companies, four Saudi
Ph.D. students and four Saudi master students who are studying accounting in
Australia.
Table 5.2 below shows the response rate of the pilot study that was conducted before
the main survey study.
Table 5-2 Pilot Study Response Rates
Piloting Parties Sent Response Response Rate
Academics 4 2 50%
Audit Committee Members 4 2 50%
Ph.D.’s Students 4 4 100%
Master’s Students 4 4 100%
All questionnaires used to conduct the pilot study had a cover letter explaining the
nature and objectives of the research and the procedures that will be undertaken to
ensure confidentiality. The participants were asked to comment on the questionnaire
in terms of clarity and design. In all, sixteen questionnaires were sent out, of which

Chapter 5: Methodology Victoria University
103
twelve were returned. The researcher received many useful comments and suggestions
from conducting the pilot study. In the light of these comments and suggestions a
number of changes and corrections was made. This stage yielded a pilot-tested
questionnaire that consisted of 15 questions.
Then, this pilot tested questionnaire was sent to two specialists in statistics in Saudi
Arabia to check the types of statistical tests that might be done for interpretation and
analysis. Few comments and suggestions were received from the two specialists
because they stated that this questionnaire seems to be very simple and
straightforward. The aim of this pilot test was to assess whether the research
instrument was valid and reliable. Validity and reliability will be discussed in details
in section 5.4.2.2.
After taking into account these comments and suggestions, the final version of the
questionnaire was ready to be distributed by mail to audit committee members via the
contact persons in all Saudi listed companies.
5.4.2.1.3 Questionnaire Structure
The final questionnaire was divided into three sections. The first section has 9 general
questions regarding audit committees. The second section has 5 specific questions
regarding audit committee members. The last section has an optional question for
participants if they are willing to get a summary of the results of this study via the E-
mail.
The final questionnaire consists of 15 questions 14 of which related to different audit
committee characteristics and used the SMC recommendations and guidelines as
benchmarks for such characteristics.
Table 5.3 classifies the questionnaire's questions according to the six different audit
committee characteristics that have been identified in Chapter 4 (the full questionnaire
is attached as Appendix 1 for the English version and Appendix 2 for the Arabic
version).
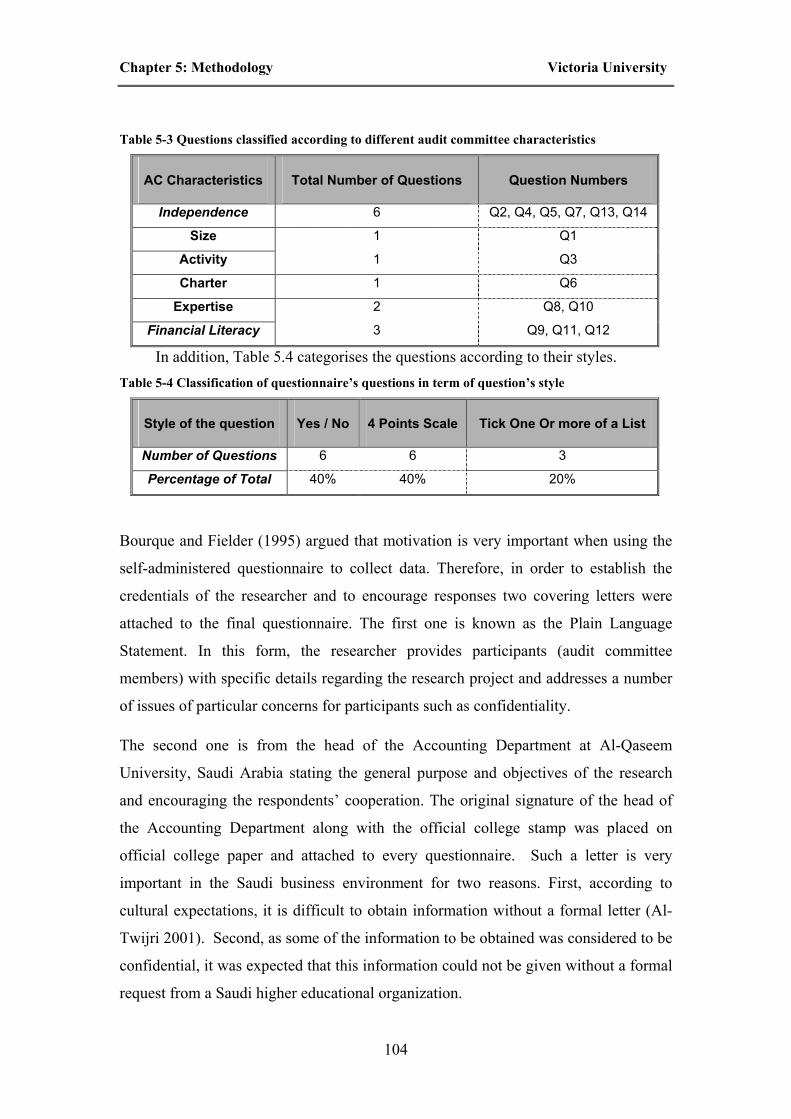
Chapter 5: Methodology Victoria University
104
Table 5-3 Questions classified according to different audit committee characteristics
AC Characteristics Total Number of Questions Question Numbers
Independence 6 Q2, Q4, Q5, Q7, Q13, Q14
Size 1 Q1
Activity 1 Q3
Charter 1 Q6
Expertise 2 Q8, Q10
Financial Literacy 3 Q9, Q11, Q12
In addition, Table 5.4 categorises the questions according to their styles. Table 5-4 Classification of questionnaire’s questions in term of question’s style
Style of the question Yes / No 4 Points Scale Tick One Or more of a List
Number of Questions 6 6 3
Percentage of Total 40% 40% 20%
Bourque and Fielder (1995) argued that motivation is very important when using the
self-administered questionnaire to collect data. Therefore, in order to establish the
credentials of the researcher and to encourage responses two covering letters were
attached to the final questionnaire. The first one is known as the Plain Language
Statement. In this form, the researcher provides participants (audit committee
members) with specific details regarding the research project and addresses a number
of issues of particular concerns for participants such as confidentiality.
The second one is from the head of the Accounting Department at Al-Qaseem
University, Saudi Arabia stating the general purpose and objectives of the research
and encouraging the respondents’ cooperation. The original signature of the head of
the Accounting Department along with the official college stamp was placed on
official college paper and attached to every questionnaire. Such a letter is very
important in the Saudi business environment for two reasons. First, according to
cultural expectations, it is difficult to obtain information without a formal letter (Al-
Twijri 2001). Second, as some of the information to be obtained was considered to be
confidential, it was expected that this information could not be given without a formal
request from a Saudi higher educational organization.

Chapter 5: Methodology Victoria University
105
5.4.2.1.4 Preliminary Contacts
Bourque and Fielder (1995) noted preliminary contact with the potential respondent
ahead of sending the actual questionnaire could increase the response rate. Given the
particular nature of the Saudi business culture it was considered essential to make
such preliminary contact. Each Saudi listed company has a contact person. In this
stage, preliminary contacts were made with all the contact persons via telephone calls
and/or e-mails. This preliminary contact also served to establish whether or not the
company had an audit committee and the number of audit committee members if it
exists. The results of this preliminary contact are as follows.
• The total listed companies in the Saudi Stock Market (SSM) were 71 at
31/12/2003.
• 68 listed companies (96%) have an existing audit committee and therefore 3
companies (4%) do not have such committee.
• 10 companies (15%) required a letter from the researcher to the company’s
manager to get his or her permission to distribute the questionnaires to the audit
committee members.
• 15 companies (22%) preferred sending their questionnaires by fax instead of
mailing them.
• In term of the number of the audit committee members, 11 listed companies
(16%) have 2 audit committee members, 54 listed companies (80%) have 3 audit
committee members and 3 listed companies (4%) have 4 audit committee
members.
• In terms of the questionnaire’s language, only 10 audit committee members (5%)
preferred the English version of the questionnaire.
• For each company that has an existing audit committee, the percentage of non-
executive directors on the board and the percentage of non-executive directors on
the audit committee were obtained from the contact person.
5.4.2.1.5 Distribution, Response and Follow –Up
A letter and a number of questionnaires which matched the number of the audit
committee members (with the two covering letters) with a self-addressed stamped

Chapter 5: Methodology Victoria University
106
return envelope were mailed to the contact person in each Saudi listed company. In
the letter, the contact person was asked to distribute the questionnaires to audit
committee members, to encourage them to complete the questionnaire and to collect
and return the completed questionnaires.
As the population of interest consisted of all audit committee members in Saudi listed
companies, a total of 190 questionnaires were sent to audit committee members in the
66 Saudi listed companies, which have an existing audit committee via the contact
persons in these companies. This would eliminate any sample bias that could result
from selecting a sample of the population of interests.
Despite the fact that there were 68 Saudi companies with an audit committee at the
end of 31 December 2003, the questionnaire was sent only for 66 companies as the
Saudi Electricity and Saudi Telecommunication were the only company in each
sector, which make them inappropriate to examine the association between audit
committee and the selection of a specialist quality auditor because there will be only
one auditor for each sector which does not meet the minimum requirements of having
more than one company for each industry or sector in order to identify a specialist for
such industry or sector .
The total number of the completed questionnaires, which were received after one
month from sending them and before the follow-up, reached 80 questionnaires. This
represents approximately a 42% response rate.
Follow-up technique is one of the most effective ways to increase the response rate. It
is used either to check if the respondents received the instrument or to remind them to
complete and return it. In recent years, researchers have greatly improved the
response rate to data collection in mail surveys by using the follow-up technique (e.g.,
Dillman 2000, Al-Motuz 2003).
The follow-up technique includes sending a reminder letter or a postcard to
respondents who have not replied within the period that has been given for them to
reply. In addition, the follow-up technique includes telephone calls, faxes, e-mails and
field visits to respondents who have not replied.

Chapter 5: Methodology Victoria University
107
In this study, all these follow-up procedures were used to increase the response rate.
These procedures increased the completed questionnaires, which were received after
two months from sending them by 21 (11%) questionnaires. As a result, a total
number of 91 questionnaires were received at the end of the data collection period. As
a result, the final response rate reached approximately 53%, which is considered to be
satisfactory in social research. DeZoort et al (2002) received 27% as a response rate in
their studies after two requests among audit committee members in the USA and they
consider this rate is normal.
5.4.2.2 Reliability and Validity
There is a great concern about reliability and validity in any research project.
Reliability is concerned with the consistency of the results obtained on repeated trails.
This is reflected when the same respondent is re-examined with the same test on
different occasions or with different sets of equivalent items (Reda 1992).
Since it is often impossible to arrange for people to be tested on the same question on
two occasions to assess reliability, an alternative method is to look at the consistency
of a person's response on an item at the same point in time and the degree of
agreement for which the measurement is obtained (De Vaus 1996).
This approach will provide a measurement of the overall reliability of the scale and
the index. This measurement is known as " Cronbach’s Alpha" in statistics. All scores
of the coefficient alpha are ranges between 0 and 1. The higher the coefficient, the
more reliable the scale. As a rule of thumb, alpha should be at least 0.7, which is
deemed the minimum scale considered reliable (De Vaus 1996).
For the purpose of this study, the researcher decided to use Cronbach’s Alpha to test
the reliability of the survey. This test could be done using the Statistics Programme
for Social Sciences (SPSS) computer package. The results of this test revealed that
Cronbach’s Alpha was approximately 0.76, which is higher than the minimum scale
that could be considered reliable.
Validity is one of the aspects, which the researcher wished to measure. The validity of
a measure depends on how the researcher defines the concept to be measured (De

Chapter 5: Methodology Victoria University
108
Vaus 1996). If a test measures what it intends to measure, it will be considered as a
valid measure.
In order to get reliable results, it is necessary to use a reliable and valid questionnaire
for the collection of data (Reda 1992). In this study, the validity of the questionnaire
was insured via several practical professionals and experienced academicians who
participated in the pilot study as discussed earlier in this chapter.
5.4.3 Sample Selection
In order to evaluate the impact of different audit committee characteristics on the
auditor selection process and NAS purchase decision (only in Australia), it was
necessary to choose the test periods, to determine the populations of interest, to select
random samples where applicable and to find out data sources.
In any study, it is essential to determine the test period, to define clearly the
population of interest and to seek to ensure that the sample selected provides an
accurate representation of that population (Weisberg and Bowen 1977)
5.4.3.1 Australia
The financial year 2004 was selected as the test period for Australian listed
companies. This selection was made because of the following reasons.
• The new CGC recommendations were finalized and released on 31 March
2003, so it was necessary to give listed companies one year (more than 9
months for some companies) to comply with the new ASX CGC
recommendations regarding audit committees.
• Although the CGC recommendations regarding audit committees were
released on 31 March 2003, these recommendations will not become
compulsory for companies within the S&P/ASX 300 index2 before 1 January
2005. This means that during the financial year 2004, all ASX listed
2 The S&P/ASX 300 index contains the largest 300 listed companies, changes over time and does not
necessary contains 300 all the time.

Chapter 5: Methodology Victoria University
109
companies (including the Top 300) were not required to comply with such
recommendation. However, listed companies need to explain any departure of
these recommendations.
As the ASX listed companies change over time, it was necessary to select a specific
date during the 2004 financial year to determine the list of the ASX companies that
will be the initial population for this study. Therefore, 30 June 2004 was chosen
because most of the ASX listed companies have 30 June as the end of their financial
year.
The researcher contacted the ASX to obtain an official list of all the ASX listed
companies on 30 June 2004 through E-mail. The ASX people were very helpful and
they sent back the official list on Excel file to the researcher’s E-mail. There were
1639 companies in the official list that has been received.
Despite the fact that during 2004 the GCG recommendations were not compulsory for
all the ASX listed companies, these recommendations became compulsory for
companies within the S&P/ASX 300 index only on 1 January 2005. This might affect
the degree and time of compliance of the listed companies with the CGC during the
test period. As a result and for additional and sensitivity tests analysis, it was essential
to divide the initial population into two sub-populations.
The first sub-population included companies within the S&P/ASX 300 index. A list of
this index was obtained on 30 June 2004 from Standard & Poor’s (S&P) Database.
At that date, there were 303 companies in the index. The second sub-population
consisted of the rest of ASX listed companies, which were not listed in the S&P/ASX
300 index (1336 companies).
Then each of these sub-populations was reduced for one or more of the following
reasons.
• The unavailability of data for companies due to delisting, suspension or
having missing data.
• The use of specialization as one of the proxies for audit quality requires
that only listed companies that fall in one of the 24 industrial
classifications will be included in the population. This means that all the

Chapter 5: Methodology Victoria University
110
listed companies that are described as having GICS (Global Industry
Classification Standard) Sector Code Not Applicable will be excluded.
• Given the nature of this study which aims to evaluate the ACE in the
context of auditor selection and NAS, it was necessary to reduce the
population to include only these listed companies that have an audit
committee for the full financial year.
• As this study aims to explore the ACE in the context of auditor selection
and NAS, Telstra, which was audited by Auditor General, was excluded
from the first sub-population because this auditor is assigned by the
government which owns a majority of Telstra shares (lack of free auditor
selection process).
These reductions resulted in the final first and second sub-populations of 297 and 753,
respectively. Table 5-5 shows the number of companies in the initial two sub-
populations, the reduction made and the final two sub-populations.
Table 5-5 the initial and final two sub-populations
ASX Top 300 ASX Non-Top 300
Initial Population 303 1336
- Suspended, delisted or not available 4 66
299 1270
- GICS Code not Available - 84
299 1186
- Companies without an Audit Committee 1 433
298 753
-Telstra 1 -
Final Population 297 753
Then a sample of 100 companies was randomly selected from 297 companies within
the ASX Top 300 (ASXT sample). In addition, another sample of 200 companies was
randomly selected from the 753 companies within the ASX Non-Top 300 (ASXNT
sample). Then these two samples were added together to form the full Australian
sample (ASX sample).

Chapter 5: Methodology Victoria University
111
The ASX companies are classified into 10 sectors, 24 industry groups, 65 different
industries and 146 sub-industries (ASX 2005). However, most of the Australian
studies that investigated variety of issues had used the ASX classification into
industry groups. Therefore, Table 5.6 presents the ASX, ASXT and ASXNT classified
by the ASX 4-digit industry group categories.
Table 5-6 the Three Australian Samples Classified by the ASX 4-digit industry group categories
ASX Code
Industry Groups ASX ASXT ASXNT
1010 Energy 13 6 7 1510 Materials 56 20 36 2010 Capital Goods 19 7 12 2020 Commercial Services & Supplies 17 4 13 2030 Transportation 11 3 8 2510 Automobile & Components 5 2 3 2520 Consumer Durables & Apparel 5 2 3 2530 Consumer Services 14 3 11 2540 Media 9 5 4 2550 Retailing 8 4 4 3010 Food & staples Retailing 2 1 1 3020 Food, Beverage & Tobacco 14 4 10 3030 Household & Personal Products 0 0 0 3510 Health Care Equipment & Services 23 6 17 3520 Pharmaceuticals & Biotechnology 15 4 11 4010 Banks 5 3 2 4020 Diversified Financials 28 3 25 4030 Insurance 4 2 2 4040 Real Estate 15 10 5 4510 Software & Services 17 6 11 4520 Technology Hardware & Equipment 8 2 6 4530 Semiconductors Equipment 0 0 0 5010 Telecommunications 10 1 9 5510 Utilities 2 2 0
Total 300 100 200
It should be noted that the number of companies that belong to Household & Personal
Products and Semiconductors & Semiconductor Equipment were 1 and 2 companies,
respectively. These very small numbers of companies along with the small value of
the total audit fees for these two-industry groups have lead the researcher to exclude
companies within these two-industry groups.
As mentioned in the methodology section, all the required data to conduct this study
in Australia were available within the public domain. The sources of these data are
The CONNECT 4 Database, ASX Database, Data Analysis Database and companies’
websites.

Chapter 5: Methodology Victoria University
112
5.4.3.2 Saudi Arabia
The SMC recommendations to enhance ACE have been there since 1994. However,
some amendments have been made to these recommendations in the period from 1997
to 1999.
In addition, a survey must be conducted (time constraint) in 2004 to obtain data
regarding different audit committee characteristics. In this survey, audit committee
members will be asked to provide data about themselves and their audit committees
for the financial year ended on 31 December 2003.
Moreover, as this study compares ACE in Australia and Saudi Arabia, it is important
to have the same testing period for both countries or at least very close to avoid any
impact of having two completely different test periods. Further, the majority of the
Saudi listed companies use 31 December as their financial year-end. As a result, the
financial year ended in 31/12/2003 will be used as the testing period for Saudi listed
companies.
The initial population in Saudi Arabia was all the Saudi listed companies on 31
December 2003 obtained from the Tadawul Database. In order for a Saudi listed
company to be included in this study, it has to meet three criteria:
1. has an existing audit committee;
2. has available data regarding different audit committee characteristics obtained
using the questionnaire; and
3. does not belong to the electricity and telecommunication sectors, as both of
these sectors have only one company, which make them inappropriate to
model audit quality.
As the purpose of the questionnaire is to collect data regarding different audit
committee characteristics in Saudi listed companies, a listed company will be
included in the analysis if at least one of its audit committee members has completed
the questionnaire. Despite the fact that 91 questionnaires were received (53%) from
the audit committee members in the Saudi listed companies, these 91 questionnaires
present only 44 listed companies. As a result, the full Saudi Sample consisted of only

Chapter 5: Methodology Victoria University
113
44 companies, which present approximately 62% of the Saudi listed companies at the
end of 2003.
The SSM classified the listed companies into 7 different sectors. Table 5.7 shows the
SSM sample classified into five different sectors, as the other two sectors were
excluded from the analysis as discussed early in this section.
Table 5-7 the SSM sample classified into five different sectors
Sectors
SSM
Banks 4 Industrial 17 Cement 5 Services 13
Agriculture 5 Total 44
In the Saudi Arabian context, different data sources were used, namely, Tadawul
Database, public press, SMC website, companies websites and the completed
questionnaires.
5.4.4 Research Design
This section is divided into two parts. In the first part, the association between ACE
and auditor selection will be examined using regression analysis. In addition, the
determinants of audit quality among the different audit committee characteristics will
be investigated in this part to identify the most important determinant of audit quality.
This part will be conducted on Australian and Saudi listed companies.
In the second part, the relationships between ACE and NAS purchases will be
examined using regression analysis. In addition, the determinants of NAS purchases
among the different audit committee characteristics will be investigated in this part to
identify the most important determinant of audit quality. This part will be conducted
only in Australia because the Saudi Corporation law prohibits providing NAS by the
incumbent auditors to their clients.
Finally, the ASX CGC and SMC best practices and recommendations will be used in
this study as benchmarks for the different audit committee characteristics in the ASX
and Saudi listed companies.

Chapter 5: Methodology Victoria University
114
5.4.4.1 Audit Committee Characteristics and Auditor Selection
5.4.4.1.1 Audit Quality (Dependent Variable)
Prior literature of auditor selection (choice) suggested that audittees demand different
levels of audit quality and auditors vary in quality levels (e.g., DeAngelo 1981 and
Craswell et al. 1995). As was discussed in Section 4.5, audit quality cannot be
observed directly. However, prior literature has used a number of proxies to surrogate
for audit quality.
First, DeAngelo (1981) argued that big audit firms have two reasons to provide higher
quality audit. First, they have large client bases, which will reduce their dependence
on a single client (auditee). Second, they have more to lose in terms of quasi-rents
from a great number of clients by failing to report discovered breaches in a particular
client’s financial reports.
In addition, Klein and Leffler (1981) found that the higher observed Big 8 audit fees
in competitive markets were consistent with positive returns to Big 8 in brand name
reputation for higher quality audits. The findings of these studies support the notion
that the audit market perceives quality differences between big audit firms and non-
big audit firms. As a result, a number of studies has used audit firm size as a proxy for
auditor quality in investigating variety of issues (e.g., Beatty 1989, Menon and
Williams 1991 and Reynolds and Francis 2000).
The use of audit firm size as a proxy for audit quality does not account for the
differences in audit quality between specialist-Big 4 and Non-specialist-Big 4 and
between the second tier and the small audit firms. Moreover, although the collapse of
Enron has lead many writers and researchers to question the use of size as a proxy for
audit quality, audit quality literature continues to use such proxy (Watkins et al.
2004).
Second, the last two decades have experienced dramatic change in firms’ size,
complexity and industry specialization. This change provided audit firms with
incentives to specialize in specific industries to differentiate themselves from their
competitors. Gramling and Stone (1998) argued that industry-specialist auditors
should provide higher quality audits for one or more of the following reasons.

Chapter 5: Methodology Victoria University
115
1. They have better audit technologies;
2. They have lower costs through economies-of-scale; and
3. They have superior knowledge due to economies-of-knowledge
In addition, behavioural literature has revealed that there was a relationship between
the industry knowledge of the auditors and their quality in performing audit tasks. For
example, Johnson et al. (1991) concluded that industry-relevant experience improved
the probability of detecting fraudulent income reporting. Moreover, Solomon et al.
(1998) found that industry specific knowledge influenced auditors’ performance in
completing industry-specific audit tasks.
Archival and survey studies also support that specialist auditors offer higher quality
audit. For instance, O’Keefe et al (1994) found that industry-specialist auditors
increased audit quality as measured by the auditor’s degree of compliance with
GAAS. Further, Shockley and Holt (1983) concluded that auditors with largest market
shares (specialist) were perceived as higher quality suppliers (a survey study).
Finally, Craswell et al. (1995) and DeFond et al. (2000) concluded that specialist Big
8 auditors (Big 6) earn a premium over non-specialist Big 8 auditors (Big 6). This
premium is consistent with a quality differences between the two groups. However,
these two studies failed to detect any industry-specialist auditor within second tier and
small audit firms. In other words, these studies concluded that specialization exists
only among the Big 8 (Big 6).
As a result of the evidence provided by the specialization literature, most recent
research has used auditor’s specialization as a proxy for audit quality to examine
diversity of issues (e.g., Abbott and Parker 2000; Houghton et al. 2002; Chen et al.
2005).
However, the lack of a clear-cut definition for the term “specialist auditor” has
produced different measures (methods), which could be used to identify industry-
specialist auditors (Houghton et al., 2002).
Prior literature has identified three primary methods for identifying specialist auditors
(Abbott and Parker 2000). Craswell et al. (1995) (hereafter AQ_Craswell) defined an

Chapter 5: Methodology Victoria University
116
industry-specialist auditor as an auditor who earns 10% or more of the total audit fees
in this industry.
Palmrose (1986) (hereafter AQ_Palmrose) identified an industry-specialist auditor as
the auditor who audits the highest share of the total industry sales revenue (an
industry leader). In addition, any other auditor auditing industry sales revenue within
15 percent of the total sales revenues audited by the industry leader is also considered
a specialist auditor.
Dopuch and Simunic (1982), Eichenseher and Danos (1981) and Cullinan 1998) used
continuous market share data (hereafter AQ_Continuous) relating to client (auditee)
sales to identify industry-specialist auditors.
Unlike the AQ_Craswell and AQ_Palmrose methods, which use a dichotomous
(dummy) variable with a value of 1 for those firms employing specialist auditors and
0 otherwise, AQ_Continuous uses the percentage of client (auditee) sales audited in
each industry to indicate the degree of specialization of the client’s auditor.
The AQ_Craswell and AQ_Palmrose methods have been critiqued for the use of
arbitrary market share percentages in determining who is an industry-specialist
auditor and for not accounting for the differences in audit quality among the Non-
specialist-Big 4, second tier and small auditors (Abbott and Parker 2000).
Third, Beasley and Petroni (1998) used a proxy that combined the size and
specialization proxies to examine the association between board independence and
audit quality for the insurance industry in US. This proxy has three levels of auditor’s
quality, namely, specialist-Big audit firms, non-specialist-Big audit firms and non-Big
audit firms.
Despite the fact that the use of the three levels of quality proxy would detect the
differences in audit quality among specialist-Big 4, Non-specialist-Big 4 and the rest
of audit firms, it failed to detect such differences between the second tier and small
auditors. In addition, the use of an arbitrary market share percentage continues to be
problematical, as the AQ_Continuous method of specialization cannot be used with
this proxy. Moreover, this proxy has been used rarely in the literature (Abbott and
Parker 2000). As a result, this proxy will not be used in this study.

Chapter 5: Methodology Victoria University
117
In summary, despite the fact that there is a number of proxies and methods that have
been used in the literature to proxy for audit quality, only the AQ_Continuous method
would be used in this study to conduct the main regression analysis to model audit
quality. The decision to use that method was made because it overcomes the
disadvantages associated with other proxies and methods such as the arbitrary
selection of the cut-off points or ignoring the differences between different levels of
audit quality.
However, auditor size proxy and, AQ_Craswell and AQ_Palmrose methods are used
to conduct sensitivity tests to illustrate the impact of using different proxies or
specialization methods on results of the main analysis.
In order to examine the association between ACE and auditor quality and the
determinants of audit quality among the different audit committee characteristics, the
following two regression models, which have been used in the prior literature to
model the auditor selection process (e.g., Abbott and Parker 2000 and Beasley and
Petroni 2001) would be used in Australia and Saudi Arabia.
Regression 1A
AUD_QUAL = α + β1 ACE + β2 BO_IND + β3 IN_OWN + β4
LEVERAGE + β5 NEW_FUND +β6 BUS_SEG
+ β7 ROA + β8 LN_SALE + β9 FOR_SALE + C
Regression 1B
AUD_QUAL = α + β1 AC_IND + β2 AC_SIZE + β3 AC_ACT +
β4 AC_CHAR + β5 AC_EXP +β6 AC_LIT + β2
BO_IND + β3 IN_OWN + β4 LEVERAGE + β5
NEW_FUND +β6 BUS_SEG + β7 ROA + β8
LN_SALE + β9 FOR_SALE + C
Where:
AUD_QUAL is the dependent variable and it represents the audit quality. It is
important to recognize that the above regressions present general regressions to model
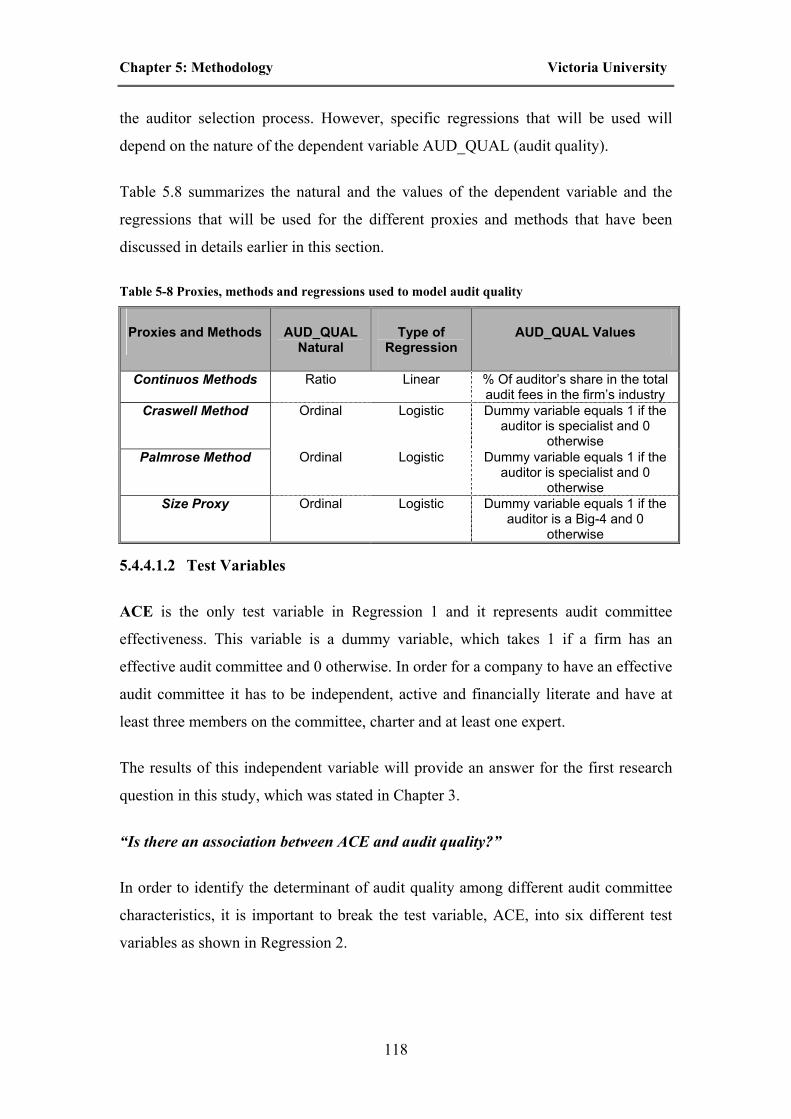
Chapter 5: Methodology Victoria University
118
the auditor selection process. However, specific regressions that will be used will
depend on the nature of the dependent variable AUD_QUAL (audit quality).
Table 5.8 summarizes the natural and the values of the dependent variable and the
regressions that will be used for the different proxies and methods that have been
discussed in details earlier in this section.
Table 5-8 Proxies, methods and regressions used to model audit quality
Proxies and Methods AUD_QUAL Natural
Type of Regression
AUD_QUAL Values
Continuos Methods Ratio Linear % Of auditor’s share in the total audit fees in the firm’s industry
Craswell Method Ordinal Logistic Dummy variable equals 1 if the auditor is specialist and 0
otherwise Palmrose Method Ordinal Logistic Dummy variable equals 1 if the
auditor is specialist and 0 otherwise
Size Proxy Ordinal Logistic Dummy variable equals 1 if the auditor is a Big-4 and 0
otherwise
5.4.4.1.2 Test Variables
ACE is the only test variable in Regression 1 and it represents audit committee
effectiveness. This variable is a dummy variable, which takes 1 if a firm has an
effective audit committee and 0 otherwise. In order for a company to have an effective
audit committee it has to be independent, active and financially literate and have at
least three members on the committee, charter and at least one expert.
The results of this independent variable will provide an answer for the first research
question in this study, which was stated in Chapter 3.
“Is there an association between ACE and audit quality?”
In order to identify the determinant of audit quality among different audit committee
characteristics, it is important to break the test variable, ACE, into six different test
variables as shown in Regression 2.

Chapter 5: Methodology Victoria University
119
Therefore, instead of having only one test variable (ACE) in Regression 1, there will
be six test variables in Regression 2. These variables are as follows.
AC_IND refers to audit committee independence. The ASX CGC (2003, 19) defined
an independent director as:
“An independent director is independent of management and free of any
business or other relationships that could materially interfere with – or could
reasonably be perceived to materially interfere with – the exercise of their
unfettered and independent judgement”
On the other hand, the SMC (1994) defined an independent director as a non-
executive director who has no direct or indirect interests in the transactions and
contracts of the company. Although the ASX CGC definition seems more
comprehensive, they are very similar.
The independence of the audit committee from management will be measured by
classifying audit committee members as independent directors or non-independent
directors. In the light of the ASX CGC and SMC definition of independent directors, a
non-independent director is an inside director or a non-executive director who:
was an executive director within the last three years;
is a substantial shareholder in the company;
is related to an executive of the company; or
is a major supplier, customer or consultant to the company.
The required information to evaluate audit committee members’ independence in
ASX listed companies was taken primarily from the annual reports, which could be
accessed via Connect 4, Data Analysis and ASX databases. It should be noted that the
related-party notes were examined in order to determine if an audit committee
member is independent or not.
On the other hand, the independence of audit committee members in Saudi listed
companies will be assessed using the answers of Q2, Q3, Q4, Q7, Q13 and Q14
obtained from the completed questionnaires.

Chapter 5: Methodology Victoria University
120
After the assessment of the audit committee members’ independence is made, the
independent variable AC_IND equals 1 if the audit committee complies with the ASX
CGC and SMC recommendations for an independent audit committee, and 0
otherwise (dummy variable).
AC_SIZE refers to the number of the audit committee members. Both the CGC and
SMC recommend that the audit committee should consist of at least three members.
The number of the audit committee members is very straightforward and could be
known easily from the Corporate Governance Section in the annual report of the ASX
listed companies and from the answer to Q1 in the completed questionnaires.
The independent variable AC_SIZE equals the number of audit committee members
and it is expected to have a positive association with auditor quality.
AC_ACT refers to the number of meetings that have been held during the test period.
While ASX CGC did not recommend a specific number of meetings as a minimum;
instead they recommend that the audit committee should meet adequately to discharge
its responsibilities effectively. The SMC stated that an audit committee should meet at
least three times a year.
With respect to the best practice on the frequency of audit committee meetings, Blue
Robin Report (1999), Ramsay (2001) and Saudi Association of Certified Public
Accountants (2003) recommended that the audit committee should meet annually at
least four times to discharge its role effectively.
However, it is expected that an audit committee with only one meeting will not be as
effective as another audit committee with three meetings. Therefore, the independent
variable AC_ACT equals the number of meetings held by the audit committee during
the test period.
The number of audit committee meetings in the ASX listed companies is available
within the Corporate Governance Section in the annual report. On the other hand, this
number in Saudi listed companies is obtained from the answer of Q3 in the completed
questionnaires.
AC_CHAR refers to the existence of an audit committee charter. The ASX CGC
(2003) recommended that the audit committee should have a formal charter. In

Chapter 5: Methodology Victoria University
121
addition, this charter should clearly set out the audit committee’s role and
responsibilities, composition, structure and membership requirements.
Despite the fact that the SMC did not recommend anything regarding having an audit
committee charter, audit committee members in the Saudi listed companies were
asked if they do have such charter or not. The independent variable AC_CHAR is a
dummy variable, which takes 1 if the audit committee has a charter and 0 otherwise.
AC_EXP refers to the expertise of the audit committee members. The ASX CGC
(2003) defined an expert audit committee member as an audit committee member who
is a qualified accountant or other professional with experience of financial and
accounting matters and recommended that at least one of the audit committee
members should be expert.
On the other hand, the SMC (1994) did not provide any definition or
recommendations regarding audit committee expertise. However, the SOCPA (2003)
required Saudi public companies to have at least one expert in their audit committees.
Therefore, this study will consider audit committee members to possess such expertise
if they are qualified accountants, certified public accountants or a chief financial
officer.
The required data to assess audit committee members’ expertise in the ASX listed
companies are available within the annual reports. While such data in Saudi listed
companies will be obtained from the answers of Q8 and Q10 in the completed
questionnaires. The independent variable AC_EXP equals 1 if at least one member of
the audit committee was an expert and 0 otherwise (dummy variable).
AC_LIT refers to audit committee financial literacy. The ASX CGC (2003) defined
financial literacy as the ability to read and understand financial statements and
required that all audit committee members should be financially literate. On the other
hand, the SMC (1994) defined financial literacy as having a good command of
financial and accounting practices and required that all audit committee members
should be financially literate.
While it is clear that there is a similarity in the definition and the requirements
between the ASX CGC and SMC, it is obvious that there is no direct measure to

Chapter 5: Methodology Victoria University
122
assess such financial literacy. As a result, proxies should be used to provide indirect
measurement for such variable.
For the purpose of this study, an audit committee member is considered as being
financially literate if he or she is:
• a member of a recognized professional body;
• having banking or investment management experience;
• holding or having held the position of Chief Executive Officer; or
• having directorial memberships in more than one company in different industries.
The dependent variable AC_LIT equals 1 if all the audit committee members are
financially literate and 0 otherwise.
Finally, the results of the six different audit committee characteristics will provide an
answer to the second research question that has been mentioned in Chapter 3.
“Which audit committee characteristic is the most important determinant of audit
quality?”
5.4.4.1.3 Control Variables
Prior literature on auditor selection has identified a number of variables that influence
the auditor selection process. These factors could be classified into four groups,
namely, corporate governance, agency, finance and profitability variables.
The first group includes corporate governance variables. For example, Jensen (1982)
and Leddy (1982) argued that the board of directors is important in the auditor-choice
decision. In addition, Beasley and Petroni (2001) investigated the association between
the board composition and the auditor selection. They found that firms with a high
percentage of outside directors on the board were more likely to be associated with
higher quality auditors than firms with a lower percentage of outside directors on the
boards.
The second group includes agency variables. For example, Chow (1982), Simunic and
Stein (1987) and Francis and Wilson (1988) examined the association between

Chapter 5: Methodology Victoria University
123
different agency costs and the selection of auditors using U.S and Canadian data.
They found positive relationships between agency costs, such as client size, diffusion
of ownership and leverage (debts) and the quality of auditors.
Similarly, Firth and Smith (1992) tested the association between two agency
variables, namely, management ownership and leverage, and the quality of auditor
using companies seeking a stock market listing on the New Zealand Stock Exchange.
They concluded that the lower the percentage of management ownership, the greater
the demand for high quality auditors (Big 8) and the higher the leverage, the greater
the demand for high quality auditors.
The third group includes finance and information-needs variables. For example,
DeFond (1992) and Johnson and Lys (1990) examined the relationship between the
acquisition of new funds and the auditor quality. The authors argued that specialist
auditors (high quality auditors) provide more credibility that is especially valuable to
companies around the time of debt and equity issuance. Their results indicated that
firms that need new funds are more likely to select specialist auditors.
In addition, Eichenseher (1985) examined the impact of foreign operations on the
domestic auditor selections of the USA firms. The author found that firms with
substantial foreign operations were more likely to select a Big 8 auditor than a non-
Big 8 auditor. Specifically, the results of this study revealed that for both
manufacturing and non-manufacturing firms, the tendency to employ non-Big 8
auditors declined when the firm has at least 10% of its assets outside the USA.
Moreover, Simon (1997) and Abbott and Parker (2000) argued that firm’s complexity
influences the auditor selection process and, therefore, they used it as a control
variable in their regressions. The results of their studies indicated that there was a
positive relationship between the complexity of the firms and auditor quality.
The final group includes auditee profitability variables. For example, Johnson and Lys
(1990) and Abbott and Parker (2000) argued that more profitable firms are more
likely to pay the fee premium associated with high quality auditors simply because
such firms have deeper pockets than less profitable firms.
Chapter 5: Methodology Victoria University
124
Consistent with prior literature, the above four-groups variables were included in the
regression to overcome their effects on the auditor selection process and were
operationalized as follows.
• OUTSIDER refers to the percentage of non-executive directors on the board;
equals the number of non-executive directors on the board divided by the total
number of directors on the board and is expected to have a positive relationship
with auditor quality.
• IN_OWN refers to the management ownership; equals the percentage share
ownership that management have in the company and is expected to have a
negative association with auditor quality.
• LEVERAGE refers to the company's debt; equals the ratio of total debt to total
assets as measured at the end of the test period and is expected to have a positive
association with auditor quality.
• NEW_FUND refers to the firm’s acquisition of new funds; equals the total of new
debt and equity issuances divided by the total as for the end of the testing period
and is expected to have a positive relationship with auditor quality.
• BUS_SEG refers to the complexity of the firm’s operations; equals the number of
business segments during the testing period and is expected to have a positive
relationship with auditor quality.
• ROA refers to the profitability of the firm; equals net income divided by the total
assets at the end of the testing period and is expected to have a positive association
with auditor quality.
• SIZE refers to the size of the firm; equals the natural log of total sales and is
expected to have a positive association with the auditor quality.
• FOR_SALE refers to the percentage of the firm’s foreign sales; equals foreign
sales divided by total sales at the end of the testing period and is expected to have
a positive relationship with auditor quality.

Chapter 5: Methodology Victoria University
125
Table 5-9 shows the description of the variables in Model 1 that will be used as a
reference for all the variables in the tables in the remaining chapters.
Table 5-9 Description of the variables in Model 1 Variable
Name Description
Dependent Variable:
AQ The market share of the company's auditor in audit fees in the company's industry.
Test Variables:
ACE Audit committee effectiveness. Coded 1 if the audit committee meets all the six audit committee characteristics criterion; 0 otherwise.
AC_IND Audit committee independence. Coded 1 if the audit committee has a majority of independent directors; 0 otherwise.
AC_SIZE The number of the members of the audit committee.
AC_ACT The number of meetings of the audit committee per year.
AC_CHAR Audit committee charter. Coded 1 if the audit committee has a charter; 0 otherwise.
AC_EXP Audit committee expertise. Coded 1 if the audit committee has at least one expert; 0 otherwise.
AC_LIT Audit committee literacy. Coded 1 if all the audit committee members are financially literate; 0 otherwise.
Control Variables:
OUTSIDER Percentage of the board members who are non-employee directors.
IN_OWN The cumulative percentage of voting control held by managers and directors.
LEVERAGE Ratio of total long-term debt/total assets.
NEW_FUND the total of new debt and equity issuances divided by the total assets
BUS_SEG The number of business segments.
ROA Return on assets.
SIZE Natural log of total assets
FOR_SALE The market share of the company's auditor in the NAS fees in the company's industry.

Chapter 5: Methodology Victoria University
126
5.4.4.2 Audit Committee Characteristics and Non-Audit Services
5.4.4.2.1 Non-Audit Services
Non-audit services (NAS), also known as management consultancy services, can be
described as the engagement of an outside firm or individual to provide
recommendations to a firm’s management and/or to be charged with planning and
implementing some course of action for corporate management (Firth 1997).
Abdel-khalik (1990) argued that it is difficult to structure an empirically testable
model of the determinants of NAS purchases. He identified two reasons that caused
the difficulty in testing the determinants of NAS purchases. The first reason is related
to the problem of explaining the selection between external and internal consultants.
In some instances, external consultants may provide higher quality services at lower
costs than do internal employees. The second reason is attributed to the difficulty of
observing factors that might influence NAS purchases.
However, a number of attempts has been made in the prior literature to form a model
that could explain the variation in NAS purchase decisions. As a result, a number of
studies has used quite similar regression models to investigate the determinants of
NAS purchase decisions (e.g., Palmrose 1986, Parkash and Venable 1993, Barkess
and Simnett 1994, Firth 1997, Abbott et al. 2003).
Consistent with these studies, two multivariate regressions were used in this study to
examine the association between the percentages of NAS and the independent (test)
variables.
However, it should be noted that these regressions would be used only to model NAS
purchases in Australian listed companies because the Saudi Corporation law prohibits
providing NAS by the incumbent auditors to their clients.
Regression 2A
NAS_RATIO = α + β1 ACE + β2 BO_IND + β3 IN_OWN + β4
LEVERAGE + β5 ROA + β7 LN_SALE + β8
SH_BLK + β9 FOR_SALE + C

Chapter 5: Methodology Victoria University
127
Regression 2B
NAS_RATIO = α + β1 AC_IND + β2 AC_SIZE + β3 AC_ACT +
β4 AC_CHAR + β5 AC_EXP +β6 AC_LIT + β2
BO_IND + β3 IN_OWN + β4 LEVERAGE + β5
ROA + β7 LN_SALE + β8 SH_BLK + β9
FOR_SALE + C
Where:
NAS_RATIO is the dependent variable; refers to the ratio of non-audit service fees to
audit fees and equals the total NAS fees including information technology fees (IT
fees) divided by the total audit fees.
5.4.4.2.2 Test Variables
ACE is the only test variable in Regression 3 and it represents audit committee
effectiveness. This variable is a dummy variable, which takes 1 if a firm has an
effective audit committee and 0 otherwise. In order for a company to have an effective
audit committee it has to be independent, active and financially literate and has at
least three members on the board, charter and at least one expert.
The results of ACE will provide an answer for the fourth research question that has
been stated in Section 3.3.2.2.
“Is there an association between ACE and the magnitude of NAS purchases?”
In addition, in order to identify the determinant of NAS purchases among the different
audit committee characteristics, it is important to break the test variable, ACE, into six
different test variables as shown in Regression 4.
The same six audit committee characteristics that have been stated in section 6.4.4.1.2
present the test variables. These variables are operationalized using ASX CGC
recommendations and guidelines as benchmarks as follows.

Chapter 5: Methodology Victoria University
128
AC_IND refers to audit committee independence; equals 1 if the audit committee
has a majority of independent directors and 0 otherwise (dummy variable) and is
expected to have a negative association with NAS ratio.
AC_SIZE refers to the total number of audit committee members on its board;
equals 1 if the number of the audit committee members is three or more and 0
otherwise and is expected to have a negative association with the NAS ratio.
AC_ACT refers to audit committee activity; equals the number of meetings held
by the audit committee during the test period and is expected to have a negative
association with NAS ratio.
AC_CHAR refers to the existence of an audit committee charter; equals 1 if the
audit committee has a charter and 0 otherwise (dummy variable) and is expected
to have a negative association with NAS ratio.
AC_EXP refers to audit committee expertise; equals 1 if at least one member of
the audit committee was an expert and 0 otherwise (dummy variable) and is
expected to have a negative association with the NAS ratio.
AC_LIT refers to the audit committee financial literacy; equals 1 if all the
members of the audit committee are financially literate and 0 otherwise and is
expected to have a negative association with the NAS ratio.
Finally, the results of six different audit committee characteristics will answer the fifth
research question that has been identified in Section 3.3.2.2.
“Which audit committee characteristic is the most important determinant of the
magnitude of NAS purchases?”
5.4.4.2.3 Control Variables
Prior literature has identified a number of variables that could affect NAS purchases
(e.g., Palmrose 1986, DeFond 1992, Parkash and Venable 1993, Firth 1997 and
Abbott et al. 2003). These variables could be classified into the following four
different groups: corporate governance, agency, profitability and NAS quality
variables.

Chapter 5: Methodology Victoria University
129
5.4.4.2.3.1 Corporate Governance Variables
Beasley (1996) investigated the association between board composition and the
occurrence of fraud. The results of this study revealed that there was a negative
relationship between the percentage of outside directors on the board and the
incidence of fraud. This indicates that outside directors have more incentives to limit
NAS purchases, which could reduce the independence of auditors and lead to the
occurrence of fraud. In addition, Houghton et al. (2002) found a negative relationship
between the percentage of outside directors on the board and the NAS purchases.
5.4.4.2.3.2 Agency costs variables
Parkash and Venable (1993) and Firth (1997) argued that high agency-cost firms
need independent audits to reassure investors and creditors; however, NAS purchases
increase the economic independence of the auditor on the clients and may impair the
independence of auditor in fact or in appearance. Therefore, these studies examined
the association between agency-cost variables and the NAS purchases. Their results
concluded that both management ownership and share ownership of the largest
stockholders were positively related to the relative level of NAS fees and that leverage
was negatively related to the relative level of NAS fees.
However, Bushee and Noe (2000) argued that a higher percentage of block-holdings
might lead to lower NAS purchases because they cannot get access to inside
information, which increase the demand for higher quality auditors. Moreover, large
firms demand more NAS because they have a broader range of activities and
complicated systems. Palmrose (1986) found a positive association between the size
of the firms and the NAS purchases. However, DeFond (1992) argued that large
companies might have greater agency costs than small ones do and therefore a
company’s size might limit the purchase of NAS.
5.4.4.2.3.3 Profitability variable
Parkash and Venable (1993) examined the influence of the profitability of the firms
and the NAS purchases. They found that higher levels of profitability of the firms
were associated with higher level of NAS fees ratio.

Chapter 5: Methodology Victoria University
130
5.4.4.2.3.4 NAS quality variable
Abbott et al. (2003) found that big audit firms (Big 5) were more likely to be
associated with higher NAS purchases. Their results indicate that Big 5 audit firms
provide higher quality NAS. However, Parkash and Venable (1993) suggested the use
of industry-specialist auditors instead of the size of auditors to proxy for NAS quality.
In addition, Houghton and Ikin (2001) found that NAS-specialist auditors were
associated with higher NAS purchases. They defined a NAS-industry-specialist
auditor as an auditor who has 15% or more of the total NAS provided by all auditors
in that industry.
However, it should be noted that the 15% is arbitrary percentage, which could lead to
misclassification of auditors as specialist in providing NAS. To avoid the occurrence
of such misclassification, the continuous measure of NAS specialization should be
used.
Consistent with prior literature, the above four-groups of variables were included in
the regression to isolate their expected effects on the level of NAS fees ratio to audit
fees and were operationalized as follows.
• OUTSIDER refers to the percentage of non-executive directors on the board;
equals the number of non-executive directors on the board divided by the total
number of directors on the board and is expected to have a negative relationship
with the level of NAS purchases.
• IN_OWN refers to the management ownership; equals the percentage share
ownership that management have in the company and is expected to have a
positive relationship with the level of NAS ratio.
• LEVERAGE refers to the company's debt; equals the ratio of total debt to total
assets as measured at the end of the test period and is expected to have a negative
relationship with the level of NAS ratio.
• ROA refers to the profitability of the firm; equals net income divided by the total
assets at the end of the testing period and is expected to have a positive
relationship with the level of NAS ratio.

Chapter 5: Methodology Victoria University
131
• SIZE refers to the size of the firm; equals the natural log of total sales and is
expected to have a positive relationship with the level of NAS purchases.
• SH_BLK refers to the number of block-holdings in the firm; equals the number of
shareholders who own at least 5% of the total shares and is expected to have a
positive relationship with the level of NAS ratio.
• NAS_SP refers to the degree of specialization in providing NAS; equals the
auditor’s market share of NAS fees in the total NAS fees for the firm’s industry
and is expected to have a positive relationship with the level of NAS ratio.
Table 5-10 shows the description of the variables in Model 2 that will be used as a
reference for all the variables in the tables in the remaining chapters.
5.5 Summary
Selecting the right research methodology and data collection techniques is a very
critical stage in conducting any research project to insure that the researchers will
achieve their goals. This chapter reviewed and discussed in general different research
approaches and data collection techniques. In addition, the research method, data
collection techniques and research design were presented and discussed in detail.

Chapter 5: Methodology Victoria University
132
Table 5-9 Description of the variables in Model 1 Variable
Name Description
Dependent Variable:
NAS The ratio of total non-audit services fees to total audit fees.
Test Variables:
ACE Audit committee effectiveness. Coded 1 if the audit committee meets all the six audit committee characteristics criterion; 0 otherwise.
AC_IND Audit committee independence. Coded 1 if the audit committee has a majority of independent directors; 0 otherwise.
AC_SIZE The number of the members of the audit committee.
AC_ACT The number of meetings of the audit committee per year.
AC_CHAR Audit committee charter. Coded 1 if the audit committee has a charter; 0 otherwise.
AC_EXP Audit committee expertise. Coded 1 if the audit committee has at least one expert; 0 otherwise.
AC_LIT Audit committee literacy. Coded 1 if all the audit committee members are financially literate; 0 otherwise.
Control Variables:
OUTSIDER Percentage of the board members who are non-employee directors.
IN_OWN The cumulative percentage of voting control held by managers and directors.
LEVERAGE Ratio of total long-term debt/total assets
ROA Return on assets.
SIZE Natural log of total assets for fiscal 2004.
SH_BLK The number of shareholders who own 5% or more
NAS_SP The market share of the company's auditor in the NAS fees in the company's industry

Chapter 6: Descriptive Data Analysis Victoria University
133
CHAPTER 6: DESCRIPTIVE DATA ANALYSIS
6.1 Introduction
Hussey and Hussey (1997: 187) defined statistics as “ a body of methods and theory
that is applied to quantitative data when making decisions in the face of uncertainty”.
In terms of analysing quantitative data, statistics could be classified into two
categories, namely, descriptive statistics and inferential statistics. While descriptive
statistics are used to summarise or present quantitative data, inferential statistics are
used to draw a conclusion from a sample of quantitative data and then generalize it to
the population (Hussey and Hussey 1997).
The aim of this chapter is to present a descriptive statistical analysis for the collected
data for the Australian and Saudi samples. This chapter has three sections in addition
to a summary for the most important findings regarding the data analysis.
In section 1 there is a brief discussion of the descriptive statistics and the main groups
of techniques that could be used to present such descriptive statistics. In the second
section the statistical software programs that have been used in entering, coding and
producing a variety of descriptive statistics and the procedures that have been used to
ensure data-entry validity are described. Finally, the third section presents, interprets,
discusses and compares the descriptive statistics for the Australian and Saudi samples.
6.2 Descriptive statistics review
Hussey and Hussey (1997) pointed out that the term descriptive statistics could be
misleading as it indicates that it is only concerned with describing data, while it is also
valuable for summarizing and presenting the data in tables, charts, graphs and other
diagrammatic forms. As a result, Hussey and Hussey (1997) suggested the use of the
term exploratory data analysis instead of the term descriptive statistics to reflect the
whole picture of the usefulness of this type of analysis. However, as descriptive
statistics is the most commonly used term in the literature, this term will be used in
this study with caution.

Chapter 6: Descriptive Data Analysis Victoria University
134
Descriptive statistics provide descriptions for the data in a sample in terms of the
shape (frequency tables), the central tendency (mean and mode), the dispersion (max-
min, standard deviation, variance, range, interquartile range and box plots) and the
changeability (simple index numbers, deflation data and weighted index
numbers)(Hussey and Hussey 1997). The above definition of descriptive statistics
named four groups of techniques that could be used to provide a clear picture about
the descriptive data analysis for any sample.
It should be noted that frequency tables would be only presented for nominal or
ordinal variables, as it is worthless to present such tables for scale variables because
of the large number of values that these variables could take. Some exceptions may
apply for some scale variables because they only take few values or because such
variables could be converted into nominal or ordinal variables to express the
importance of a specific value. A frequency distribution table demonstrates the
frequency data, usually in size order (Hussey and Hussey 1997).
In addition, it is important to recognize that not all the central tendency measures have
the same weight in terms of their importance and meaningfulness for the different
types of data. While the mean is a very important measure for central tendency for
ratio and interval data (scale variables), the mean has very little value for data that are
nominal or ordinal (nominal and ordinal variables). On the other hand, while the mode
is a very important description of the central tendency for data that are nominal or
ordinal, it has very little value for ratio and interval data.
Moreover, although there is a number of measures for dispersion, only three
measures, namely, max-min, standard deviation and variance, will be presented,
interpreted and discussed for ratio and interval data (scale variables). The range,
interquartile range and box plots are not presented in this chapter because they are
affected by extreme values. In addition, dispersion measures are of little value for
nominal and ordinal data as the mean for such data is worthless and does not add
much value for the data analysis.
Finally, despite the fact that measures of change represent a very important
descriptive statistic, it does not apply to this research, as it does not use any series
data, which are required to perform such analysis.

Chapter 6: Descriptive Data Analysis Victoria University
135
In summary, while the mean, max-min, standard deviation and variance will be
presented, interpreted, discussed and compared in detail for ratio and interval data
(scale variables), only frequency tables and the mode will be demonstrated,
interpreted, examined and contrasted in detail for nominal and ordinal data (nominal
and ordinal variables).
6.3 Software Programs and Data Entry Validity Procedures
Excel software has been used to enter and code the data that have been collected from
a variety of sources, which have been discussed in detail in Chapter 5. Then these data
were exported from Excel to the Statistical Package for Social Science (SPSS) to
produce the descriptive statistics. The SPSS is a software system for data analysis
(Norusis 1998). The system version used in this research were Microsoft Office 2000
SR-1 Professional and SPSM 12.0.1 for Windows licensed to Victoria University at
the time.
There were two procedures that have been used to ensure data entry validity. First, the
researcher entered the data for each sample into two different Excel files and then a
comparison was made between the two files to ensure that they were identical.
Second, both Excel and SPSM were used to produce the descriptive statistics for each
sample and a comparison was made between the results to ensure that they were the
same.
6.4 Descriptive Statistics for the Australian and Saudi Samples
In this section, the descriptive data analysis will be presented and interpreted for the
SSM and ASX samples not only for the variables of interest, but also for the other
variables (related and alternative variables).
Each of the variables of interest and the related variables will be demonstrated for the
four samples. These variables will be presented in the following order:
• dependent variables and their related variables;
• independent variables and their related variables; and
• control variables and their related and alternative variables.

Chapter 6: Descriptive Data Analysis Victoria University
136
Finally, comparisons will be made to highlight the differences and the similarities
among the SSM and ASX and explanations will be provided for any differences
whenever it is applicable.
6.4.1 Dependent Variables
6.4.1.1 Audit Quality
As mentioned in Chapter 4, audit quality cannot be observed or measured directly.
Therefore, two different proxies that have been used frequently in the audit quality
literature will be used as surrogates for such quality. These proxies are size and
specialization.
6.4.1.1.1 Auditor Size
Prior to the collapse of Enron Corp., there were five big audit firms, namely, Deloitte
& Touche (DT), Ernst & Young (EY), KPMG (KP), PricewaterhouseCoopers (PW)
and Arthur Andersen (AA). However, such collapse caused the fall of Enron’s giant
auditor, Arthur Andersen, which decreased the Big 5 to Big 4.
Table 6-1 shows the frequencies and the modes for two samples using auditor size as
a proxy for audit quality.
Table 6-1 The Frequencies Using Auditor Size as a Proxy for Audit Quality
SSM ASX
Non-Big 24 108
Big 4 20 192
Frequency
Total 44 300
Non-Big 4 0.55 0.36
Big 4 0.45 0.64
Frequency
Percentage
Total 1.00 1.00
While 45% of the SSM companies hired a Big 4 auditor, 64% of the ASX companies
employed a Big 4 auditor. It is easy to recognize that the SSM and ASX are
completely different in terms of their frequencies and modes. While hiring a non-Big
4 is dominant for companies within the SSM, the use of a Big 4 is overriding for firms
within the ASX.

Chapter 6: Descriptive Data Analysis Victoria University
137
One explanation for such difference is the size of the capital market in terms of the
number of companies listed in such market and its total capitalization. This
explanation is supported by the results of the study by Abbott and Parker (2000) using
US data. They found that 95% of their sample firms were audited by a Big 5 auditor.
It is clear that the percentage of firms audited by Big 4 (Big 5) auditors increases with
the number of companies in the market and the market capitalization (45.5% in Saudi,
64% in Australia and 95% in US).
6.4.1.1.2 Auditor Specialization
The following three different methods will be used to identify specialist auditors.
1. AQ_Continuous;
2. AQ_Craswell; and
3. AQ_Palmrose.
6.4.1.1.2.1 AQ_Continuous
AQ_Continuous indicates the degree of specialization of the company’s auditor in a
specific industry (sector). AQ_Continuous could take values from 0 to 1.
Table 6-2 summarizes the descriptive statistics for AQ_Continuous for the two
samples and reveals the following.
Table 6-2 Descriptive Statistics Using AQ_Continuous as a Proxy for Audit Quality
SSM ASX
Minimum .0 0
Maximum .82 .67
Mean .25 .17
S. Deviation .271 .176
The minimum for the two samples approximately equals 0 (0.0008) indicating that
there were auditors who earned less than 1% of the total audit fees for a specific
industry (sector).
However, the maximum for the SSM, which equals 0.82, is higher than that for the
ASX, which equals 0.67. This could be explained by the small number of companies

Chapter 6: Descriptive Data Analysis Victoria University
138
in each sector in Saudi Arabia, which will make it easier for specialist auditors to be
dominant in their sectors (industries).
Moreover, while on average (the mean) the degree of specialization for SSM equals
0.25, such average for the ASX is 0.17. It is clear that the average degree of
specialization depends on the size and the number of the companies in each market
and this could explain the differences between the means in the two samples.
Finally, the spread of data around its mean for SSM, which equals 0.271, is higher
than that for the ASX, which equals 0.176.
6.4.1.1.2.2 AQ_Craswell
Most of the prior literature has used 10% or 20% as cut-off points in determining the
specialist auditors (Craswell et al. 1994; Abbott and Parker 2000; Chen et al. 2005)
when using the AQ_Craswell method. However, such cut-off points are arbitrary and
as a result, it is hard to justify the use of one cut-off point over the others other than
being used more frequently in the literature.
In this study, three different cut-off points will be used to investigate the impact of the
arbitrary selection of such cut-off points on the determination of specialist auditors
and on the regression analysis. These cut-points are 10%, 20% and 30%.
In order to determine the specialist auditors in each industry (sector) under
AQ_Craswell method, the following steps are required.
• Calculate the total audit fees (sales) for each industry (sector). For example,
the total audit fees for the capital goods industry for the ASX were
$14,938,857.
• Calculate the total audit fees (sales) for each auditor in this specific industry
(sector). For example, the total audit fees for PW in the capital goods industry
was $1,922,632.
• Divide the total audit fees (sales) for each auditor on the total of the audit fees
(sales) of the industry (sector). For example, PW earned approximately 13% of
the total audit fees for the capital goods industry.

Chapter 6: Descriptive Data Analysis Victoria University
139
• Finally, comparing the percentage earned by each auditor in the industry with
each of the three cut-off points will determine who are the specialist auditors
in this industry. For example, while PW is considered as a specialist in the
capital goods industry using the main criteria (10%), PW is not a specialist
using 20% and 30% cut-off points.
Table 6-3 presents the specialist auditors in the ASX industries using AQ_Craswell at
three different cut-off-off points.
Table 6-3 Specialist Auditors in the ASX Industries Using AQ_Craswell at Three Different Cut-
off Points
Industry Craswell 10% Craswell 20% Craswell 30%
Automobile DT, EY, PM DT, PM PM
Banks EY, PM, PW EY, PM PM
Capital Goods DT, EY, PM, PW EY, PM PM
Commercial Services DT, PW DT, PW PW
Consumer Durables DT, EY, PW EY, PW PW
Diversified Financials EY, PM, PW PM, PW PM, PW
Energy EY, PM EY, PM EY, PM
Food & staples EY, PW DT, EY, PW EY, PW
Food Beverage DT, EY, PM, PW EY, PM, PW PW
Health Care Equipment DT, EY, PM, PW PM PM
Consumer Services EY, PW EY, PW EY, PW
Insurance EY, PM, PW DT, EY, PW PW
Materials DT, EY, PM, PW EY, PM PM
Media EY, PM EY EY
Pharmaceuticals EY, PM, PW EY EY
Real Estate EY, PM, PW EY, PM, PW EY, PM
Retailing EY, PM, PW EY EY
Software & Services EY, PW EY, PW PW
Technology Hardware DT, EY, PM, PW EY, PW PW
Telecommunication EY, PM, PW PM, PW PM, PW
Transportation DT, PM, PW PM, PW PM
Utilities DT, EY, PM DT, PM PM

Chapter 6: Descriptive Data Analysis Victoria University
140
Table 6-3 reveals the following important findings.
• Despite the fact that ASX has 23 different industries, only 22 industries were
shown in the Table, as the one that was remaining had only two companies
and their data were not available.
• The three different cut-off points yielded completely different conclusions
regarding the determination of the specialist auditors in 22 (90%) industries.
For example, for the pharmaceutical industry, while DT, EY and PW were
specialists using the 10% cut-off point, only EY was determined to be a
specialist using 20% or 30% as cut-off points.
• The three cut-off points produced similar results regarding specialization for
two (10%) industries. For example, in the energy industry, both EY and PM
were considered as specialists regardless of what criterion was used.
• For all the industries, specialization only existed among the Big 4. In other
words, none of the second tier or small audit firms was considered as a
specialist in any industry. This is consistent with the results of the majority of
the specialization studies, which concluded that specialization exists only
among the Big 4 auditors (Craswell et al. 1995).
Table 6-4 presents the specialist auditors in the SSM sectors using AQ_Craswell at
three different cut-off-off points.
Table 6-4 Specialist Auditors in the SSM Sectors Using AQ_Craswell at Three Different Cut-off
Points
Sector Craswell 10% Craswell 20% Craswell 30%
Bank DT, EY, PM, PW DT, EY, PW DT, EY, PW
Industrial EY, PW EY EY
Cement DT, PM, NB* DT, PM, NB DT
Services DT, PM, PW, NB PM, NB None
Agriculture NB NB NB
* NB indicates that there is at least one non-Big audit firm that is a specialist in the specified sector.
On the other hand, Table 6-4 provides the following important conclusions about the
specialization in the Saudi sectors.

Chapter 6: Descriptive Data Analysis Victoria University
141
• Despite the fact that there were seven sectors in the SSM, Table 7-4 shows the
results of specialization only for five sectors as the other two sectors had only
one firm each and because there were no respondents from the two companies
in these sectors.
• The three different cut-off points resulted in completely different findings
regarding the determination of the specialist auditors. For example, in the
services sector, DT, PM, PW and NB were considered as specialists using the
10%, only PM and NB were specialists using the 20% and none was
considered as a specialist using 30%.
• Specialization existed not only among the Big 4, but also among other second
tier and small audit firms. This was evident in three sectors: cement, services,
and agriculture sectors. This could be explained by the results of a few studies
in the specialization literature, which found that specialization exists even
among small audit firms (DeFond et al 2000).
• None of the Big 4 provided any audit services for the agriculture sector. A
possible explanation is that all firms in this sector have very low net incomes
or losses, so they cannot afford pay any premium for any of the Big 4.
It is clear from Tables 6-3 and 6-4 that Australian and Saudi markets have different
classifications for their companies. While the ASX classifies companies into different
industries, the Saudi market (SSM) uses sectors as a base for its classification. This
should not be a problem, as the aim of this study is not comparing specific or
individual industries or sectors in the two countries. Moreover, each market should be
examined independently from the other and then the comparison should be made in
accordance with the results for the whole market and not for individual industries or
sectors.

Chapter 6: Descriptive Data Analysis Victoria University
142
Table 6-5 presents the frequencies for the two samples using all the three cut-off
points.
Table 6-5 Frequencies Using AQ_Craswell for all the three cut-off points for the SSM and ASX
SSM ASX
10% 20% 30% 10% 20% 30%
Non- Specialist 20 23 32 138 190 224
Specialist 24 21 12 162 110 76
Frequency
Total 44 44 44 300 300 300
Non- Specialist 0.45 0.52 0.73 0.46 0.63 0.75
Specialist 0.55 0.48 0.27 0.54 0.37 0.25
Frequency
Percentage
Total 1.00 1.00 1.00 1.00 1.00 1.00
The percentages of SSM companies, which hired a specialist auditor using the 10%,
20% and 30% cut-off points, were 0.55, 0.48 and 0.27, respectively. On the other
hand, the percentages of ASX companies, which engaged with a specialist auditor
using the 10%, 20% and 30% cut-off points, were 0.54, 0.37 and 0.25, respectively.
It is clear that the percentage of the SSM companies with a specialist auditor was
higher compared to the percentage of the ASX companies with a specialist auditor for
each of the three cut-off points. One possible explanation could be that specialization
within the SSM exists not only among the Big 4, but also among the second and small
tier audit firms.
In addition, despite the fact that specialization within the SSM and ASX was affected
by changing the cut-off points, it was clear that changes in the ASX were clearer and
bigger than those in the SSM. A possible explanation for such differences is that
unlike Australian industries, where all the Big 4 auditors provide audit services for
most of the industries, some of the Saudi sectors lack the presence of two or more of
the Big 4 auditors. For example, while the banks sector was the only one where all the
Big 4 auditors provided audit services, none of the Big 4 auditors provided any audit
services for the agriculture sector.

Chapter 6: Descriptive Data Analysis Victoria University
143
6.4.1.1.2.3 AQ_Palmrose
Most of the prior literature has used 15% as a cut-off point in deciding the specialist
auditors (Abbott and Parker 2000) under the AQ_Palmrose method. However, the
selection of the cut point-off point is still arbitrary and not justified. Therefore, the
5%, 15% and 25% cut-off points will be used in this study to examine the influence of
using different cut-off points on the results of the determination of specialists and
ultimately on the results of the regression analysis.
In order to determine the specialist auditors in each industry (sector) under the
AQ_Palmrose method, the following steps are required.
• Calculate the total audit fees (sales) for each industry (sector).
• Calculate the total audit fees (sales) for each auditor in this specific industry
(sector).
• Divide the total audit fees (sales) for each auditor on the total of the audit fees
(sales) of the industry (sector).
• Determine the leader auditor of the industry who earned the largest audit fees
(sales) from the total audit fees (sales) for the industry. For example, KPMG
earned approximately 35% of the total audit fees for the capital goods industry
and, as a result, KPMG is the leader auditor in this industry.
• Multiply the percentage earned by the leader auditor by one of the cut-off
points depending on what cut-off point is used and the result will provide a
criteria in the determination of specialists under AQ_Palmrose Method. For
example, if the 15% cut-off point will be used, the criterion will equal
approximately 5% (35%*15%).
• Finally, compare the criterion from the previous step with the percentage of
each auditor in the total audit fees (sales) of the industry and any auditor who
had a percentage that is equal to or more than the criterion percentage will be
considered as a specialist in the industry in addition, of course, to the industry
leader. For example, in addition to KPMG as a leader, all the other Big 4

Chapter 6: Descriptive Data Analysis Victoria University
144
auditors were considered as specialists in the capital goods industry as each of
them earned more than the 5% criterion.
Table 6-6 presents the specialist auditors in the ASX industries using AQ_Palmrose’s
three different cut-off-off points.
Table 6-6 Specialist Auditors in the ASX Industries Using AQ_Palmrose’s Three Different Cut-
off Points
Industry Palmrose 5% Palmrose 15% Palmrose 25%
Automobile DT, EY, PM DT, EY, PM DT, EY, PM
Banks EY, PM, PW EY, PM, PW EY, PM, PW
Capital Goods DT, EY, PM, PW DT, EY, PM, PW DT, EY, PM, PW
Commercial Services DT, PW, NB DT, PW DT, PW
Consumer Durables DT, EY, PW, NB DT, EY, PW EY, PW
Diversified Financials DT, EY, PM, PW, NB EY, PM, PW EY, PM, PW
Energy DT, EY, PM, PW DT, EY, PM, PW EY, PM
Food & staples DT, EY, PM, PW DT, EY, PW EY, PW
Food Beverage DT, EY, PM, PW DT, EY, PM, PW DT, EY, PM, PW
Health Care Equipment DT, EY, PM, PW, NB DT, EY, PM, PW EY, PM
Hotels Restaurants EY, PM, PW, NB EY, PW EY, PW
Insurance DT, EY, PM, PW DT, EY, PM, PW EY, PM, PW
Materials DT, EY, PM, PW DT, EY, PM, PW EY, PM, PW
Media EY, PM, PW EY EY
Pharmaceuticals DT, EY, PM, PW EY, PM, PW EY
Real Estate DT, EY, PM, PW EY, PM, PW EY, PM, PW
Retailing DT, EY, PM, PW, NB DT, EY, PM, PW EY, PM, PW
Software & Services DT, EY, PM, PW, NB DT, EY, PM, PW EY, PM, PW
Technology Hardware DT, EY, PM, PW, NB DT, EY, PM, PW DT, EY, PM, PW
Telecommunication DT, EY, PM, PW, NB EY, PM, PW EY, PM, PW
Transportation DT, EY, PM, PW DT, PM, PW PM, PW
Utilities DT, EY, PM, PW DT, EY, PM, PW DT, EY, PM
* NB indicates that there is at least one non-Big audit firm that is a specialist in the specified industry.
Table 6-6 provides the following important findings.
• The three different cut-off points yielded completely different conclusions
regarding the determination of the specialist auditors in 19 industries
(approximately 83% of the total of 22 industries). For example, for the
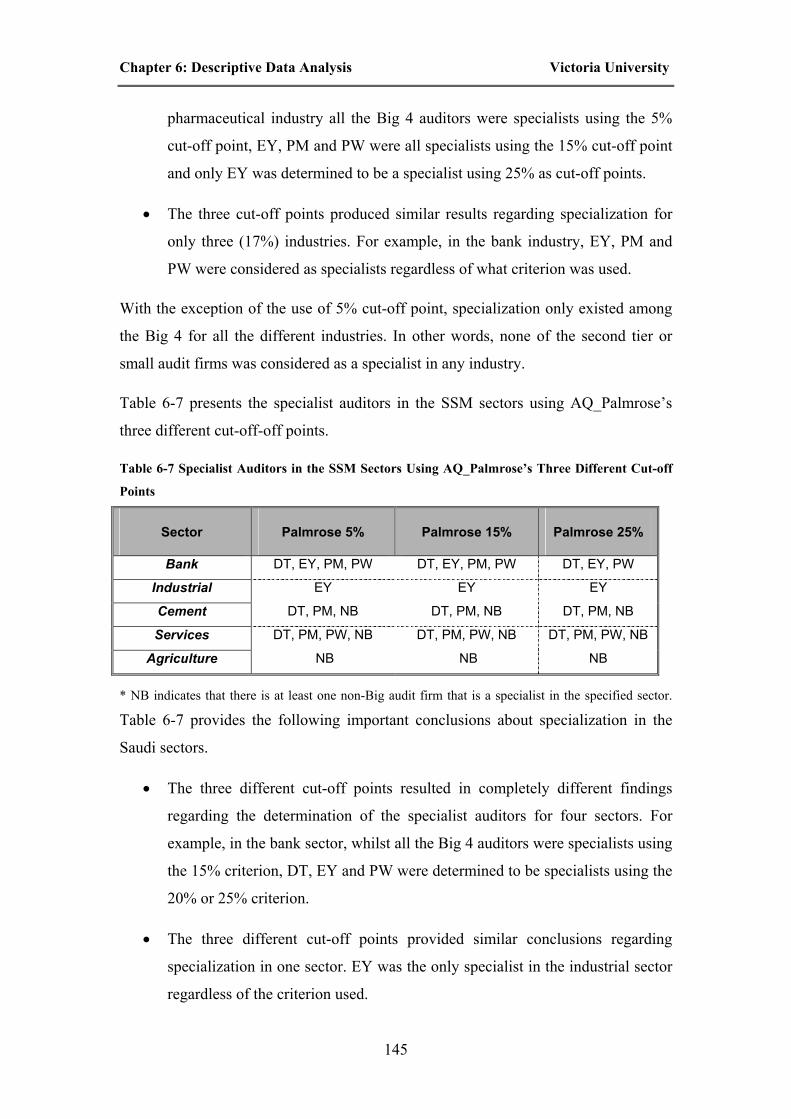
Chapter 6: Descriptive Data Analysis Victoria University
145
pharmaceutical industry all the Big 4 auditors were specialists using the 5%
cut-off point, EY, PM and PW were all specialists using the 15% cut-off point
and only EY was determined to be a specialist using 25% as cut-off points.
• The three cut-off points produced similar results regarding specialization for
only three (17%) industries. For example, in the bank industry, EY, PM and
PW were considered as specialists regardless of what criterion was used.
With the exception of the use of 5% cut-off point, specialization only existed among
the Big 4 for all the different industries. In other words, none of the second tier or
small audit firms was considered as a specialist in any industry.
Table 6-7 presents the specialist auditors in the SSM sectors using AQ_Palmrose’s
three different cut-off-off points.
Table 6-7 Specialist Auditors in the SSM Sectors Using AQ_Palmrose’s Three Different Cut-off
Points
Sector Palmrose 5% Palmrose 15% Palmrose 25%
Bank DT, EY, PM, PW DT, EY, PM, PW DT, EY, PW
Industrial EY EY EY
Cement DT, PM, NB DT, PM, NB DT, PM, NB
Services DT, PM, PW, NB DT, PM, PW, NB DT, PM, PW, NB
Agriculture NB NB NB
* NB indicates that there is at least one non-Big audit firm that is a specialist in the specified sector.
Table 6-7 provides the following important conclusions about specialization in the
Saudi sectors.
• The three different cut-off points resulted in completely different findings
regarding the determination of the specialist auditors for four sectors. For
example, in the bank sector, whilst all the Big 4 auditors were specialists using
the 15% criterion, DT, EY and PW were determined to be specialists using the
20% or 25% criterion.
• The three different cut-off points provided similar conclusions regarding
specialization in one sector. EY was the only specialist in the industrial sector
regardless of the criterion used.

Chapter 6: Descriptive Data Analysis Victoria University
146
• Specialization existed not only among the Big 4, but also among other second
tier and small audit firms. This was evident in only four sectors: cement,
services, agriculture and electricity sectors. This again could be explained by
the results of a few studies in the specialization literature, which found that
specialization exists even among small audit firms (DeFond et al 2000).
• None of the Big 4 provided any audit services for the agriculture sector. A
possible explanation is that all firms in this sector had very low net incomes or
losses, so they cannot afford to pay any premium for any of the Big 4 auditor.
Table 6-8 presents the frequencies for the two samples using all the three cut-off
points.
Table 6-8 Frequencies Using AQ_Palmrose for all the Three Cut-off Points for the SSM and ASX
SSM ASX
5% 15% 25% 5% 15% 25%
Non- Specialist 14 20 32 80 136 224
Specialist 30 24 12 220 164 76
Frequency
Total 44 44 44 300 300 300
Non- Specialist 0.32 0.45 0.73 0.27 0.45 0.75
Specialist 0.68 0.55 0.27 0.73 0.55 0.25
Frequency Percentage
Total 1.00 1.00 1.00 1.00 1.00 1.00
The percentages of SSM companies, which hired a specialist auditor using the 5%,
15% and 25% cut-off points, were 0.68, 0.55 and 0.27, respectively. On the other
hand, the percentages of ASX companies, which engaged a specialist auditor using
the 5%, 150% and 25% cut-off points, were 0.73, 0.55 and 0.25, respectively. It is
clear that the percentage of companies with a specialist auditor decreases with the
increase of the cut-off point.
In summary, changing the arbitrary cut-off point influenced the determination of
specialist auditors in the Australian and Saudi markets when using the AQ_Craswell
and AQ_Palmrose methods. This provides support for the writer’s decision that
AQ_Continuous method is superior to the previous two methods, as it does not
require any arbitrary selection of a cut-off point.

Chapter 6: Descriptive Data Analysis Victoria University
147
6.4.1.2 Non-audit Services Fees Ratio (NAS_RATIO)
As discussed in Chapter 4, investigating the association between the NAS ratio and
audit committee effectiveness will be applied only on Australian samples, as Saudi
Corporation law prohibits providing NAS by the incumbent auditors to their clients.
The calculation of this dependent variable could be done easily by dividing NAS fees
on the sum of the NAS fees and the audit fees. Therefore, it seems very important to
present not only the descriptive statistics for the NAS ratio, but also the descriptive
statistics for NAS and audit fees.
Table 6-9 presents descriptive statistics for NAS ratio and, NAS and audit fees for the
ASX sample.
Table 6-9 Descriptive Statistics for NAS_RATIO, NAS Fees and Audit Fees for the ASX Sample.
NAS Fees Audit Fees NAS Ratio
Minimum $0 $2,463 0.00
Maximum $7,060,334 $10,133,000 0.89
Mean $291,978 $528,165 0.39
S. Deviation $728,233 $1,325,401 0.21
Table 6-9 provides the following findings.
• While the minimum NAS ratio was 0, which means that there was at least one
company that did not purchase any NAS, the maximum NAS ratio was 0.89
indicating that there was at least one company with NAS fees being more than
audit fees.
• The average NAS ratio for the ASX was 0.39 indicating that the ASX
companies on average purchase less NAS than audit services. Finally, the
spread of data around the mean for the ASX was 0.21.
• The minimum NAS fees was 0 indicating that there was at least one company
that did not pay any NAS fees.
• The minimum audit fees was only $2,463 indicating that there was at least
one company that paid less than $2,500 as audit fees.

Chapter 6: Descriptive Data Analysis Victoria University
148
• While the maximum NAS fees was $7,060,334, the maximum audit fees was
$10,133,000.
• While the average NAS fees was $291,978, on average the ASX companies
paid $528,165 as audit fees indicating that on average the ASX companies
paid more for audit services than NAS.
• Finally, whilst the spread of values around the mean for NAS fees was
$728,233, the same spread for audit fees was $1,325,401.
6.4.2 Test Variables
6.4.2.1 Audit Committee Effectiveness
Table 6-10 presents the frequencies for audit committee effectiveness (ACE) for the
SSM and ASX samples.
Table 6-10 Frequencies for Audit Committee Effectiveness for the SSM and ASX Samples
SSM ASX
Not Effective 32 159
Effective 12 141
Frequency
Total 44 300
Not Effective 0.73 0.53
Effective 0.27 0.47
Frequency
Percentage
Total 1.00 1.00
For the SSM, while there were only 12 (27%) companies with effective audit
committees, 32 (73%) companies had ineffective audit committees. This indicates that
the majority of Saudi companies failed to establish an effective audit committee.
On the other hand, for the ASX, whilst there were 141 (47%) companies with
effective audit committees, 159 (53%) companies had ineffective audit committees.
This indicates that more than half of Australian (within ASX) companies failed to
establish an effective audit committee.
It was clear that Australian companies were in a better position in terms of their
compliance with the ASX CGC best practices compared to the compliance of Saudi
companies with the SMC best practice regarding ACE.

Chapter 6: Descriptive Data Analysis Victoria University
149
A possible explanation for such difference is that while Australian companies are
required to disclose their compliance with the ASX CGC best practices, these
requirements do not exist in the Saudi market. Moreover, the mode for the SSM and
ASX was 0 indicating that having an ineffective audit committee was the event that
occurred most for both samples.
Despite the fact that audit committee effectiveness is the main test variable in this
study, this variable was broken into 6 test variables (6 audit committee characteristics)
in order to determine which factors have more impact on the dependent variables.
These six test variables were as follows.
6.4.2.2 Audit Committee Independence
Table 6-11 presents the frequencies and the modes for audit committee independence
(ACI) for the two samples.
Table 6-11 Frequencies for Audit Committee Independence for the SSM and ASX
SSM ASX
Non-Independent 28 115
Independent 16 185
Frequency
Total 44 300
Non-Independent 0.63 0.38
Independent 0.37 0.62
Frequency
Percentage
Total 1.00 1.00
For the SSM, while there were only 16 (37%) companies with independent audit
committees, 28 (63%) companies failed to maintain an independent audit committee.
This indicates that the majority of Saudi companies failed to comply with the
independence requirements set by the SMC.
On the other hand, for the ASX, whilst there were 185 (62%) companies with
independent audit committees, 115 (38%) companies failed to sustain an independent
audit committee. This indicates that most Australian companies (within the ASX)
complied with the independence requirements set by the ASX CGC.
It was clear that Australian companies were in a better position in terms of their
compliance with the ASX CGC best practices regarding audit committee

Chapter 6: Descriptive Data Analysis Victoria University
150
independence compared to the compliance of Saudi companies with the SMC best
practices regarding such independence.
Moreover, while the mode for the SSM was 0 indicating that having a non-
independent audit committee was the event that occurred most, the mode for the ASX
was 1 indicating that having independent audit committee was the dominant event.
Table 6-12 presents the frequency and frequency percentage for the independence
status of the audit committee members (insider, grey and independent).
Table 6-12 Frequencies for Audit Committee Independence for the SSM and ASX
SSM ASX
Insider 17 100
Grey 25 210
Independent 85 580
Frequency
Total 127 890
Insider 0.13 0.11
Grey 0.20 0.24
Independent 0.67 0.65
Frequency
Percentage
Total 1.00 1.00
For the SSM, there were 85 (67%) independent directors, 25 (20%) grey directors and
17 (13%) insider directors indicating that the majority of the audit committees
members are independent directors.
For the ASX, there were 580 (65%) independent directors, 210 (24%) grey directors
and 100 (11%) insider directors indicating that the majority of the audit committees
members are independent directors.
6.4.2.3 Audit Committee Size
Table 6-13 summarizes the descriptive statistics for audit committee size (AC_SIZE)
for the SSM and ASX samples and reveals the following.

Chapter 6: Descriptive Data Analysis Victoria University
151
Table 6-13 Descriptive Statistics for Audit Committee Size for the SSM and ASX Samples
SSM ASX
Minimum 2 1
Maximum 4 6
Mean 2.9 3
S. Deviation .44 .79
While the minimum AC_SIZE for the SSM was two members, the same minimum
was only one member for the ASX. On the other hand, whilst the maximum AC_SIZE
for the SSM was only 4 members the same maximum was 6 members for the ASX.
Moreover, while on average the SSM companies had 2.9 audit committee members,
the average number of audit committee members was 3 for the ASX. As a result, it
could be concluded that on average the number of members of the audit committee for
the two samples was approximately three members. This indicates that on average the
SSM and ASX companies complied with their local best practices regarding the size
of the audit committee. Finally, while the spread of data around the mean for SSM
was 0.44, the same spread for the ASX was 0.79.
It is important to highlight the number and the percentage of companies that complied
with their local best practices regarding the audit committee size. Therefore, Table 6-
14 presents the frequencies for the SSM and ASX samples for the audit committee
minimum size (ACMS).
Table 6-14 Frequencies for Audit Committee Minimum Size for the SSM and ASX Samples
SSM ASX
Less than 3 7 76
3 or More 37 224
Frequency
Total 44 300
Less than 3 0.16 0.25
3 or More 0.84 0.75
Frequency Percentage
Total 1.00 1.00
For the SSM, while there were 37 (84%) companies having an audit committee with
three or more members, only 7 (16%) companies failed to comply with the minimum

Chapter 6: Descriptive Data Analysis Victoria University
152
size requirement of 3 members by the SMC. This indicates that the majority of Saudi
companies complied with such requirement.
For the ASX, while there were 224 (75%) companies having an audit committee with
three or more members, only 76 (25%) companies failed to comply with the minimum
size requirement of 3 members by the ASX CGC. This indicates that the majority of
Australian companies complied with such requirement.
It was clear that Saudi companies were in a better position in terms of the compliance
with their local best practices regarding the size of the audit committee compared to
the compliance of Australian companies with their local best practices regarding such
size.
Finally, it is clear from the above discussion and from Table 6-14 that the event that
occurred the most for the two samples was having an audit committee with three or
more members.
6.4.2.4 Audit Committee Activity
Table 6-15 summarizes the descriptive statistics for audit committee activity
(AC_ACT) measured by the number of meetings for the SSM and ASX samples and
reveals the following.
Table 6-15 Descriptive Statistics for the Number of Audit Committee Meetings for the SSM and
ASX Samples
SSM ASX
Minimum 2 0
Maximum 7 15
Mean 3.3 3.7
S. Deviation 1.3 2.1
While the minimum number of audit committee meetings for the SSM was two
meetings indicating that there was at least one company with an audit committee that
held only two meetings, the same minimum for the ASX was zero meeting indicating
that there was at least one company, which established an audit committee, but there
were no meetings for such committee.

Chapter 6: Descriptive Data Analysis Victoria University
153
Whilst the maximum number of audit committee meetings for the SSM was only 7
audit committee meetings, the same maximum for the ASX was 15. This indicates
that some Australian companies were more active compared to their Saudi
counterparts.
Moreover, while the average number of audit committee meetings for the SSM was
3.3, on average the ASX companies held 3.7 audit committee meetings. This indicates
that on average the ASX companies were more active compared to their Saudi
counterparts.
On the other hand, while the ASX CGC did not specify any minimum regarding the
number of audit committee meetings, the SMC recommended a minimum of 3 audit
committee meetings. The Blue Robin Committee (1999) recommended that the audit
committee should meet at least four times a year to perform its duties effectively.
Although, the SSM companies complied with their local best practices, both the SSM
and ASX companies failed to comply with the Blue Robin Committee
recommendations regarding the minimum number of audit committee meetings.
Finally, while the spread of data around the mean for SSM was 0.44, the same spread
for the ASX was 0.79.
It is important to highlight the number and the percentage of companies that complied
with the minimum number of audit committee meetings (ACMNM) as set by their
local best practices or the Blue Robin Committee if the local best practices did not
identify such minimum.
Table 6-16 presents the frequencies for the audit committee minimum activity for the
SSM and ASX samples.
For the SSM, while there were 29 (66%) companies with an audit committee that held
three or more meetings, only 15 (34%) companies failed to comply with the ACMNM
requirement of 3 meetings set by the SMC. This indicates that the majority of Saudi
companies complied with such requirement.

Chapter 6: Descriptive Data Analysis Victoria University
154
Table 6-16 Frequencies for Audit Committee Minimum Activity for the SSM and ASX Samples
SSM ASX
Not complying 15 138
Complying 29 162
Frequency
Total 44 300
Not complying 0.34 0.46
Complying 0.66 0.54
Frequency Percentage
Total 1.00 1.00
For the ASX, while there were 162 (54%) companies with an audit committee that
held four or more meetings, only 138(46%) companies failed to comply with the Blue
Robin Committee (1999) regarding the ACMNM. This indicates that more than half
of the ASX companies complied with such requirement.
It was clear that Saudi companies were in a better position in terms of the compliance
with SMC best practices regarding ACMNM compared to the compliance of
Australian companies with the Blue Robin Committee (1999) recommendations
regarding ACMNM.
Finally, the mode for the SSM and ASX was 1 indicating that the event that occurred
most was having an audit committee that held a number of meetings equal or more
than the best practices.
6.4.2.5 Audit Committee Charter
Table 6-17 presents the frequencies for audit committee charter (ACC) for the SSM
and ASX samples.
Table 6-17 Frequencies for Audit Committee Charter for the SSM and ASX Samples
SSM ASX
Without Charter 14 47
With Charter 30 253
Frequency
Total 44 300
Without Charter 0.32 0.16
With Charter 0.68 0.84
Frequency
Percentage
Total 1.00 1.00

Chapter 6: Descriptive Data Analysis Victoria University
155
For the SSM, while there were 30 (68%) companies that had a written charter for
their audit committees, only 14 (32%) companies did not have such charter. This
indicates that the majority of Saudi companies had audit committees with a written
charter.
For the ASX, whilst there were 253 (84%) companies that had a written charter for
their audit committees, only 47 (16%) companies did not have such charter. This
indicates that most Australian companies (within ASX) complied with having a
written charter as recommended by the ASX CGC.
Despite the fact that most of the companies in SSM and ASX had written charters for
their audit committees, it was clear that Australian companies were in a better position
in terms of their compliance with the ASX CGC best practices regarding having a
written audit committee charter compared to the compliance of Saudi companies with
the SMC best practices regarding having such charter. Finally, it is clear that the mode
for the SSM and ASX was 1 indicating that having an audit committee with a written
charter was the dominant event for both samples.
6.4.2.6 Audit Committee Expertise
Table 6-18 presents the frequencies for audit committee expertise (ACX) for the SSM
and ASX samples.
Table 6-18 Frequencies for Audit Committee Expertise for the SSM and ASX Samples
SSM ASX
No Expert 5 26
At least One Expert 39 274
Frequency
Total 44 300
No Expert 0.11 0.09
At least One Expert 0.89 0.91
Frequency Percentage
Total 1.00 1.00
For the SSM, while there were 39 (89%) companies with at least one expert on the
audit committee, only 5 (11%) companies had no experts on such committee. This
indicates that the majority of Saudi companies complied with the expertise
requirements set by the SMC.

Chapter 6: Descriptive Data Analysis Victoria University
156
For the ASX, whilst there were 274 (91%) companies with at least one expert on the
audit committee, only 26 (9%) companies had no experts on such committee. This
indicates that the majority of the ASX companies complied with the expertise
requirement set by the ASX CGC.
It was clear that Australian companies were in a better position in terms of their
compliance with the ASX CGC best practices regarding audit committee expertise
compared to the compliance of Saudi companies with the SMC best practices
regarding the same mater. Finally, it is clear that having an audit committee with at
least one expert was the dominant event for both samples.
6.4.2.7 Audit Committee Literacy
Table 6-19 presented the frequencies for audit committee literacy (AC_LIT) for the
SSM and ASX samples.
Table 6-19 Frequencies for Audit Committee Literacy for the SSM and ASX Samples
SSM ASX
Not Literate 2 3
Literate 42 297
Frequency
Total 44 300
Not Literate 0.05 0.01
Literate 0.95 0.99
Frequency
Percentage
Total 1.00 1.00
For the SSM, while there were 42 (approximately 95%) companies with a literate
audit committee, only 2 (approximately 5%) companies failed to maintain such
committee. This indicates that the majority of Saudi companies complied with the
literacy requirements set by the SMC.
For the ASX, whilst there were 297 (99%) companies with a literate audit committee,
only 3 (1%) companies failed to maintain such committee. This indicates that the
majority of the ASX companies complied with the literacy requirement set by the
ASX CGC.
It was clear that Australian companies were in a better position in terms of their
compliance with the ASX CGC best practices regarding audit committee literacy

Chapter 6: Descriptive Data Analysis Victoria University
157
compared to the compliance of Saudi companies with the SMC best practices
regarding the same matter. Finally, the mode for the SSM and ASX was 1 indicating
that the event that occurred the most was having a literate audit committee.
In summary, it could be concluded from the discussions regarding the test variables
that the ASX companies were in a better position in terms of their compliance with
the ASX CGC best practices compared to the compliance of Saudi companies with
Saudi guidelines. This could be attributed to the lack of any disclosure requirements
regarding audit committees by the SMC or SSM. While for ASX companies such
requirements exists and they are compulsory.
6.4.3 Control Variables
6.4.3.1 Board Composition
Despite the fact that the percentage of non-executive directors on the board will be
used as a control variable to isolate the influence of the structure of the boards of
directors on both the auditor selection process and NAS purchases, not only the
descriptive statistics for such variable will be presented and discussed, but also the
descriptive statistics for other variables that were related to the structure of the board
of directors or that could be used as alternative control variables for the percentage of
non-executive directors.
Table 6-20 presents the descriptive statistics for percentage of non-executive directors
(OUTSIDER) for the SSM and ASX Samples.
Table 6-20 Descriptive Statistics for the Percentage of Non-executive directors For the SSM and
ASX
SSM ASX
Minimum 0.29 0.17
Maximum 0.86 1
Mean 0.55 0.72
S. Deviation 0.19 0.17
While the minimum OUTSIDER for the SSM was 0.29, the same minimum for the
ASX was only 0.17. This indicates that Saudi companies were in a better position in
term of the minimum OUTSIDER compared to the Australian companies.

Chapter 6: Descriptive Data Analysis Victoria University
158
On the other hand, whilst the maximum OUTSIDER for the ASX was 1, the same
maximum for the SSM was only 0.86. As a result, Australian companies were in a
better position in term of the maximum OUTSIDER.
Although the ASX CGC and the SMC did not recommend any minimum or maximum
for the percentage of non-executive directors on the board, ASX CGC did recommend
that the majority of the board of directors should be independent, which implies that at
least the majority of the board should be non-executive directors. Consequently, it is
expected that on average the ASX companies would have a higher percentage of non-
executive directors than that for Saudi companies.
While the average percentage of non-executive directors for the SSM was 0.55, on
average the percentage for the ASX was 0.72 indicating that the ASX companies had
a higher percentage of non-executive directors as it was expected.
On the other hand, Table 6-21 demonstrates the descriptive statistics for the total
number of directors on the board (TDB) and the total number of non-executive
directors on the board (TNDB) for the SSM and ASX Samples.
While the minimum number of directors for the SSM and ASX were 5 and 2
directors, respectively, the maximum number of board of directors for the SSM and
ASX were 12 and 14 directors, respectively.
Table 6-21 Descriptive Statistics for Total Number of Directors and Total Number of Non-
executive directors for the SSM and ASX
SSM ASX
TDB TNDB TDB TNDB
Minimum 5 3 2 1
Maximum 12 8 14 12
Mean 8.3 5.3 6.1 4.5
S. Deviation 1.7 1.6 2.2 2.2
On the other hand, whilst the minimum number of non-executive directors on the
board for the ASX and SSM were 1 and 3 directors, respectively, the maximum
number of board of directors for the SSM and ASX were 8 and 12 directors,
respectively.

Chapter 6: Descriptive Data Analysis Victoria University
159
Moreover, while on average the total number of directors for the SSM was 8.3
directors, the same average for the ASX was only 6.1 directors. On the other hand,
whilst on average the number of non-executive directors on the board for the SSM
was 5.3 directors, the same average for the ASX was only 4.5 directors.
This gives an indication that Saudi companies utilized larger boards and more non-
executive directors compared to their Australian counterparts. One possible
explanation could be that Saudi companies on average were bigger in terms of the size
compared to their Australian counterparts. Another explanation could be that Saudi
companies had more resources to attract a high number of directors to their boards
compared to their Australian counterparts.
While the spread of data around the mean for the SSM was 1.7, the same spread for
the ASX was 2.2 indicating that the volatilities of the total number of board of
directors for the SSM companies was less than that for their Australian counterparts.
Table 6-22 shows the descriptive statistics for the total number of independent
directors (TID) on the board and the percentage of independent directors (BOR_IND)
on the board for only the ASX sample, as these data were not available for the Saudi
sample.
Table 6-22 Descriptive Statistics for Total Number and Percentage of Independent directors on
the Board for the ASX
TID BOR_IND
Minimum 0 0
Maximum 11 1
Mean 3.2 0.49
S. Deviation 2.2 0.24
While the minimum number of independent directors on the board was 0 indicating
that there was at least one company that had no independent directors on its board, the
maximum number of independent directors on the board was 11 directors.
Moreover, whilst the minimum percentage of independent directors on the board was
0 indicating that there was at least one company that had zero percentage of

Chapter 6: Descriptive Data Analysis Victoria University
160
independent directors on its board, the maximum percentage of independent directors
on the board was 0.92.
In addition, whilst on average the number of independent directors on the board was
3.2, the ASX companies on average had 0.49 independent directors on their boards of
directors indicating that the ASX companies on average did not meet the majority of
independent directors on the board requirement as set by the ASX CGC. Finally, the
spread of data around the mean for TID and BOR_IND were 2.2 and 0.24,
respectively.
On the other hand, it is important to know the number and the percentage of
companies that complied with having a majority of independent directors on the board
as recommended by the ASX CGC.
Table 6-23 presents the frequencies for the minimum percentage of independent
directors (M_BOR_IND) on the board for the ASX sample.
While 156 (52%) companies failed to comply with having a majority of independent
directors on the board as recommended by the ASX CGC, 144 (48%) companies
complied with such recommendation.
Table 6-23 Frequencies for the Minimum Percentage of Independent Directors on the Board for
the ASX
M_BOR_IND
Not Majority 156 Majority 144
Frequency Total 300
Not Majority 0.52 Majority 0.48
Frequency Percentage
Total 1.00
Finally, the mode for the ASX was 0 indicating that the event that occurred most was
having a majority of non-independent directors on the board.

Chapter 6: Descriptive Data Analysis Victoria University
161
6.4.3.2 Management Ownership
Table 6-24 presents the descriptive statistics of the percentage of management
ownership (IN_OWN) only for the ASX sample because data were not publicly
available for such variable for the Saudi companies.
Table 6-24 Descriptive Statistics of management ownership for the ASX
IN_OWN
Minimum 0.005 Maximum 0.90
Mean 0.11 S. Deviation 0.18
The minimum percentage of management ownership was approximately 0.005
indicating that there was at least one company where the management own less than
1%.
On the other hand, the maximum percentage of management ownership was 0.90
indicating that there was at least one company where management owned the majority
of its shares.
Moreover, on average the management owned only 0.11 of the shares in the ASX
companies. Finally, the spread of data around the mean was 0.18.
6.4.3.3 Leverage
Table 6-25 presents the descriptive statistics of percentage of leverage (LEVERAGE)
for the SSM and ASX samples.
Table 6-25 Descriptive Statistics of the Percentage of Leverage for the SSM and ASX
SSM ASX
Minimum 0.01 0.005 Maximum 0.92 5.4
Mean 0.36 0.44 S. Deviation 0.26 0.42

Chapter 6: Descriptive Data Analysis Victoria University
162
While the minimum percentage of leverage for the SSM was 0.01, such minimum for
the ASX was 0.005 indicating that such minimum was very much the same for the
two samples.
Moreover, whilst the maximum percentage of leverage for the SSM was 0.92, such
maximum was 5.4 for the ASX indicating that there was a big difference between the
two samples regarding such percentage.
Moreover, the average percentages of leverage for the SSM and ASX were
approximately 0.36 and 0.44 respectively. This indicates that the ASX companies had
higher leverage percentage compared to their Saudi counterparts.
Finally, the spread of data around the mean for the SSM and ASX were 0.26 and 0.42
indicating that the volatility of leverage percentage for the Saudi companies was less
than that for the ASX companies.
6.4.3.4 New Funds
Table 6-26 presents the descriptive statistics of the percentage of new funds
(NEW_FUND) for the SSM and ASX samples.
Table 6-26 Descriptive Statistics of the Percentage of New Funds for the SSM and ASX
SSM ASX
Minimum 0 0.03
Maximum 0.42 1.80
Mean 0.02 0.26
S. Deviation 0.09 0.34
While the minimum percentage of new funds for the SSM was approximately 0.002,
such minimum for the ASX was 0.03 indicating that the ASX companies had a higher
minimum compared to the SSM companies.
Moreover, whilst the maximum percentage of new funds for the SSM was 0.42, such
maximum was 1.80 indicating that there was a big difference between the two
samples regarding such percentage and that the ASX companies had a higher
maximum compared to the SSM companies.

Chapter 6: Descriptive Data Analysis Victoria University
163
Moreover, the average percentages of new funds for the SSM and ASX were
approximately 0.02 and 0.26, respectively indicating that on average the ASX
companies were expected to grow faster than their Saudi counterparts because the
ASX companies were able to attract more new funds compared to their Saudi
counterparts.
Finally, the spread of data around the mean for the SSM and ASX were 0.09 and 0.34
indicating that the volatility of new funds percentage for the Saudi companies was less
than that for the ASX companies.
6.4.3.5 Business Segments
Table 6-27 presents the descriptive statistics of the number of business segments
(BUS_SEG) for the SSM and ASX samples.
Table 6-27 Descriptive Statistics of the Number of Business Segments for the SSM and ASX
SSM ASX
Minimum 1 1 Maximum 7 6
Mean 2.52 2.22 S. Deviation 1.35 1.49
The minimum number of business segments for both samples was one business
segment indicating that there was at least one company in each market that operates as
a single business segment.
In addition, the maximum number of business segments for the SSM and ASX were 7
and 6 respectively indicating that there were companies in both samples that have
complicated operational environments and that there was at least one Saudi firm that
had more complicated operations compared to its Australian counterparts.
Moreover, on average the SSM companies (2.52) had higher number of business
segments than their Australian counterparts (2.22) indicating that on average the SSM
companies had more complicated operations compared to the ASX companies.

Chapter 6: Descriptive Data Analysis Victoria University
164
Finally, the spread of data around the mean for the SSM and ASX were 1.35 and 1.49
respectively indicating that the volatility of the number of business segments for the
Saudi companies was less than that for the ASX companies.
6.4.3.6 Return on Total Assets
Table 6-28 presents the descriptive statistics of the return on total assets (ROA) for
the SSM and ASX samples.
Table 6-28 Descriptive Statistics of the Return on Total Assets for the SSM and ASX
SSM ASX
Minimum -0.08 -2.04
Maximum 0.26 0.86
Mean 0.06 -0.03
S. Deviation 0.08 0.31
The minimum ROA for the SSM and ASX were –0.08 and –2.04, respectively,
indicating that there was at least one Saudi company that reported better ROA
compared to its Australian counterpart.
In addition, the maximum ROA for the SSM and ASX were 0.26 and 0.86,
respectively, indicating that there was at least one Australian company that reported
higher ROA than its Saudi counterpart.
Moreover, on average the SSM companies (0.06) were more profitable than their
Australian counterparts (-0.03). Finally, the spread of data around the mean for the
SSM and ASX were 0.08 and 0.31 respectively indicating that the volatility of ROA
for the Saudi companies was less than that for the ASX companies.
6.4.3.7 Size of the Firm
Despite the fact that the logarithm of sales (SIZE) is the control variable that will be
used in the regression to isolate the influence of size differences, it is not appropriate
to present the descriptive statistics for such variable as such statistics are meaningless.
As a result, the descriptive statistics for sales (SALES) that add value to the analysis
will be demonstrated and discussed.
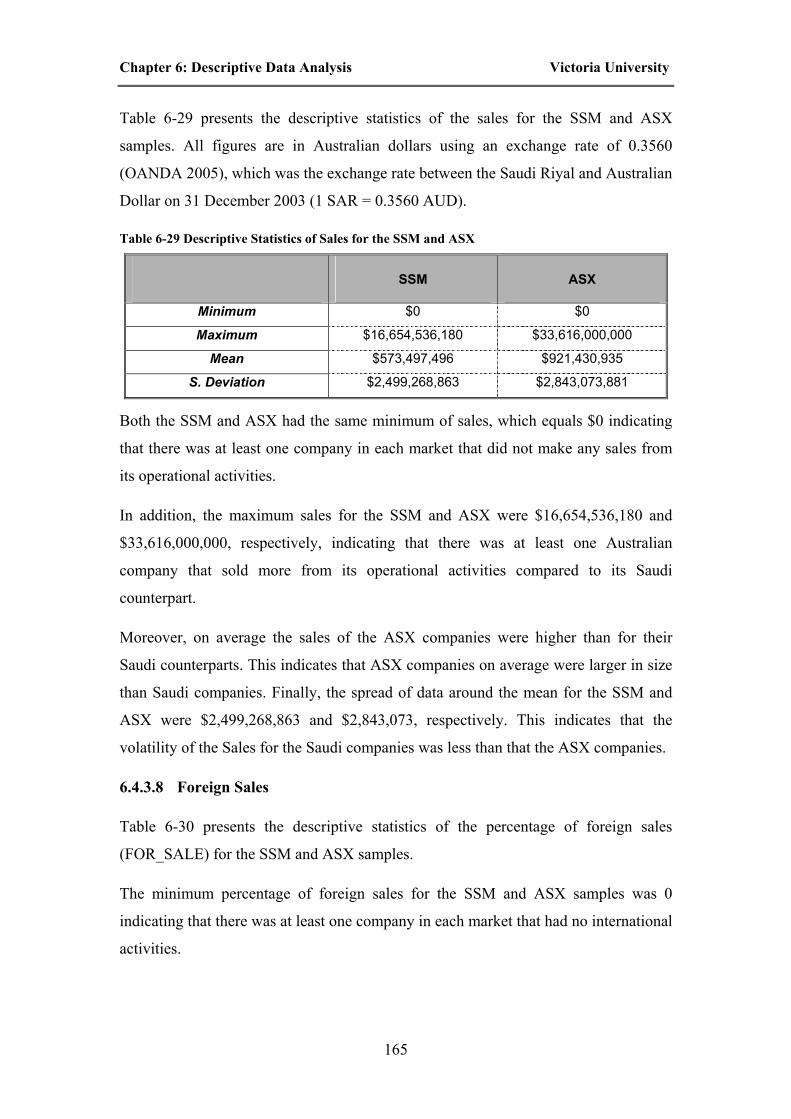
Chapter 6: Descriptive Data Analysis Victoria University
165
Table 6-29 presents the descriptive statistics of the sales for the SSM and ASX
samples. All figures are in Australian dollars using an exchange rate of 0.3560
(OANDA 2005), which was the exchange rate between the Saudi Riyal and Australian
Dollar on 31 December 2003 (1 SAR = 0.3560 AUD).
Table 6-29 Descriptive Statistics of Sales for the SSM and ASX
SSM ASX
Minimum $0 $0
Maximum $16,654,536,180 $33,616,000,000
Mean $573,497,496 $921,430,935
S. Deviation $2,499,268,863 $2,843,073,881
Both the SSM and ASX had the same minimum of sales, which equals $0 indicating
that there was at least one company in each market that did not make any sales from
its operational activities.
In addition, the maximum sales for the SSM and ASX were $16,654,536,180 and
$33,616,000,000, respectively, indicating that there was at least one Australian
company that sold more from its operational activities compared to its Saudi
counterpart.
Moreover, on average the sales of the ASX companies were higher than for their
Saudi counterparts. This indicates that ASX companies on average were larger in size
than Saudi companies. Finally, the spread of data around the mean for the SSM and
ASX were $2,499,268,863 and $2,843,073, respectively. This indicates that the
volatility of the Sales for the Saudi companies was less than that the ASX companies.
6.4.3.8 Foreign Sales
Table 6-30 presents the descriptive statistics of the percentage of foreign sales
(FOR_SALE) for the SSM and ASX samples.
The minimum percentage of foreign sales for the SSM and ASX samples was 0
indicating that there was at least one company in each market that had no international
activities.

Chapter 6: Descriptive Data Analysis Victoria University
166
Table 6-30 Descriptive Statistics of the Percentage of Foreign Sales for the SSM and ASX
SSM ASX
Minimum 0 0
Maximum 0.25 1
Mean 0.05 0.16
S. Deviation 0.06 0.25
In addition, the maximum percentage of foreign sales for the SSM and ASX samples
were 0.25 and 1.00, respectively, indicating that there was at least one ASX company
that did not have any local activities.
Moreover, on average the percentages of foreign sales for the SSM and ASX samples
were 0.05 and 0.16, respectively, indicating that on average the ASX companies had
higher international operations than their Saudi counterparts.
Finally, the spread of data around the mean for the SSM and ASX were 0.06 and 0.25,
respectively, indicating the volatility of the FOR_SALE for the Saudi companies was
less than that the ASX companies.
The number of geographical segments (G_SEG) is an alternative measure of the
complexity of the company and, as a result, it is important to present the descriptive
statistics for such variable.
Table 6-31 presents the descriptive statistics of the number of geographical segments
for the SSM and ASX samples.
Table 6-31 Descriptive Statistics of the Number of Geographical Segments for the SSM and ASX
SSM ASX
Minimum 1 1
Maximum 6 5
Mean 2.18 1.91
S. Deviation 1.13 1.22
The minimum number of geographical segments for both samples was one
geographical segment indicating that there was at least one company in each market
that operates in a single geographical segment.
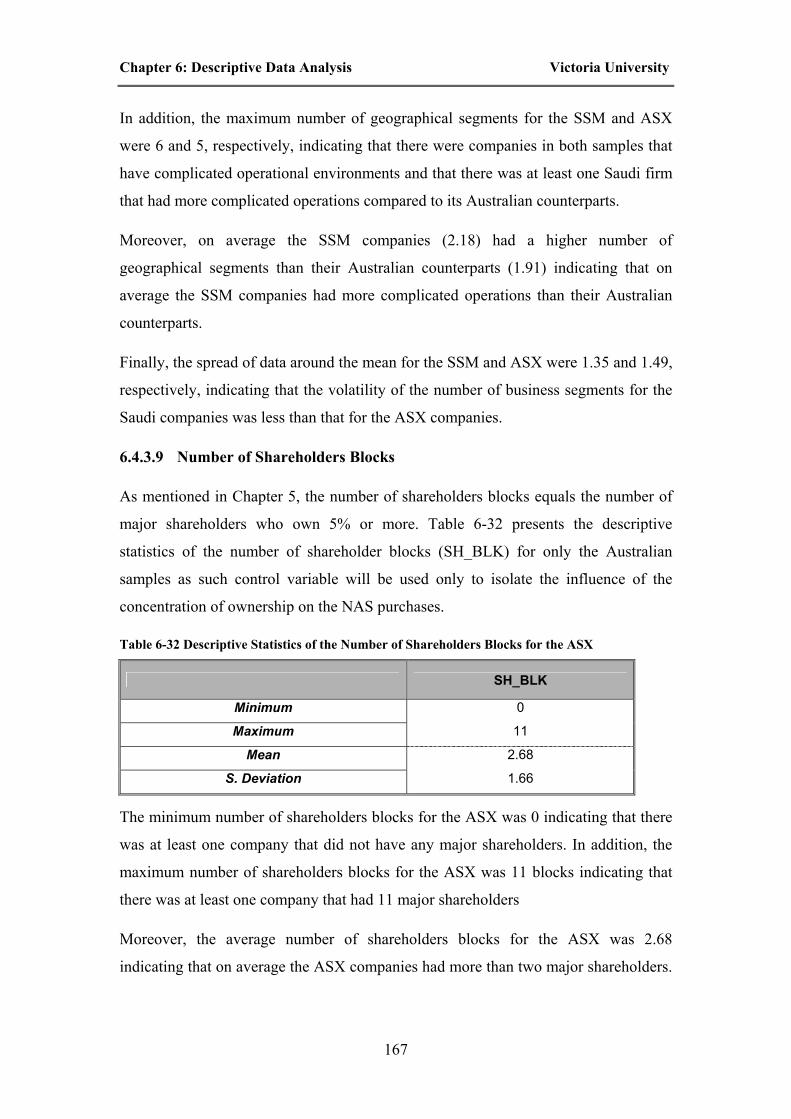
Chapter 6: Descriptive Data Analysis Victoria University
167
In addition, the maximum number of geographical segments for the SSM and ASX
were 6 and 5, respectively, indicating that there were companies in both samples that
have complicated operational environments and that there was at least one Saudi firm
that had more complicated operations compared to its Australian counterparts.
Moreover, on average the SSM companies (2.18) had a higher number of
geographical segments than their Australian counterparts (1.91) indicating that on
average the SSM companies had more complicated operations than their Australian
counterparts.
Finally, the spread of data around the mean for the SSM and ASX were 1.35 and 1.49,
respectively, indicating that the volatility of the number of business segments for the
Saudi companies was less than that for the ASX companies.
6.4.3.9 Number of Shareholders Blocks
As mentioned in Chapter 5, the number of shareholders blocks equals the number of
major shareholders who own 5% or more. Table 6-32 presents the descriptive
statistics of the number of shareholder blocks (SH_BLK) for only the Australian
samples as such control variable will be used only to isolate the influence of the
concentration of ownership on the NAS purchases.
Table 6-32 Descriptive Statistics of the Number of Shareholders Blocks for the ASX
SH_BLK
Minimum 0
Maximum 11
Mean 2.68
S. Deviation 1.66
The minimum number of shareholders blocks for the ASX was 0 indicating that there
was at least one company that did not have any major shareholders. In addition, the
maximum number of shareholders blocks for the ASX was 11 blocks indicating that
there was at least one company that had 11 major shareholders
Moreover, the average number of shareholders blocks for the ASX was 2.68
indicating that on average the ASX companies had more than two major shareholders.

Chapter 6: Descriptive Data Analysis Victoria University
168
Finally, the spread of data around the mean for the number of shareholders blocks was
1.66.
6.4.3.10 NAS Specialization
As mentioned in Chapter 5, despite the fact that there are three different methods to
identify NAS specialization (NAS_SP), namely, Continuous, Craswell and Palmrose,
the Continuous method will be used in the main analysis, as it does not require any
arbitrary selection of a cut-off point.
However, the descriptive statistics will be presented and discussed for all the three
methods because the other two methods will be used to perform a sensitivity test to
examine the influence of using alternative methods on the results of the regression
analysis.
It should be noted that NAS specialization descriptive statistics are presented and
discussed only for the ASX sample as such control variable is used only to isolate the
influence of the NAS specialization on the NAS purchases, which is not applicable in
the Saudi context.
Table 6-33 presents the descriptive statistics of the NAS specialization using
Continuous method for the ASX sample.
Table 6-33 Descriptive Statistics of the NAS specialization Using Continuous Method for the ASX
NAS_SP
Minimum 0
Maximum 0.83
Mean 0.17
S. Deviation 0.19
The minimum of the NAS_SP for the ASX sample was 0 indicating that there was at
least one company that hired an auditor who did not provide any NAS for the
company’s industry.
In addition, the maximum of the NAS_SP for the ASX was 0.83 indicating that there
was at least one company that hired an auditor who was dominant in providing NAS
for the company’s industry.

Chapter 6: Descriptive Data Analysis Victoria University
169
Moreover, on average the ASX companies hired an auditor who provided at least 0.17
of the total NAS of the company’s industry. Finally, the spread of data around the
mean for NAS specialization was 0.19.
Table 6-34 presents the frequencies of the NAS specialization using Craswell and
Palmrose methods for the ASX sample.
Table 6-34 Frequencies of the NAS specialization Using Craswell and Palmrose Methods for the
ASX Sample
Craswell 20% Palmrose 15%
Non-Specialist 180 142
Specialist 120 158
Frequency
Total 300 300
Non-Specialist 0.60 0.47
Specialist 0.40 0.53
Frequency Percentage
Total 1.00 1.00
When using the Craswell method, while 180 (0.60) companies hired a non-NAS
specialist auditor, 120 (0.40) companies employed a NAS specialist auditor indicating
that most of the ASX companies engaged with a non-NAS specialist under this
method.
However, using the Palmrose method reveals that whilst 142 (0.47) companies
utilized a non-NAS specialist auditor, 158 (0.53) companies engaged with a NAS
specialist auditor indicating that most of the ASX companies employed a NAS
specialist under this method.
6.5 Summary
A brief discussion about the descriptive statistics and the main groups of techniques
used to present such descriptive statistics was provided. In addition, data were
analysed using Microsoft Excel and SPSS. Moreover, a number of procedures that
have been used to ensure data entry validity was illustrated.
Furthermore, where applicable, descriptive statistics (frequencies, minimum,
maximum, means, modes and standard deviations) were used in analysing and

Chapter 6: Descriptive Data Analysis Victoria University
170
presenting the results not only for the variables of interest, but also for other variables
that were related or alternatives for any of the variables of interest.
The following observations can be made from the results presented in this chapter.
• Saudi companies were less likely to hire a high quality auditor (Big 4 or
Specialist) compared to their Australian counterparts.
• The arbitrary selection of the cut-off points associated with the use of the
AQ_Craswell and AQ_Palmrose methods produced completely different
results regarding the determination of specialist auditors and, as a result,
AQ_Continuous method is superior to the former two methods.
• Saudi companies were less likely to have an effective audit committee
compared to their Australian counterparts.
• Saudi companies were less likely to have an independent audit committee
compared to their Australian counterparts.
• Saudi companies were in a better position in complying with their local best
practices set by the SMC regarding the size of the audit committee and the
minimum number of meetings for such committee compared to their
Australian counterparts in complying with their local best practices if such
practices exist or the American best practices otherwise.
• The ASX companies were more likely to have an audit committee with a
charter compared to the Saudi companies.
• The ASX companies were more likely to have an audit committee that had at
least one expert on its board compared to the Saudi companies.
• The ASX companies were more likely to have a literate audit committee
compared to the Saudi companies.
• For most of the control variables the ASX companies were in a better position
compared to the Saudi companies

Chapter 7: Empirical Analysis Victoria University
171
CHAPTER 7: EMPIRICAL ANALYSIS
7.1 Introduction
This chapter is divided into two sections. While the first section presents univariate
analysis, multivariate analysis is used to test the hypotheses of this study in section 2.
The univariate analysis section has two parts. In the first part, the correlation analysis
is conducted for the SSM and ASX samples and a conclusion about the presence of
multicollinearity, which might affect regression analysis, is made. In Part 2, the t-test
of two-independent samples (equality of means analysis) is performed to provide
information regarding the differences in means between two independent groups in
order to identify if such differences occurred only by chance.
The multivariate analysis section also has two parts. Whilst the first part uses
regression analysis to model audit quality and NAS purchases, the second part
provides an additional test to examine the influence of having different compliance
requirements regarding the ASX CGC best practices and recommendations related to
audit committees.
Finally, despite the fact that there is a number of proxies and methods that could be
used to surrogate for audit quality, the AQ_Continuous method is the only proxy for
audit quality that will be used in this chapter because it overcomes most of the
disadvantages associated with the other proxies or methods such as the arbitrary
selection of a cut-off point. However, with the exception of the three levels proxy,
which was used rarely in the literature, the results of using the other alternative
proxies and methods will be presented in Chapter 8 as sensitivity tests.
7.2 Univariate Analysis
7.2.1 Correlation Analysis
Correlation is used to investigate the strength and the sign of the relationship between
two or more variables. Correlation coefficients can range from –1 to +1. The value of

Chapter 7: Empirical Analysis Victoria University
172
–1 represents a perfect negative correlation while a value of +1 represents a perfect
positive correlation. A value of 0 represents a lack of correlation.
Correlation analysis is a very important statistical test when using linear regression
because one of the assumptions for such regressions is not to have multicollinearity
among the test variables. Multicollinearity indicates the presence of perfect or exact
linear relationship among some or all the test variables (Gujarati 1995).
When there is prefect multicollinearity, the regression coefficients of the test variables
will be indeterminate and their standard errors will be infinite. On the other hand,
when the multicollinearity is less than prefect, the regression coefficients cannot be
estimated accurately as a result of the large standard errors associated with such
multicollinearity (Gujarati 1995).
In most cases, there are more than two variables that need to be checked for
correlation. As a result, correlation coefficients are presented in a matrix, which
illustrates the direction and the magnitude of the association between each two
variables. In addition, it is important to examine the significance of each correlation
(relationship) to ensure that this correlation does not occur by chance as a result of the
sampling error.
The null hypothesis will be that no relationship exists between the two variables.
SPSS will produce the correlations matrix that reveals not only the value and the
direction of the relationships among the test variables, but also the results of the
significance tests for such relationships.
Table 7.1 demonstrates the correlation matrix for the SSM sample and reveals the
following.
• The highest correlation between ACE and audit committee characteristics
(SACC) was that between ACE and audit committee size (AC_SIZE)
indicating that AC_SIZE was the most important determinant of ACE.
• The lowest correlation between ACE and SACC was that between ACE and
audit committee literacy (AC_LIT) indicating that AC_LIT contributes the
least to ACE.

Chapter 7: Empirical Analysis Victoria University
173
Table 7-1 Correlations Matrix for the Saudi (SSM) Sample
Variables A
CE
AC
_IN
D
AC
_SIZ
E
AC
_AC
T
AC
_CH
AR
AC
_EXP
AC
_LIT
OU
TSID
ER
LEVE
RA
GE
NEW
_FU
ND
BU
S_SE
G
RO
A
SIZE
FOR
_SA
LE
ACE 1.00 AC_IND 0.39** 1.00 AC_SIZE 0.81** 0.41** 1.00 AC_ACT 0.52** 0.46** 0.33* 1.00
AC_CHAR 0.42** 0.38* 0.21 0.35** 1.00 AC_EXP 0.22 0.23 0.27 0.21 0.37* 1.00 AC_LIT 0.13 0.19 0.16 0.07 0.09 0.27 1.00
OUTSIDER 0.33* 0.46** 0.22 0.34* 0.42** 0.23 0.26 1.00 LEVERAGE 0.32* 0.41** 0.26 0.45** 0.19 0.04 0.06 0.52** 1.00 NEW_FUND -0.10 0.08 0.08 -0.07 -0.09 0.11 0.07 -0.02 -0.16 1.00 BUS_SEG 0.37* 0.41** 0.30* 0.16* 0.30* 0.25 0.25 0.73** 0.38** 0.10 1.00
ROA 0.06 -0.10 0.14 -0.17 -0.09 0.03 0.00 0.03 -0.27 0.05 -0.11 1.00 SIZE -0.06 0.20 -0.02 0.03 0.08 0.02 0.03 0.37* 0.43** 0.00 0.24 0.29 1.00
FOR_SALE 0.29 0.37* 0.21 0.19** 0.38** 0.26 0.16 0.77** 0.27 -0.02 0.62** 0.09 0.37* 1.00 ** and * indicate that the correlation is significant at 0.01 and 0.05 levels respectively (2-tailed).

Chapter 7: Empirical Analysis Victoria University
174
• As was expected all the correlations between ACE and SACC were positive.
• With the exception of audit committee expertise (AC_EXP) and AC_LIT, all
the correlations between ACE and SACC were significant.
• While the highest correlation between ACE and the control variables was that
between ACE and BUS_SEG (0.37), the lowest correlation between ACE and
the control variables was that between ACE and ROA (0.13).
• In relation to the correlations between ACE and the control variables, only the
OUTSIDER, LEVERAGE and BUS_SEG were significant.
• Multicollinearity does not exist among the test variable as all the correlations
were less than + or - 0.80 with the exception of the correlation between ACE
and audit committee size (0.81), which will not be a problem as these two
variables will not be used in the same regression.
Table 7.2 presents the correlation matrix for the ASX sample and reveals the
following.
• The highest correlation between ACE and ACCS was that between ACE and
audit committee independence (AC_IND) indicating that AC_IND was the
most important determinant of ACE.
• The lowest correlation between ACE and ACCS was that between ACE and
audit committee literacy (AC_LIT) indicating that AC_LIT contributes the
least to ACE.
• As was expected all the correlations between ACE and ACCS were positive.
• With the exception of AC_LIT, all the correlations between ACE and ACCS
were significant.
• The highest correlation between ACE and control variables was that between
ACE and SIZE.

Chapter 7: Empirical Analysis Victoria University
175
Table 7-2 Correlations Matrix for the Australian (ASX) Sample
Variables A
CE
AC
_IN
D
AC
_SIZ
E
AC
_AC
T
AC
_CH
AR
AC
_EXP
AC
_LIT
OU
TSID
ER
IN_O
WN
LEVE
RA
GE
NEW
_FU
ND
BU
S_SE
G
RO
A
SIZE
FOR
_SA
LE
SH_B
LK
NA
S_SP
ACE 1.00 AC_IND 0.74** 1.00 AC_SIZE 0.41** 0.28** 1.00 AC_ACT 0.67** 0.46** 0.34** 1.00
AC_CHAR 0.41** 0.47** 0.17** 0.30** 1.00 AC_EXP 0.27** 0.27** 0.15** 0.24** 0.10 1.00 AC_LIT 0.09 0.13* -0.13* 0.05 -0.04 0.09 1.00
OUTSIDER 0.44 0.40 0.34 0.27 0.25 0.15 0.05 1.00 IN_OWN -0.32** -0.22** -0.19** -0.25** -0.16** -0.14* 0.02 -0.43 1.00
LEVERAGE 0.13* 0.04 0.12* 0.16** -0.05 0.05 0.03 0.09 0.06 1.00 NEW_FUN -0.26** -0.22** -0.19** -0.27** -0.17** 0.08 -0.08 -0.13* 0.01 0.12* 1.00 BUS_SEG 0.38** 0.25** 0.29** 0.44** 0.18** 0.09 0.04 0.22** -0.21** 0.15** -0.20** 1.00
ROA 0.29** 0.25** 0.23** 0.24** 0.23** 0.03 0.14* 0.08 -0.02 -0.13* -0.41** 0.14* 1.00 SIZE 0.54** 0.47** 0.37*8 0.54** 0.29** 0.27** 0.09 0.25 -0.24** 0.27** -0.40** 0.53** 0.40** 1.00
FOR_SALE 0.26** 0.20** 0.11 0.24** 0.14* 0.05 0.03 0.11* -0.02 0.16** -0.12* 0.19** 0.07 0.27** 1.00 SH_BLK -0.18** -0.11 -0.10 -0.16** -0.01 -0.10 0.02 -0.16 0.09 -0.06 N/A N/A 0.03 -0.16** N/A 1.00 NAS_SP 0.43** 0.37** 0.29** 0.36** 0.23** 0.11 -0.04 0.17 -0.24** 0.05 N/A N/A 0.14* 0.40** N/A -0.20** 1.00
** and * indicate that the correlation is significant at 0.01 and 0.05 levels respectively (2-tailed).

Chapter 7: Empirical Analysis Victoria University
176
• The lowest correlation between the ACE and the control variables was that
between the ACE and LEVERAGE.
• In relation to the correlations between ACE and control variables, the
OUTSIDER was insignificant, the LEVERAGE was significant at 0.05 and
the rest of the control variables were significant.
• Multicollinearity does not exist among the test variables as all the correlations
were less than + or - 0.80.
7.2.2 Equality of Means Analysis
Equality of means analysis is the simplest form of statistical test, which aims to
determine if the two sample or two group means are significantly different from one
another, or that such differences could be attributed to chance such as sampling errors
(Gujarati 1995). The term “independent samples or groups” means that the samples or
groups were randomly selected from a population (Gujarati 1995). In other words, the
samples or groups were not repeated measures or matching.
Despite the fact that the t-test could be conducted with or without equal variance
assumptions, with the SPSS, there is no need to guess about the equal (homogeneity)
variances assumption. The SPSS will automatically run the homogeneity of variance
test, known as Levene’s Test. This test uses the F-stat to examine if the variances are
equal or not.
7.2.2.1 Audit Quality (AQ_Continuous)
As the dependent variable under this method is not a dummy variable, it is important
to determine a cut-off point to identify two groups for such dependent variables.
Again the arbitrary selection of such cut-off point will be problematical.
Although different cut-off points could be used to identify the two groups such as the
10%, which was used by Craswell et al. (1994), it is argued in this study that the mean
of the dependent variable should be used as a cut-off point. As a result, the means of
the dependent variable for the SSM and ASX, which equal 0.25 and 0.17,
respectively, will be used to perform the equality of mean analysis for audit quality.

Chapter 7: Empirical Analysis Victoria University
177
Table 7-3 presents the means of the two groups; the differences in means between the
two groups and the results of Levene’s Test and t-test for two independent groups for
the SSM sample using AQ_Continuous.
Table 7-3 Equality of Means Using AQ_Continuous for the SSM
Variable Name
Mean For Firms With
>= .25
Mean For Firms With
< .25 Difference
Equality Of
Variances F-Stat
Equality Of Means
T-Stat ACE 0.40 0.21 0.19 5.38* 1.27
AC_IND 0.40 0.34 0.06 0.42 0.35 AC_SIZE 3.13 2.76 0.37 3.22 2.88*** AC_ACT 4.53 3.07 1.46 1.93 2.93***
AC_CHAR 0.87 0.59 0.28 23.48* 2.16** AC_EXP 1.00 0.83 0.17 19.04* 2.42** AC_LIT 1.00 0.93 0.07 4.95* 1.44
OUTSIDER 0.73 0.60 0.13 0.00 3.79*** LEVERAGE 0.57 0.25 0.33 5.34* 4.35*** NEW_FUND 0.01 0.03 -0.02 2.42 -0.66 BUS_SEG 3.20 2.17 1.03 0.35 2.53**
ROA 0.06 0.06 0.00 0.12 -0.19 SIZE 20.36 17.89 2.47 0.40 2.46**
FOR_SALE 0.09 0.03 0.06 1.20 3.31*** ***, ** and * indicate that a variable is significant at 0.01, 0.05 and 0.10 respectively(2-tailed).
While AC_IND, AC_SIZE and AC_ACT were the only test variables that have equal
variances, LEVERAGE was the only control variable that has unequal variances.
While 40 percent of firms that hire an auditor with equal or more than 0.25 market
share have effective audit committees, only 21 percent of firms that use an auditor
with less than 0.25 market share have similar committees.
Forty percent of firms that hire an auditor with equal or more than 0.25 market share
have independent audit committees; 34 percent of firms using an auditor with less
than 0.25 market share have similar committees.
Whilst firms that hire an auditor with equal or more than 0.25 market share have audit
committees with 3.13 members on average, firms that use an auditor with less than
0.25 market share have audit committees with 2.76 members on average.

Chapter 7: Empirical Analysis Victoria University
178
While firms that hire an auditor with equal or more than 0.25 market share have audit
committees that meet on average 4.53 times per year, firms that use an auditor with
less than 0.25 market share have audit committees that meet on average 3.07 times per
year.
Eighty seven percent of firms that hire an auditor with equal or more than 0.25 market
share have audit committee charters; 59 percent of firms using an auditor with less
than 0.25 market share have similar committees.
Whilst 100 percent of firms that hire an auditor with equal or more than 0.25 market
share have audit committees with at least one expert, 83 percent of firms that use an
auditor with less than 0.25 market share have similar committees.
One hundred percent of firms that hire an auditor with equal or more than 0.25 market
share have literate audit committees; 93 percent of firms that use an auditor with less
than 0.25 market share have similar committees.
While ACE, AC_IND and AC_LIT are insignificant indicating that these test
variables have equal means and that the differences in means between the two groups
occurred by chance, the rest of the test variables are significant indicating that these
test variables have unequal means and that the differences in means between the two
groups did not occur by chance.
With the exception of NEW_FUND and ROA, the rest of the control variables are
significant indicating that these variables have unequal means between the two groups
and that such differences in means did not occur by chance.
Table 7.4 presents the means of the two groups; the differences in means between the
two groups and the results of Levene’s Test and t-test for two independent groups for
the ASX sample using AQ_Continuous.
With the exception of AC_SIZE, AC_ACT and LEVERAGE, the rest of the test
variables are significant indicating that such variables have unequal variances.
Eighty-six percent of firms that hire an auditor with equal or more than 0.17 market
share have effective audit committees; 24 percent of firms using an auditor with less
than 0.17 market share have similar committees.

Chapter 7: Empirical Analysis Victoria University
179
Table 7-4 Equality of Means Using AQ_Continuous for the ASX
Variable Name
Mean For Firms With
>= .17
Mean For Firms With
< .17 Difference
Equality Of
Variances F-Stat
Equality Of Means
T-Stat ACE 0.86 0.24 0.62 18.25* 13.56***
AC_IND 0.94 0.43 0.51 478.18* 11.95*** AC_SIZE 3.31 2.76 0.55 0.99 6.19*** AC_ACT 4.81 2.96 1.85 0.28 8.33***
AC_CHAR 0.99 0.76 0.24 258.64* 7.21*** AC_EXP 0.99 0.87 0.12 75.03* 4.70*** AC_LIT 1.00 0.98 0.02 7.46* 1.74*
OUTSIDER 0.79 0.68 0.10 15.44* 5.73*** IN_OWN 0.04 0.15 -0.11 42.22* -6.11***
LEVERAGE 0.51 0.40 0.10 2.52 2.10** NEW_FUND 0.18 0.31 -0.14 19.44* -3.69*** BUS_SEG 2.74 1.90 0.84 13.73* 4.62***
ROA 0.04 -0.08 0.12 21.34* 3.81*** SIZE 19.81 16.34 3.47 10.39* 11.25***
FOR_SALE 0.21 0.13 0.08 7.47* 2.76*** . ***, ** and * indicate that a variable is significant at 0.01, 0.05 and 0.10 respectively(2-tailed).
While 94 percent of firms that hire an auditor with equal or more than 0.17 market
share have independent audit committees, only 43 percent of firms using an auditor
with less than 0.17 market share have similar committees.
Whilst firms that hire an auditor with equal or more than 0.17 market share have audit
committees with 3.31 members on average, firms that use an auditor with less than
0.17 market share have audit committees with 2.76 members on average.
While firms that hire an auditor with equal or more than 0.17 market share have audit
committees that meet on average 4.81 times per year, firms that use an auditor with
less than 0.17 market share have audit committees that meet on average 2.96 times per
year.
Ninety-nine percent of firms that hire an auditor with equal or more than 0.17 market
share have audit committee charters; 76 percent of firms using an auditor with less
than 0.17 market share have similar committees.

Chapter 7: Empirical Analysis Victoria University
180
Whilst 99 percent of firms that hire an auditor with equal or more than 0.17 market
share have audit committees with at least one expert, 87 percent of firms that use an
auditor with less than 0.17 market share have similar committees.
One hundred percent of firms that hire an auditor with equal or more than 0.17 market
share have literate audit committees; 98 percent of firms that use an auditor with less
than 0.17 market share have similar committees.
All the test and control variables are significant indicating that these variables have
unequal means and that the differences in means between the two groups for these
variables did not occur by chance.
In summary, the t-test for two-independent groups reveals that with the exception of
audit committee effectiveness, independence and literacy for the SSM sample, all the
test variables for the SSM and ASX samples had unequal means between firms with
specialist auditors and firms with non-specialist auditors indicating that the
differences in means between the two groups did not occur by chance.
These findings provide useful information, as audit committee effectiveness,
independence and literacy for the SSM will not be significant in determining audit
quality when running the regression because the differences in means between the two
groups for these variables occurred only by chance.
7.2.2.2 Non-Audit Services Fees Ratio (NAS Fees Ratio)
As this dependent variable is not a dummy, it is important to determine a cut-off point
to identify two groups for such dependent variables. As a result, the mean of the NAS
ratio for the ASX, which equals 0.39, will be used as the cut-off point.
Table 7.5 presents the means of the two groups; the differences in means between the
two groups and the results of Levene’s Test and t-test for two independent groups
using NAS ratio for the ASX sample.

Chapter 7: Empirical Analysis Victoria University
181
Table 7-5 Equality of Means Using NAS Ratio for the ASX
Variable Name
Mean For Firms With
>= .39
Mean For Firms With
< .39 Difference
Equality Of
Variances F-Stat
Equality Of Means
T-Stat ACE 0.27 0.67 -0.40 4.65* -7.54***
AC_IND 0.48 0.75 -0.27 50.17* -4.96*** AC_SIZE 2.86 3.07 -0.21 1.09 -2.34** AC_ACT 3.01 4.31 -1.30 0.22 -5.75***
AC_CHAR 0.76 0.93 -0.16 76.84* -4.02*** AC_EXP 0.89 0.94 -0.05 10.68* -1.61 AC_LIT 0.99 0.99 -0.01 1.29 -0.57
OUTSIDER 0.73 0.72 0.01 1.04 0.51 IN_OWN 0.15 0.08 0.07 19.12* 3.61***
LEVERAGE 0.42 0.47 -0.05 0.50 -1.07 ROA -0.07 0.01 -0.07 3.71 -2.08** SIZE 17.09 18.19 -1.10 0.62 -2.91***
SH_BLK 2.69 2.67 0.02 0.63 0.09 NAS_SP 0.16 0.19 -0.03 0.34 -1.35
***, ** and * indicate that a variable is significant at 0.01, 0.05 and 0.10 respectively(2-tailed).
AC_SIZE, AC_ACT and AC_LIT are the only test variables that are insignificant
indicating that these variables have equal variances.
IN_OWN is the only control variable that is significant indicating that such variable
has unequal variances.
While 27 percent of firms with a NAS ratio equal or more than 0.39 have effective
audit committees, 67 percent of firms with a NAS ratio less than 0.39 have similar
committees.
Forty-eight percent of firms with a NAS ratio equal or more than 0.39 have
independent audit committees; 75 percent of firms with a NAS ratio less than 0.39
have similar committees.
Whilst firms with a NAS ratio equal or more than 0.39 have audit committees with
2.86 members on average, firms with a NAS ratio less than 0.39 have audit
committees with 3.07 members on average.

Chapter 7: Empirical Analysis Victoria University
182
While firms with a NAS ratio equal or more than 0.39 have audit committees that
meet on average 3.01 times per year, firms with a NAS ratio less than 0.39 have audit
committees that meet on average 4.31 times per year.
Seventy-six percent of firms with a NAS ratio equal or more than 0.39 have audit
committee charters; 93 percent of firms with a NAS ratio less than 0.39 have similar
committees.
Whilst 89 percent of firms with a NAS ratio equal or more than 0.39 have audit
committees with at least one expert, 94 percent of firms with a NAS ratio less than
0.39 have similar committees.
One hundred percent of firms with a NAS ratio equal or more than 0.39 have literate
audit committees; 98 percent of firms with a NAS ratio less than have similar
committees.
In summary, with the exception of audit committee expertise and literacy, all the test
variables had unequal means indicating that the differences in means between the two
groups for these variables did not occur by chance. These findings provide useful
information, as audit committee expertise and literacy will not be significant in
determining NAS purchases when running the regression.
7.3 Multivariate Analysis
The main objectives of this study are as follows:
1) examining the association between the audit committee effectiveness (ACE)
and audit quality (auditor selection) for the ASX and SSM samples;
2) determining which audit committee characteristic contributes the most to audit
quality for the ASX and SSM samples;
3) investigating the association between ACE and NAS purchases only for the
ASX sample as providing such services by the incumbent auditor is not
allowed for Saudi listed companies;
4) determining which audit committee characteristic contributes the most to
limiting and controlling NAS purchases for the ASX sample; and

Chapter 7: Empirical Analysis Victoria University
183
5) evaluating the effectiveness of the ASX CGC and SSMC best practices and
recommendations regarding audit committees by using such best practices and
recommendation as benchmarks for determining the effectiveness of the audit
committees and their different characteristics; and
The multivariate analysis is divided into two parts. The first part, main regression
analysis, uses four regressions to achieve the first four objectives of this study. An
additional test will be conducted to examine the influence of having different
compliance requirements regarding audit committee between the two-sub samples of
the ASX (ASX Top 300 Vs. ASX Non-Top 300) in Part 2.
7.3.1 Main Regression Analysis
The main regression analysis is divided into two parts. While the first part uses two
regressions to model audit quality, another two regressions are used in Part 2 to model
NAS purchases.
7.3.1.1 Audit Quality (AQ_Continuous)
As the dependent variable using the AQ_Continuous is a continuous (scale) variable
then the linear regression must be used to model audit quality. As mentioned in
Chapter 4 the following hypotheses will be tested for the SSM and ASX samples:
H1: There is a significant positive relationship between ACE and the selection of a
quality auditor.
H2: There is a significant positive relationship between audit committee
independence and the selection of a quality auditor.
H3: There is a significant positive relationship between the size of the audit
committee and the selection of a quality auditor.
H4: There is a significant positive relationship between the number of meetings of the
audit committee and the selection of a quality auditor.
H5: There is a significant positive relationship between the existence of an audit
committee charter and the selection of a quality auditor.

Chapter 7: Empirical Analysis Victoria University
184
H6: There is a significant positive relationship between audit committee expertise and
the selection of a quality auditor.
H7: There is a significant positive relationship between audit committee literacy and
the selection of a quality auditor.
7.3.1.1.1 Audit Committee Effectiveness
Table 7.6 presents the results of the linear regression using AQ_Continuous as the
dependent variable and the ACE as the only test variable for the SSM and ASX
sample.
Table 7-6 The Results of the Linear Regression Using AQ_Continuous and ACE for the SSM and
ASX samples
SSM ASX Variable Name
Exp. Sign Coefficient t-stat VIFs Coefficient t-stat VIFs
Intercept -0.33 -1.81 -0.17 -2.46 ACE + -0.07 -1.11 1.514 0.17 8.67*** 1.746
OUTSIDER + 0.73 2.88*** 2.550 -0.00 -0.08 1.426 IN_OWN - N/A N/A N/A -0.12 -2.54*** 1.368
LEVERAGE + 0.39 2.64*** 2.425 -0.01 -0.25 1.277 NEW_FUND + -0.24 -0.86 1.251 -0.00 -0.04 1.387 BUS_SEG + 0.03 1.18 2.345 -0.01 -1.79* 1.446
ROA + -0.03 -0.08 1.651 -0.03 -1.12 1.428 SIZE + -0.00 -0.10 2.038 0.02 4.93*** 2.313
FOR_SALE + 0.11 0.18 1.940 0.05 1.64* 1.121 Sample Size 44 300 Model F-stat 12.60 32.05 R2 Square 0.68 0.48 White t-stat N/A 96
***, ** and * indicate that a variable is significant at 0.01, 0.05 and 0.10 respectively(2-tailed).
The overall models are significant for the SSM and ASX samples with F-stats
equalling 12.60 and 32.05, respectively, indicating that at least one of the test
variables is significant.
The variable of interest, ACE, is significant for the ASX sample with the same
predicted sign indicating that such variable was positively associated with the

Chapter 7: Empirical Analysis Victoria University
185
selection of a specialist auditor (H1 was supported). In other words, the ASX
companies with an effective audit committee were more likely to hire a specialist
auditor compared to these with an ineffective audit committee.
The results on ACE for the ASX sample are consistent with those found by Abbott
and Parker (2000). However, it should be noted that Abbott and Parker (2000) used a
different definition for ACE as they considered an audit committee to be effective if
its all members were non-executive directors and met twice a year.
On the other hand, the variable of interest, ACE, for the SSM sample is insignificant
indicating that the SSM companies with an effective audit committee were not more
likely to hire a specialist auditor compared to these with an ineffective audit
committee (H1 was not supported).
A possible explanation for the differences in the results between the SSM and ASX
listed firms could be attributed to the differences in the audit committee framework
between the two countries due to the lack of any disclosure or listing requirements
regarding audit committee for the SSM listed companies.
Another explanation could be attributed to the small size of the SSM sample that
might cause the lack of variability in the sample. In addition, the limitations
associated with the Saudi collected data (these limitations will be discussed in detail
in Chapter 9) such as the use of audit committee members’ perceptions to collect data
about different audit committee characteristics, might provide explanations for such
difference in the results between the two samples for ACE.
IN_OWN is significant for the ASX sample with the same predicted sign indicating
that the ASX companies with a high percentage of management ownership were less
likely to hire a specialist auditor compared to those with a low percentage of
management ownership. The results on IN_OWN are consistent with those found by
Francis and Wilson (1988) and Firth and Smith (1992). It should be noted that
IN_OWN was not available for the SSM sample as such data were not publicly
available for Saudi listed companies.

Chapter 7: Empirical Analysis Victoria University
186
BUS_SEG is significant for the ASX sample with opposite sign to the prediction
indicating that the ASX companies with a large number of business segments were
less likely to hire a specialist auditor compared to those with low number of business
segments. A possible explanation for such unexpected results is that firms with a large
number of business segments have very small business segments or that these
business segments are very closely related to each other, which does not require a
specialist auditor. It should be noted that other alternative measures of complexity
would be used in Chapter 8 as sensitivity tests.
SIZE is significant for the ASX sample with the same predicted signs indicating that
the ASX large companies were more likely to hire a specialist auditor. The results on
SIZE are consistent with those found by Francis and Wilson (1988) and Firth and
Smith (1992).
FOR_SALE is significant for the ASX sample with the same predicted sign indicating
that the ASX companies with a high percentage of foreign sales were more likely to
hire a specialist auditor compared to those with a low percentage of foreigner sales.
The results on FOR_SALE are consistent with those found by Eichenseher (1985),
Simon (1997) and Abbott and Parker (2000). The rest of the control variables are
insignificant for the ASX sample indicating that there were no relationships between
these variables and the selection of a specialist auditor.
On the other hand, OUTSIDER is significant for the SSM sample with the same
predicted sign indicating that the SSM companies with a high percentage of non-
executive directors on the board were more likely to hire a specialist auditor compared
to those with a low percentage of non-executive directors on the board. The results on
OUTSIDER are consistent with those found by Beasley and Petroni (2001).
LEVERAGE is significant for the SSM sample with the same predicted sign
indicating that the SSM companies with a high percentage of leverage were more
likely to hire a specialist auditor compared to those with a low percentage of leverage.
The results on LEVERAGE are consistent with those found by Firth and Smith
(1992). The rest of the control variables are insignificant for the SSM with indicating

Chapter 7: Empirical Analysis Victoria University
187
that there were no relationships between these variables and the selection of a
specialist auditor.
It is clear from the results of the control variables for the SMM and ASX samples that
the determinants of audit quality are completely different. While OUTSIDER and
LEVERAGE were the only control variables that influence the auditor selection
process for the SSM sample, IN_OWN, SIZE and FOR_SALE were important
determinants of audit quality for the ASX sample. Again these differences could be
attributed to the lack of variability among these variables for the SSM sample due to
the small sample.
It is important in any regression analysis to test for muticollinearity and
heteroscedasticity. The variance inflation factors (VIFs) is the most common test to
detect the presence of multicollinearity. Table 7-6 shows that multicollinearity does
not present a problem in the regression for both samples because all the VIFs values
are less than 4 (The rule of thumb is that when the VIFs value > 4, the independent
variable should be dropped from the analysis due to multicollinearity).
On the other hand the White test is used to detect heteroscedasticity for large
samples. As a result, the White test will be used with the ASX sample. In this test, the
white t-statistics is calculated and then compared with the critical value of the chi-
square distribution with P degrees of freedom and at (P is the number of repressors in
the regression, not including the constant). If the white-corrected t-statistics is larger
than the critical value then the null hypothesis can not be rejected and
homoscedasticity could be assumed indicating that heteroscedasticity does not present
a problem in the regression.
Table 7-6 shows that The White-corrected t-statistics equals 96 (R2*N = 0.32*300).
This value is larger than the critical value with P degree of freedom (P = 53) at 0.05,
which equals approximately 71 indicating that heteroscedasticity is not a problem in
this regression.
The Park test will be used with the SSM. In this test, the squared residuals is regressed
on the independent variables and if all the independent variables have significant b

Chapter 7: Empirical Analysis Victoria University
188
coefficients, then the researcher concludes that heteroscedasticity is not a problem in
the regression.
Table 7-7 shows the regression of squared residuals on the independent variable to
perform Park test to detect heteroscedasticity.
Table 7-7 The Results of the Linear Regression Using squared residuals as the dependent
variable for the SSM (Parker test)
Variable Name
Coefficient t-stat Significance
Intercept .004 .122 .904
ACE -.008 -.809 .424
OUTSIDER -.003 -.060 .953
LEVERAGE .019 .889 .380
NEW_FUND .033 .709 .483
BUS_SEG .003 .744 .462
ROA -.075 -1.326 .194
SIZE .000 .187 .853
FOR_SALE .007 .090 .929
Model F-stat 1.16
R2 Square 0.21
***, ** and * indicate that a variable is significant at 0.01, 0.05 and 0.10 respectively (2-tailed).
Table 7-7 shows that none of the b coefficients for the independent variables are
significant at 0.01, 0.05 or 0.10 indicating that homoscedasticity could be assumed
and that heteroscedasticity is not a problem in this regression.
Finally, the R squares equal 0.68 and 0.48 respectively indicating that while the
regression model for the SSM explains 68% of the variation in the dependent variable,
the regression model for the ASX explains only 48% of the variation in the dependent
variable.
7.3.1.1.2 Audit Committee Characteristics
Table 7.8 presents the results of the linear regressions using AQ_Continuous as the
dependent variable and the ACCS as the test variables for the SSM and ASX samples.

Chapter 7: Empirical Analysis Victoria University
189
Table 7-8 The Results of the Linear Regression Using AQ_Continuous and ACCS for the SSM
and ASX
SSM ASX Variable Name
Exp. Sign Coefficient t-stat VIFs Coefficient t-stat VIFs
Intercept -0.42 -1.72 -0.33 -3.04 AC_IND + -0.12 -1.97* 1.586 0.11 5.08*** 1.820 AC_SIZE + -0.00 -0.04 1.744 0.02 2.17** 1.374 AC_ACT + 0.02 1.20 1.653 0.01 2.48*** 1.725
AC_CHAR + -0.04 -0.67 1.507 0.03 1.09 1.365 AC_EXP + 0.12 1.50 1.442 -0.01 -0.25 1.215 AC_LIT + -0.02 -0.20 1.137 0.09 1.12 1.111
OUTSIDER + 0.63 2.32* 2.800 -0.01 -0.25 1.520 IN_OWN - N/A N/A N/A -0.16 -3.22*** 1.372
LEVERAGE + 0.38 2.48* 2.795 0.01 0.28 1.328 NEW_FUND + -0.20 -0.74 1.360 -0.00 -0.07 1.470 BUS_SEG + 0.04 1.49 2.480 -0.01 -1.42 1.530
ROA + 0.09 0.24 1.736 -0.03 -0.97 1.471 SIZE + -0.00 -0.03 1.992 0.01 3.89*** 2.629
FOR_SALE + 0.09 0.15 2.094 0.06 1.98** 1.117 Sample Size 44 300 Model F-stat 8.30 18.76 R2 Square 0.69 .45 White t-stat N/A 150
***, ** and * indicate that a variable is significant at 0.01, 0.05 and 0.10 respectively(2-tailed).
The overall models are significant for the SSM and ASX samples with F-stats
equalling 8.30 and 18.76, respectively, indicating that at least one of the test variables
is significant in both models.
The variable of interest, AC_IND, is significant for the ASX sample with the same
expected sign indicating that there was a positive association between audit committee
independence and the selection of a specialist auditor (H2 is supported). In other
words, the ASX companies with an independent audit committee were more likely to
hire a specialist auditor compared to these with a non-independent audit committee.
The variable of interest, AC_IND, is significant for the SSM sample with the same
expected sign indicating that there was a positive association between audit committee

Chapter 7: Empirical Analysis Victoria University
190
independence and the selection of a specialist auditor (H2 is supported). In other
words, the SSM companies with an independent audit committee were more likely to
hire a specialist auditor compared to these with a non-independent audit committee.
While the results on AC_IND are consistent with those found by Chen et al. (2005),
such results are not consistent with those found by Abbott and Parker (2000). One
possible explanation for such mixed results could be attributed to differences in the
definition of audit committee independence. While both studies used the term “non-
executive directors” to determine audit committee independence, this study used the
term “independent directors” to determine audit committee independence.
AC_SIZE is significant for the ASX sample with the same expected sign indicating
that there was a positive association between audit committee size and the selection of
a specialist auditor (H3 is supported). In other words, the ASX companies with a large
number of audit committee members were more likely to hire a specialist auditor
compared to those with a small number of audit committee members. It should be
noted that this variable has not been investigated in auditor selection literature in its
relation to audit quality.
On the other hand, the variable of interest, AC_SIZE, is insignificant for the SSM
sample indicating that there was no association between audit committee size and
audit quality (H3 is not supported).
AC_ACT is significant at for the ASX sample with the same expected sign indicating
that there was a positive association between audit committee activity and the
selection of a specialist auditor (H4 is supported). In other words, the ASX companies
with an audit committee that meets more frequently were more likely to hire a
specialist auditor compared to these with an audit committee that meets less
frequently.
The results on AC_ACT are contradictory with those found by Abbott and Parker
(2000) and Chen et al. (2005). Different variable specification or measurement could
provide an explanation for such contradictory results. For example, while Abbott and
Parker (2000) used a dummy variable to measure AC_ACT and considered an audit
committee to be active if it met twice a year, this study used the number of meetings

Chapter 7: Empirical Analysis Victoria University
191
(scale variable) to measure audit committee activity. Another possible explanation
could be the lack of variability in this variable. Chen et al. (2005) indicated that 83%
of companies in their sample met at least twice a year.
On the other hand, the variable of interest, AC_ACT, is insignificant for the SSM
sample indicating that there was no association between audit committee size and
audit quality (H4 is not supported).
The variable of interest, AC_CHAR, is insignificant for the SSM and ASX samples
indicating that there was no association between audit committee charter and audit
quality (H12 is not supported). In other words, the SSM and ASX companies that
have an audit committee with charter were not more likely to hire a specialist auditor
compared to those that have an audit committee without charter.
The variable of interest, AC_EXP, is insignificant for the SSM and ASX samples
indicating that there was no association between audit committee expertise and audit
quality (H13 is not supported). In other words, the SSM and ASX companies that
have an audit committee with at least one expert were not more likely to hire a
specialist auditor compared to these that have an audit committee without an expert.
The variable of interest, AC_LIT, is insignificant for the SSM and ASX samples
indicating that there was no association between audit committee literacy and audit
quality (H14 is not supported). In other words, the SSM and ASX companies that
have a literate audit committee were not more likely to hire a specialist auditor
compared to these that have a non-literate audit committee.
It should be noted that the lack of significance in AC_CHAR, AC_EXP and AC_LIT
for the SSM and ASX samples could be explained by insufficient variability in the
sample data. For example, 95% of the firms within the SSM sample and 99% of the
firms within the ASX sample had a literate audit committee.
Despite the fact that AC_IND, AC_SIZE and AC_ACT are important determinants of
audit quality for the ASX, it is important to examine which one contributes the most
to audit quality. This could be done by examining the coefficient of each of these
variables. As the coefficients of AC_IND, AC_SIZE and AC_ACT are 0.11, 0.02 and

Chapter 7: Empirical Analysis Victoria University
192
0.01, respectively, it is clear that AC_IND contributed the most to audit quality
because it had the largest coefficient among the three variables.
Again a possible explanation for the differences in the results between the SSM and
ASX listed firms could be attributed to the differences in the audit committee
framework between the two countries due to the lack of any disclosure or listing
requirements regarding audit committee in for the SSM listed companies.
Another explanation could be attributed to the small size of the SSM sample that
might cause the lack of variability in the sample. In addition, the limitations
associated with the Saudi collected data such as the use of audit committee members’
perceptions to collect data about different audit committee characteristics, might
provide an explanation for such difference in the results between the two samples for
different audit committee characteristics.
IN_OWN is significant for the ASX sample with the same predicted sign indicating
that the ASX companies with a high percentage of management ownership were less
likely to hire a specialist auditor compared to those with a low percentage of
management ownership. The results on IN_OWN are consistent with those found by
Francis and Wilson (1988) and Firth and Smith (1992).
SIZE is significant for the ASX sample with the same predicted signs indicating that
the ASX large companies were more likely to hire a specialist auditor. The results on
SIZE are consistent with those found by Francis and Wilson (1988) and Firth and
Smith (1992).
FOR_SALE is significant for the ASX sample with the same predicted sign indicating
that the ASX companies with a high percentage of foreign sales were more likely to
hire a specialist auditor compared to those with a low percentage of foreign sales. The
results on FOR_SALE are consistent with those found by Eichenseher (1985), Simon
(1997) and Abbott and Parker (2000). The rest of the control variables are
insignificant for the ASX indicating that there were no relationships between these
variables and the selection of a specialist auditor.

Chapter 7: Empirical Analysis Victoria University
193
OUTSIDER is significant for the SSM sample with the same predicted sign indicating
that the SSM companies with a high percentage of non-executive directors on the
board were more likely to hire a specialist auditor compared to these with a low
percentage of independent directors on the board. The results on OUTSIDER are
consistent with those found by Beasley and Petroni (2001).
LEVERAGE is significant for the SSM sample with the same predicted sign
indicating that the SSM companies with a high percentage of leverage were more
likely to hire a specialist auditor compared to these with a low percentage of non-
executive directors on the board. The results on LEVERAGE are consistent with those
found by Firth and Smith (1992).
The rest of the control variables are insignificant for the SSM sample indicating that
there were no relationships between these variables and the selection of a specialist
auditor. Again it is clear from the results that the control variables for the SMM and
ASX samples have produced mixed results. Again these differences could be
attributed to the lack of variability among these variables for the SSM sample due to
the small sample.
As the ASX sample includes companies that are audited by Big 4 and Non-Big 4. It is
important to include Big 4 as a control variable and re-run the regressions for
Australian data. The results of re-running the regressions are similar to those for the
original regressions indicating that the results were not driven by size of the audit
firm.
Table 7-8 shows that multicollinearity does not present a problem in the regression for
both samples because all the VIFs values are less than 4.
Table 7-8 shows that the White t-statistics for the ASX sample equals 150 (0.50*300)
and it is larger than the critical value with P degree of freedom at 0.05 (P=115), which
equals, indicating that heteroscedasticity is not a problem in this regression.
Table 7-9 shows the regression of squared residuals on the independent variables to
perform Park test to detect heteroscedasticity.

Chapter 7: Empirical Analysis Victoria University
194
Table 7-9 The Results of the Linear Regression Using squared residuals as the dependent
variable for the SSM (Parker test)
Variable Name
Coefficient t-stat Significance
Intercept -0.01 -0.44 0.67 AC_IND 0.00 0.67 0.51 AC_SIZE -0.01 -0.72 0.48 AC_ACT 0.00 -0.64 0.52
AC_CHAR 0.00 -0.10 0.92 AC_EXP -0.01 -0.98 0.33 AC_LIT 0.01 0.87 0.39
OUTSIDER 0.06 1.55 0.13 LEVERAGE 0.00 0.23 0.82 NEW_FUND 0.12 1.40 0.15 BUS_SEG 0.00 -0.50 0.62
ROA -0.09 -1.18 0.20 SIZE 0.00 0.55 0.59
FOR_SALE 0.02 0.33 0.75 Model F-stat 1.39
R2 Square 0.38
***, ** and * indicate that a variable is significant at 0.01, 0.05 and 0.10 respectively (2-tailed).
Table 7-9 shows that none of the b coefficients for the independent variables are
significant at 0.01, 0.05 or 0.10 indicating that homoscedasticity could be assumed
and that heteroscedasticity is not a problem in this regression.
Finally, the R squares equal 0.69 and 0.45, respectively, indicating that while the
regression model for the SSM explains 69% of the variation in the dependent variable,
the regression model for the ASX explains only 45% of the variations in the
dependent variable.
7.3.1.2 NAS Purchases
As the NAS_RATIO is a continuous dependent variable, the linear regression must be
used to model the NAS purchases. In addition, in order to determine which audit
committee characteristic contributes the most to controlling and limiting NAS
purchases, not only the association between ACE and NAS purchases will be

Chapter 7: Empirical Analysis Victoria University
195
examined, but also the relationships between the ACCS and NAS purchases. As a
result, the following hypotheses will be tested for the ASX sample.
H8: There is a significant negative relationship between ACE and the NAS ratio
H9: There is a significant negative relationship between audit committee
independence and NAS ratio.
H10: There is a significant negative relationship between the size of the audit
committee and the NAS ratio.
H11: There is a significant negative relationship between the number of meetings of
the audit committee and the NAS ratio.
H12: There is a significant negative relationship between the existence of an audit
committee charter and the NAS ratio.
H13: There is a significant negative relationship between audit committee expertise
and the NAS ratio.
H14: There is a significant negative relationship between audit committee literacy
and the NAS ratio.
7.3.1.2.1 Audit Committee Effectiveness
Table 7.10 presents the results of the linear regression using the relative magnitude of
NAS purchases (NAS ratio) as the dependent variable and the ACE as the only test
variable for the ASX sample.
The overall model is significant with the F-stats equalling 14.89 indicating that at
least one of the test variables is significant.
The variable of interest, ACE, is significant with the same predicted sign indicating
that there was a negative association between the ACE and the NAS ratio (H8 was
supported). In other words, companies with an effective audit committee were more
likely to have lower NAS ratios compared to those with an ineffective audit
committee. The results of ACE are consistent with those found by Abbott et al (2003).

Chapter 7: Empirical Analysis Victoria University
196
Table 7-10 The Results of the Linear Regression Using NAS Ratio and ACE for the ASX
Variable Name
Exp. Sign Coefficient T-Stat VIFs
Intercept 0.39 5.01 ACE - -0.23 -8.46*** 1.81
OUTSIDER - 0.00 -0.21 1.43 IN_OWN + 0.16 2.56*** 1.34
LEVERAGE - -0.02 -0.66 1.22 ROA + -0.02 -0.53 1.36 SIZE + 0.00 0.73 1.88
SH_BLK + 0.00 -0.46 1.08 NAS_SP + 0.17 2.63*** 1.33
Sample Size 300 Model F-stat 14.89*** Adjusted R2 0.27
White t-statistics 147 ***, ** and * indicate that a variable is significant at 0.01, 0.05 and 0.10 respectively(2-tailed).
IN_OWN is significant with the same predicted sign indicating that companies with a
high percentage of management ownership were less likely to have a lower NAS ratio
compared to these with a low percentage of management ownership. The results on
IN_OWN are consistent with those found by Parkash and Venable (1993) and Firth
(1997).
NAS_SP is significant with the same predicted sign indicating that there was a
positive association between NAS_SP and NAS ratio. In other words, companies with
a high specialist auditor were more likely to have a higher NAS ratio compared to
these with a low specialist auditor. The results on NAS_SP are consistent with those
found by Houghton and Ikin (2001).
The rest of the control variables are insignificant indicating that there were no
relationships between these variables and NAS ratio.
Table 7-10 shows that multicollinearity does not present a problem in the regression
because all the VIFs values are less than 4.

Chapter 7: Empirical Analysis Victoria University
197
Table 7-10 shows that the White-corrected t-statistics equals 147 (0.49*300) and it is
larger than the critical value with P degree of freedom at 0.05 (P=42), which equals
approximately 58, indicating that heteroscedasticity is not a problem in this
regression.
Finally, the R square equals 0.27 indicating that this model explains 27% of the
variations in the dependent variable.
7.3.1.2.2 Audit Committee Characteristics
Table 7.11 presents the results of the linear regression using the NAS ratio as the
dependent variable and the ACCS as the test variables for the ASX sample.
Table 7-11 The Results of the Linear Regression Using NAS Ratio and ACCS for the ASX
Variable Name
Exp. Sign Coefficient
T-Stat VIFs
Intercept 0.44 2.88 AC_IND - -0.11 3.81*** 1.86 AC_SIZE - -0.02 -1.15 1.38 AC_ACT - -0.02 3.58*** 1.64
AC_CHAR - -0.01 -0.36 1.37 AC_EXP - 0.05 1.25 1.15 AC_LIT - 0.01 0.11 1.11
OUTSIDER - 0.01 0.09 1.53 IN_OWN + 0.21 3.24*** 1.35
LEVERAGE - -0.03 -0.92 1.25 ROA + -0.03 -0.79 1.41 SIZE + 0.00 0.74 2.13
SH_BLK + 0.00 0.06 1.09 NAS_SP + 0.15 2.25** 1.36
Sample Size 300 Model F-stat 14.89*** Adjusted R2 0.27
White t-statistics 147 ***, ** and * indicate that a variable is significant at 0.01, 0.05 and 0.10 respectively(2-tailed).
The overall model is significant with F-stats equalling 6.54 indicating that at least one
of the test variables is significant. The variable of interest, AC_IND is significant with

Chapter 7: Empirical Analysis Victoria University
198
the same expected sign indicating that there was a negative association between audit
committee independence and NAS ratio (H9 is supported). In other words, companies
with an independent audit committee were more likely to have a lower NAS ratio
compared to those with a dependent audit committee. The results on AC_IND are
consistent with those found by Abbott et al. (2003).
The variable of interest, AC_SIZE is insignificant indicating that there was no
association between audit committee size and NAS ratio (H10 is not supported). In
other words, the ASX companies with a large number of audit committee members
were not more likely to have a lower NAS ratio compared to these with a small
number of audit committee members.
The variable of interest, AC_ACT is significant with the same expected sign
indicating that there was a negative association between audit committee activity and
NAS ratio (H11 is supported). In other words, companies with an audit committee that
meets more frequently were more likely to have a lower NAS ratio compared to those
with an audit committee that meets less frequently. The results on AC_ACT are
consistent with those found by Abbott et al. (2003).
The variable of interest, AC_CHAR, is insignificant at 0.10 with the same predicted
sign indicating that there was no association between audit committee charter and
NAS ratio (H12 is not supported). In other words, the ASX companies that have an
audit committee with a charter were not more likely to have a lower NAS ratio
compared to those that have an audit committee without a charter.
The variable of interest, AC_EXP, is insignificant indicating that there was no
association between audit committee expertise and NAS ratio (H13 is not supported).
In other words, audit committee expertise was not an important determinant of NAS
purchases. The results on AC_EXP are consistent with those found by Abbott et al.
(2003).
The variable of interest, AC_LIT, is insignificant indicating that there was no
association between audit committee literacy and NAS ratio (H14 is not supported). In
other words, audit committee literacy was not an important determinant of audit
quality.

Chapter 7: Empirical Analysis Victoria University
199
Again the lack of significance in AC_CHAR, AC_EXP and AC_LIT could be
attributed to inadequate variability in the sample data. For example, 91% of the firms
within the ASX sample had at least one audit committee member who is considered to
be an expert.
As the coefficients of AC_IND and AC_ACT are 0.11 and 0.02, respectively, it is
clear that AC_IND contributed the most to limiting and controlling NAS purchases
because it had the larger coefficient compared to audit committee activity.
For the control variable, IN_OWN is significant with the same predicted sign
indicating that companies with a high percentage of management ownership were less
likely to have a lower NAS ratio compared to these with a low percentage of
management ownership. The results on IN_OWN are consistent with those found by
Parkash and Venable (1993) and Firth (1997).
NAS_SP is significant with the same predicted sign indicating that there was a
positive association between NAS_SP and NAS ratio. In other words, companies with
a high specialist auditor were more likely to have a lower NAS ratio compared to
these with a low specialist auditor. The results on NAS_SP are consistent with those
found by Houghton and Ikin (2001).
The rest of the control variables are insignificant indicating that there were no
relationships between these variables and NAS ratio.
Table 7-11 shows that multicollinearity does not present a problem in the regression
because all the VIFs values are less than 4.
Table 7-11 shows that the White-corrected t-statistics equals 180 (0.60*300) and it is
larger than the critical value with P degree of freedom at 0.05 (P=100), which equals
approximately 124, indicating that heteroscedasticity is not a problem in this
regression.
Finally, the adjusted R square equals 0.27 indicating that this model explains 27% of
the variations in the dependent variable.
Chapter 7: Empirical Analysis Victoria University
200
7.4 Additional Test
When the ASX Corporate Governance Council (CGC) announced the principles of
best practices and recommendations to strengthen the corporate governance for the
ASX companies on 31 March 2003 (ASX CGC 2003), it was stated that while the
ASX Top 500 companies have to comply with the principle of best practices and
recommendations regarding audit committee by 1 January 2005, the rest of the ASX
companies are not required to apply such practices and recommendations; instead they
have to report any departure from such principles and recommendations.
However, the ASX CGC Implementation Review Group (IRG) recognized that the
additional costs of having an effective audit committee might be more than the
benefits of such committee especially for small firms (ASX CGC IRG 2004). As a
result, the IRG suggested while the ASX Top 500 are required to establish a formal
audit committee, only the ASX Top 300 need to establish an effective audit
committee that complies with all the recommendations of the ASX CGC (ASX CGC
IRG 2004).
Therefore, it is important to examine the impact of having different compliance
requirements on the regression analysis for the ASX Top 300 and ASX Non-Top 300
companies (two-sub samples).
7.4.1 Audit Quality
7.4.1.1 Audit Committee Effectiveness
Table 7.12 presents the results of the linear regression using AQ_Continuous as the
dependent variable and ACE as the only test variable for the ASXT and ASXNT
samples.
The overall models were significant for the ASXT and ASXNT samples with F-stats
of 7.04 and 18.55, respectively, indicating that at least one of the test variables is
significant.

Chapter 7: Empirical Analysis Victoria University
201
Table 7-12 The Results of the Linear Regression Using AQ_Continuous and ACE for the ASXT
and ASXNT
ASXT ASXNT Variable Name
Exp. Sign Coefficient t-stat Coefficient t-stat
Intercept -0.0063 -0.03 -0.1301 -1.84 ACE + 0.1521 4.03*** 0.1789 7.92***
OUTSIDER + -0.0967 -0.70 0.0129 0.24 IN_OWN - -0.3303 -1.74* -0.0646 -1.35
LEVERAGE + 0.0282 0.30 -0.0024 -0.13 NEW_FUND + -0.0319 -0.45 -0.0052 -0.20 SEG_NUM + -0.0137 -1.35 -0.0101 -1.22
ROA + -0.0105 -0.11 -0.0349 -1.25 SIZE + 0.0131 1.03 0.0126 3.51***
FOR_SALE + 0.1325 2.32** -0.0020 -0.06 Sample Size 100 200 Model F-stat 7.04 18.55 Adjusted R2 .41 .44
***, ** and * indicate that a variable is significant at 0.01, 0.05 and 0.10 respectively(2-tailed).
The variable of interest, ACE, is significant for both sub-samples indicating that there
was a positive association between ACE and the selection of a specialist auditor (H1
was supported). In other words, the ASX Top 300 and Non-Top 300 companies with
an effective audit committee were more likely to hire a specialist auditor compared to
these with an ineffective audit committee. The results on ACE for the two-sub
samples provided evidence that having different compliance requirements did not
influence the effectiveness of the audit committee in seeking the engagement of a
specialist auditor
For the control variables, IN_OWN and FOR_SALE were significant for the ASXT
sample with the same predicted signs indicating that the ASXT companies with a low
percentage of management ownership and a high percentage of foreign sales were
more likely to engage a specialist auditor compared to those with a high percentage of
management ownership and a low percentage of foreign sales.
On the other hand, SIZE was the only control variable that was significant for the
ASXNT sample with the same expected sign indicating that the ASXNT large

Chapter 7: Empirical Analysis Victoria University
202
companies were more likely to hire a specialist auditor compared to the ASXNT small
companies.
The rest of the control variables for the ASXT and ASXNT samples were
insignificant indicating that there were no relationships between these variables and
the selection of a specialist auditor. In other words, none of these variables was a
determinant of audit quality.
It is clear that the results of the control variables for the ASXT and ASXNT are
different. A possible explanation for such differences could be attributed to
insufficient variability in some of these variables. Another explanation could be
attributed to the differences in size of firms within the two-sub populations.
7.4.1.2 Audit Committee Characteristics
Table 7-13 presents the results of the linear regression using AQ_Continuous as the
dependent variable and ACCS as the test variables for the ASXT and ASXNT
samples.
The overall models were significant for the ASXT and ASXNT samples with F-stats
of 5.29 and 9.82, respectively, indicating that at least one test variable is significant.
The variable of interest, AC_IND, is significant for both sub-samples with the same
predicted sign indicating that there was a positive association between audit
committee independence and the selection of a specialist auditor (H2 was supported).
In other words, the ASX Top 300 and Non-Top 300 companies with an independent
audit committee were more likely to employ a specialist auditor compared to those
with a non-independent audit committee.
While the variable of interest, AC_ACT, is insignificant for the ASXT indicating that
the number of audit committee meetings was not a determinant of audit quality (H4
was not supported for the ASXT), the same variable is significant for the ASXNT
with the same expected sign indicating that the ASX Non-Top 300 companies with a
large number of audit committee meetings were more likely to utilize a specialist

Chapter 7: Empirical Analysis Victoria University
203
auditor compared to those with a small number of audit committee meetings (H4 was
supported for the ASXNT).
Table 7-13 The Results of the Linear Regression Using AQ_Continuous and ACCS for the ASXT
and ASXNT
ASXT ASXNT Variable Name
Exp. Sign Coefficient t-stat Coefficient t-stat
Intercept 0.1642 0.56 -0.3300 -2.92 AC_IND + 0.1712 4.07*** 0.0810 3.29** AC_SIZE + 0.0293 1.33 0.0202 1.55 AC_ACT + 0.0093 1.21 0.0175 2.68**
AC_CHAR + -0.1152 -0.96 0.0294 1.18 AC_EXP + -0.0808 -0.97 0.0041 0.13 AC_LIT + N/A N/A 0.0876 1.13
OUTSIDER + -0.1143 -0.82 0.0227 0.38 IN_OWN - -0.4483 -2.19** -0.0993 -1.94*
LEVERAGE + 0.0674 0.71 0.0021 0.10 NEW_FUND + -0.0097 -0.14 -0.0061 -0.21 BUS_SEG + -0.0152 -1.36 -0.0042 -0.49
ROA + 0.0559 0.55 -0.0318 -1.06 SIZE + 0.0048 0.37 0.0116 2.89**
FOR_SALE + 0.1639 2.86*** 0.0086 0.23 Model F-stat 5.29 9.82 Adjusted R2 .44 .38
***, ** and * indicate that a variable is significant at 0.01, 0.05 and 0.10 respectively(2-tailed).
A possible explanation for such difference between the two-sub samples could be that
the majority of the Top 300 companies (73%) had held more than 4 audit committee
meetings, which indicates the lack of variability in the number of audit committee
meetings.
The rest of the test variables (AC_SIZE, AC_CHAR, AC_EXP and AC_LIT) are
insignificant indicating that none of these variables was a determinant of audit quality
for both sub-samples (H3, H5, H6 and H7 were not supported). It should be noted that
the lack of significance in AC_CHAR, AC_EXP and AC_LIT could be explained by
inadequate variability in the sample data.

Chapter 7: Empirical Analysis Victoria University
204
As the coefficients of AC_IND and AC_ACT for the ASXNT sample are
approximately 0.08 and 0.02, respectively, it is clear that AC_IND contributed more
to limiting and controlling NAS purchases because it had the larger coefficient
compared to audit committee activity.
It is clear from the above discussion that having different compliance requirements
between the two-sub samples has very limited influence on the determinants of audit
quality among the six-different audit committee characteristics (ACCS) because the
results of the regression analysis for the two sub-sample are very much similar. While
audit committee independence was the only determinant of audit quality among
ACCS for the ASXT sample, both audit committee independence and activity were
determinants of audit quality for the ASXNT. However, audit committee
independence was the most important determinant of audit quality among ACCS for
both sub-samples.
For the control variable, while IN_OWN and FOR_SALE were the only determinants
of audit quality for the ASXT sample, IN_OWN and SIZE were the only determinant
of audit quality for the ASXNT sample.
Again such differences in the results of the control variables between the two-sub
samples could be explained by the differences in size of firms within these two-sub
samples or by the lack of variability in these variables.
7.4.2 NAS Purchases
7.4.2.1 Audit Committee Effectiveness
Table 7-14 presents the results of the linear regression using the NAS ratio as the
dependent variable and the ACE as the only test variable for the ASXT and ASXNT
samples.
The overall models were significant for the ASXT and ASXNT samples with F-stats
equal to 4.90 and 9.83, respectively, indicating that there is at least one test variable
that is significant.

Chapter 7: Empirical Analysis Victoria University
205
Table 7-14 The Results of the Linear Regression Using NAS Ratio and ACE for the ASXT and
ASXNT
ASXT ASXNT Variable Name
Exp. Sign Coefficient t-stat Coefficient t-stat
Intercept 0.46 1.80 0.34 3.09 ACE - -0.17 3.56*** -0.25 7.12***
OUTSIDER - -0.21 -1.22 0.05 0.63 IN_OWN + 0.20 0.87 0.14 1.92*
LEVERAGE - -0.06 -0.52 -0.02 -0.64 ROA + 0.02 0.19 -0.02 -0.47 SIZE + 0.00 0.20 0.01 1.48
SH_BLK - 0.01 0.71 -0.01 -0.76 NAS_SP + 0.34 3.36*** 0.08 0.97
Model F-stat 4.90 9.83 Adjusted R2 0.24 0.26
***, ** and * indicate that a variable is significant at 0.01, 0.05 and 0.10 respectively(2-tailed).
The variable of interest, ACE, was significant for both the ASXT and ASXNT
samples indicating that there was a positive association between the ACE and the
selection of a specialist auditor (H1 was supported). In other words, ACE was an
important determinant of NAS purchases. The results on ACE for the two-sub
samples provided evidence that having different compliance requirements did not
influence the effectiveness of the audit committee in controlling and limiting NAS
purchases.
While NAS_SP was the only control variable that was significant for the ASXT
sample with the same predicted signs indicating that the degree of NAS specialization
was an important determinant of NAS purchases, IN_OWN was the only control
variable that was significant for the ASXNT sample indicating that the ASXNT
companies with a high percentage of management ownership were more likely to
have a lower NAS ratio.
The rest of the control variables for the ASXT and ASXNT samples were
insignificant indicating that there were no relationships between these variables and

Chapter 7: Empirical Analysis Victoria University
206
the selection of a specialist auditor. In other words, none of these variables were
determinants of audit quality.
It is clear that the results of the control variables for the ASXT and ASXNT are
different. A possible explanation for such differences could be attributed to
insufficient variability in some of these variables. Another explanation could be
attributed to the differences in size of firms within the two-sub samples.
7.4.2.2 Audit Committee Characteristics
Table 7-15 presents the results of the linear regression using the NAS ratio as the
dependent variable and ACCS as the test variables for the ASXT and ASXNT
samples.
Table 7-15 The Results of the Linear Regression Using NAS ratio and ACCS for the ASXT and
ASXNT
ASXT ASXNT Variable Name
Exp. Sign Coefficient t-stat Coefficient t-stat
Intercept 0.33 0.89 0.46 2.78 AC_IND - -0.17 -3.05*** -0.06 -1.68* AC_SIZE - -0.02 -0.86 -0.01 -0.31 AC_ACT - 0.01 0.52 -0.05 5.13***
AC_CHAR - 0.09 0.57 0.01 0.19 AC_EXP - 0.09 0.88 0.03 0.63 AC_LIT - N/A N/A 0.01 0.09
OUTSIDER% - -0.23 -1.26 -0.04 -0.46 IN_OWN + 0.28 1.03 0.15 1.95*
LEVERAGE - -0.11 -0.92 -0.01 -0.46 ROA + -0.06 -0.44 -0.04 -0.82 SIZE + 0.00 0.32 0.01 1.40
SH_BLK - 0.02 1.45 0.00 -0.38 NAS_SP + 0.36 3.12*** 0.03 0.38
Model F-stat 2.97 5.16 Adjusted R2 0.19 0.21
***, ** and * indicate that a variable is significant at 0.01, 0.05 and 0.10 respectively(2-tailed).

Chapter 7: Empirical Analysis Victoria University
207
The overall models were significant for ASXT and ASXNT samples with F-stats
equal 2.97 and 5.16, respectively, indicating that there is at least one test variable that
is significant.
The variable of interest, AC_IND, is significant for the ASXT and ASXNT samples
with the same predicted sign indicating that there was a negative association between
audit committee independence and the magnitude of NAS purchases (H2 was
supported). In other words, audit committee independence was an important
determinant of NAS purchases for both sub-samples.
While the variable of interest, AC_ACT, is insignificant for the ASXT sample
indicating that the ASXT companies with a large number of audit committee meetings
were not more likely to have lower NAS ratio compared to those with a small number
of audit committee meetings, the same variable is significant for the ASXNT sample
indicating that the number of audit committee meetings was an important determinant
of NAS purchases.
Again, a possible explanation for such difference between the two-sub samples could
be that the majority of the Top 300 companies (73%) had held more than 4 audit
committee meetings, which indicates the lack of variability in the number of audit
committee meetings.
The variables of interest, AC_SIZE, AC_CHAR, AC_EXP and AC_LIT, are
insignificant for both samples indicating that there were no relationships between
these variables and the selection of a specialist auditor. In other words, these variables
were not determinants of audit quality.
Again, the insufficient variability in these variables could explain the lack of
significance for such variables. For example, the percentage of companies with at
least one expert for the ASXT and ASXNT samples were 96% and 89% respectively.
For the control variable, while FOR_SALE was the only determinant of audit quality
for the ASXT sample, IN_OWN was the only determinant of audit quality for the
ASXNT sample.

Chapter 7: Empirical Analysis Victoria University
208
Again such differences in the results of the control variables between the two-sub
samples could be explained by the differences in size of firms within these two-sub
samples or by the lack of variability in these variables.
7.5 Summary
In this chapter, univariate and multivariate analysis were presented and discussed. The
univariate analysis that has been discussed in this chapter included correlation and
equality of means analysis. Correlation analysis revealed multicollinearity did not
impose any threats for running the linear regressions for the SSM and ASX.
On the other hand, equality of means analysis provided very useful information
regarding the nature of the differences in means between two groups (occurred by
chance or not). This analysis revealed that all the variables that had equal means
between two groups, where the differences in means occurred only by chance, would
never be significant determinant of audit quality or NAS purchase when running the
regression analysis.
Multivariate analysis was divided into two parts. The first part presented the main
regression analysis that has been used to test the hypotheses of this study. The results
of the main regression analysis revealed that ACE was an important determinant of
audit quality and NAS purchases for the ASX sample. This provides evidence that the
ASX companies with effective audit committees take actions to ensure high quality
financial reports by selecting a specialist auditor and limiting NAS purchases that
might have a negative impact on auditor independence.
In addition, for the ASX sample, while audit committee independence, size and
activity were all determinants of audit quality, audit committee independence and
activity were determinants of the magnitude of NAS purchases. However, audit
committee independence was the most important determinant of both audit quality
and the magnitude of NAS purchases for the ASX sample.
On the other hand, the results of the regression analysis for the SSM sample indicated
that there was no association between audit committee effectiveness or any of the six-
different audit committee characteristics and the selection of a specialist auditor.

Chapter 7: Empirical Analysis Victoria University
209
The differences in results between the SSM and ASX samples could be attributed to
the differences in audit committee framework, the small Saudi sample or the
limitations associated with the Saudi collected data.
The second part of the multivariate analysis examined the impact of having different
compliance requirements for the ASX Top 300 and Non-Top 300 samples. The results
of this part indicated that the ASX Top 300 and Non-Top 300 companies with an
effective audit committee were more likely to hire a specialist auditor and to have
lower NAS ratio.
Finally, while audit committee independence was the only determinant of audit
quality and NAS purchases among ACCS for the ASXT sample, both audit committee
independence and activity were determinants of audit quality and NAS purchases
among ACCS for the ASXNT sample. The lack of significance in AC_ACT for the
ASXT sample could be explained by insufficient variability of this variable as most of
the ASX Top 300 companies had held more than 4 audit committee meetings a year.

Chapter 8: Sensistivity Tests Victoria University
210
CHAPTER 8: SENSISTIVITY TESTS
8.1 Introduction
In this chapter, a number of sensitivity tests will be discussed and performed to
examine the impact of changing a number of factors on the results of the main
regression analysis in Chapter 7.
These factors include sample specification, different periods of time to comply,
alternative proxies for audit quality, alternative methods for identifying auditor
specialization, omitting a variable, additional variables and alternative measures of
some of the control variables.
8.2 Reduced Samples
Firms that belong to the financial sector have special structures that might influence
the results of the main regression analysis (Abbott and Parker 2000). Therefore, firms
that belong to the financial sector were excluded from the SSM and ASX to ensure
that the results of the regression analysis in Chapter 7 were not driven by the special
structure of the firms within this sector.
For the SSM, banks were excluded to produce the reduced SSM sample. On the other
hand, the following four industries were excluded from the ASX sample to obtain the
reduced ASX sample.
1. Banks
2. Diversified Financials
3. Insurances
4. Real Estate Trusts
8.2.1 Audit Quality
8.2.1.1 Audit Committee Effectiveness
Table 8-1 presents the results of the linear regression using AQ_Continuous as the
dependent variable and ACE as the independent variable for the RSM and RASX.

Chapter 8: Sensistivity Tests Victoria University
211
Table 8-1 The Results of the Linear Regression Using AQ_Continuous and ACE for the RSM
and RASX
RSSM RASX Variable Name
Exp. Sign Coefficient t-stat Coefficient t-stat
Intercept -0.35 -1.77 -0.17 -2.34 ACE + -0.07 -0.97 0.16 7.51***
OUTSIDER + 0.81 2.86*** 0.00 -0.04 IN_OWN - N/A N/A -0.11 -2.09**
LEVERAGE + 0.36 1.92* -0.02 -0.87 NEW_FUND + -0.24 -0.83 0.01 0.47 BUS_SEG + 0.03 1.01 -0.01 -2.20**
ROA + -0.04 -0.11 -0.02 -0.79 SIZE + 0.00 -0.11 0.02 4.86***
FOR_SALE + -0.04 -0.05 0.05 1.46 Sample Size 40 254 Model F-stat 9.26*** 24.12*** Adjusted R2 0.63 0.45
***, ** and * indicate that a variable is significant at 0.01, 0.05 and 0.10 respectively(2-tailed).
Table 8-1 reveals that the results for the reduced samples are very similar to those for
the full samples indicating that the results of the regression analysis for the full
samples were not driven by the special structures associated with firms within the
financial sector.
8.2.1.2 Audit Committee Characteristics
Table 8-2 presents the results of the linear regression using AQ_Continuous as the
dependent variable and ACCS as the independent variable for the reduced SSM and
ASX samples.
Table 8-2 reveals that the results of the regression analysis for the reduced SSM
sample are very similar to those for the SSM sample indicating that the results of the
regression analysis for the SSM sample were not driven by the special structures
associated with firms within the bank sector.

Chapter 8: Sensistivity Tests Victoria University
212
Table 8-2 The Results of the Linear Regression Using AQ_Continuous and ACCS for the RSM
and RASX
RSSM RASX Variable Name
Exp. Sign Coefficient t-stat Coefficient t-stat
Intercept -0.60 -2.14 -0.34 -2.93 AC_IND + -0.12 -1.85* 0.10 4.36*** AC_SIZE + 0.03 0.40 0.02 1.88* AC_ACT + 0.04 1.59 0.01 1.60
AC_CHAR + -0.05 -0.84 0.03 1.11 AC_EXP + 0.13 1.48 -0.01 -0.33 AC_LIT + -0.04 -0.30 0.09 1.11
OUTSIDER + 0.76 2.58** -0.01 -0.22 IN_OWN - N/A N/A -0.15 -2.77***
LEVERAGE + 0.36 1.82* 0.00 -0.15 NEW_FUND + -0.24 -0.82 0.01 0.28 BUS_SEG + 0.04 1.37 -0.01 -1.35
ROA + 0.09 0.23 -0.02 -0.77 SIZE + 0.00 0.11 0.02 3.85***
FOR_SALE + -0.38 -0.52 0.06 1.84* Sample Size 40 254 Model F-stat 6.55*** 13.59*** Adjusted R2 0.65 0.41
***, ** and * indicate that a variable is significant at 0.01, 0.05 and 0.10 respectively(2-tailed).
On the other hand, with the exception of AC_ACT, which was insignificant for the
reduced ASX indicating that there was no association between AC_ACT and the
selection of a specialist auditor, the results of the regression analysis for the RASX
sample are very similar to those for the ASX sample indicating that the results of only
AC_ACT for the ASX were driven by the special structures associated with firms
within the financial sector.
In summary, with the exception of AC_ACT, the results of the reduced SSM and
ASX samples were very similar to the results of the SSM and ASX samples indicating
that the results of the main regression analysis for modelling audit quality were not
driven by the inclusion of firms within the financial sector.

Chapter 8: Sensistivity Tests Victoria University
213
8.2.2 NAS Purchases
8.2.2.1 Audit Committee Effectiveness
Table 8-3 presents the results of the linear regression using NAS ratio as the
dependent variable, ACE as the only independent variable for the reduced ASX
sample.
Table 8-3 The Results of the Linear Regression Using NAS ratio and ACE for the Reduced ASX
RASX Variable Name
Exp. Sign Coefficient t-stat
Intercept 0.41 4.15 ACE - -0.22 -7.43***
OUTSIDER - -0.06 -0.78 IN_OWN + 0.14 1.94*
LEVERAGE - -0.02 -0.59 ROA + -0.03 -0.72 SIZE + 0.01 1.21
SH_BLK + 0.00 -0.23 NAS_SP + 0.19 2.72***
Sample Size 254 Model F-stat 12.22*** Adjusted R2 0.29
***, ** and * indicate that a variable is significant at 0.01, 0.05 and 0.10 respectively(2-tailed).
Table 8-3 reveals that the results for the reduced ASX sample are very similar to those
for the ASX sample indicating that the results of the regression analysis for the ASX
sample were not driven by the special structures associated with firms within the
financial sector.
8.2.2.2 Audit Committee Characteristics
Table 8-4 presents the results of the linear regression using NAS ratio as the
dependent variable, ACCS as the independent variables and BOR_IND as a control
variable for the ASX sample.

Chapter 8: Sensistivity Tests Victoria University
214
Table 8-4 The Results of the Linear Regression Using NAS ratio and ACCS and for the Reduced
ASX
RASX Variable Name
Exp. Sign Coefficient t-stat
Intercept 0.48 2.98 AC_IND - -0.10 -3.15*** AC_SIZE - -0.01 -0.82 AC_ACT - -0.02 -3.09***
AC_CHAR - -0.01 -0.31 AC_EXP - 0.04 0.80 AC_LIT - 0.03 0.22
OUTSIDER - -0.10 -1.17 IN_OWN + 0.18 2.33**
LEVERAGE - -0.03 -0.97 ROA + -0.04 -0.91 SIZE + 0.01 1.03
SH_BLK + 0.00 0.15 NAS_SP + 0.17 2.29**
Sample Size 254 Model F-stat 5.30*** Adjusted R2 0.22
***, ** and * indicate that a variable is significant at 0.01, 0.05 and 0.10 respectively(2-tailed).
Table 8-4 shows that the results for the reduced ASX sample are very similar to those
for the ASX sample indicating that the results of the regression analysis for the ASX
sample were not driven by the special structures associated with firms within the
financial sector.
In summary, the results of the reduced ASX sample were very similar to the results of
the ASX sample indicating that the results of the main regression analysis for
modelling NAS purchases were not driven by the inclusion of firms within the
financial sector.
8.3 Different Periods of Time to Comply
The ASX CGC announced the principles of best practices and recommendations of
corporate governance on 31 March 2003 and required the ASX companies to report
the degree of compliance with such principles and recommendations. In addition, the

Chapter 8: Sensistivity Tests Victoria University
215
ASX sample includes companies with different financial year-end with most
companies having 30 June as the end of their financial year. Moreover, the test period
for the ASX sample was 2004 financial year and the reasons for selecting such test
period were discussed in detail in Chapter 5.
Therefore, while the ASX companies with 30 June as their financial year-end have
one year and three months to comply with the ASX recommendations, the ASX
companies with 31 December as their financial year-end have one year and nine
months to comply with such recommendations.
As a result, it is important to investigate the impact of having different times of
compliance on the regression analysis. This could be done by excluding all companies
with financial year-end other than 30 June from the ASX sample and then run the
regression analysis.
It should be noted that such problem does not exist in the SSM sample, as the SMC
recommendations were announced in 1994 and that all companies within the SSM
sample have 31 December as their financial year-end.
8.3.1 Audit quality
8.3.1.1 Audit Committee Effectiveness
Table 8-5 presents the results of the linear regression using AQ_Continuous as the
dependent variable, ACE as the only independent variable for the ASX June sample.
Table 8-5 reveals that the variable of interest, ACE, and four of the control variables,
namely, IN_OWN, BUS_SEG, SIZE and FOR_SALE were significant indicating that
the results remain robust when companies, which have financial year end other than
30 June, were excluded.

Chapter 8: Sensistivity Tests Victoria University
216
Table 8-5 The Results of the Linear Regression Using AQ_Continuous, ACE, for the ASX June
ASX Variable Name
Exp. Sign Coefficient t-stat
Intercept -0.15 -2.10 ACE - 0.17 8.29***
OUTSIDER - 0.03 0.49 IN_OWN + -0.11 -2.30**
LEVERAGE - -0.01 -0.31 NEW_FUND + 0.00 -0.03 BUS_SEG + -0.01 -1.70*
ROA - + -0.02 -0.66 SIZE + 0.01 4.03***
FOR_SALE - 0.09 2.23** Sample Size 238 Model F-stat 26.13*** Adjusted R2 0.49
***, ** and * indicate that a variable is significant at 0.01, 0.05 and 0.10 respectively(2-tailed).
8.3.1.2 Audit Committee Characteristics
Table 8-6 presents the results of the linear regression using AQ_Continuous as the
dependent variable and ACCS as the independent variables for the ASX June sample.
Table 8-6 reveals that three independent variables, namely, AC_IND, AC_SIZE and
AC_ACT and four of the control variables, namely, IN_OWN, BUS_SEG, SIZE and
FOR_SALE were all significant indicating that the results remain robust when
including only companies with 30 June as the end of their financial year

Chapter 8: Sensistivity Tests Victoria University
217
Table 8-6 The Results of the Linear Regression Using AQ_Continuous and ACCS for the ASX
June
ASX Variable Name
Exp. Sign Coefficient t-stat
Intercept -0.36 -3.26 AC_IND + 0.09 4.30*** AC_SIZE + 0.03 2.89*** AC_ACT + 0.01 2.11**
AC_CHAR + 0.03 1.31 AC_EXP + 0.02 0.62 AC_LIT + 0.10 1.34
OUTSIDER + 0.02 0.34 IN_OWN - -0.15 -2.98***
LEVERAGE + 0.00 0.00 NEW_FUND + 0.00 -0.12 BUS_SEG + -0.01 -1.28
ROA + -0.02 -0.53 SIZE + 0.01 2.85***
FOR_SALE + 0.09 2.25** Sample Size 238 Model F-stat 15.32*** Adjusted R2 0.46
***, ** and * indicate that a variable is significant at 0.01, 0.05 and 0.10 respectively(2-tailed).
8.3.2 NAS Purchases
8.3.2.1 Audit Committee Effectiveness
Table 8-7 presents the results of the linear regression using NAS ratio as the
dependent variable, ACE as the only independent variable for the ASX June sample.
Table 8-7 reveals that the variable of interest, ACE, and two of the control variables,
namely, IN_OWN and NAS_SP were significant indicating that the results remain
robust when companies, which have financial year end other than 30 June, were
excluded.

Chapter 8: Sensistivity Tests Victoria University
218
Table 8-7 The Results of the Linear Regression Using NAS ratio and ACE for the ASX June
ASX Variable Name
Exp. Sign Coefficient t-stat
Intercept 0.43 4.52 ACE - -0.23 -7.57***
OUTSIDER - 0.00 -0.03 IN_OWN + 0.16 2.34**
LEVERAGE - -0.02 -0.60 ROA + -0.03 -0.79 SIZE + 0.00 0.35
SH_BLK + 0.00 -0.71 NAS_SP + 0.19 2.71***
Sample Size 238 Model F-stat 12.56*** Adjusted R2 0.28
***, ** and * indicate that a variable is significant at 0.01, 0.05 and 0.10 respectively (2-tailed).
8.3.2.2 Audit Committee Characteristics
Table 8-8 presents the results of the linear regression using NAS ratio as the
dependent variable, ACCS as the independent variables and BOR_IND as a control
variable for the June ASX sample.
Table 8-8 reveals that AC_IND, AC_ACT, IN_OWN and NAS_SP were all
significant indicating that the results remain robust when including only companies
with 30 June as the end of their financial year.
In summary, the differences in the periods of time to comply have no impact on the
results of the regression analysis; as such results remain robust regardless of the
inclusion or exclusion of companies that have other than 30 June as the end of their
financial year.

Chapter 8: Sensistivity Tests Victoria University
219
Table 8-8 The Results of the Linear Regression Using NAS ratio and ACCS and for the ASX
June
ASX Variable Name
Exp. Sign Coefficient t-stat
Intercept 0.47 3.01 AC_IND - -0.10 -3.12*** AC_SIZE - -0.01 -0.39 AC_ACT - -0.03 -3.42***
AC_CHAR - -0.01 -0.27 AC_EXP - 0.02 0.40 AC_LIT - 0.04 0.35
OUTSIDER - -0.06 -0.66 IN_OWN + 0.20 2.71***
LEVERAGE - -0.02 -0.78 ROA + -0.05 -1.23 SIZE + 0.00 0.55
SH_BLK + 0.00 -0.39 NAS_SP + 0.15 2.04**
Sample Size 238 Model F-stat 5.45*** Adjusted R2 0.20
***, ** and * indicate that a variable is significant at 0.01, 0.05 and 0.10 respectively(2-tailed).
8.4 Alternative Proxy for Audit Quality
Despite the fact that the use of auditor size as a proxy for audit quality has been
critiqued following the collapse of Enron, audit quality literature continues to use such
proxy with caution (Watkins et al. 2004). Therefore, it is important to investigate the
impact of using such proxy on the results of the main regression analysis. As the
dependent variable using auditor size is a dummy variable then the logistic regression
must be used to model audit quality.
8.4.1 Audit Committee Effectiveness
Table 8-9 presents the results of the logistic regressions using audit size as the
dependent variable and the ACE as the only independent variable for the SSM and
ASX sample.

Chapter 8: Sensistivity Tests Victoria University
220
Table 8-9 The Results of the Logistic Regression Using Auditor Size for the SSM and ASX
SSM ASX Variable Name
Exp. Sign Coefficient Wald X2 Coefficient Wald X2
Intercept -1266.62 0.00 -7.23 16.27 ACE + 363.65 0.00 2.23 22.66***
OUTSIDER + 2072.77 0.00 2.07 3.69* IN_OWN - N/A N/A -2.53 6.91***
LEVERAGE + -38.24 0.00 -0.66 1.30 NEW_FUND + -414.38 0.00 -0.70 1.42 BUS_SEG + -67.51 0.00 -0.14 0.86
ROA + -1892.52 0.00 -0.53 0.92 SIZE + 18.39 0.00 0.38 15.03***
FOR_SALE + -404.19 0.00 1.63 3.41* Sample Size 44 300
Chi-square statistic 60.18 176.22 Cox-Snell R square 0.75 0.44
***, ** and * indicate that a variable is significant at 0.01, 0.05 and 0.10 respectively(2-tailed).
For the SSM sample, while OUTSIDER and LEVERAGE were the only test variables
that had positive relationships with the selection of a high quality auditor using
AQ_Continuous method as a proxy of audit quality, none of the test variables was a
determinant of audit quality using auditor size.
On the other hand, the results for the ASX sample were very much the same
regardless of which proxy has been used indicating that ASX companies with an
effective audit committee were more likely to hire a high quality auditor (a specialist
or a Big 4 auditor).
8.4.2 Audit Committee Characteristics
Table 8-10 presents the results of the logistic regressions using audit size as the
dependent variable and the ACCS as the independent variables for the SSM and ASX
sample.
For the SSM sample, with the exception of OUTSIDER and LEVERAGE, the results
for the rest of the test variables remained robust regardless of which proxy has been
used.

Chapter 8: Sensistivity Tests Victoria University
221
Table 8-10 The Results of the Logistic Regression Using Auditor Size and ACCS for the SSM and
ASX
SSM ASX Variable Name
Exp. Sign Coefficient Wald X2 Coefficient Wald X2
Intercept -119.82 0.00 -28.17 0.00 AC_IND + 80.11 0.00 1.81 19.47*** AC_SIZE + -40.49 0.00 0.19 0.51 AC_ACT + -9.87 0.00 0.11 0.72
AC_CHAR + 4.43 0.00 0.57 1.39 AC_EXP + 14.21 0.00 -0.52 0.80 AC_LIT + -56.08 0.00 20.55 0.00
OUTSIDER + 450.74 0.00 1.75 2.25 IN_OWN - N/A N/A -3.19 9.89***
LEVERAGE + -71.91 0.00 -0.24 0.19 NEW_FUND + -9.22 0.00 -0.84 1.65 BUS_SEG + -8.28 0.00 -0.03 0.03
ROA + -245.16 0.00 -0.61 0.89 SIZE + 4.94 0.00 0.34 10.24***
FOR_SALE + 95.36 0.00 1.47 2.838 Sample Size 44 300
Chi-square statistic 60.63 187.55 Cox-Snell R square 0.75 0.47
***, ** and * indicate that a variable is significant at 0.01, 0.05 and 0.10 respectively(2-tailed).
On the other hand, while AC_IND, AC_SIZE and AC_ACT were all determinants of
audit quality using AQ_Continuous method, AC_ IND was the only determinant of
audit quality using auditor size. However, AC_IND was still the most important
determinant of audit quality regardless of which proxy has been used.
8.5 Alternative Methods for Identifying Specialist Auditors
The arbitrary selection of a cut-off point is the most important disadvantage
associated with the use of AQ_Craswell and AQ_Palmrose methods as proxies for
audit quality. Therefore, it is necessary to examine the influence of using different
specialization methods and different cut-off points on the main regression analysis in
Chapter 7.

Chapter 8: Sensistivity Tests Victoria University
222
8.5.1 AQ_Craswell
The results of using the 10%, 20% and 30% cut-off points under AQ_Craswell
method will be presented in this part.
8.5.1.1 Audit Committee Effectiveness
Table 8-11 presents the results of the logistic regression using AQ_Craswell 10%,
20% and 30% as the dependent variable and ACE as the independent variable for the
SSM.
Table 8-11 The Results of the Logistic Regression Using AQ_Craswell (10%, 20% and 30%) and
ACE for the SSM
10% 20% 30% Variable Name
Exp. Sign Coefficient Wald X2 Coefficient Wald X2 Coefficient Wald X2
Intercept -579.15 0.00 -10.96 2.83 -14.88 1.56 ACE + -42.30 0.00 -2.44 1.43 -1.13 0.29
OUTSIDER + 278.84 0.00 12.14 2.34 10.82 1.53 LEVERAGE + -19.55 0.00 4.00 1.11 7.90 2.34 NEW_FUND + -533.64 0.00 -43.76 2.02 -38.11 1.22 BUS_SEG + 48.04 0.00 1.46 2.56 1.87 1.41
ROA + 193.17 0.00 7.55 0.70 1.51 0.01 SIZE + 14.84 0.00 -0.17 0.33 -0.18 0.21
FOR_SALE + 38.60 0.00 23.80 2.88* 23.83 3.08* Sample Size 254 44 44 Chi-square 60.91 37.60 33.96 Cox-Snell R 0.75 0.0.58 0.54
***, ** and * indicate that a variable is significant at 0.01, 0.05 and 0.10 respectively(2-tailed).
Table 8-11 reveals that with the exception of FOR_SALE, which was the only
independent variable that was significant using AQ_Craswell (20% and 30%), the use
of different cut-off points under AQ_Craswell method generated similar results for the
rest of the independent variables.
Table 8-12 presents the results of the logistic regression using AQ_Craswell 10%,
20% and 30% as the dependent variable and ACE as the independent variable for the
ASX.

Chapter 8: Sensistivity Tests Victoria University
223
Table 8-12 The Results of the Logistic Regression Using AQ_Craswell (10%, 20% and 30%) and
ACE for the ASX
10% 20% 30% Variable Name
Exp. Sign Coefficient Wald X2 Coefficient Wald X2 Coefficient Wald X2
Intercept -12.44 24.45 -9.57 21.94 -9.13 23.67 ACE + 3.07 33.63*** 2.44 32.14*** 2.31 19.12***
OUTSIDER + 3.46 8.40*** -0.73 0.34 1.61 2.71* IN_OWN - -2.62 5.53** -2.74 4.64* -1.44 1.21
LEVERAGE + 0.19 0.08 -0.45 0.44 -0.71 0.98 NEW_FUND + -0.81 0.82 0.11 0.02 0.73 0.99 BUS_SEG + -0.15 0.68 -0.32 5.86*** -0.35 7.35***
ROA + -0.49 0.33 -1.13 2.51 -1.06 1.81 SIZE + 0.59 17.40*** 0.51 22.21*** 0.36 10.87***
FOR_SALE + 1.29 1.95 -0.50 0.57 0.45 0.52 Sample Size 300 300 300 Chi-square 269.18 173.88 112.20 Cox-Snell R 0.59 0.44 0.31
***, ** and * indicate that a variable is significant at 0.01, 0.05 and 0.10 respectively(2-tailed).
Table 8-12 reveals that despite the fact that the use of different cut-off points under
AQ_Craswell method generated similar results for ACE, such use has produced
mixed results for OUTSIDER, IN_OWN and BUS_SEG. For example, OUTSIDER
was only significant when using the 10% and 30% cut-off points.
8.5.1.2 Audit Committee Characteristics
Table 8-13 presents the results of the logistic regression using AQ_Craswell 10%,
20% and 30% as the dependent variable and ACCS as the independent variables for
the SSM.
Table 8-13 indicates that the use of different cut-off points under AQ_Craswell
method generated similar results, as none of the independent variables was significant.

Chapter 8: Sensistivity Tests Victoria University
224
Table 8-13 The Results of the Logistic Regression Using AQ_Craswell (10%, 20% and 30%) and
ACCS for the SSM
10% 20% 30% Variable Name
Exp. Sign Coefficient Wald X2 Coefficient Wald X2 Coefficient Wald X2
Intercept -288.34 0.00 -611.11 0.00 -5232.33 0.00 AC_IND + -29.44 0.00 -519.02 0.00 -410.25 0.00 AC_SIZE + 20.69 0.00 53.65 0.00 417.39 0.00 AC_ACT + 2.19 0.00 123.35 0.00 153.01 0.00
AC_CHAR + 20.48 0.00 -39.02 0.00 -38.86 0.00 AC_EXP + -13.36 0.00 -48.58 0.00 -286.00 0.00 AC_LIT + 17.57 0.00 26.43 0.00 37.62 0.00
OUTSIDER + 169.36 0.00 371.22 0.00 2572.62 0.00 LEVERAGE + -12.82 0.00 213.77 0.00 16.98 0.00 NEW_FUND + -240.42 0.00 -564.11 0.00 1918.24 0.00 BUS_SEG + 19.77 0.00 161.22 0.00 -15.12 0.00
ROA + 158.54 0.00 1326.51 0.00 1783.44 0.00 SIZE + 3.38 0.00 -29.89 0.00 102.74 0.00
FOR_SALE + -98.00 0.00 492.67 0.00 -1728.89 0.00 Sample Size 44 44 44 Chi-square 60.91 60.18 51.56 Cox-Snell R 0.75 0.75 0.69
***, ** and * indicate that a variable is significant at 0.01, 0.05 and 0.10 respectively(2-tailed).
Table 8-14 presents the results of the logistic regression using AQ_Craswell 10%,
20% and 30% as the dependent variable and ACCS as the independent variables for
the ASX.
Table 8-14 shows that the use of different cut-off points under AQ_Craswell method
has produced mixed results for some of the independent variables.
For example, while AC_ACT was significant when using the 10% cut-off points, such
variable was insignificant with the use of the 20% and 30% cut-off points.

Chapter 8: Sensistivity Tests Victoria University
225
Table 8-14 The Results of the Logistic Regression Using AQ_Craswell (10%, 20% and 30% and
ACCS for the ASX
10% 20% 30% Variable Name
Exp. Sign Coefficient Wald X2 Coefficient Wald X2 Coefficient Wald X2
Intercept -32.0056 0.00 -31.36 0.00 -28.93 0.00 AC_IND + 2.0792 17.48*** 1.86 11.55*** 2.43 8.48*** AC_SIZE + 0.1938 0.43 0.67 5.98*** 0.62 4.83** AC_ACT + 0.3960 7.66*** 0.13 1.73 0.12 1.48
AC_CHAR + 1.0322 1.86 1.51 1.81 0.31 0.07 AC_EXP + 0.5567 0.41 0.57 0.24 -0.63 0.29 AC_LIT + 19.5582 0.00 19.09 0.00 18.26 0.00
OUTSIDER + -0.1723 0.02 -1.29 0.99 1.43 2.01 IN_OWN - -3.3154 8.46*** -3.23 5.97*** -2.01 2.20
LEVERAGE + 0.5534 1.01 0.22 0.12 -0.27 0.15 NEW_FUND + -0.6352 0.58 -0.11 0.02 0.65 0.75 BUS_SEG + 0.0321 0.03 -0.27 4.10** -0.35 6.95***
ROA + -0.1010 0.01 -1.14 2.13 -0.88 1.03 SIZE + 0.4643 12.98*** 0.42 14.97*** 0.30 7.89***
FOR_SALE + 1.0074 1.32 -0.31 0.24 0.70 1.30 Sample Size 300 300 300 Chi-square 246.42 162.90 112.88 Cox-Snell R 0.56 0.42 0.31
***, ** and * indicate that a variable is significant at 0.01, 0.05 and 0.10 respectively(2-tailed).
8.5.2 AQ_Palmrose
The results of using the 5%, 15% and 25% cut-off points under AQ_Palmrose method
will be presented in this part.
8.5.2.1 Audit Committee Effectiveness
Table 8-15 presents the results of the logistic regression using AQ_Palmrose 5%, 15%
and 25% as the dependent variable and ACE as the independent variable for the SSM.
Table 8-15 reveals that LEVERAGE and NEW_FUND were the only independent
variables that were affected by the use of different cut-off points under AQ_Palmrose
method.

Chapter 8: Sensistivity Tests Victoria University
226
Table 8-15 The Results of the Logistic Regression Using AQ_Palmrose (10%, 15% and 25%) and
ACE for the SSM
5% 15% 30% Variable Name
Exp. Sign Coefficient Wald X2 Coefficient Wald X2 Coefficient Wald X2
Intercept -29.55 4.93 -18.92 3.46 -27.15 1.83 ACF + -2.20 1.01 -1.73 0.72 -2.54 0.26
OUTSIDER + 29.14 5.07** 16.55 3.71** 18.03 3.28* LEVERAGE + -0.95 0.06 1.08 0.10 5.01 0.90 NEW_FUND + -5.41 0.15 -34.32 2.44 -92.76 3.74* BUS_SEG + 0.23 0.09 1.07 2.02 3.88 3.85*
ROA + -3.64 0.12 7.94 0.62 21.71 1.97 SIZE + 0.73 2.21 0.32 0.66 0.17 0.06
FOR_SALE + -3.27 0.02 1.01 0.00 5.48 0.07 Sample Size 44 44 44 Chi-square 35.15 36.42 46.65 Cox-Snell R 0.55 0.56 0.66
***, ** and * indicate that a variable is significant at 0.01, 0.05 and 0.10 respectively(2-tailed).
Table 8-16 presents the results of the logistic regression using AQ_Palmrose 5%, 15%
and 25% as the dependent variable and ACE as the independent variable for the ASX.
Table 8-16 The Results of the Logistic Regression Using AQ_Palmrose (5%, 15% and 25%) and
ACE for the ASX
5% 15% 30% Variable Name
Exp. Sign Coefficient Wald X2 Coefficient Wald X2 Coefficient Wald X2
Intercept -3.26 5.54 -7.75 15.85 -9.37 25.05 ACF + 2.45 16.08*** 2.20 22.74*** 1.95 23.34***
OUTSIDER + -0.30 0.13 5.08 19.12*** 3.06 9.86*** IN_OWN - -2.13 5.46** -2.96 7.87*** -1.25 1.70
LEVERAGE + 0.28 0.49 -0.07 0.01 0.02 0.00 NEW_FUND + -1.06 3.87** -0.95 1.56 -0.95 1.62 BUS_SEG + -0.04 0.06 -0.33 3.51* -0.42 7.55***
ROA + 0.29 0.29 0.56 0.46 -0.41 0.28 SIZE + 0.26 9.02*** 0.33 8.29*** 0.44 16.19***
FOR_SALE + 0.62 0.48 2.07 5.23** 1.21 2.61 Sample Size 300 300 300 Chi-square 133.85 237.86 200.76 Cox-Snell R 0.36 0.55 0.49
***, ** and * indicate that a variable is significant at 0.01, 0.05 and 0.10 respectively (2-tailed).

Chapter 8: Sensistivity Tests Victoria University
227
Table 8-16 indicates that the use of different cut-off points under AQ_Palmose
method has produced different results for some of the control variables.
OUTSIDER, IN_OWN, BUS_SEG, SIZE and FOR_SALE were all the control
variables that were affected by the use of different cut-off points.
8.5.2.2 Audit Committee Characteristics
Table 8-17 presents the results of the logistic regression using AQ_Palmrose 5%, 15%
and 25% as the dependent variable and ACCS as the independent variables for the
SSM.
Table 8-17 The Results of the Logistic Regression Using AQ_Palmrose (5%, 15% and 25%) and
ACCS for the SSM
5% 15% 25% Variable Name
Exp. Sign Coefficient Wald X2 Coefficient Wald X2 Coefficient Wald X2
Intercept -443.68 0.00 -1260.31 0.00 -437.02 0.00 AC_IND + 28.90 0.00 -122.74 0.00 -48.85 0.00 AC_SIZE + -16.94 0.00 -103.70 0.00 -6.82 0.00 AC_ACT + 14.68 0.00 118.90 0.00 43.98 0.00
AC_CHAR + 28.50 0.00 56.28 0.00 43.75 0.00 AC_EXP + -77.70 0.00 -74.83 0.00 -18.30 0.00 AC_LIT + -83.36 0.00 181.25 0.00 69.98 0.00
OUTSIDER + 277.77 0.00 405.85 0.00 69.91 0.00 LEVERAGE + -0.97 0.00 519.69 0.00 351.06 0.00 NEW_FUND + 16.86 0.00 -3580.15 0.00 -2095.60 0.00 BUS_SEG + 23.33 0.00 174.02 0.00 94.58 0.00
ROA + 71.39 0.00 1812.13 0.00 899.93 0.00 SIZE + 20.21 0.00 14.52 0.00 -6.91 0.00
FOR_SALE + -408.11 0.00 -2153.86 0.00 -715.18 0.00 Sample Size 44 44 44 Chi-square 55.04 60.63 60.91 Cox-Snell R 0.71 0.75 0.75
***, ** and * indicate that a variable is significant at 0.01, 0.05 and 0.10 respectively(2-tailed).
Table 8-17 reveals that the use of different cut-off points under AQ_Palmrose method
generated similar results, as all the independent variables were not significant
regardless of which cut-off point would be used.

Chapter 8: Sensistivity Tests Victoria University
228
Table 8-18 presents the results of the logistic regression using AQ_Palmrose 5%, 15%
and 25% as the dependent variable and ACCS as the independent variables for the
ASX.
Table 8-18 The Results of the Logistic Regression Using AQ_Palmrose (5%, 15% and 25%) and
ACCS for the ASX
5% 15% 25% Variable Name
Exp. Sign Coefficient Wald X2 Coefficient Wald X2 Coefficient Wald X2
Intercept -5.02 5.03 -28.81 0.00 -30.13 0.00 AC_IND + 1.11 5.76** 0.99 4.31** 0.81 3.04* AC_SIZE + 0.12 0.23 0.22 0.61 0.30 1.39 AC_ACT + 0.30 4.77** 0.36 7.40*** 0.24 4.78**
AC_CHAR + 0.63 2.00 2.34 4.64** 1.23 2.13 AC_EXP + -0.11 0.04 -0.10 0.02 0.74 0.69 AC_LIT + 1.02 0.42 18.88 0.00 18.88 0.00
OUTSIDER + -1.05 1.07 4.76 13.95*** 2.99 8.35*** IN_OWN - -2.50 7.65*** -3.03 7.81*** -1.42 2.11
LEVERAGE + 0.45 1.29 0.24 0.15 0.40 0.57 NEW_FUND + -1.00 3.21* -1.02 1.68 -1.14 2.34 BUS_SEG + 0.02 0.01 -0.21 1.58 -0.31 4.80**
ROA + 0.35 0.38 0.52 0.30 -0.40 0.23 SIZE + 0.22 6.26*** 0.23 3.98** 0.35 10.71***
FOR_SALE + 0.47 0.28 1.90 3.90** 1.08 2.22 Sample Size 300 300 300 Chi-square 128.89 224.90 197.85 Cox-Snell R 0.35 0.56 0.48
***, ** and * indicate that a variable is significant at 0.01, 0.05 and 0.10 respectively(2-tailed).
Table 8-18 shows that the use of different cut-off points under AQ_Palmrose method
has produced mixed results for some test and control variables. For example, while
AC_CHAR was significant when using the 15% cut-off point, such variable was not
significant with the use of the 5% and 25% cut-off points.
In summary, the use different cut-off points under AQ_Craswell and AQ_Palmrose
methods has produced different results for some of the independent variables. This
provides support for the researcher’s decision to use AQ_Continuous method in
identifying specialist auditors in the main analysis as it was clear that different cut-off
points have produced different results, which might lead to misleading conclusions.

Chapter 8: Sensistivity Tests Victoria University
229
8.6 Alternative Measure for the Composition of the Board
In this study, although the percentage of non-executive directors on the board was
used to control for the composition of the board, it is argued that the percentage of
independent directors on the board will have more influence on the auditor selection
process and NAS purchases than the percentage of outside directors.
This argument was supported by Abbott et al (2003), who classified outside directors
into independent and grey directors. He argued that grey directors are less likely to
resist management pressures to act in its own interest instead of the shareholders
interest than the independent directors.
In addition, the ASX CGC recognized the importance of independent directors on the
board in strengthening the corporate governance in the ASX companies and
recommended that at least the majority of the board of directors should be
independent.
It should be noted that the decision to use the percentage of non-executive directors in
the main analysis was made because such percentage was used more frequently in the
literature and because data that are required to identify independent directors for
Saudi listed companies were not publicly available.
The results of the regression analysis in Chapter 7 indicated that the percentage of
non-executive directors was not a determinant of audit quality (using
AQ_Continuous) or NAS purchases. Therefore, it is important to examine the impact
of using the percentage of independent directors on the board (BOR_IND) on both
audit quality and NAS purchases.
8.6.1 Audit quality
8.6.1.1 Audit Committee Effectiveness
Table 8-19 presents the results of the linear regression using AQ_Continuous as the
dependent variable, ACE as the only independent variable and BOR_IND as a control
variable for the ASX sample.

Chapter 8: Sensistivity Tests Victoria University
230
Table 8-19 The Results of the Linear Regression Using AQ_Continuous, ACE, and BOR_IND for
the ASX
ASX Variable Name
Exp. Sign Coefficient t-stat
Intercept -0.18 -3.39 ACE + 0.14 6.91***
BOR_IND + 0.11 2.89*** IN_OWN - -0.11 -2.49***
LEVERAGE + 0.00 -0.07 NEW_FUND + 0.00 -0.17 BUS_SEG + -0.01 -1.88*
ROA + -0.03 -1.06 SIZE + 0.01 4.46***
FOR_SALE + 0.05 1.64* Sample Size 300 Model F-stat 30.90*** Adjusted R2 0.50
***, ** and * indicate that a variable is significant at 0.01, 0.05 and 0.10 respectively(2-tailed).
Table 8-19 reveals that BOR_IND is significant at 0.01 with the same predicted sign
indicating that there is a positive association between the percentage of independent
directors on the board and the selection of a specialist auditor. In other words, the
ASX companies with a high percentage of independent directors on the board were
more likely to hire a specialist auditor compared to these with a low percentage of
independent directors on the board.
However, the results of the variable of interest, ACE, and the rest of the control
variables remained the same as those when the percentage of non-executive directors
on the board has been used.
8.6.1.2 Audit Committee Characteristics
Table 8-20 presents the results of the linear regression using AQ_Continuous as the
dependent variable, ACCS as the independent variables and BOR_IND as a control
variable for the ASX sample.

Chapter 8: Sensistivity Tests Victoria University
231
Table 8-20 The Results of the Linear Regression Using AQ_Continuous, ACCS and BOR_IND
for the ASX
ASX Variable Name
Exp. Sign Coefficient t-stat
Intercept -0.33 -3.18 AC_IND + 0.08 3.58*** AC_SIZE + 0.02 1.88* AC_ACT + 0.01 2.36**
AC_CHAR + 0.02 0.74 AC_EXP + -0.01 -0.18 AC_LIT + 0.08 0.97
BOR_IND + 0.10 2.28** IN_OWN - -0.14 -3.12***
LEVERAGE + 0.01 0.28 NEW_FUND + 0.00 -0.15 BUS_SEG + -0.01 -1.58
ROA + -0.03 -0.88 SIZE + 0.01 3.75***
FOR_SALE + 0.06 1.96** Sample Size 300 Model F-stat 19.46*** Adjusted R2 0.49
***, ** and * indicate that a variable is significant at 0.01, 0.05 and 0.10 respectively(2-tailed).
Table 8-20 reveals that BOR_IND is significant at 0.05 with the same predicted sign
indicating that there is a positive association between the percentage of independent
directors on the board and the selection of a specialist auditor. In other words, the
ASX companies with a high percentage of independent directors on the board were
more likely to hire a specialist auditor compared to these with a low percentage of
independent directors on the board.
However, the results of the independent variables and the rest of the control variables
remained the same as those when the percentage of non-executive directors on the
board has been used.
In summary, the use of the percentage of independent directors indicates that the
composition of the board of directors is an important determinant of audit quality.
This is consistent with Abbott et al (2003) who argued that grey directors are less

Chapter 8: Sensistivity Tests Victoria University
232
likely to resist management pressures to act in its own interest instead of the
shareholders interest than the independent directors.
8.6.2 NAS Purchases
8.6.2.1 Audit Committee Effectiveness
Table 8-21 presents the results of the linear regression using NAS ratio as the
dependent variable, ACE as the only independent variable and BOR_IND as a control
variable for the ASX sample.
Table 8-21 The Results of the Linear Regression Using NAS ratio, ACE, and BOR_IND for the
ASX
ASX Variable Name
Exp. Sign Coefficient t-stat
Intercept 0.39 5.01 ACE - -0.23 -8.46***
BOR_IND - 0.04 0.93 IN_OWN + 0.16 2.56***
LEVERAGE - -0.02 -0.66 ROA + -0.02 -0.53 SIZE + 0.00 0.73
SH_BLK + 0.00 -0.46 NAS_SP + 0.17 2.63***
Sample Size 300 Model F-stat 14.89*** Adjusted R2 0.27
***, ** and * indicate that a variable is significant at 0.01, 0.05 and 0.10 respectively(2-tailed).
Table 8-21 reveals that the results of the variable of interest, ACE, and the control
variables remained the same as those when the percentage of non-executive directors
on the board has been used.
8.6.2.2 Audit Committee Characteristics
Table 8-22 presents the results of the linear regression using NAS ratio as the
dependent variable, ACCS as the independent variables and BOR_IND as a control
variable for the ASX sample.

Chapter 8: Sensistivity Tests Victoria University
233
Table 8-22 The Results of the Linear Regression Using NAS ratio, ACCS and BOR_IND for the
ASX
ASX Variable Name
Exp. Sign Coefficient t-stat
Intercept 0.43 2.85 AC_IND - -0.11 -3.75*** AC_SIZE - -0.02 -1.15 AC_ACT - -0.02 -3.49***
AC_CHAR - -0.01 -0.36 AC_EXP - 0.05 1.22 AC_LIT - 0.01 0.13
BOR_IND - 0.04 0.95 IN_OWN + 0.21 3.24***
LEVERAGE - -0.03 -0.99 ROA + -0.04 -0.85 SIZE + 0.00 0.73
SH_BLK + 0.00 0.00 NAS_SP + 0.15 2.22**
Sample Size 300 Model F-stat 6.54*** Adjusted R2 0.19
***, ** and * indicate that a variable is significant at 0.01, 0.05 and 0.10 respectively(2-tailed).
Table 8-22 indicates that the results of the independent (ACCS) and control variables
remained robust regardless of the measure that has been used for board composition.
In summary, the composition of the board of directors was not a determinant of NAS
purchases regardless of the percentage that has been used to measure the board
composition. This indicates that the board of directors does not play any role in
limiting NAS purchases, which might be evidence that such boards rely on the audit
committee in controlling NAS purchases.
8.7 Omitting A Control Variable (IN_OWN)
Data on management ownership were not publicly available for the SSM sample and,
as a result, the regression analysis to model audit quality was conducted without the
inclusion of IN_OWN as a control variable.

Chapter 8: Sensistivity Tests Victoria University
234
Hypothesis-testing procedures are likely to provide misleading conclusions about the
statistical significance of the estimated coefficients if any important independent or
control variable is omitted from the regression (Gujarati 1995). Therefore, it is
important to conduct the regression analysis to model audit quality without IN_OWN
as a control variable on the ASX sample to ensure that omitting such variable does not
influence the results of the regression analysis to model audit quality for the SSM
sample.
8.7.1 Audit Committee Effectiveness
Table 8-23 presents the results of the linear regression using AQ_Continuous as the
dependent variable and ACE as the independent variable without IN_OWN as a
control variable for the ASX.
Table 8-23 The Results of the Linear Regression Using AQ_Continuous and ACE without
IN_OWN for the ASX
ASX Variable Name
Exp. Sign Coefficient t-stat
Intercept -0.24 -3.94 ACE - 0.17 8.94***
OUTSIDER - 0.04 0.85 LEVERAGE - -0.02 -0.80 NEW_FUND + 0.01 0.32 BUS_SEG + -0.01 -1.66*
ROA + -0.04 -1.40 SIZE + 0.02 5.42***
FOR_SALE - 0.04 1.44 Sample Size 300 Model F-stat 34.60*** Adjusted R2 0.47
***, ** and * indicate that a variable is significant at 0.01, 0.05 and 0.10 respectively(2-tailed).
Table 8-23 reveals that the variable of interest, ACE, is significant at 0.01 with the
same predicted sign indicating that the ASX companies with an effective audit
committee were more likely to hire a specialist auditor compared to those with an
ineffective audit committee.

Chapter 8: Sensistivity Tests Victoria University
235
In addition, BUS_SEG and SIZE are the only control variables that are significant at
.10 and 0.01, respectively, indicating that there were associations between these
variables and the selection of a specialist auditor.
8.7.2 Audit Committee Characteristics
Table 8-24 presents the results of the linear regression using AQ_Continuous as the
dependent variable and ACCS as the independent variables without IN_OWN for the
ASX sample.
Table 8-24 The Results of the Linear Regression Using AQ_Continuous and ACCS without
IN_OWN for the ASX
ASX Variable Name
Exp. Sign Coefficient t-stat
Intercept -0.43 -4.02 AC_IND + 0.10 4.87*** AC_SIZE + 0.02 2.14** AC_ACT + 0.01 2.82***
AC_CHAR + 0.03 1.11 AC_EXP + -0.01 -0.27 AC_LIT + 0.08 0.98
OUTSIDER + 0.05 1.01 LEVERAGE + -0.01 -0.42 NEW_FUND + 0.01 0.40 BUS_SEG + -0.01 -1.30
ROA + -0.04 -1.26 SIZE + 0.02 4.48***
FOR_SALE + 0.06 1.74* Sample Size 300 Model F-stat 18.79*** Adjusted R2 0.44
***, ** and * indicate that a variable is significant at 0.01, 0.05 and 0.10 respectively(2-tailed).
Table 8-24 reveals that AC_IND, AC_SIZE and AC_ACT are significant indicating
that there were positive relationships between these independent variables and the
selection of a specialist auditor.
Chapter 8: Sensistivity Tests Victoria University
236
In addition, BUS_SEG and SIZE are the only control variables that are significant
indicating that there were associations between these variables and the selection of a
specialist auditor.
In summary, the results of the regression analysis to model audit quality for the ASX
sample remained robust regardless of the inclusion or exclusion of IN_OWN as a
control variable. This implies that the results of the regression analysis to model audit
quality for the SSM sample were not driven by the exclusion of management
ownership as a control variable.
8.8 An Additional Control Variable
Chen et al. (2005) posited that the magnitude of NAS purchases had a positive
relationship with the selection of a specialist auditor. However, this variable was not
included in the main regression analysis because it has not been used frequently in the
literature and because data for such variable were not publicly available for the SSM
sample, as Saudi companies are not allowed to purchase NAS from their incumbent
auditors. Therefore, it is important to examine the impact of adding such control
variable on the results of the main regression analysis to model audit quality only for
the ASX sample.
8.8.1 Audit Committee Effectiveness
Table 8-25 presents the results of the linear regression using AQ_Continuous as the
dependent variable and ACE as the independent variable with the additional control
variable NAS_RATIO for the ASX sample.
Table 8-25 demonstrates that with the exception of BUS_SEG, which was not
significant, adding NAS_RATIO, as a control variable did not influence the results of
the main regression analysis.
NAS_RATIO was significant with the same predicted sign indicating that the ASX
companies with high NAS ratio were more likely to engage a specialist auditor
compared to those with low NAS ratio.

Chapter 8: Sensistivity Tests Victoria University
237
Table 8-25 The Results of the Linear Regression Using AQ_Continuous and ACE with the
Additional Control Variable NAS_RATIO for the ASX
Variable Exp. ASX Name Sign Coefficient t-stat
Intercept -0.21 -3.03 ACE + 0.17 8.70***
OUTSIDER + 0.00 -0.03 IN_OWN - -0.12 -2.46**
LEVERAGE + -0.01 -0.39 NEW_FUND + 0.00 -0.12 BUS_SEG + -0.01 -1.59
ROA + -0.03 -1.21 SIZE + 0.02 5.11***
FOR_SALE + 0.06 1.82* NAS_RATIO + 0.08 2.33** Sample Size 300 Model F-stat 29.83*** Adjusted R2 0.51
***, ** and * indicate that a variable is significant at 0.01, 0.05 and 0.10 respectively(2-tailed).
8.8.2 Audit Committee Characteristics
Table 8-26 presents the results of the linear regression using AQ_Continuous as the
dependent variable and ACCS as the independent variables without IN_OWN for the
ASX sample.
Table 8-26 shows that the results of the main regression analysis to model audit
quality were not affected by adding NAS_RATIO as a control variable.
However, NAS_RATIO was insignificant indicating that there was no association
between NAS ratio and the selection of a specialist auditor.
In summary, adding the control variable, NAS_RATIO, has very little impact on the
results of the main regression to model audit quality. In addition, while NAS_RATIO
was significant when using ACE as the only independent variable, the same variable
was insignificant when using the six different audit committees as the independent
variables.

Chapter 8: Sensistivity Tests Victoria University
238
Table 8-26 The Results of the Linear Regression Using AQ_Continuous and ACCS with the
Additional Control Variable NAS_RATIO for the ASX
Variable Exp. ASX Name Sign Coefficient t-stat
Intercept -0.35 -3.23 AC_IND + 0.10 4.86*** AC_SIZE + 0.02 2.09** AC_ACT + 0.01 2.57***
AC_CHAR + 0.03 1.09 AC_EXP + -0.01 -0.24 AC_LIT + 0.08 0.98
OUTSIDER + -0.01 -0.15 IN_OWN - -0.15 -3.14***
LEVERAGE + 0.00 0.17 NEW_FUND + 0.00 -0.11 BUS_SEG + -0.01 -1.31
ROA + -0.03 -0.99 SIZE + 0.01 4.02***
FOR_SALE + 0.07 2.10** NAS_RATIO + 0.06 1.52 Sample Size 300 Model F-stat 17.74*** Adjusted R2 0.48
***, ** and * indicate that a variable is significant at 0.01, 0.05 and 0.10 respectively(2-tailed).
8.9 Alternative Measures of NAS Specialization
NAS_Continuous method was used to identify NAS-specialist auditors in the main
regression analysis to model NAS purchases in order to isolate the impact of hiring a
NAS specialist auditor on the NAS purchases. However, there are two other methods
that could be used to identify NAS-specialist auditors, namely, NAS_Craswell and
NAS_Palmrose.
Despite the fact that these two methods are critiqued for the arbitrary selection of the
cut-off points, it is important to investigate the impact of using such alternative
methods of identifying NAS specialist auditors on the main regression analysis to
model NAS purchases.

Chapter 8: Sensistivity Tests Victoria University
239
8.9.1 NAS_Craswell
When using this method, NAS_SP is a dummy variable that take 1 if the auditor of a
company earns equal or more than the cut-off point of the total NAS fees for the
industry of the company and 0 otherwise. The 10%, 20% and 30% cut-off points were
used to examine the influence of using different cut-off points on the results of the
regression analysis.
8.9.1.1 Audit Committee Effectiveness
Table 8-27 presents the results of the linear regression using NAS ratio as the
dependent variable, ACE as the only independent variable and NAS_Craswell method
at three different cut-off points for the ASX sample.
Table 8-27 The Results of the Linear Regression Using NAS ratio, ACE and NAS_Craswell
method at three different cut-off points for the ASX
10% 20% 30% Variable Name
Exp. Sign Coefficient t-stat Coefficient t-stat Coefficient t-stat
Intercept - 0.41 4.44 0.40 4.33 0.41 4.36 ACE - -0.23*** -7.95 -0.22*** -7.77 -0.22*** -7.91
OUTSIDER - -0.01 -0.18 -0.01 -0.10 -0.01 -0.07 IN_OWN + 0.16** 2.35 0.15** 2.23 0.15** 2.17
LEVERAGE - -0.02 -0.65 -0.02 -0.62 -0.02 -0.64 ROA + -0.02 -0.54 -0.02 -0.51 -0.02 -0.54 SIZE + 0.00 0.90 0.00 1.05 0.00 1.05
SH_BLK + 0.00 -0.69 0.00 -0.57 0.00 -0.54 NAS_SP + 0.05** 2.03 0.04 1.45 0.05* 1.90
Sample Size 300 300 300 Model F-stat 14.24*** 13.90*** 14.16***
R Square 0.28 0.28 0.28 ***, ** and * indicate that a variable is significant at 0.01, 0.05 and 0.10 respectively(2-tailed).
Table 8-27 reveals that with the exception of NAS_SP, the results of the regression
analysis to model NAS purchases using NAS_Craswell method at three different cut-
off points were very similar to those using NAS_Continuous.
While NAS_SP using NAS_Craswell 10% and 30% was significant at 0.05 and 0.10
respectively, the same variable was insignificant using NAS_Craswell 20%.

Chapter 8: Sensistivity Tests Victoria University
240
8.9.1.2 Audit Committee Characteristics
Table 8-28 presents the results of the linear regression using NAS ratio as the
dependent variable, ACCS as the independent variables and NAS_Craswell method at
three different cut-off points for the ASX sample.
Table 8-28 The Results of the Linear Regression Using NAS Ratio, ACCS and NAS_Craswell
Method at three different cut-off points for the ASX
10% 20% 30% Variable Name
Exp. Sign Coefficient t-stat Coefficient t-stat Coefficient t-stat
Intercept 0.48 3.09 0.47 3.06 0.48 3.08 AC_IND -0.11*** -3.41 -0.10*** -3.30 -0.10*** -3.39 AC_SIZE -0.01 -0.81 -0.01 -0.79 -0.01 -0.92 AC_ACT -0.02*** -3.52 -0.02*** -3.46 -0.02*** -3.52
AC_CHAR -0.01 -0.30 -0.01 -0.27 -0.01 -0.22 AC_EXP 0.05 1.16 0.05 1.16 0.05 1.24 AC_LIT 0.02 0.13 0.01 0.10 0.01 0.09
OUTSIDER -0.06 -0.77 -0.06 -0.72 -0.05 -0.65 IN_OWN 0.19*** 2.69 0.19*** 2.61 0.18*** 2.60
LEVERAGE -0.03 -0.92 -0.03 -0.88 -0.03 -0.87 ROA -0.04 -0.88 -0.04 -0.85 -0.04 -0.85 SIZE 0.00 0.88 0.00 0.96 0.00 0.91
SH_BLK 0.00 -0.27 0.00 -0.20 0.00 -0.13 NAS_SP 0.03 1.30 0.02 0.87 0.05* 1.66
Sample Size 300 300 300 Model F-stat 6.19*** 6.10*** 6.29***
R Square 022 0.22 0.22 ***, ** and * indicate that a variable is significant at 0.01, 0.05 and 0.10 respectively(2-tailed).
Table 8-28 illustrates that with the exception of NAS_SP, the results of the regression
analysis to model NAS purchases using NAS_Craswell method at three different cut-
off points were very similar to those using NAS_Continuous.
While NAS_SP was significant at 0.10 only when using NAS_Craswell 30%, the
same variable was insignificant using NAS_Craswell 10% and 20%.

Chapter 8: Sensistivity Tests Victoria University
241
8.9.2 NAS_Palmrose
When using this method, NAS_SP is a dummy variable that takes 1 if the auditor of a
company is the leader of its industry or earns equal or more than the cut-off point of
the total NAS fees earned by the industry leader and 0 otherwise. The 5%, 15% and
25% cut-off points were used to investigate the impact of using alternative NAS
specialization methods on the results of the main analysis.
8.9.2.1 Audit Committee Effectiveness
Table 8-29 presents the results of the linear regression using NAS ratio as the
dependent variable, ACE as the only independent variable and NAS_Palmrose
method at three cut-off points for the ASX sample.
Table 8-29 The Results of the Linear Regression Using NAS ratio, ACE and NAS_Palmrose
method at three different cut-off points for the ASX
5% 15% 25% Variable Name
Exp. Sign Coefficient t-stat Coefficient t-stat Coefficient t-stat
Intercept - 0.41 4.37 0.41 4.39 0.41 4.39 ACE - -0.21 -7.60*** -0.22 -7.67*** -0.22 -7.78***
OUTSIDER - -0.02 -0.22 -0.02 -0.21 -0.01 -0.13 IN_OWN + 0.14 2.08** 0.14 2.14** 0.15 2.24**
LEVERAGE - -0.02 -0.66 -0.02 -0.64 -0.02 -0.65 ROA + -0.02 -0.54 -0.02 -0.51 -0.02 -0.54 SIZE + 0.00 1.06 0.00 1.04 0.00 0.99
SH_BLK + 0.00 -0.74 0.00 -0.68 0.00 -0.66 NAS_SP + 0.02 0.63 0.03 1.07 0.03 1.42
Sample Size 300 300 300 Model F-stat 13.61*** 13.74*** 13.89***
R Square 0.27 0.27 0.28 ***, ** and * indicate that a variable is significant at 0.01, 0.05 and 0.10 respectively(2-tailed).
Table 8-29 shows that with the exception of NAS_SP, the use of NAS_Palmrose
method has produced similar results to those using NAS_Continuous method
regardless of which cut-off point has been used.
While NAS_SP was significant at 0.01 using NAS_Continuous method, the same
variable was insignificant at 0.10 using NAS_Palmrose regardless of the cut-off point
that has been used. In addition, the value of the t-test increases with the increase in the

Chapter 8: Sensistivity Tests Victoria University
242
cut-off point indicating that although NAS_SP was insignificant at 0.10 regardless of
the cut-off point that has been used, the value of the t-test increases with the increase
in the cut-off point. In other words, the selection of the cut-off point might influence
the results for NAS_SP when using higher cut-off points.
8.9.2.2 Audit Committee Characteristics
Table 8-30 presents the results of the linear regression using NAS ratio as the
dependent variable, ACCS as the independent variables and NAS_Palmrose method at
three different cut-off points for the ASX sample.
Table 8-30 The Results of the Linear Regression Using NAS Ratio, ACCS and NAS_Palmrose
method at three different cut-off points for the ASX
5% 15% 25% Variable Name
Exp. Sign Coefficient t-stat Coefficient t-stat Coefficient t-stat
Intercept 0.48 3.09 0.48 3.08 0.48 3.08 AC_IND -0.10*** -3.23 -0.10*** -3.27 -0.10*** -3.31 AC_SIZE -0.01 -0.72 -0.01 -0.74 -0.01 -0.80 AC_ACT -0.02*** -3.39 -0.02*** -3.42 -0.02*** -3.47
AC_CHAR -0.01 -0.25 -0.01 -0.24 -0.01 -0.25 AC_EXP 0.05 1.12 0.05 1.14 0.05 1.14 AC_LIT 0.01 0.06 0.01 0.08 0.01 0.10
OUTSIDER -0.06 -0.80 -0.06 -0.79 -0.06 -0.74 IN_OWN 0.18** 2.51 0.18** 2.55 0.19*** 2.62
LEVERAGE -0.03 -0.90 -0.03 -0.90 -0.03 -0.90 ROA -0.04 -0.86 -0.04 -0.86 -0.04 -0.87 SIZE 0.00 0.95 0.00 0.96 0.00 0.92
SH_BLK 0.00 -0.32 0.00 -0.28 0.00 -0.25 NAS_SP 0.01 0.40 0.02 0.62 0.02 0.92
Sample Size 300 300 300 Model F-stat 6.04*** 6.06*** 6.10***
R Square 0.22 0.22 0.22 ***, ** and * indicate that a variable is significant at 0.01, 0.05 and 0.10 respectively(2-tailed).
Table 8-30 indicates that with the exception of NAS_SP, the use of NAS_Palmrose
method has produced similar results to those using NAS_Continuous method
regardless of which cut-off point has been used.

Chapter 8: Sensistivity Tests Victoria University
243
While NAS_SP was significant at 0.01 using NAS_Continuous method, the same
variable was insignificant at 0.10 using NAS_Palmrose regardless of the cut-off point
that has been used. In addition, the value of the t-test increases with the increase in the
cut-off point indicating that although NAS_SP was insignificant at 0.10 regardless of
the cut-off point that has been used, the value of the t-test increases with the increase
in the cut-off point. In other words, the selection of the cut-off point might influence
the results for NAS_SP when using higher cut-off points.
In summary, with the exception of NAS_SP, the use of alternative methods to identify
NAS specialization has produced very similar results to those using NAS_Continuous
method. While NAS_SP is significant using NAS_Continuous method indicating that
the ASX companies with a NAS-specialist auditor had higher NAS ratio compared to
these without a NAS-specialist auditor, the same variable has produced mixed results
when using different cut-off points under the two alternative methods. Finally, the
results of using different cut-off points indicated that NAS_Palmrose method was less
sensitive to changing the cut-off point compared to NAS_Craswell method.
8.10 Summary
Eight different sensitivity tests have been conducted and discussed in this chapter.
Some of the sensitivity tests revealed that including the financial sector in the sample,
having different periods of time to comply, the use of auditor size as a proxy for audit
quality, the unavailability of data on management ownership for the SSM sample and
the use of alternative control variables did not influence the results of the main
regression analysis in Chapter 7 and that the results of the regression analysis remain
robust.
On the other hand, other sensitivity tests indicate that the arbitrary selection of the cut-
off points to identify specialist auditors in providing audit and NAS under
AQ_Craswell and AQ_Palmrose methods had produced different results for different
cut-off points. This provides support for the argument that considers the
AQ_Continuous method to be superior over AQ_Craswell and AQ_Palmrose
methods, which require the use of arbitrary cut-off points.

Conclusion Victoria University
244
CHAPTER 9: CONCLUSION
9.1 Introduction
As set out in Chapter 1, the primary aim of this study was to evaluate and compare the
efficacy of the ASX CGC and SMC best practices and recommendations regarding
audit committees in the context of auditor selection; as well as to explore only the
efficacy of the ASX CGC best practices and recommendations regarding audit
committees in the context of the magnitude of NAS purchases because incumbent
auditors are not allowed to provide such services to their clients.
In order to achieve these aims, the associations between ACE and both audit quality
and NAS purchases were investigated using the ASX CGC and SMC best practices
and recommendations as benchmarks. In addition, the most important determinant of
audit quality among the six different audit committee characteristics was identified for
Australian and Saudi listed companies. Finally, the most important determinant of the
magnitude of NAS purchases among the six different audit committee characteristics
was identified.
There have been virtually no prior academic studies in the area of the efficacy of the
ASX CGC and SMC best practices and recommendations regarding audit committee
in the context of auditor selection and NAS purchases (only for ASX listed
companies). This study would be the first study- to my knowledge- that investigated
the influence of having different audit committee frameworks and market
developments between Australia and Saudi Arabia on ACE in the context of the
auditor selection process. Finally, this study would provide databases that could be
used to study different issues or by others to study similar issues in different settings
or environments.
This chapter is divided into six sections. Section 1 provides an overview of the
structure of this thesis. In section 2, the principal findings of the study are briefly
presented. Section 3 provides a number of recommendations and implications of this
study aimed at improving ACE in both countries. In section 4, a number of the
limitations of this study are identified and discussed. Section 5 introduces and

Conclusion Victoria University
245
identifies future research opportunities in relation to ACE. Finally, Section 6 provides
short a summary for this chapter.
9.2 Overview
This thesis has nine chapters including this conclusion chapter. In Chapter 1, the bases
of this thesis were provided. The objectives, motivations and contribution to the ACE
literature were identified and discussed in detail. Chapter 2 offered a comprehensive
review of audit committee developments overtime in the US, UK, Canada, Australia
and Saudi Arabia.
In Chapter 3, the audit committee literature, in general, and ACE literature, in
particular, was reviewed. In addition, more attention has been given to audit
committee literature in the context of audit quality and NAS purchases. Finally, a
number of gaps in ACE literature was identified and six research questions were
stated.
Chapter 4 presented a review of the differences between Australia and Saudi Arabia
related to audit committee frameworks and market developments. In addition, a
number of audit committee theories that have been used in the literature was presented
and critiqued. Furthermore, the underpinning theories and the model of this study
were presented and summarized in Figures 4-1 and 4-2. Also, the hypotheses of this
study were developed and stated.
In Chapter 5, the methodology that has been adopted in this research was presented.
In addition, the justification for the use of specific research methods and data
collection techniques were provided. The research design of this study was discussed
in detail including sample selection, test period, dependent variables, independent
variables and regressions.
Chapter 6 presented the descriptive data analysis for the full Australian and Saudi
samples. In Chapter 7, the presence of multicollinearity was investigated by
examining the correlations among the independent variables (correlation analysis). In
addition, the t-test of two-independent samples (groups) was used to identify if the
differences in means between two-independent groups occur only by chance or not.
Moreover, the main regression analysis used to test the hypotheses of this study was

Conclusion Victoria University
246
presented. The main regression analysis was divided into two parts. In Part 1, the
association between ACE and audit quality was investigated and the determinants of
audit quality among the six audit committee characteristics was identified. In Part 2,
NAS purchase was modelled to investigate its relationships with ACE and the six
audit committee characteristics. Finally, an additional test to examine the impact of
having different compliance requirements for companies within the ASX on the
results of the main regression analysis.
Chapter 8 presented a number of sensitivity tests performed to ensure that the results
of the main regression analysis in Chapter 7 were not driven by changing number of
factors such as alternative proxies or methods for audit quality that might affect such
results.
9.3 The Principal Findings
In terms of the compliance with their local best practices and recommendations
regarding ACE and the six different audit committee characteristics, the ASX listed
companies were in better position compared to their Saudi counterparts. The
correlation analysis indicated that multicollinearity does not represent any threats
when running the regression analysis.
On the other hand, the t-test of two-independent groups identified the nature (occurred
by chance or not) of the differences in means between the two groups and showed that
some independent variables would not be significant determinants of audit quality or
NAS purchases because differences in means for such variables occurred only by
chance (equal means).
The main regression analysis revealed that there was a positive association between
ACE and the selection of a specialist auditor for the ASX sample indicating that the
ASX companies with an effective audit committee were more likely to hire a
specialist auditor compared to those with a non-effective audit committee. However,
there was no association between ACE and the selection of a specialist auditor for the
SSM sample indicating that the SSM listed companies with an effective audit
committee were not more likely to utilize a specialist auditor compared to those with a
non-effective audit committee. In addition, while audit committee independence was

Conclusion Victoria University
247
the most important determinant of audit quality among the six audit committee
characteristics for the ASX listed companies, none of the six audit committee
characteristics was a determinant of audit quality for the SSM.
These results indicate that while the ASX best practices and recommendations
regarding audit committees were efficient in the context of the auditor selection
process, the SMC best practices and recommendations regarding audit committees
were not efficient. The differences in the results of the main regression analysis
between the ASX and SSM samples in the context of the auditor selection process
could be attributed to the differences in audit committee frameworks, the differences
in market developments, the differences in cultural factors, the small sample size of
the SSM or the limitations associated with Saudi collected data that will be discussed
in Section 9.5.
On the other hand, the main regression analysis also revealed that there was a negative
relationship between ACE and the magnitude of NAS purchases for the ASX sample
indicating that the ASX companies with an effective audit committee were more
likely to have a lower NAS ratio compared to those with a non-effective audit
committee In addition, audit committee independence was the most important
determinant of NAS purchases among the six audit committee characteristics for the
ASX listed companies.
An additional test was conducted to investigate the impact of having different audit
committee requirements for the ASX Top 300 and ASX Non-Top 300 companies on
the result of the regression analysis for the ASX sample. The general results remained
robust as ACE was positively (negatively) associated with the selection of a specialist
auditor (the magnitude of NAS purchases) and audit committee independence was the
most important determinant of audit quality and NAS purchases for both sub-samples.
However, while audit committee activity was a determinant of audit quality and NAS
purchases for the ASX Non-Top 300 sub-sample, such audit committee characteristic
was not a determinant of audit quality and NAS purchases for the ASX Top 300 sub-
sample. A possible explanation could be attributed to the lack of variability in the
number of audit committee meetings for the ASX Top 300 sub-sample.
Conclusion Victoria University
248
Finally, a number of sensitivity tests was conducted to investigate the impact of
changing a number of factors on the results of the main regression analysis. Including
the financial sector in the sample, having different periods of time to comply, the use
of auditor size as a proxy for audit quality, the unavailability of data on management
ownership for the SSM sample and the use of alternative control variables did not
influence the results of the main regression analysis in Chapter 7 and that the results
of the regression analysis remain robust.
On the other hand, the use of alternative methods to identify specialist auditor in
providing audit and non-audit services other sensitivity indicated that the arbitrary
selection of the cut-off points to identify such specialist auditors under AQ_Craswell
and AQ_Palmrose methods had produced different results for different cut-off points.
This provides support for the researcher’s argument that considers AQ_Continuous
method to be superior over AQ_Craswell and AQ_Palmrose methods, which require
the use of arbitrary cut-off points.
9.4 Recommendations of the Study
The results of this study indicate that despite the fact that the ASX CGC and SMC
best practices and recommendations aimed at improving ACE are similar in both
countries, the SMC recommendations and best practices were not efficient in the
context of audit quality. This provides evidence that other factors such as audit
committee framework, market development and cultural factors might influence ACE.
As a result, the following recommendations could enhance ACE in Saudi Arabia.
• Audit committee framework in Saudi Arabia should be developed to include
listing rules from the SSM that require listed companies to have effective audit
committees and disclose the structure of such committees.
• The SSM should be developed by the Saudi Stock Exchange Commission
(SSEC) to make it a secure market for both local and international investors.
• Review the SMC best practices and recommendations in the light of the nature
of Saudi Arabian society with its strong dependence on connection between
family and friends and with the strong influence of religious beliefs on the
behavior of individuals.

Conclusion Victoria University
249
While the ASX CGC best practices and recommendations do not specify a minimum
number of audit committee meetings, the SMS recommends that audit committee
should meet at least three time a year. As a result, it is recommended that the ASX
CGC and SMC should adopt the international standard which recommends that the
audit committee should meet at least four times a year in order to be effective in doing
its duties as companies are required to produce quarterly financial reports. (BRC
1999).
9.5 Limitations of the Study
Almost all research projects are constrained in some way whether in terms of the
design and methodology of the study, the accessibility of data or the interpretation of
the results of the study. In this context it is important for both the researcher and users
of the research to be aware of the relevant limitations as they seek to develop and
interpret the results of the study or to clarify their meaning (Anderson and Poole,
2001).
There is a number of limitations for this study. First, the SSM sample was very small
(44 companies) compared to the ASX sample (300 companies). The small size may
result in the lack of variability of the sample data for one or more of the test variables
and consequently such variables will not be significant. In addition, the small sample
size limit the results of running logistic regressions on such sample as these regression
required large samples. This explain the strange results from running such regression
on the SSM sample. Moreover, the small sample create a problem when identifying
specialist auditor because some sectors will have only one or two companies.
On the other hand, although the ASX sample was quite large, it would be better if the
whole population of the ASX were used to avoid any sample selection bias. It is
possible that the ASX sample is not representative for the whole population in terms
of industry composition, size, auditor size, and the engagement of a specialist auditor.
However, as there was a time restriction for this study, it was impossible to include all
the population.
Second, the questionnaire was used to collect data regarding different audit committee
characteristics. Matthews (2002) suggested that all surveys had weaknesses. For

Conclusion Victoria University
250
instance, respondents might lie or give the answers that they think are expected of
them or which show themselves and their firms in the best light. This could be noted
in the respondents’ answer for the evaluation of their independence. While they
described themselves as independent, they were executive directors who would never
be independent. In addition, it is possible that the questionnaire may have lacked
clarity in certain sections causing respondents to interpret questions differently.
However, the questionnaire was pilot tested to ensure that it was easy, clear, did not
take much time to be completed and covered the six audit committee characteristics.
Third, although the ASX CGC and SMC best practices and recommendations
regarding audit committees were used as benchmarks to identify independent
directors, it was possible that such identification was not accurate as most of the data
that had been used to make such judgement were taken from the annual reports or the
questionnaire.
Fourth, consideration should be given to the difference in cultural factors between
Australia and Saudi Arabia and their impact on audit committee effectiveness. For
example, Saudi Arabian society is known for its strong dependence on connection of
family and friendship, which may considerably impact ACE. McKinnon (1984)
found, in contrast to Western societies, that the cultural determinants of interpersonal
and inter-group relationships in Japan preclude an intrinsic acceptance of audit
independence. This case is also mentioned by Ow-Yong and Guan (2000) in
Malaysia. However, although the differences in cultural factors were noted in this
study, no attempt has been made to test them.
Fifth, the differences between Saudi Arabia and Australia in terms of cultural factors,
types of data (archival Vs. survey), market developments and audit committee
frameworks limit the conclusion of this comparative study.
Sixth, the fact that some of the Saudi sectors lack the presence of two or more of the
Big 4 also limits the conclusions of this comparative study.

Conclusion Victoria University
251
Seventh, it should be noted that although selecting specialist auditor is based on
specialization existing prior to the current year of engagement, specialization is
calculated concurrently with the year of analysis (2004).
Eighth, where the tenure of auditors precedes the formation of the audit committee, it
is less likely that such committee will influence the selection of auditors. As a result,
the length of audit committee existence and auditor control should be controlled for.
However, this has not been done in this study.
Finally, despite the fact that differences in audit committee frameworks and market
developments between Australia and Saudi Arabia were noted in this study, the
impact of such differences on ACE was not investigated.
9.6 Future Research Opportunities
Corporate governance involves complex interrelated mechanisms. As yet research
(particularly in Australia and Saudi Arabia) into the extent of the associations between
different corporate governance mechanisms is extremely limited. As a result, further
research is needed to investigate the following research question.
Is there an association between various corporate governance mechanisms?
In addition, little is known about the impact of having different audit committee
frameworks, different market developments and different cultural factors on audit
committee effectiveness (ACE). As a result, further research is required to test the
influence of such differences on ACE using a research question similar to the
following.
What is the impact of having different audit committee frameworks, market
developments and cultural factors on ACE?
As mentioned in Chapter 3, audit committee literature could be described as US based
literature. Research evidence obtained from the study of US companies suggests that
there is an association between ACE and accountability. However, it is not clear that
the findings of such research are appropriate to other countries especially Australia
and Saudi Arabia as there are a number of significant differences between these
Conclusion Victoria University
252
countries with respect to audit committee frameworks, market developments and
cultural factors.
Therefore, the following research questions present future research opportunities that
could be investigated in Australia or / and Saudi Arabia.
Is there a positive association between ACE and firm performance?
What is the relationship between firm performance and the different audit committee
characteristics?
What is the market reaction to the announcement of a new audit committee?
What is the relationship between ACE and internal audit?
Is there a positive association between ACE and audit fees?
What is the most important determinant of audit fees among the different audit
committee characteristics?
9.7 Summary
This chapter provided a comprehensive review of this thesis including its objectives,
motivations, contribution to knowledge, structure, principal findings,
recommendations, limitations and future researches.

References Victoria University
253
References
Abbott, L. and Parker, S., 2000, Auditor selection and audit committee characteristics,
Auditing: A Journal of Practice and Theory, Vol.19, Iss.2, pp.47-66.
____, Parker, S., and Peters, G., 2002, Audit committee characteristics and financial
misstatement: A study of the efficacy of certain Blue Robin Committee
recommendations, Working Paper,
http://papers.ssrn.com/sol3/papers.cfm?abstract_id=319125, 25/10/2003.
____, Parker, S., Peters, G., and Raghunandan, K., 2003, An empirical investigation
of audit fees, non-audit fees and audit committees, Contemporary Accounting
Research, Vol.20, Iss.2, pp.215-234.
Abdel-khalik, A., 1990, The jointness of audit fees and demand for MAS: A self-
selection analysis, Contemporary Accounting Research, Vol.7, pp.295-322.
____, Snowball, D., and Wargge, J., 1983, The Effects of Certain Internal Audit
Variables on the Planning of External Audit Programs, Accounting Review, Vol.58,
Iss.2, pp.215-227.
Abdolmohammadi, M., and Levy, E., 1992, Audit committee members' perceptions of
their responsibility, Internal Auditing, Vol.8, Iss.1, pp.53-63.
Abulkhair, B., 1995, The guidelines for choosing the audit committees must be
revised, Arriyadh Newspaper, 25 November, p.31.
Alchian, A., and Demsetz, H., 1972, Production, information costs and economic
organization, American Economic Review, Vol.62, Iss.5, pp.777-95.
Al-Moataz, E., 2003, The Effectiveness of Audit Committees within Saudi
Corporations: An Empirical Investigation, PhD Thesis, Loughborough University:
UK.
Alreck, P., and Settle, R., 1995, The Survey Research Handbook: Guidelines and
Strategies for Conducting A Survey, 2nd Edition, McGraw-Hill: USA.

References Victoria University
254
Al-Twaijry, A., Brierley, J., and Gwilliam, D., 2002, An examination of the role of
audit committees in the Saudi Arabian corporate sector, Corporate Governance,
Vol.10, Iss.4, pp.288-297.
American Institute of Certified Public Accountants, 1981, Communication with audit
committees, Statement on Auditing Standards No. 61,
http://www.aicpa.org/download/members/div/auditstd/AU-00380.PDF, 22/07/2004.
Anderson, J., and Poole, M., 2001, Assignment and Thesis Writing, 4th Edition, John
Wiley & Sons Australia, Ltd: Australia.
Archambeault, D., and DeZoort, F., 2001, Auditor opinion shopping and the audit
committee: An analysis of suspicious auditor switches, International Journal of
Auditing, Vol.5, pp.33-52.
Arrubaish, M., 1995, Yes, audit committees in the companies are tahseel hasil,
Arriyadh Newspaper, 7 November, p32.
Arrunada, B., 1999, The provision of non-audit services by auditors: Let the market
evolve and decide, International Review of Law and Economics, Vol.19, Iss.4,
pp.513-531.
Ashbaugh, H., LaFond, R., and Mahew, B., 2003, Do nonaudit services compromise
auditor independence? Further evidence, Accounting Review, Vol.78, Iss.3, pp.611-
640.
Arthur Andersen, 1994, Global Best Practices for Audit Committees, Arthur Andersen
& Co, SC: USA.
Australian Accounting Research Foundation, 2002, Independence of Australian
Company Auditors, http://www.treasury.gov.au/documents/297/PDF/aarf.pdf,
12/01/2004.
Australian Investment Manager’s Association, 1996, Corporate governance: A guide
for investment managers and corporations, IRCC Corporate Governance, Bulletin.13,
Iss.3.

References Victoria University
255
Australian Stock Exchange Corporate Governance Council 2003, Principles of Good
Corporate Governance and Best Practices Recommendations,
http://www.shareholder.com/visitors/dynamicdoc/document.cfm?documentid=364&c
ompanyid=ASX, 29/05/2003.
Australian Stock Exchange Corporate Governance Council Implementation Review
Group 2004, Principles of Good Corporate Governance and Best Practices
Recommendations Report to the ASX Corporate Governance Council 31 March 2004,
http://www.asx.com.au/about/pdf/IRG_Report_to_ASX_CGC_final.pdf, 29/05/2006.
Australian Stock Exchange, 1987, History of ASX,
http://www.asx.com.au/research/market_info/history/history_ASX.htm, 22/08/2003.
____, 2006, Historical Market Statistics,
http://www.asx.com.au/research/market_info/historical_equity_data.htm, 30/06/2006.
Bacon, J., 1998, The audit committee: A broader mandate, New York: The
Conference Board.
____, and Brown, J., 1973, Corporate directorship practices: Role, selection and legal
status of the board, New York: Conference Board.
Barkess, L., and Simnett, R., 1994, The provision of other services by auditors:
Independence and pricing issues, Accounting and Business Research, Vol.24, Iss.94,
pp.99-108.
Barnes, P., and Huan, H., 1993, The auditor’s going-concern decision: Some UK
evidence concerning independence and competence, Journal of Business Finance &
Accounting, Vol.20, Iss.2, pp.213-228.
Baxter, P., and Pragasam, J., 1999, Audit committees: One size fits all, Australian
CPA, (April), pp.42-43.
Baysinger, B., and Butler, H., 1985, Corporate governance and the board of directors:
Performance effects of changes in board composition, Journal of Law, Economics and
Organization, Vol.1, pp.101-124.
References Victoria University
256
Beasley, M., 1996, An empirical analysis of the relation between the board of director
composition and financial statement fraud, Accounting Review, Vol.71, pp. 443-466.
____, and Petroni, K., 1998, Board Independence and Audit Firm Type,
Working Paper, http://ssrn.com/abstract=137582.
____, and Petroni, K., 2001, Board independence and audit-firm type, Auditing: A
Journal of Practice and Theory, Vol.20, Iss.2, pp.97-114.
____, and Salterio, S., 2001, The relationship between board characteristics and
voluntary improvements in the capability of audit committees to monitor,
Contemporary Accounting Research, Vol.18, pp.539-570.
____, Carcello, J., and Hermanson, D., 2000, Should you offer a job to your external
auditor? Journal of Corporate Accounting & Finance, Vol.11, Iss.4, pp.35.
Beattie, V., and Fearnley, S., 1998, Audit market competition: Auditor changes and
the impact of tendering, British Accounting Review, Vol.30, Iss.3, pp.261-289.
Beatty, R., 1989, Auditor reputation and the pricing of initial public offerings,
Accounting Review, Vol.64, Iss.4, pp.693-709.
Beck, P., Frecka, T., and Solomon, I., 1988, An empirical analysis of the relationship
between MAS and audit services: knowledge spillovers and auditor-auditee bonding,
Journal of Accounting Literature, Vol.7, pp.65-84.
Bedard, J., Chtourou, S., and Couteau, L., 2004, The effective of audit committee
expertise, independence and activity on aggressive earnings management, Auditing,
Vol.23, iss.2, pp.15-37.
Berton, L., 2003, Lee Berton: Big 4 'oligopoly' works swell -- for the surviving firms,
Business News (November 30, 2003).
Birkett, B., 1986, The recent history of corporate audit committees, Accounting
Historians Journal, Vol.13, Iss.2, pp.109-124.
Blue Robin Committee on Improving the Effectiveness of Corporate Audit
Committees (BRC), 1999, Report and Recommendations of the Blue Robin Committee

References Victoria University
257
on Improving the Effectiveness of Corporate Audit Committees, New York, NY: New
York Stock Exchange and National Association of Securities Dealers.
Bourgue, L., and Fielder, P., 1995, How to Conduct Self-Administrated and Mail
Surveys, 1st Edition, London, UK: SAGE Publications.
Bradbury, M., 1990, The incentives for voluntary audit committee formation, Journal
of Accounting and Public Policy, Vol.9, Iss.1, pp. 13-36.
Braiotta, L., 1986, Audit committee: An international survey, The Corporate Board,
May/June, pp. 18-23.
____,1994, The Audit Committee Handbook, 2nd Edition. New York: John Wiley &
Sons, Inc.
Buckby, S., Dunstan, K., and Savage, R., 1996, A study of the determinants of
Australian audit committee effectiveness, Working Paper,
http://papers.ssrn.com/sol3/papers.cfm?abstract_id=30561, 25/6/2004.
Bujaki, M., and McConomy, B., 2002, Corporate governance: Factors influencing
voluntary disclosure by publicly traded Canadian firms, Canadian Accounting
Perspectives, Vol.1, Iss.2, pp.105-139.
Burke, F., and Guy, D., 2001, Audit Committees: A Guide for Directors,
Management, and Consultants, New York: Aspen Law & Business.
Bushee, B., and Noe, C., 2000, Corporate disclosure practices, institutional investors,
and stock return volatility.” Journal of Accounting Research, Vol.38, Iss.3, pp.171–
202.
Byrne, J., 1996, The best and worst boards, Business Week, (November 25, 1996),
pp.82-106.
Cadbury Committee, 1992, Report of the Committee on the Financial Aspects of
Corporate Governance, London: Professional Publishing Ltd.

References Victoria University
258
Callon, M., 1986, The sociology of an actor-network: The case of electric vehicle, In
Callon, Michel, H. Law, and A. Rip (eds.), 1986, Mapping the Dynamics of Science
and Technology. Sociology of Science in the Real World, Houndsmills: Macmillan,
pp.19-34.
Canadian Institute of Chartered Accountants, 1981, Audit Committees: A Research
Study, CICA: Canada.
____, 1992, Terminology for Accountants, 4th Edition, CICA: Canada.
Caneghem, T., 2004, The impact of audit quality on earning’s rounding behaviour:
some UK evidence, European Accounting Review, Vol.13, pp.771-786.
Carcello, J., and Neal, T., 2000, Audit committee composition and auditor reporting,
Accounting Review, Vol.75, Iss.4, pp.453-467.
____, and Neal, T., 2003, Audit committee characteristics and auditor dismissals
following new going-concern reports, Accounting Review, Vol.78, Iss.1, pp.95-117.
____, Hermanson, D., and Neal, T., 2002, Disclosures in audit committee charters and
reports, Accounting Horizons, Vol.16, pp. 291-304.
____, Hollingsworth, C., Klein, A., and Neal, T., 2006, Audit Committee Financial
Expertise, Competing corporate governance mechanisms and earning management,
Working Paper, http://papers.ssrn.com/sol3/papers.cfm?abstract_id=887512,
22/5/2006.
Carmichael, D., and Swieringa, R., 1968, The compatibility of auditing independence
and management services: An identification of issues, Accounting Review, Vol.43,
Iss.4, pp.697-705.
Castellano, J., Roehm, H. and Vondra, A., 1989, Audit committee compliance with
the Treadway Commission report: A survey. The Ohio CPA Journal, Winter, pp.37-
42.

References Victoria University
259
Chen, M., Moroney, R., and Houghton, K., 2005, Audit committee composition and
the use of an industry specialist audit firm, Accounting and Finance, Vol.45, Iss.2,
pp.217-239.
Chow, C., 1982, The demand for external auditing: Size, debt and ownership
influences, Accounting Review, Vol.57, Iss.2, pp.272-291.
____, Kramer, L., and Wallace, W., 1988, The environment of auditing: In Research
Opportunities in Auditing: The Second Decade, Sarasota, FL: American Accounting
Association, pp155-183.
Christofi, M., 1978, Audit committees arrive in Australia, The Chartered Accountant
in Australia, Vol.49, Iss.5, pp.17-19.
Clift, R., 1982, Accounting Communication and Control, 2nd Edition, ButterWorths:
Melbourne.
Cobb, L., 1993, An investigation into the effect of selected audit committee
characteristics on fraudulent financial reporting, Doctoral Dissertation, University of
South Florida.
Cohen, J., and Hanno, D., 2000, Auditors' consideration of corporate governance and
management control philosophy in preplanning and planning judgments, Auditing: A
Journal of Practice and Theory, Vol.19, pp.133-146.
____, Krishnamoorthy, G., and Wright, A., 2002, Corporate governance and the audit
process, Contemporary Accounting Research, Vol.19, pp.573-594. *
Collier, P., 1992, Audit Committees in Large UK Companies, London: ICAEW.
____, 1993, Factors Affecting the Voluntary Formation of Audit Committees in Major
UK Listed Companies, PhD Thesis, Exeter University.
____, 1996, The rise of audit committee in UK quoted companies: a curious
phenomenon? Accounting, Business and Financial History, Vol.6, Iss.2, pp.121-140.

References Victoria University
260
____, and Gregory, A., 1999, Audit committee activity and agency costs, Journal of
Accounting and Public Policy, Vol.18, pp.311-332.
Commission on Auditor’s Responsibilities, 1978, Report, Conclusions, and
Recommendations, New York, New York, US: AICPA.
Commonwealth Treasury, 2002, CLERP Paper No.9: Proposals for Reform –
Corporate Disclosure,
http://www.treasury.gov.au/contentitem.asp?NavId=&ContentID=403, 29/05/2006.
Coopers and Lybrand, 1995, Audit Committee Guide, New York: Coopers and
Lybrand.
Cottell, P., and Rankin, L., 1988, Do audit committees bias auditor selection? Acron
Business and Economic Review, Vol.19, Iss.4, pp.87-103.
CPA Australia and ICAA, Professional Statement F1: Professional Independence, In
Auditing Handbook, Vol.2.
Craswell, A., 1999, Does the Provision of Non-Audit Services Impair Auditor
Independence? International Journal of Auditing, Vol.3, Iss.1, pp 29-40.
____, Francis, J., and Taylor, S., 1995, Auditor brand name reputation and industry
specializations, Journal of Accounting and Economics, Vol.20, pp.292-322.
Cullinan, C., 1998, Evidence of non-Big 6 market specialization and pricing power in
a niche assurance market, Auditing: A Journal of Practice and Theory, Vol.17, Iss.2,
pp.47-57.
Dafinone, D., 2001, The Effectiveness of Audit Committees: An Analysis of
Governance Mechanisms as Surrogates for Effectiveness, PhD Thesis, City
University: London.
Davis, L., Ricchiute, D., and Trompeter, G., 1993, Audit effort, audit fees, and the
provision of non-audit services to audit clients, Accounting Review, Vol.68, Iss.1, pp.
135-150.

References Victoria University
261
De Vaus, D., 1996, Survey in Social Research, Fourth Edition, University College
London, London.
DeAngelo, L., 1981, Auditor independence, low-balling and disclosure regulation,
Journal of Accounting and Economics, Vol.3, Iss.2, pp.113-127.
Dechow, P., Sloan, R., and Sweeney, A., 1996, Causes and consequences of earnings
manipulation: An analysis of firms subject to enforcement actions by the SEC, Conter
Research, Vol.13 , pp.1-36.
DeFond, M., 1992, The association between changes in client firm agency costs and
auditor switching, Auditing: A Journal of Practice and Theory, Vol.11, Iss.1, pp.16-
31.
____, Francis, J., and Wong, T., 2000, Auditor industry specialization and market
segmentation: Evidence from Hong Kong, Auditing: Journal of Practice and Theory,
Vol.19, Iss.1, pp.49-66.
____, Raghunandan, K., and Subramabyam, K., 2002, Do nonaudit service fees
impair audit independence? Evidence from going concern audit opinions, Journal of
Accounting Research, Vol.40, pp.1247-1274.
____, Hann, R., and Hu, X., 2005, Does market value financial expertise on audit
committees of boards of directors? Journal of Accounting Research, Vol.43, Iss.2,
pp.153-193.
Deloitte & Touche, 2000, Audit Committees: Implementing the New Requirements for
the Year 2000. New York: Deloitte & Touche.
DeZoort, F., 1997, An investigation of audit committees' oversight responsibilities,
Abacus, Vol.33, Iss.3, pp.208-227.
____, 1998, An analysis of experience effects on audit committee members' oversight
judgments, Accounting, Organizations and Society, Vol.23, pp.1-22.

References Victoria University
262
____, and Salterio, S., 2001, The effects of corporate governance experience and audit
knowledge on audit committee members' judgments, Auditing: A Journal of Practice
and Theory , Vol.20, pp.31- 47.
____, Friedberg, A., and Reisch, J., 2000, Implementing a communications program
for audit committees: Comments from internal audit directors, Internal Auditing
(July/August), pp.11-18.
____, Hermanson, D., Archambeault, D., and Reed, S., 2002, Audit committee
effectiveness: A synthesis of impirical audit committee literature, Journal of
Accounting Literature, Vol.21, pp.38-75.
Dillman, D., 2000, Mail and Internet Surveys: The Tailored Design Method. 2nd
Edition, John Wiley & Sons, Inc: USA.
Dilworth, I., 1989, More power to audit committees, CA Magazine, Vol.122, Iss.5,
pp.26-37.
DiMaggio, P., and Powell, W., 1983, The iron cage revisited: Institutional
isomorphism and collective rationality in organizational fields, American Sociological
Review, Vol.48, pp.147-160.
Dopuch, N., and Simunic, D., 1982, Competition in auditing: An assessment, Fourth
Symposium on Auditing Research, pp. 401-450, University of Illinois.
Easterby-Smith, M., Thorpe, R., and Lowe, A., 2002, Management Research, 2nd
Edition, London: SAGE Publications.
Eichenseher, J., 1985, The effects of foreign operations on domestic auditor selection,
Journal of Accounting, Auditing and Finance, Vol.8, Iss.3, pp.195-209.
____, and Danos, P., 1981, The analysis of industry-specific auditor concentration:
Towards an explanatory model, Accounting Review, Vol.56, Iss.3, pp.479-492.
____, and Shields, D., 1985, Corporate director liability and monitoring preferences,
Journal of Accounting and Public Policy, Vol.4, pp.13-31.

References Victoria University
263
Ernst & Young, 2000, Audit Committees: Implementing the New Rules, New York:
Ernst & Young.
Ezzamel, M., 1994, Organizational change and accounting: Understanding the
budgeting system in its organizational context, Organization Studies, Vol.15, Iss.1,
pp.213-240.
____, and Watson, R., 1997, Wearing two hats: The conflicting control and
management roles of non-executive directors, Corporate Governance: Economic,
Management and Financial Issues (Oxford: Oxford University Press).
____, Gwilliam, D., and Holland, K., 1996, Some empirical evidence from publicly
quoted UK companies on the relationship between the pricing of audit and non-audit
services, Accounting and Business Research, Vol.27, Iss.1, pp.3-16.
Fama, E., 1980, Agency problems and the theory of the firm, Journal ofpolitical
Economy, Vol.2, pp.288-307.
____, and Jensen, M., 1983, Separation of ownership and control, Journal of Law and
Econornic, Vol.26, pp.301-325.
Felo, A., Krishnamurthy, S., and Solieri, S., 2003, Audit committee characteristics
and the perceived quality of financial reporting: An empirical analysis, Working
Paper, http://papers.ssrn.com/sol3/papers.cfm?abstract_id=401240, 19/06/2004.
Firth, M., 1997, The provision of non-audit services by accounting firms to their audit
clients, Contemporary Accounting Research, Vol.14, Iss.2, pp.1-21.
____, and Smith, A., 1992, Selection of auditor firms by companies in the new issue
market, Applied Economics, Vol.24, Iss.2, pp.247-255.
Foddy, W., 1999, Constructing Questions for Interviews and Questionnaires: Theory
and Practice in Social Research. Cambridge University Press: UK.

References Victoria University
264
Fogarty, T., 1996, The imagery and reality of peer review in the U.S.: insights from
institutional theory, Accounting, Organizations and Society, Vol.21, Iss.2, pp.243-
267.
Francis, J., and Wilson, E., 1988, Auditor changes: A joint test of theories relating to
agency costs and auditor differentiation, Accounting Review, Vol.63, Iss.4, pp.663-
683.
Frankel, R., Johnson, M., and Nelson, K., 2001, Auditor independence and earnings
quality, Working Paper, Stanford University.
Frankfort-Nachmias, C., Nachmias, D., 1996, Research Methods in the Social
Sciences, 5th Edition, Edward Arnold: London.
French, J., and Raven, B., 1959, The bases of social power. In Studies in Social
Power, Ed. D. Cartwright, Institute for Social Research, Ann Arbor, Mich., pp.150-
167.
General Accounting Office (GAO), 1991, Audit Committees: Legislation Needed to
Strengthen Bank Oversight. Washington, D.C.: Report to Congressional Committees.
Gill, J., and Johnson, P., 2002, Research Methods for Managers. 3rd Edition, SAGE
Publications Ltd: London.
Glezen, G., and Millar, J., 1985, An empirical investigation of stockholder reaction to
disclosures required by ASR No 250, Journal of Accounting Research, Vol.23, Iss.2,
pp. 859-870.
Goobey, A., 2001, Ten years on: A corporate governance turning point, PIRC’s
Annual Corporate Governance,
http://www.hermes.co.uk/pdf/corporate_governance/commentary/pirc_speech_by_ros
s-goobey.pdf, 23/04/2006.
Gramling, A., and Stone, D., 1998, A review and evaluation of industry concentration,
specialization, experience and knowledge research in auditing, Working paper,
University of Illinois.

References Victoria University
265
Grant Thornton, 1997, The Expanded Role of the Audit Committee, New York: Grant
Thornton.
Green, D., 1994, Canadian audit committees and their contribution to corporate
governance, Journal of International Accounting, Auditing and Taxation, Vol.3, Iss.2,
pp.135-151.
Greene, W., 1997, Econometric Analysis, Upper Saddle River, NJ: Macmillan
Publishing Company.
Grice, B., 1993, Institute position on audit committees, Charter, Vol. 64, Iss.11.
Gujarati, D., 1995, Basic Econometrics, 3rd Edition, New York: McGraw-Hill.
Gul, F., 1990, Qualified audit reports, field Dependence cognitive style, and their
effects on decision making, Accounting and Finance, Vol.30, Iss.1, pp.15-33.
Gul, F., Tsui, J. and Dhaliwal, D., 2006, Non-audit services, auditor quality and the
value relevance of earnings, Accounting and Finance, forthcoming.
Guthrie, J., and Turnbull, S., 1995, Audit committees: is there a role for corporate
senates and/or stakeholders councils? Corporate Governance: An International
Review, Vol.3, Iss.2, pp.78-89.
Haka, S., and Chalos, P., 1990, Evidence of agency conflict among management,
auditors, and the audit committee chair, Journal of Accounting and Public Policy,
Vol.9, pp.271-292.
Hampel Report, 1998, Committee on Corporate Governance : Final Report,
Chairman, Sir Ronald Hampel, London: Gee.
Hansell, C., 2002, Canadian audit committees: A history of leadership, International
Financial Law Review, Supplement, Corporate Governance.
Higgs, D., 2003, Review of the Role and Effectiveness of Non-Executive Directors,
The Department of Trade and Industry: London. Also available at:
www.dti.gov.uk/cld/non_exec_review.
References Victoria University
266
Hilmer Report, 1993, Strictly Boardroom: Improving Corporate Governance to
Enhance Corporate Performance, Hilmer Committee,
Horton, T., Le Grand, C., Murray, W., Ozier, T., and Parker, D., 2000, Infonnation
Security Management and Assurance: A Call to Action for Corporate Governance,
Altamonte Springs, FL: Institute of Itn Auditors.
Houghton, K., and Ikin, C., 2001, Auditor provided non-audit services: Modelling
fees and willingness to buy, Working Paper,
http://aaahq.org/audit/midyear/02midyear/papers/APNAS14Dec.pdf, 29/08/2004.
____, Dolley, C., Jubb, C., and Monroe, G., 2002, Auditor sepecialization and audit
quality status: Do both ‘premium’ and ‘discount’ specialist suppliers exist? Working
Paper, University of Melbourne: Melbourne.
Hun-Tong, T., and Terence, B., 2003, Effective of authoritative guidance availability
and audit committee effectiveness on auditors' judgments in an auditor-client
negotiation context, Accounting Review, Vol.78, iss.3, pp.801-818.
Hurtt, D., Kreuze, J., and Langsam, S., 1999, Blue Robin panel reports: How you
must improve your audit committee, The Journal of Corporate Accounting and
Finance, Vol.11, Iss.1, pp.115-125.
Hussey, J., and Hussey, R., 1997, Business Research, London: Macmillan Press LTD.
Jamieson, B., 1980, Audit Committees, Australian Society of Accountants,
Bulletin.25, pp.42-55.
Jensen, R., 1982, The competition in auditing: An assessment-a discussion, Fourth
Symposium on Auditing Research, pp.452-466. Urbana, IL: University of Illinois at
Urbana Champaign.
____, and Meckling, W, 1976, Theory of the firm: Managerial behavior, agency costs
and ownership structure, Journal of Financial Economics, Vol.3, pp.305-360.

References Victoria University
267
Johnson, P., Jamal, K., and Berryman, R., 1991, Effects of framing on auditor
decisions, Organizational Behavior and Human Decision Processes, Vol.50, pp.75-
105
Johnson, W., and Lys, T., 1990, The market for audit services: Evidence from
voluntary auditor changes, Journal of Accounting and Economics, Vol.12, Iss.1,
pp.281-308.
Joint Committee on Corporate Governance, 2001, Beyond Compliance: Building a
Governance Culture, Interim Report of the Joint Committee on Corporate
Governance.
Kalbers, L.,1992a, An examination of the relationship between audit committees and
external auditors, The Ohio CPA Journal, Vol.51, Iss.6, pp.19-27.
____,1992b, Audit committees and internal auditors, Internal Auditor, Vol.49, Iss.6,
pp.37-44.
____, and Fogarty, T., 1993, Audit committee effectiveness: An empirical
investigation of the contribution of power. Auditing: A Journal of Practice and
Theory, Vol.12, Iss.1, pp.24-49.
____, and Fogarty, T., 1998, Organizational and economic explanations of audit
committee oversight, Journal of Managerial Issues, Vol.10, Iss.2, pp.129-150.
Klein, A., 2002a, Audit committees, board of director characteristics and earnings
management, Journal of Accounting and Economics, Vol.33, Iss.3, pp.375-400.
____, 2002b, Economic determinants of audit committee independence, Accounting
Review, Vol.77, Iss.2, pp.435-452.
Klein, B., and Leffler, K., 1981, The role of marker forces in assuring contractual
performance, The Journal of Political Economy, Vol.89, Iss.4, pp.615-641.

References Victoria University
268
Knapp, M., 1987, An empirical study of audit committee support for auditors
involved in technical disputes with client management, Accounting Review, Vol.62,
Iss.3, pp.578-588.
____, 1991, Factors that audit committee members use as surrogates for audit quality,
Auditing: A Journal of Practice and Theory, Vol.10. Iss.1, pp.35-52.
Kranli, A., Pavur, H., Guynes, R., 2000, Introduction to Business Statistic, 5th
Edition), Ohio: South Western College Publishing.
Kunitake, W., 1983, Auditor changes by audit committees and ousider directors,
Okron Business and Economic Review, Fall, pp.48-52.
Law, J., 1992, Notes on the theory of the actor-network: Ordering, strategy and
heterogeneity, Systemic Practice and Action Research, Vol.5, Iss.4, pp.379-393.
Leddy, T., 1982, The competition in auditing: An assessment-a discussion, Fourth
Symposium on Auditing Research, pp.467-482. Urbana, IL: University of Illinois at
Urbana Champaign.
Lee, T. and Stone, M., 1997, Economic agency and audit committees: Responsibilities
and membership composition. International Journal of Auditing, Vol.1, Iss.2, pp.97-
116.
Levitt, A., 1998, The Numbers Game, Speech by Chairman Arthur Levitt, U.S.
Securities and Exchange Commission, at New York University's Center for Law and
Business. New York, NY: SEC.
Levitt, A., 2000, Renewing the Covenant With Investors, Speech by Chairman Arthur
Levitt, U.S. Securities and Exchange Commission, at New York University's Center
for Law and Business, New York, NY: SEC.
Lublin, J., and MacDonald, E., 1998, Scandals signal laxity of audit panels. Wall
Street Journal (July 17): BI, B5.

References Victoria University
269
Lynn, S., 1985, Audit committees in review: Their impact on the CPA selection
process, The Ohio CPA Journal, Spring, pp.6-9.
Maassen, G., (2004) Corporate governance, Magazine of Financial Economic
Management, Vol.10, pp.1-32.
MacDonald Commission, 1987, Report of the Commission to Study the Public's
Expectation of Audits (MacDonald Report), Toronto: Canadian of Chartered
Accountants.
Marrian, I., 1988, Audit Committees, The Institute of Chartered Accountants of
Scotland: Edinburgh.
Mason, J., 1996, Qualitative Research, Thousand Oaks: Sage Publications.
Matthews, D., 2002, The use of the postal questionnaire in accounting history
research, Accounting, Business and Financial History, Vol.12, Iss.1, pp.113-129.
Mautz, R., and Neumann, F., 1970, Corporate Audit Committees: Policies and
Practices, Cleveland, OH: Ernst and Ernst.
McDaniel, L., Martin, R., and Maines, L., 2002, Evaluating financial reporting
quality: The effects of financial expertise versus financial literacy, Accounting
Review, Vol.77. Iss.4 (Supplement), pp.139-167.
McKee, T., 1979, An 1870 corporate audit committee, Accounting Historians
Journal, Vol.6, Iss.2, pp.61-68.
McMullen, D., 1996, Audit committee performance: An investigation of the
consequences associated with audit committees, Auditing: A Journal of Practice and
Theory, Vol.15, Iss.1, pp.87-103.
____, and Raghunandan, K., 1996, Enhancing audit committee effectiveness. Journal
of Accountancy. Vol.182, Iss.2, pp.79-81.
Menon, K., and Williams, D., 1991, Auditor credibility and initial public offerings,
Accounting Review, Vol.66, Iss.2, pp.313-332.

References Victoria University
270
____, 1994, The use of audit committees for monitoring, Journal of Accounting and
Public Policy, Vol.13, Iss.2, pp.121-139.
Merchant, K., 1987, How and why firms disregard the controllability principle? In
Bruns, W., and Kaplan, R., 1987, Accounting and management: Field study
perspectives, Boston: Harvard Bus, School Press, pp.316-338.
Meyer, J., and Rowan, B., 1977, Institutionalized organizations: Formal structure as
myth and ceremony, American Journal of Sociology, Vol.83, pp.340.
Mikol, A., and Standish, P., 1998, Audit independence and nonaudit services: a
comparative study in differing British and French perspectives, European Accounting
Review, Vol.7, Iss.3, pp.541-569.
Millstein, I., 1999, Introduction to the report and recommendations of the Blue Robin
Committee on improving the effectiveness of corporate audit committees, The
Business Lawyer, Vol.54, Iss.3, pp.1057-1066.
Mintzberg, H., 1983, Power in and Around Organizations, Prentice-Hall, Englewood:
N.J.
National Association of Corporate Directors (NACD), 2000, Report of the NACD
Blue Robin Commission on Audit Committees: A Practical Guide, Washington, DC:
National Association of Directors.
Norusis, M., 1998, SPSS 8.0 Guide to Data Analysis, Prentice-Hall, Inc: USA.
O'Keefe, T., King, R., and Gaver, K., 1994, Audit fees, industry specialization, and
compliance with GAAS reporting standards, Auditing: A Journal of Practice and
Theory, Vol.13, Iss.2, pp.41-55.
Oppenheim, A., 2000, Questionnaire Design, Interviewing and Attitude Measurement,
2nd Edition, Continuum: London.

References Victoria University
271
Ow-Yong, K., and Guan, C., 2000, Corporate governance codes: A comparison
between Malaysia and the UK, Corporate Governance: An International Review,
Vol.8, Iss.2, pp.125-132.
Palmrose, Z., 1986, The effect of non-audit services on the pricing of audit services:
Further evidence, Journal of Accounting Research, Vol.24, Iss.2, pp.405-411.
Pany, K., and Reckers, P., 1983, Auditors independence and non-audit services:
Directors views and their policy implications, Journal of Accounting and Public
Policy, Spring, pp.43-62.
Parkash, M., and Venable, C., 1993, Auditee incentives for auditor independence:
The case of nonaudit services, Accounting Review, Vol.68, Iss.1, pp.113-133.
Patzer, G., 1995, Using Secondary Data in Marketing Research: United States and
Worldwide, Green Publishing Group, Westport: CT.
Pearson, M., Ryans, J., 1982, Perceptions of an auditors-management conflict, Review
of Business and Economic Research, Vol.17, pp.1-10.
Pfeffer, J., 1982, Organizations and Organization Theory, Boston: Pitman.
Pincus, K., Rusbarsky, M., and Wong, J., 1989, Voluntary formation of corporate
audit committees among NASDAQ firms, Journal of Accounting and Public Policy,
Vol.8, Iss.4, pp.239-265.
Pomeranz, F., 1997, Audit committees: where do we go from here? Managerial
Auditing Journal, Vol.12, Iss.6, pp.281-284.
Porter, B., and Gendall, P., 1998, Audit committees in private and public sector
corporate in New Zealand: An empirical investigation, International Journal of
Auditing, Vol.2, Iss.1, pp.35-48.
PricewaterhouseCoopers (PWC), 2002, The Sarbanes-Oxley Act of 2002 and Current
Proposals by NYSE, AMEX and NASDAQ, Board and Audit Committee Roles in the
Era of Corporate Reform: A White Paper. Available at:

References Victoria University
272
http://www.pwcglobal.com/Extweb/NewCoAtWork.nsf/docid/D0D7F79003C6D6448
5256CF30074D66C/$FILE/Final_SO_WP_2-BoardsAC.pdf
Race, Z., and Farmer, L., 1994, The changing role of the audit committee, Internal
Auditing (Spring), pp.10-20.
Raghunandan, K., Read, W., and Rama, D., 2001, Audit committee composition, grey
directors, and interaction with internal auditing, Accounting Horizons, Vol.15, Iss.2,
pp. 105-118.
Ramsay, I., 2001, Independence of Australian company auditors: Review of current
Australian requirements and proposals for reform (Ramsay Report), Commonwealth
of Australia: Canberra, www.treasury.gov.au. Access date: 16/05/2003.
Ra-ndan, I., Read, W., and Ram, D., 2001, Audit committee composition, `grey
directors,' and interaction with internal auditing, Accounting Horizons, Vol.15, Iss.2,
pp.105-118.
Raven, B., 1974, The comparative analysis of power and preference, In Tedeschi, J.,
Perspectives on Social power, pp.150-167, Chicago; Aldine.
Reda, A., 1992, Statistical methods for educational and psychological research: Basic
concepts, Unpublished Paper, School of Education, University of Wales.
Reinstein, A., 1980, A Conceptual Framework for Audit Committees, PhD Thesis,
University of Kentucky, USA.
____, and Luecke, R., 2001, AICPA standard can help improve audit committee
performance, Healthcare Financial Management, Vol.55, Iss.8, pp.56-60.
____, Callaghan, J., and Braiotta, L., 1984, Corporate audit committees: Reducing
directors' legal liabilities, Journal of Urban Law, Vol.61, pp.375-389.
Reynolds, J., and Francis, J., 2000, Does size matter? The influence of large clients on
office-level auditor reporting decisions, Journal of Accounting and Economics,
Vol.30, pp.375-400.

References Victoria University
273
Rezaee, Z. and Lander, G., 1993, The internal auditor's relationship with the audit
committee, Managerial Auditing Journal, Vol.8, Iss.3, pp.35-40.
____, and Farmer, L., 1994, The changing role of the audit committee, Internal
Auditing, Vol.10, Iss.4, pp.10-20.
Rickard, P., 1993, Audit committees - the next generation, Australian Accountant,
Vol.63, Iss.10, pp.35-38.
Rittenberg, L., and Nair, R., 1994, Improving the Effectiveness of Audit Committees,
Institute of Management Accountants: USA.
____, 1993, Improving the Effectiveness of Audit Committees, Montvale, NJ: institute
of Management Accountants.
Romano, R., 1989, What went wrong with directors' and officers' liability insurance,
Delaware Journal of Corporate Law, Vol.14, Iss.1, pp.1-33.
Sahlman, W., 1990, Why sane people shouldn't serve on public boards, Harvard
Business Review, May-June, pp.28-35.
Salant, P., and Dillman, D., 1994, How to Conduct Your Own Survey, John Wiley &
Sons, Inc: USA.
Sarbanes-Oxley Act, 2002, An Act to Protect Investors by Improving the Accuracy
and Reliability of Corporate Disclosures Made Pursuant to the Securities Laws, and
for Other Purposes. USA,
http://news.findlaw.com/hdocs/docs/gwbush/sarbanesoxley072302.pdf.
Sarre, R., Doig, M., and Fiedler, B., 2001, Reducing the risk of corporate
irresponsibility: The trend to corporate social responsibility, Accounting Forum,
Vol.25, iss.3, pp.300-317.
Saudi Arabian Monetary Agency (SAMA), 1994, Guidance for organizing audit
committees, http://www.sama-
ksa.org/ar/control/procedure/guidlinesForCommittee.pdf, 27/08/2005.

References Victoria University
274
Saudi Ministry of Commerce (SMC), 1990, Public Accountants Regulation,
http://www.commerce.gov.sa/circular/14-1.asp#2, 20/09/2003.
____, 1994, New regulation regarding audit committees for Saudi Arabian corporate
sector, Saudi Accounting Magazine (SAM), Vol.4, pp.15-18.
Saudi Organization for Certified Public Accountants (SOCPA), 2003, Improving audit
committee effectiveness. www.socpa.org.sa. Access date: 17/05/2003.
Saunders, M., Lewis, P., and Thornhill, A., 2000, Research Methods for Business
Students. 2nd Edition, Pearson Education Limited: England.
Scarborough, P., Rama, D., and Raghunandan, K., 1998, Audit committee
composition and interaction with internal auditing: Canadian evidence, Accounting
Horizons, Vol.12, Iss.1, pp.51-62.
Schroeder, M., Solomon, L., and Vickery, D., 1986, Audit quality: The perceptions of
audit-committee chairpersons and audit partners, Auditing: A Journal of Practice and
Theory,Vol.5. Iss.2, pp.86-94.
Sclafane, S., 1997, SEC uncertain on securities reform impact, National Underwriter,
Vol.101, pp.44-72.
Shabani, M., 1995, Audit committees: the guidelines for choosing its members should
be reconsidered, Arriyadh Newspaper, 11 November, p46.
Sharma, D., and Sidhu, J., 2001, Professionalism vs. Commercialism: The
association between non-audit services (NAS) and audit independence, Journal of
Business Finance & Accounting, Vol.28, Iss.5, pp.595-629.
Shockley, R., 1982, Perceptions of audit independence: A conceptual model, Journal
of Accounting, Auditing and Finance, Vol.5, Iss.2, pp.126-43.
____, and Holt, R., 1983, A behavioral investigation of supplier differentiation in the
market for audit services, Journal of Accounting Research, Vol.21, Iss.2, pp.545-564.

References Victoria University
275
Simon, D., 1997, Additional evidence on the large audit-firm fee premium as an
indication of auditor quality, Journal of Applied Business Research, Vol.13, Iss.4,
pp.21-33.
Simunic, D., 1984, Auditing, consulting, and auditor independence, Journal of
Accounting Research, Vol.22, pp.679-702.
____, and Stein, M., 1987, Product differentiation in auditing: A study of auditor
choice in the market for unseasoned new issues, Canadian Certified General
Accountants' Research Foundation.
Smith, M., 2003, Research Methods in Accounting, Thousand Oaks: Sage
Publications.
Solomon, L., 1978, Restructuring the corporate board of directors: Fond hope: Faint
promise? Michigan Law Review, Vol.76, Iss.4, pp.581-610.
____, Shields, M., and Whittington, O., 1998, What do industry-specialist auditors
know? Working paper, University of Illinois.
Sommer, A., 1991, Auditing audit committees: An educational opportunity for
auditors, Accounting Horizons, Vol.5, Iss.2, pp.91-93.
Song, J., and Windram, B., 2000, The effectiveness of audit committees: evidence
from UK companies in the post-Cadbury period, Presented at the British Accounting
Association Annual Conference, University of Exeter.
Sori, S., and Karbhari, Y., 2006, Audit committee and auditor independence: Some
evidence from Malaysia, Working Paper,
http://papers.ssrn.com/sol3/papers.cfm?abstract_id=876410, 22/5/2006.
Spangler, W., and Braiotta, L., 1990, Leadership and corporate audit committee
effectiveness, Group and Organization Studies, Vol.15, Iss.2, pp. 134-157.
Spira, L., 1998, An evolutionary perspective on audit committee effectiveness,
Scholarly Research and Theory Papers, Vol.6, Iss.1, pp. 29-38.

References Victoria University
276
____, 1999, Ceremonies of governance: perspectives on the role of the audit
committee, Journal of Management and Governance, Vol.3, pp.231-260.
Sridhar, V., 2002, Enron: A business model of the times, Third World Resurgence,
Vol.139/140, pp.8-9.
Stevenson, E., Lamarre, I., and Laurin, A., 2002, Summary of the final report of the
Joint Committee on Corporate Governance, Working Paper,
http://www.laverydebilly.com/pdf/bulletins/020105a.pdf, 16/05/2004.
Sutton, M., 1997, Auditor independence: The challenge of fact and appearance,
Accounting Horizons, Vol.11, Iss.1, pp.86-91.
Teoh, H., and Lim, C., 1996, An empirical study of the effects of audit committees,
disclosure of non-audit fees, and other issues on audit independence: Malaysian
evidence, Journal of International Accounting, Auditing and Taxation, Vol.5, Iss.2,
pp.231-248.
Toronto Stock Exchange Committee on Corporate Governance, 1994, Dey Report:
Where were the Directors? Toronto Stock Exchange: Canada
Treadway Commission, 1987, Report of the National Commission on Fraudulent
Financial Reporting, Washinton, DC: National Commission on Fraudulent Financial
Reporting.
Turley, S., and Zaman, M., 2004, The corporate governance effects of audit
committees, Journal of Management and Governance, Vol.8, Iss.3, pp.305-332.
Turnbull Report, 1999, Internal Control: Guidance for Directors on the Combined
Code, Chairman, Nigel Turnbull, London: ICAEW.
Turnbull, S., 1980, Audit committees – the chief executive’s viewpoint, Australian
Society of Accountants, Bulletin.25, pp.14-24.

References Victoria University
277
Turpin, R., and DeZ,oort, F., 1998, The characteristics of firms that voluntarily
include an audit committee report in their annual report, International Journal of
Auditing, Vol.2. Iss.1, pp.35-48.
US Securities and Exchange Commission (SEC), 1972, Standing audit Committees
composed on non-executive directors, Accounting Series Release No. 123,
www.sec.gov/rules/final/33-8220.htm, 03/02/2006.
____, 1980, Staff Report on Corporate Accountability, Washington, D.C.: US
Government Printing Office.
____, 1999a, The Accounting Bulletin No. 99: Materiality, Washington, DC:
Securities and Exchange Commission.
____, 1999b, Final Rule: Audit Committee Ddisclosure, Washington, DC: Securities
and Exchange Commission.
____, 2000, Audit committee disclosure: Release No. 34.42266,
http://www.sec.gov/rules/final/34-42266.htm , 27/01/2006.
____, 2003a, Disclosure Required by Sections 406 and 407 of the Sarbanes-Oxley Act
of 2002, http://www.sec.gov/rules/final/33-8177.htm.
____, 2003b, Standards Relating to Listed Company Audit Committees,
http://www.sec.gov/news/press/2003-43.htm.
____, 2003c, SEC Requires Exchange Listing Standards for Audit Committees,
http://www.sec.gov/news/press/2003-43.htm.
Vafeas, N., 2001, Research notes on audit committee appointments, Auditing: A
Journal of Practice and Theory, Vol.20, Iss.1, pp.197-207.
Vanasco, R., 1994, The audit committee: an international perspective, Managerial
Auditing Journal, Vol.9, Iss.8, pp.18-42.

References Victoria University
278
Vdcs, N., 2001, On audit committee appointments, Auditing: A Journal of Practice
and Theory, Vol.20, Iss.1, pp.197-207.
Verschoor, C., 1993, Benchmarking the audit committee, Journal of Accountancy,
Vol.176, Iss.3, pp.59-64.
Vicknair, D., Hickman, K., and Carries, K., 1993, A note on audit committee
independence: Evidence from the NYSE on grey area directors, Accounting Horizons,
Vol.7. Iss.1, pp.53-57.
Wallace, W., 1987, The economic role of the audit in free and regulated markets: A
review, Research in Accounting Regulation, Vol.1, pp.7-34.
Watkins, A., Hillison, W., and Morwcroft, S., 2004, Audit quality: A synthesis of
empirical evidence, Journal of Accounting Literature, Vol.23, pp.153-193.
Watts, R., and Zimmerman, J., 1986, Positive Accounting Theory, Englewood Cliffs:
Prentice Hall.
Weber, M., 1968, Economy and Society, Totowa, N.J.: Bedminster.
Weil, R., Coates, D., and Marais, M., 2005, Audit committee financial literacy: A
work in progress, Working Paper,
http://papers.ssrn.com/sol3/papers.cfm?abstract_id=680281, 22/5/2006.
Weisberg, H., and Bowen, B., 1977, An Introduction to Survey Research and Data
Analysis, W.H. Freeman and Company: San Francisco.
Wild, J., 1996, The audit committee and earnings quality, Journal of Accounting,
Auditing and Finance, Vol.11, Iss.2, pp.247-276.
Willekens, M., Bauwhede, H. and Gaeremynck, A., 2004, Voluntary audit committee
formation and practices among Belgian listed companies, International Journal of
Auditing, Vol.8, Iss.3, pp. 207-222.
Williams, D., 1988, The potential determinants of auditor change, Journal of
Business, Finance and Accounting, Vol.15, Iss.2, pp.243-262.

References Victoria University
279
Williams, H., 1977, Audit committees - the public sector's view, Journal of
Accountancy, Vol.144, Iss.3, pp.71-75.
Wines, G., 1994, Auditor independence, audit qualifications and the provision of
non-audit services: A note, Accounting and Finance, Vol.34, pp.75-86.
Wolnizer, P., 1995, Are audit committees red herrings? ABACUS, Vol.31, Iss.1,
pp.45-66.
Woolf, E., 1997, Auditing Today, 6th Edition, Prentice Hall Europe: UK.

Appendix 1 Victoria University
280
APPENDIXES
Appendix 1:Questionnaire- English
25th June 2004
Dear an audit committee member:
I request your kind support by responding to this questionnaire, which is part of my Doctor of Philosophy degree by research at Victoria University of Technology in Melbourne, Australia.
This research aims to examine and compare audit committee effectiveness in Australian and Saudi listed companies. A reply to the attached questionnaire would help to ensure the validity of the results of this research.
While your cooperation in completing the questionnaire is valued and appreciated, your participation is voluntary. The only people to have access to the collected data are my supervisors and myself. The results will be used only in an aggregated form and therefore your anonymity and the confidentiality of your response are assured.
The questionnaire should take less than 10 minutes to complete and should be answered by audit committee members.
Please return the completed questionnaire to the contact person in your company, place it in the reply paid envelope or fax it to 06-3800565. The time I can spend in Saudi Arabia is limited and I would greatly appreciate it if you could return the questionnaire within 15 days.
Thank you very much for your kindly participation.
Yours truly,
Ibrahim Al-Lehaidan
Research Student
Any queries regarding the questionnaire, please feel free to contact me on (056113445), fax (06-3800565) or e-mail me at: [email protected] or my main supervisor Professor Robert Clift at: [email protected]. If you have any queries or complaints about the way you have been treated, you may contact the Secretary, University Human Research Ethics Committee, Victoria University of Technology, P.O. Box 14428 MCMC, Melbourne, 8001, (Telephone No: 00613-96884710).

Appendix 1 Victoria University
281
25th June 2004
Dear an audit committee members
I am writing to confirm that Mr. Ibrahim Al-Lehaidan is planning to do his
empirical study.
Mr. Al-Lehaidan is pursuing his PhD in Accounting at the Victoria University
in Australia, and he is attempting to explore Audit Committee Effectiveness with
special reference to Australia and Saudi Arabia.
I would be most grateful if you help him to fill in the attached questionnaire.
This data is necessary to complete his doctoral thesis.
Thank you for your co-operation. If you have any further information, please
contact me at the above address.
Yours sincerely,
Dr. Obaid Al-Motairy
Chairman of the Department of Accounting College of Economics & Business King Saud University Qasseem, 81888 P.O.Box 6033 (ALMELIDA) At Work TEL and Fax 0096663800565 - Mobile 0096655468670 - Home 0096663612182 Email: [email protected]

Appendix 1 Victoria University
282
Section 1: General Questions The following questions are general questions regarding the audit committee. Please tick only one box in every question. 1- How many members are on the audit committee including you?
_ 2 members _ 3 members _ More than 3, please state ____ members.
2- How many non-executive directors are on the audit committee? _ None _ One _ Two _ More than 2, please state ____
3- Are you the chairman of the audit committee? _ Yes _ No, then go to Q5 4- Are you the chairman of the Board of Directors?
_ Yes _ No
5- How many meetings have been held during the financial year ended on 31/12/2003?
_ 1 Meeting _ 2 meetings _ 3 meetings _ More than 3, please state ____
6- Does the audit committee have a charter? _ Yes _ No, then go to Q8 7- Please rate the audit committee independence from management,
_ Very independent _ Independent _ Flexible _ dependent

Appendix 1 Victoria University
283
8- Does the audit committee have at least one member who is a qualified accountant or a certified public accountant? _ Yes _ No 9- Financial literacy means the ability of audit committee members to read and understand financial statements, please rate the financial literacy of the audit committee?
_ Strong _ Good _ Average _ Weak
Section 2: Specific Questions.
The following questions are specific questions regarding the audit committee
members. Please tick the appropriate boxes in each question.
10- What are your qualifications? (You can tick more than one box) _ Bachelor Degree in Accounting or Finance _ Certificate of Public Accounting (CPA) _ Postgraduate degree in Accounting or Finance _ Other, please state _____________________________ 11- You describe yourself as (You can tick more than one box) _ A member of a recognized professional body
_ Having banking or investment management experience _ Holding or having held the position of Chief Executive Officer _ Having directory memberships in other firms.
12- Please rate your understanding of the financial statements? _ Strong _ Good _ Average _ Weak

Appendix 1 Victoria University
284
13- Other than being an audit committee member, how do you classify yourself in relation to the company? (You can tick more than one box)
_ Major customer _ Major supplier _ A management advisor _ A relative to an executive director _ Other, please state _________________________________ _ None
14- Did you work as an employee or an executive in this company in the last 5 years? _ Yes _ No
Section 3: (optional)
The researcher is interested in conducting short interviews with audit committee members through the phone, Please tick yes if you wish to participate.
_ Yes, please provide contact details Name _ _ Phone - _ _ No
Do you wish to get a copy of the results of this study via Email? _ Yes, Email _ _
_ No

Appendix 1 Victoria University
285
Appendix 2: Questionnaire- Arabic
عزيزي عضو لجنة المراجعة المحترم
:وبعد, السالم عليكم ورحمة اهللا وبرآاتة
ثي لدرجة الدآتوراه أرجو من سعادتكم التكرم بمساعدتي على ملء هذه االستبانة والتى تعد جزءا مهما الستكمال بح
.بجامعة فكتوريا في مدينة ملبورن االسترالية
ويهدف البحث الى فحص ومقارنة فعالية لجان المراجعة في الشرآات المساهمة التى يتم تداول اسهمها في االسواق
ة سيساعد على تأآيد ومن ثم فان قيامكم بملء االستبانة المرفق, المالية في آل من المملكة العربية السعودية وأستراليا
وبما ان الهدف من هذه االستبانة هو جمع بيانات عن خصائص لجان المراجعة في . صالحية نتائج هذا البحث
الشرآات المساهمة في المملكة العربية السعودية فأرجوا من سعادتكم في حالة آونكم عضو في اآثر من لجنة مراجعة
.ملء استبانة لكل شرآة لكم عضوية فيها
هذا مع مالحظة ان , بالرغم من ان ملء هذه االستبانة امر تطوعي فاننى اقدر لكم تعاونكم النجاح هذا البحثو
االطالع على المعلومات الواردة في االستبانة سوف يقتصر على الباحث والمشرفين على الرسالة فقط مما يعنى ان
كل اجمالي من دون تحديد اسماء الشرآات محل سرية ردودآم محفوظة ومؤآدة وان نتائج البحث سيتم عرضها بش
.الدراسة
ولمعرفتى التامة بكثرة مشاغلكم ووقتكم الثمين فقد تم تصميم هذه االستبانة لتكون قصيرة وواضحة حيث ان الوقت
.المقدر لملئها اقل من عشر دقائق
او وضعها في المظروف البريدي , وبعد االنتهاء من ملء االستبانة ارجوا اعادتها الى وسيط االتصال في الشرآة
آما احيطكم علما بان الوقت , حسب ماترونه مناسب لكم063800565: او ارسالها على الفاآس رقم, المدفوع القيمة
.وذلك آسبا للوقت, لذا أرجوا التكرم باعادتها خالل خمسة عشر يوما, المتاح لى في المملكة العربية السعودية محدود
المخلص. كمشاآرين لكم تعاون
ابراهيم اللحيدان
او عن طريق البريد االلكتروني 0506113445ى في حالة وجود اى استفسار يرجى التصال بي هاتفيا علcom.hotmail@allehaidan او االتصال بالمشرف على الرسالة البرفسور Robert Clift عن طريق البريد االلكتروني
[email protected] .يرجى االتصال , في حالة وجود اى استفسار او شكوى للطريقة التى تمت معاملتك بها في هذه االستبانة P.O. Box 14428 او على البريد 0061396884710: بسكرتيرة لجنة اخالقيات البحوث العلمية في جامعة فكتوريا على هاتف
MCMC, Melbourne, 8001, Australia

Appendix 1 Victoria University
286
و لجنة المراجعة المحترمالسيد العزيز عض
:وبعد, السالم عليكم ورحمة اهللا وبرآاتة
ة يرغب فان السيد ابراهيم بن علي اللحيدان المبتعث لدراسة الدآتوراه في جامعة فكتوريا في مدينة ملبورن االسترالي
من سعادتكم التكرم بتعبئة االستبانة المرفقة التى تعد جزءا مهما الستكمال بحثه لدرجة الدآتوراه حيث يهدف البحث
الى تقييم ومقارنة فعالية لجان المراجعة في الشرآات المساهمة التى يتم تداول اسهمها في االسواق المالية في آل من
.االمملكة العربية السعودية واسترالي
الن هذه البيانات مهمة جدا الستكمال بحثه مما يساعد على تطوير , وساآون ممتنا جدا لمساعدته في ملء هذه االستبانة
.المهنة واثراء عملية البحث العلمي
.شاآرين لكم تعاونكمو واذا آان لديكم اى استفسارات فالرجاء عدم التردد بالتصال بي
عبيد المطيري\ د
رئيس قسم المحاسبة
063800708 او 063800565 \تلفون وفاآس

Appendix 1 Victoria University
287
أسئلة عامة: الجزء األول
أمام اإلجابة فضًال ضع عالمة . امة عن لجنة المراجعة في الشرآةيتضمن هذا الجزء أسئلة ع : المناسبة لكل سؤال من األسئلة التالية
آم عدد أعضاء لجنة المراجعة ؟-1
ثالثة أعضاء عضوين
أعضاء____ الرجاء حدد . أآثرمن ثالثة أعضاء
ن لجنة المراجعة ؟ آم عدد المدراء غير التنفيذيين ضم-2 و واحدعض اليوجد
أعضاء____ حدد فضال. وينأآثرمن عض عضوين
هل أنت رئيس لجنة المراجعة ؟-3 إذهب إلى السؤال الخامس. ال نعم
هل أنت رئيس مجلس اإلدارة ؟-4 ال نعم
آم عدد إجتماعات لجنة المراجعة التي إنعقدت خالل السنة المالية المنتهية في - 5 م ؟31/12/2003
إجتماعين اجتماع واحد
إجتماعات____ حدد فضًال. ثالث إجتماعاتأآثرمن ثالثة إجتماعات
جعة؟ هل هناك دليل تنظيمي مكتوب للجنة المرا-6 ال نعم
آيف تقيم استقاللية لجنة المراجعة عن إدارة الشرآة ؟-7 مستقلة مستقلة تمامًا
غير مستقلة مرنة
هل تتضمن لجنة المراجعة عضوًا واحدا على األقل يحمل مؤهل علمي في المحاسبة أو -8 لمراجعة القانونية ؟ا
ال نعم

Appendix 1 Victoria University
288
إذا آانت المعرفة المالية تعني قدرة أعضاء لجنة المراجعة على قراءة وفهم القوائم -9
المالية، فكيف تقيم المعرفة المالية للجنة المراجعة ؟ جيدة ممتازة
يفة ضع متوسطة
أسئلة خاصة: الجزء الثاني أمام فضًال ضع عالمة . يتضمن هذا الجزء أسئلة خاصة بك آعضو في لجنة المراجعة في الشرآة
: اإلجابة المناسبة لكل سؤال من األسئلة التالية )يمكن إختيار أآثر من إجابة واحدة( ما هي مؤهالتك العلمية ؟ -10
أو التمويل البكالريوس في المحاسبة
)CPA( شهادة مراجعة قانونية
دراسات عليا في المحاسبة أو التمويل
______________________________________حدد فضًال . خرىأ
)يمكن إختيار أآثر من إجابة واحدة( هل؟ -11 أنت عضو في أحد الهيئات المالية المتخصصة؟
ة البنكية أو إدارة اإلستثمار؟ لديك خبرة في اإلدار
تعمل أو سبق أن عملت في وظيفة مدير إدارة تنفيذية؟
أنت عضو مجلس إدارة أو عضو لجنة مراجعة في شرآات أخرى؟
آيف تقيم فهمك للقوائم المالية ؟-12 جيدة ممتازة
ضعيفة متوسطة
ف آونك عضوًا في لجنة المراجعة، آيف تصنف نفسك في عالقتك بالشرآة؟ بخال-13 )يمكن إختيار أآثر من إجابة واحدة(
مورد رئيسي عميل رئيسي
قريب لمدير تنفيذي إستشاري لإلدارة
ال توجد أي عالقة _____________________فضًال حدد. أخرى

Appendix 1 Victoria University
289
هل سبق أن عملت آموظف أو مدير تنفيذي في الشرآة خالل الخمس سنوات األخيرة -14 ؟
نعم ال
)إختياري : ( الجزء الثالث
الباحث في عمل مقابالت قصيرة مع أعضاء لجان المراجعة عن طريق يرغب-15 هل ترغب بالمشارآة . الهاتف
: نعم، فضال تزويدنا بــ _ _ اإلسم
- _ رقم الهاتف
ال
هل ترغب في الحصول على نسخة ملخصة من نتائج هذه اإلستبيان عن طريق البريد -16 اإللكتروني؟
_ _) Emailُ) نعم،البريد اإللكتروني
ال