Embed Size (px)
Citation preview

Aubrey GunterGreen Team - DistillationCollege of Engineering and Computer ScienceUniversity of Tennessee at Chattanooga615 McCallie AvenueChattanooga, TN 37421
To: Dr. Jim Henry, P.E.Professor of EngineeringUniversity of Tennessee at Chattanooga615 McCallie AvenueChattanooga, TN 37421
Dr. Henry:
The following report provides a detailed account of the Green Team’s experimental work and all otherrelevant information related to their study of the distillation column at the University of Tennessee atChattanooga located in Grote room 115.
Aubrey GunterGreen TeamSenior Undergraduate StudentChemical and Environmental EngineeringUniversity of Tennessee at Chattanooga

Distillation Column Experiments, Batch and ContinuousUniversity of Tennessee at Chattanooga
College of Engineering and Computer ScienceEngineering 435 Chemical Process Laboratory
Section 001Author: Aubrey Murray Gunter
Co-Authors: Alok Patel, Paul PearmanTo: Dr. Jim Henry
Cc: Dr. Frank JonesOctober 24, 2002

ABSTRACT:
A distillation column was studied at the University of Tennessee at Chattanooga, School of Engineeringand Computer Science for the binary system of methanol and water.
The purpose of this study of the distillation column was to determine the composition of methanol in thedistillate collected for various reflux percentages under conditions of continuous and batch distillation.Two methods were used to determine the composition of the distillate, density and temperature.
The distillate flow rate for various reflux percentages under conditions of continuous and batch distillationwas also studied. Two methods were used to study the distillate flow rate. The first method was performedby manually observing the collected distillate level over time. The second method involved a flow meterand the LabVIEW program that calculates the flow rate.
The composition of each tray for various reflux percentages under conditions of continuous and batchdistillation was also studied. The temperature method was used to study this tray composition.
An energy study was also performed on the condenser.
The relationship between the manual study and computer study of distillate flow rate is given in thefollowing equation:
QManual = (1.68±1.08)QLabVIEW - 188(±11.5),
where Q is the flow rate is L/min.
The methanol composition of the distillate and for each tray was found to have a proportional relationshipto the reflux percentage for both batch distillation and continuous distillation experiments.
The energy study revealed that the energy removed by the condenser is higher for batch distillation than forcontinuous distillation.

TABLE OF CONTENTS: PageIntroduction…………………………………………………………………………………xTheory………………………………………………………………………………………xEquipment…………………………………………………………………………………..xProcedure……………………………………………………………………………………xResults………………………………………………………………………………………xDiscussion of Results………………………………………………………………………..xConclusions………………………………………………………………………………….xRecommendations…………………………………………………………………………...xNomenclature………………………………………………………………………………..xReferences…………………………………………………………………………………...xAppendices…………………………………………………………………………………..x

INTRODUCTION:
The purpose of this study of the distillation column by the Green Team was to determine the compositionof the distillate collected for various reflux percentages under conditions of continuous and batchdistillation. Two methods were used to determine the composition of the distillate, density andtemperature.
The Green Team also studied the distillate flow rate for various reflux percentages under conditions ofcontinuous and batch distillation. Two methods were used to study the distillate flow rate. The firstmethod was performed by manually observing the collected distillate level over time. The second methodinvolved a flow meter and the LabVIEW program that calculates the flow rate.
The composition of each tray for various reflux percentages under conditions of continuous and batchdistillation was also studied. The temperature method was used to study this tray composition. The GreenTeam also performed an energy study on the condenser.
Binary distillation is the process in which a mixture of 2 chemicals are separated based upon eachchemical’s vapor pressure, or how easily each chemical vaporizes. For the purposes of this experiment,only a binary mixture of methanol and water was studied. When two pure chemicals are mixed and heatedto boiling, the chemical with the lowest vapor pressure, i.e. the lowest boiling point, will vaporize first.This component of the binary mixture is called the “light” component, and commonly referred to ascomponent A the mixture. The other component of the binary mixture is called the “heavy” component,and is commonly referred to as component B of the mixture.
A distillation column is a column composed of a series of trays stacked vertically, with a condenser,reboiler, and a feed. The feed is the mixture of chemicals, in this case methanol and water, which is fedinto the middle section of the distillation column.
The reboiler provides energy to the distillation column in the form of heat to cause the light component,component A, of the binary mixture to vaporize first. The reboiler is located at the bottom of thedistillation column. The product stream of the reboiler is known as the “bottoms” product.
The condenser is located at the top of the distillation column and removes energy from the distillationcolumn. The purpose of the condenser is to condense the vapor leaving the top tray of the column.
Reflux percent is the percent of liquid condensed in the condenser that is allowed to be collected as“distillate”. The distillate is the product stream from the top of the distillation column, which is rich incomponent A of the binary mixture. The remaining liquid that is not collected as distillate, termed“reflux,” is returned to the distillation column for further separation.
A distillation column can be run via batch operation or continuous operation. In batch distillation, a“batch” of chemicals, in this case methanol and water, is first fed into the column and the liquid part of thismixture settles in the reboiler. Once the reboiler is filled with the desired finite “batch” of the binarymixture, energy is added to the reboiler in the form of heat to start the experiment.
In continuous distillation, the feed enters the column continuously. Heat is constantly supplied to thereboiler, and a continuous flow of distillate and bottoms product is collected or returned to the feed tank.

THEORY:
The composition of the distillate collected was analyzed in two ways. One method for determiningcomposition is density. This calculated density was then compared with a tabulated list of densities locatedin Perry’s Handbook.
To find the density, a measured volume of collected distillate was weighed. The formula for density isgiven below.
Density = Mass/volume (1)
The second method for determining composition of the distillate collected, and the composition for eachtray, is temperature. Using a vapor-liquid equilibrium diagram from tabulated data in Perry’s Handbookfor methanol and water mixture, the known temperature of the liquid in each tray can be used to find thecomposition of the liquid and vapor. The following diagram in Figure 1 illustrates this method.
Perry's Data for Methanol-Water
60.0
65.0
70.0
75.0
80.0
85.0
90.0
95.0
100.0
0.0 0.1 0.2 0.3 0.4 0.5 0.6 0.7 0.8 0.9 1.0
x,y
Tem
per
atu
re, o
C
Data x
Data y
Figure 1. Vapor-Liquid Equilibrium Diagram for Methanol and Water
For example, at a temperature of 78.0 oC, the composition of liquid of the light component, in this casemethanol, is 0.30 mole fraction, and the composition of methanol in the vapor is 0.67 mole fraction.
Vapor Equilibrium Line
Liquid Equilibrium Line

Reflux percentage is the percent of liquid condensed in the condenser that is allowed to be collected asdistillate. The distillate is the product stream from the top of the distillation column, which is rich incomponent A of the binary mixture. The remaining liquid that is not collected as distillate, termed“reflux,” is returned to the distillation column for further separation. At 95% reflux, 5% of the condensedliquid from the condenser is collected as distillate. The remaining 95% of the condensed liquid is returnedto the distillation column for further separation.
Therefore, the higher the reflux percentage, the greater amount of liquid is sent back to the distillationcolumn for further separation. It follows then that the highest composition of the light component collectedin the distillate is proportional to the highest possible reflux percentage. Unfortunately, at 100% reflux nodistillate is collected. The figure below is an illustration of reflux.
Figure 2. Diagram Illustrating Reflux.
Condenser
1
Reflux
4
Distillatecollected

Qloss
Qcondenser
Qreboiler
An energy study on the distillation column can be simplified if an overall energy balanced is used on thedistillation column. A simplified illustration of the distillation column is given in the following figure,Figure 3.
Figure 3. Simplified Model of the Distillation Column
At steady-state, the energy added to the distillation column is equal to the energy removed from thedistillation column minus any heat loss in the distillation column. The following equation was used to findthe overall heat loss in the distillation column.
Qreboiler = Qcondenser + Qloss (2).
Qreboiler is the energy added to the distillation column from the reboiler, Qcondenser is the energy removed bythe condenser, and Qloss is the energy loss in the distillation column.
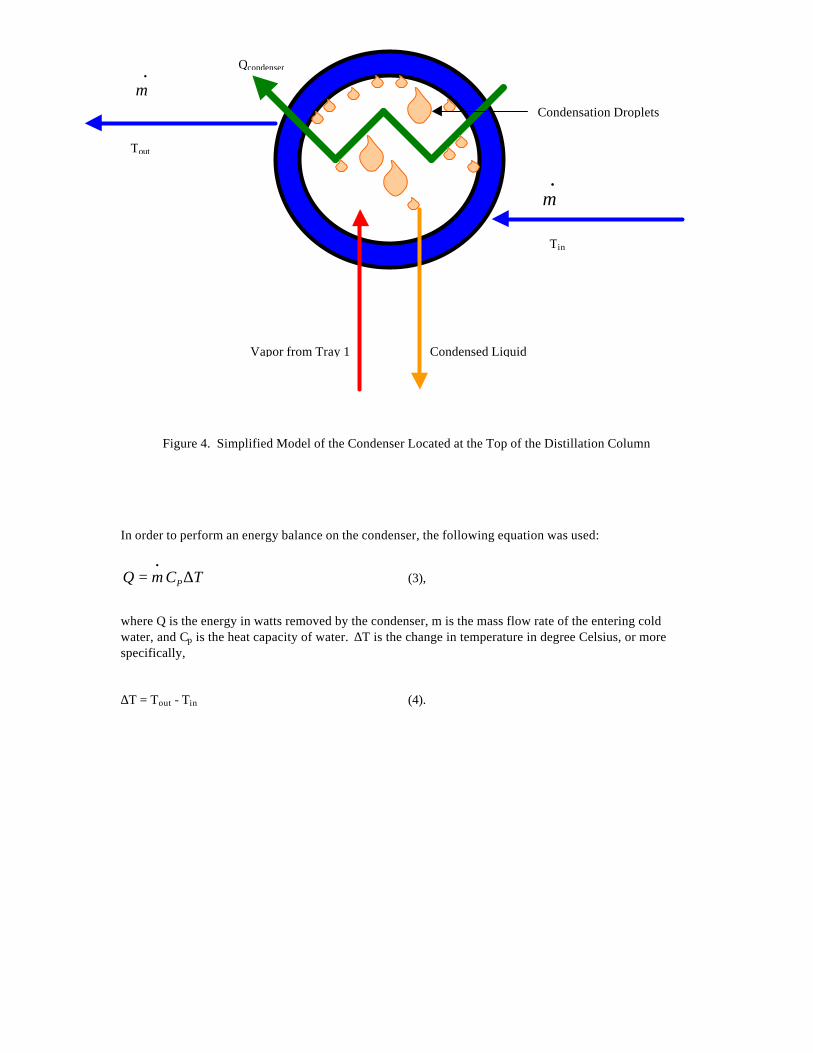
Figure 4. Simplified Model of the Condenser Located at the Top of the Distillation Column
In order to perform an energy balance on the condenser, the following equation was used:
TCmQ P∆=•
(3),
where Q is the energy in watts removed by the condenser, m is the mass flow rate of the entering coldwater, and Cp is the heat capacity of water. ∆T is the change in temperature in degree Celsius, or morespecifically,
∆T = Tout - Tin (4).
Condensed LiquidVapor from Tray 1
Condensation Droplets
•m
•
m
Tin
Tout
Qcondenser

Typical Tray
Liquid leaving tray
Liquid from tray above
EQUIPMENT:
The distillation column is approximately 15 feet high with a diameter of approximately 6 inches. There are12 trays within the distillation column.
The section of the distillation column above the feed is known as the rectifying section. The section of thedistillation column below the feed is known as the stripping section.
The reboiler is located at the bottom of the column. Inside the reboiler is a heating unit composed of calrodheaters that is used to heat the mixture that is fed into the distillation column. When this mixture is heatedthe light component, the component of the mixture that has the lowest boiling point, vaporizes andcondenses on the tray directly above the reboiler.
From the heat added to the reboiler, each subsequent tray undergoes vaporization and condensation so thatthe top of the column has a high concentration of the lightest component and the bottom of the column hasa high concentration of the heavy component (the component with the higher boiling point). Figure 4 bestillustrates this separation.
Figure 5. A Typical Tray.
This distillation column can be run via batch operation or continuous operation. In batch distillation, a“batch” of chemicals, in this case methanol and water, is first fed into the column and the liquid part of thismixture settles in the reboiler. Once the reboiler is filled with the desired finite “batch” of the binarymixture, energy is added to the reboiler in the form of heat to start the experiment. A schematic drawing ofthe distillation column under batch distillation is given in Figure 6.
In continuous distillation, the feed enters the column continuously. Heat is constantly supplied to thereboiler, and a continuous flow of distillate and bottoms product is collected or returned to the feed tank. Aschematic drawing of the distillation column under continuous distillation is given in Figure 7.
Vapor from tray below
Vapor leaving tray

Heat Removedfrom the Condenser
Condenser
Heat added to the Reboiler
Vapor Boil-up
Reboiler
12
11
7
1
Reflux
2
Bottom’s Product
3
4
6
5
8
10
9
Feed Tank
Distillatecollected
RectifyingSection
DistillatePump
ReboilerPump
Reboiler filledwith batch ofbinary mixture
TI
TI
TI
TI
TI
TI
TI
TI
TI
TI
TI
TI

Figure 6. Distillation Column Under Batch Operation
Feed
Heat Removedfrom the Condenser
Condenser
Heat added to the Reboiler
Vapor Boil-up
Reboiler
12
11
7
1
Reflux
2
Bottom’s Product
3
4
6
5
8
10
9
Feed Tank
Distillatecollected
RectifyingSection
StrippingSection
FeedPump
DistillatePump
ReboilerPump
TI
TI
TI
TI
TI
TI
TI
TI
TI
TI
TI
TI

Figure 7. Distillation Column Under Continuous Distillation
PROCEDURE:
Seven experiments were ran for batch operation. The inputs required for batch distillation include RefluxPercent and Heat Added to the Reboiler. Table 1 depicts the experiments ran for batch operation of thedistillation column.
Table 1. Experiments for Batch Distillation
Experiment Number Reflux Rate Heat Added to Reboiler,Watts
Composition of batch,wt % methanol
1 100% 2500 12.1%2 95% 2500 12.1%3 95% 2000 12.1%4 90% 2500 12.1%5 70% 2500 12.1%6 50% 2500 12.1%7 20% 2500 12.1%
Four experiments were run for continuous distillation. The inputs for continuous operation include RefluxPercent, Heat added to the Reboiler, and a feed pump setting. It should be noted that a P-only controllermaintained a level of approximately 11 liters in the reboiler. Table 2 depicts the experiments ran forcontinuous operation of the distillation column.
Table 2. Experiments for Continuous Distillation
Experiment Number Feed PumpSetting
Reflux Rate Heat Added toReboiler, Watts
Composition of Feed,wt % methanol
1 4 95% 2500 12.3%2 4 90% 2500 12.3%3 4 70% 2500 12.3%4 4 50% 2500 12.3%
Distillate Flow Rate StudyFor batch distillation, the flow rate for the distillate was found by two different methods, manually andcomputer.Manual Method - The real distillate flow rate was recorded physically by manually recording the level ofthe distillate collected in the 1000mL beaker every 5 minutes.
Computer Method – The distillate flow rate given by the computer, i.e. LabVIEW is automatically recordedto a raw data sheet that is downloadable at http://distillation.engr.utc.edu/data.htm.

Composition of Methanol in the DistillateThe composition of the distillate was found using two different methods, density and temperature data.For density calculations for batch and continuous distillation experiments, the initial distillate that wascollected in the 1000mL beaker was transferred to a 50mL beaker. This distillate was used to wash a 5mL-graduated cylinder. After 3 washings, the collected distillate was poured into the 5mL-graduated cylinderto the 5mL mark. This graduated cylinder was then weighed on a triple beam balance to the nearest 100th
of a gram. Then, using the following equation,
Density = Mass/volume (1)
the density was found. Then, using a list of tabulated data by Perry’s Handbook, 7th edition, thecomposition of the distillate was found.
To calculate the composition of the distillate by temperature data, the temperature of the top tray was usedin conjunction with the chart given in Figure 1. The composition of the distillate was recorded as thecomposition of the vapor at the tray 1 of the distillation column.
For batch distillation experiments, the composition of the distillate calculated from temperature data wasfound approximately 5 minutes after the first distillate started to flow. For continuous distillationexperiments, the composition of the distillate calculated from temperature data was found at steady-state.
Composition of Methanol on Each TrayTemperature data in conjunction with the chart given in Figure 1was used to find the composition ofmethanol in each tray.
For batch distillation experiments, the composition of the distillate was found approximately 5 minutesafter the first distillate started to flow. For continuous distillation experiments, the composition of thedistillate calculated was found at steady-state.
Energy Study on the CondenserThe needed information for conducting an energy study on the condenser was Cold Water Flow Rate to thecondenser, the Cold Water Supply Temperature to the condenser, and the Cold Water Return Temperatureto the condenser. The following equation was used to calculate the energy removed by the condenser,
TCmQ P∆=•
(3),
where Q is the energy in watts removed by the condenser, m is the mass flow rate of the entering coldwater, and Cp is the heat capacity of water. ∆T is the change in temperature in degree Celsius, or morespecifically,
∆T = Tout - Tin (4).
where Tin is the Cold Water Supply Temperature and Tout is the Cold Water Return Temperature.

Overall Energy Loss in the Distillation ColumnAt steady-state, the energy added to the distillation column is equal to the energy removed from thedistillation column minus any heat loss in the distillation column. The following equation was used to findthe overall heat loss in the distillation column.
Qreboiler = Qcondenser + Qloss (2).
Qreboiler is the energy added to the distillation column from the reboiler, Qcondenser is the energy removed bythe condenser, and Qloss is the energy loss in the distillation column.
RESULTS:
The distillate flow rate was found for batch distillation manually (manually recording the distillatecollected in the 1000mL beaker every 5 minutes) and then compared to the data recorded by LabVIEW (thedistillate level calculated by the LabVIEW program using a pressure sensor at the bottom of the beakercontaining the distillate).
Table 3 and Table 4 give the results of the flow rate analysis.
Table 3. Distillate Flow Rate for Batch Distillation for a Constant Reflux Rate
Heat Added to Reboiler,Watts
Reflux Rate LabVIEW Flow Rate,mL/min
Manual Flow Rate,mL/min
2000 95% 2.5 3.92500 95% 3.4 5.1
Table 4. Distillate Flow Rate for Batch Distillation for a Constant Heat Added to Reboiler
Reflux Rate Heat Added to Reboiler,Watts
LabVIEW Flow Rate,mL/min
Manual Flow Rate,mL/min
95% 2500 3.4 5.120% 2500 30.8 60.7

Figure 8 displays the difference in flow rate of the distillate for batch distillation at a constant refluxpercentage of 95%. The data displayed below represents the manually collected data. Heat added to thereboiler is the variable studied in Figure 8. As noticed in the figure below, the higher distillate flow rate isfor 2500 Watts added to the reboiler.
Batch DistillationFlow Rate for 2000 Watts vs. 2500Watts
(95% Reflux)
V = 5.1t + 31.7
V = 3.9t + 25.3
0
50
100
150
200
250
300
350
0 10 20 30 40 50 60 70
Time (min)
Vo
lum
e o
f D
isti
llate
(m
L)
2000 Watts
2500 Watts
Figure 8. Manual Distillate Flow Rate for Constant Reflux Rate

Figure 9 represents the data collected manually for batch distillation at a constant wattage supplied to thereboiler of 2500 Watts. Reflux percentage is the variable of interest. As noticed in the figure below, thehigher distillate flow rate is associated with the lower reflux percentage.
Batch DistillationFlow Rate of 95% vs. 20% Reflux
(2500Watts)
V = 60.7t + 255
V = 5.1t + 31.7
0
500
1000
1500
2000
2500
0 10 20 30 40 50 60
Time (min)
Vol
ume
of D
istil
late
(mL)
20% Reflux
95% Reflux
Figure 9. Manual Distillate Flow Rate for Constant Heat Added to Reboiler

Figure 10 represents the comparison of the manual data and computer data for the distillate flow rate forbatch distillation. The wattage supplied to the reboiler and the Reflux Percentage are held constant at2000Watts and 95%, respectively. As noticed in the figure below, the higher distillate flow rate isassociated with the manual data.
Batch DistillationManual vs. LabVIEW
(2000 Watts, 95% Reflux Rate)
V = 2.5t + 134
V = 3.9t + 25.3
0
50
100
150
200
250
300
0 10 20 30 40 50 60
Time (min)
Vol
ume
of D
istil
late
(mL)
Manual
LabVIEW
Figure 10. Comparison of Manual and LabVIEW Distillate Flow Rate

Figure 11 represents the comparison of the manual data and computer data for the distillate flow rate forbatch distillation. The wattage supplied to the reboiler and the Reflux Percentage are held constant at2500Watts and 20%, respectively. As noticed in the figure below, the higher distillate flow rate isassociated with the manual data.
Batch DistillationManual vs. LabVIEW
(2500 Watts, 20% Reflux Rate)
V = 30.8t + 222
V = 60.7t + 255
0
500
1000
1500
2000
2500
0 5 10 15 20 25 30 35
Time (min)
Vol
ume
of D
istil
late
(mL)
Manual
LabVIEW
Figure 11. Comparison of Manual and LabVIEW Distillate Flow Rate

Figure 12 represents the comparison of the manual data and computer data for the distillate flow rate forbatch distillation. The wattage supplied to the reboiler and the Reflux Percentage are held constant at2500Watts and 95%, respectively. As noticed in the figure below, the higher distillate flow rate isassociated with the manual data.
Batch DistillationManual vs. LabVIEW
(2500 Watts, 95% Reflux Rate)
V = 3.4t + 150
V = 5.1t + 31.7
0
50
100
150
200
250
300
350
0 10 20 30 40 50 60
Time (min)
Vol
ume
of D
istil
late
(mL)
Manual
LabVIEW
Figure 12. Comparison of Manual and LabVIEW Distillate Flow Rate

As noticed in Figures 10 through 12, the manually collected data does not match the computer data fordistillate flow rate. Assuming that the manually collected data for the distillate flow rate is the “true”distillate flow rate, an equation needs to be created that corrects the computer data to match the manualdata.
Table 5. Ratio of Flow Rates for Manual and LabVIEW
Heat Addedto Reboiler,Watts
RefluxPercentage
LabVIEWFlow Rate,mL/min
ManualFlow Rate,mL/min
Ratio of Flow Rates,Manual/LabVIEW
Intercepts
2000 95% 2.5 3.9 1.56 -1912500 95% 3.4 5.1 1.50 -1862500 20% 30.8 60.7 1.97 -186Average 1.68 -188Student TError
±1.08 ±11.5
Relationship between Manual Flow Rate and LabVIEW Flow Rate:Manual Flow Rate = (1.68±1.08)*LabVIEW Flow – 188(±11.5)
Density study for methanol compositionIt was first believed that density would prove to be a good comparison with the temperature method formethanol composition in the distillate. However, in light of the obvious high error in density calculations,comparisons are not made between the temperature calculations for methanol composition and densitycalculations for methanol composition.
Table 6 summarizes the error analysis for the density data at a Reflux of 50%.
Table 6. Percent Methanol in Distillate from Density Calculations
RefluxPercentage
Volume inGraduated
Cylinder (mL)
Weight ofDistillate(grams)
Density ofDistillate
(grams/mL)
Composition ofDistillate
(wt%)50% 5.00 4.50 0.900 57.5%50% 5.00 4.32 0.864 73.0%50% 5.00 4.46 0.892 61.2%50% 5.00 4.45 0.890 62.1%
Students T-Error
17.1%

Table 7 summarizes the density calculations for batch distillation. It should be noted that these methanolcompositions appear to be bogus.
Table 7. Density Calculations for Methanol Composition in the Distillate for Batch Distillation
Reflux Percentage Composition of Distillate (wt%)95% 110%90% 98%70% 89%50% 61%20% 89%
Table 8 summarizes the density calculations for continuous distillation. It should be noted that thesemethanol compositions also appear to be bogus.
Table 8. Density Calculations for Methanol Composition in the Distillate for Continuous Distillation
Reflux Percentage Composition of Distillate (wt%)90% 61%70% 57%50% 106%
Table 9 summarizes the distillate composition found for batch distillation using the temperature method. Itshould be noted that these calculations were conducted approximately 5 minutes after the first distillatestarted to flow.
Table 9. Comparison of Distillate Composition for Batch Distillation with 2500 Watts added to theReboiler
Reflux Percentage Composition of Distillate, mole fraction Methanol
95% 1.0090% 0.9870% 0.9650% 0.7820% 0.18

Table 10 summarizes the distillate composition found for continuous distillation using the temperaturemethod. It should be noted that these calculations were performed once the continuous distillationexperiment reached steady-state.
Table 10. Comparison of Distillate Composition for Continuous Distillation with 2500 Watts added tothe Reboiler
Reflux Percentage Composition of Distillate,mole fraction Methanol
90% 0.9770% 0.7750% 0.23
Table 11 presents the comparison between calculated compositions of methanol in the distillate for batchdistillation and continuous distillation. Batch distillation calculations were conducted approximately 5minutes after the first distillate started to flow. Continuous distillation calculations were conducted oncesteady-state was reached.
Table 11. Comparison of Distillate Composition for Continuous Distillation and Batch Distillationwith 2500 Watts added to the Reboiler
Reflux Percentage Composition of Batch Distillate,mole fraction Methanol
Composition of Continuous Distillate,mole fraction Methanol
90% 0.98 0.9770% 0.96 0.7750% 0.78 0.23

Figure 13 is graph of the methanol composition in the liquid for each tray. Figure 13 illustrates thedifference in liquid composition for batch distillation with a constant reflux percentage of 95%. Thevariable of interest is the wattage added to the reboiler, which in this graph is 2000Watts and 2500Watts. Itshould be noted that these calculations were conducted approximately 5 minutes after the first distillatestarted to flow.
Batch Distillation at 95% Reflux Liquid Composition
0
0.1
0.2
0.3
0.4
0.5
0.6
0.7
0.8
0.9
1
1 2 3 4 5 6 7 8 9 10 11 12
Tray
mol
e fr
actio
n m
etha
nol
2000 Watts
2500 Watts
Figure 13. Liquid Composition of Methanol in Each Tray for Batch Distillation

Figure 14 is graph of the methanol composition in the liquid for each tray. Figure 14 illustrates thedifference in liquid composition for batch distillation with a constant wattage supplied to the reboiler of2500Watts. The variable of interest is the reflux percentage. It should be noted that these calculationswere conducted approximately 5 minutes after the first distillate started to flow.
Batch Distillation at 2500 Watts added to Reboiler - Liquid Composition
0
0.1
0.2
0.3
0.4
0.5
0.6
0.7
0.8
0.9
1
1 2 3 4 5 6 7 8 9 10 11 12
Tray
mol
e fr
actio
n m
etha
nol 95% Reflux
90% Reflux70% Reflux
50% Reflux
20% Reflux
Figure 14. Liquid Composition of Methanol in Each Tray for Batch Distillation

Figure 15 is graph of the methanol composition in the liquid for each tray. Figure 15 illustrates thedifference in liquid composition for continuous distillation with a constant wattage supplied to the reboilerof 2500Watts. The variable of interest is the reflux percentage. It should be noted that these calculationswere performed once the continuous distillation experiment reached steady-state.
Continuous Distillation at 2500 Watts added to Reboiler - Liquid Composition
0
0.1
0.2
0.3
0.4
0.5
0.6
0.7
0.8
0.9
1
1 2 3 4 5 6 7 8 9 10 11 12
Tray
mol
e fr
actio
n m
etha
nol
95% Reflux
90% Reflux
70% Reflux
50% Reflux
Figure 15. Liquid Composition of Methanol in Each Tray for Continuous Distillation

Energy Balance on the Condenser and Heat Loss in the Distillation ColumnIt should be noted that during the course of this study, it was found that the cold water flow rate displayedby the computer is incorrect. Table 12 summarizes theses results
Table 12. Cold Water Flow Rate Study
Cold Water Flow Rate Displayedby LabVIEW (L/min)
Cold Water Flow Rate foundManually (L/min)
Ratio of Manual/LabVIEW
1.9 5.3 2.8
Therefore, it follows that the correction factor for the flow rate given by the computer is 2.8
Table 13 is a summary of the energy study for batch distillation experiments.
Table 13. Summary of Energy Study for Batch Distillation
Reflux Rate Heat Added toReboiler, Watts
Heat Removed byCondenser, Watts
Heat Loss in Column,Watts
100% 2500 1720 78095% 2500 1750 75095% 2000 1340 66070% 2500 1620 88050% 2500 1550 95020% 2500 1560 940
Table 13 is a summary of the energy study for the continuous distillation experiments
Table 13. Summary of Energy Study for Continuous Distillation
Reflux Rate Heat Added toReboiler, Watts
Heat Removed byCondenser, Watts
Heat Loss in Column,Watts
95% 2500 470 203090% 2500 560 194070% 2500 670 180050% 2500 330 2170

Figure 16 is a graph comparing the heat absorbed by the condenser for batch distillation experiments andcontinuous distillation experiments. The wattage supplied to the reboiler is 2500 Watts for all data graphedbelow.
Figure 16. Comparison of Heat Absorbed by Condenser for Batch and Continuous Distillation
Heat absorbed by Condenser Vs. Reflux %
0
200
400
600
8001000
1200
1400
1600
1800
20 30 40 50 60 70 80 90 100
Reflux %
Hea
t abs
orbe
d by
co
nden
ser
(Wat
ts)
Continuous Batch

DISCUSSION OF RESULTS:
When comparing the distillate flow rates for the Manual and LabVIEW methods, the distillate flow ratedisplayed by the computer, i.e. LabVIEW, is consistently lower than the real distillate flow rate, i.e.Manually. Specifically, the real distillate flow rate is 1.68±1.08 times the computer distillate flow rate.The correction for this discrepancy was found to be Qcorrected = (1.68±1.08)QLabVIEW - 188(±11.5), where Qis the flow rate.
When comparing the distillate flow rates for batch distillation at different reflux percentages but at aconstant wattage supplied to the reboiler, the higher distillate flow rate is due to the lower refluxpercentage, as expected in the theory.
When comparing the distillate flow rates for batch distillation at different wattages added to the reboiler butat a constant reflux percent, the higher distillate flow rate is due to a higher wattage supplied to the reboiler.
The composition of the methanol in the distillate was found using two different methods, density andtemperature. The compositions found using the density calculations proved to be bogus with a Student-Terror of 17.4% for batch distillation with 50% reflux and 2500Watts added to the reboiler. Commonly thecomposition of the methanol exceeded 100 wt%. Obviously, it is impossible to have greater than 100 wt%methanol in the distillate. Also, the composition of methanol in the distillate would inconsistently increaseor decrease as the reflux percentage decreased. Therefore, the density calculations proved erroneous.
The composition of methanol in the distillate found from temperature calculations proved to be consistentwith the theory. An increase in percent methanol is related to an increase in reflux percentage, and adecrease in percent methanol in the distillate is related to a decrease in reflux percentage.
Batch distillation experiments give a higher composition of methanol in the distillate than continuousdistillation experiments when reflux percentage and heat added to the reboiler are equal. It should be notedthat batch distillation compositions occurred approximately 5 minutes after the first distillate started to flowand the continuous distillation compositions occurred at steady-state.
The composition of methanol in each tray found from temperature calculations also proved to be consistentwith the theory. Tray 1 contained the highest percent methanol and each subsequent tray containedsuccessively less methanol. There is little difference in corresponding tray compositions for refluxpercentages of 90% and 95% for batch distillation. The same phenomenon was also observed forcontinuous distillation experiments at 90% and 95% reflux.
When comparing the methanol composition on each tray for batch distillation at different wattages added tothe reboiler but at a constant reflux percent, the methanol concentration in the lower trays (7 through 12)are lower for the higher wattage supplied to the reboiler. This is due to the fact that there is a greater flowrate of vapor to the top of the column with a higher wattage supplied to the reboiler.
For batch distillation experiments, the energy removed by the condenser is greater than the energy removedfrom the condenser during continuous distillation experiments.

CONCLUSIONS:
The distillate flow rate found by LabVIEW, i.e. the computer is incorrect and does not match the manuallycalculated flow rate, which is accepted as the real distillate flow rate. The correction for this discrepancywas found to be Qcorrected = (1.68±1.08)QLabVIEW - 188(±11.5), where Q is the flow rate is L/min.
Methanol concentration increases in the trays as it ascends in the distillation column.
Batch distillation experiments give a higher initial methanol composition in the distillate than continuousdistillation experiments.
At lower reflux percentages, the distillate flow rate is higher for both continuous distillation experimentsand batch distillation experiments. Also, at lower reflux percentages, the concentration of methanol is lessin the stripping section (trays 7 through 12) of the distillation column for both batch and continuousdistillation experiments.
At higher watts added to the reboiler, there is a corresponding lower concentration of methanol in the lowertrays (trays 7 through 12) of the distillation column for batch distillation experiments.
RECOMMENDATIONS:
It would be of interest to observe continuous distillation at a constant reflux percentage but varying thewattage supplied to the reboiler. Also, it would be of interest to observe continuous distillation for differentfeed pump settings.
In addition, a study should be conducted to determine why the heat absorbed by the condenser is less forcontinuous distillation than for batch distillation.
REFERENCES:
Unit Operations of Chemical Engineering, 6th Ed., Warren L. McCabe, Julian C. Smith andPeter Harriott, McGraw-Hill, Boston, 2001.
Perry, Robert H. and Don W. Green. Perry’s Chemical Engineers Handbook, 7th Edition, June 1, 1997.McGraw-Hill Professional
Cunningham, James R. Dr. Lecture Notes Fall 2002 for ENCH 432 at the University of Tennessee atChattanooga.
UTC Engineering Controls Lab Online. University of Tennessee at Chattanooga.http://distillation.engr.utc.edu/data.htm
Appendices

Batch Distillation at 95% Reflux Vapor Composition
0
0.1
0.2
0.3
0.4
0.5
0.6
0.7
0.8
0.9
1
0 1 2 3 4 5 6 7 8 9 10 11 12
T r a y
2000
2500 Watts
Batch Distillation at 2500 Watts added to Reboiler - Vapor Composition
0
0.1
0.2
0.3
0.4
0.5
0.6
0.7
0.8
0.9
1
0 1 2 3 4 5 6 7 8 9 10 11 12
T r a y
95%
100%
90%
70% Reflux
50%
20% Reflux

Continuous Distillation at 2500 Watts added to Reboiler - Vapor Composition
0
0.1
0.2
0.3
0.4
0.5
0.6
0.7
0.8
0.9
1
0 1 2 3 4 5 6 7 8 9 10 11 12
T r a y
95%
90% 70%
50%