Embed Size (px)
Citation preview

University of Oxford
Attribution of individual weather
events to external drivers of climate
change
Myles Allen
Department of Physics, University of Oxford
With material from:
Pardeep Pall, Dáithí Stone, Peter Stott, Nikos Christidis,
Kevin Trenberth, Ed Maibach

University of Oxford
Motivation
South Oxford on January 5th, 2003
Ph
oto
: D
ave
Mitch
ell

University of Oxford
“The kind of event we might expect to become
more frequent under climate change.”
Figure 10.9
IPCC

University of Oxford
What are we trying to do, and why?
Specific science question: If an event occurs, how
has an external driver like human influence
contributed to the risk of that event?
Public interest: understanding current climate
change, the need for adaptation and, potentially,
mitigation.
Legal implications: suits alleging harm from human
influence on climate are being filed, with no
consistent or systematic science base.
Adaptation funding: distinguishing impacts of
climate change from the consequences of bad
weather – a UNFCCC “inventory of impacts”.

University of Oxford
The attribution challenge

University of Oxford
The attribution challenge

University of Oxford
The attribution challenge

University of Oxford
All politics is local: Temperatures in one of the
warmest Januaries on record.

University of Oxford
If human influence doubles
the risk of a flood, and that
flood occurs, then human
influence is “to blame” for
half the risk.
Fraction Attributable Risk:
FAR = 1 – P0/P1
P0 = risk with human
influence “removed”
(more uncertain)
P1 = current risk, including
human influence
(less uncertain)
Attribution beyond mean climate: Fraction
Attributable Risk
P1
P0
EVENT

University of Oxford
An example of a weather event…
Temperatures in
August 2003
relative to normalFrom NASA‟s Moderate
Resolution Imaging
Spectrometer, courtesy of
Reto Stöckli, ETHZ

University of Oxford
…with very substantial impacts
Daily mortality in Baden-Württemberg

University of Oxford
Simulating the climate that might have been…
Natural drivers only
All drivers included
Future projection
Instrumental
observations
Southern European
area-averaged JJA
temperatures
Stott et al (2004)

University of Oxford
Return periods for European heat-waves
9x increase in risk
…to estimate the role of human influence in the
risk of a Summer-2003-like heatwave

University of Oxford
Are recent UK floods affected by climate
change? The Pall et al experiment
Aim: to quantify the role of increased greenhouse
gases in precipitation responsible for 2000 floods.
Challenge: relatively unlikely event even given 2000
climate drivers and sea surface temperatures (SSTs).
Approach: large (multi-thousand-member) ensemble
simulation of April 2000 – March 2001 using 90km
resolution global model to resolve weather systems.
Identical “non-industrial” ensemble removing the
influence of increased greenhouse gases, including
attributable SST change, allowing for uncertainty.

University of Oxford
Performing simulations using distributed
computing: http://attribution.cpdn.org

University of Oxford
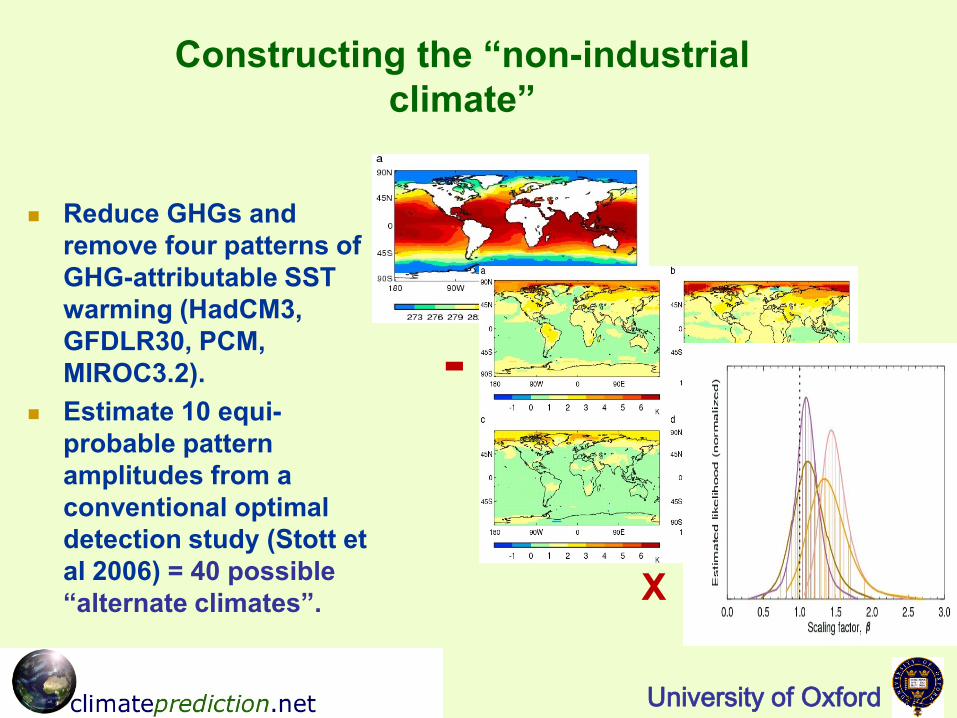
Constructing the “non-industrial
climate”
Reduce GHGs and
remove four patterns of
GHG-attributable SST
warming (HadCM3,
GFDLR30, PCM,
MIROC3.2).
Estimate 10 equi-
probable pattern
amplitudes from a
conventional optimal
detection study (Stott et
al 2006) = 40 possible
“alternate climates”.
University of Oxford
Constructing the “non-industrial
climate”
Reduce GHGs and
remove four patterns of
GHG-attributable SST
warming (HadCM3,
GFDLR30, PCM,
MIROC3.2).
Estimate 10 equi-
probable pattern
amplitudes from a
conventional optimal
detection study (Stott et
al 2006) = 40 possible
“alternate climates”. X
-

University of Oxford
Range of SST gradients in simulated greenhouse
warming over North Atlantic

University of Oxford
Autumn 2000
in the ERA-40
reanalysis…
…and in one
of the wetter
members of
our ensemble.
University of Oxford
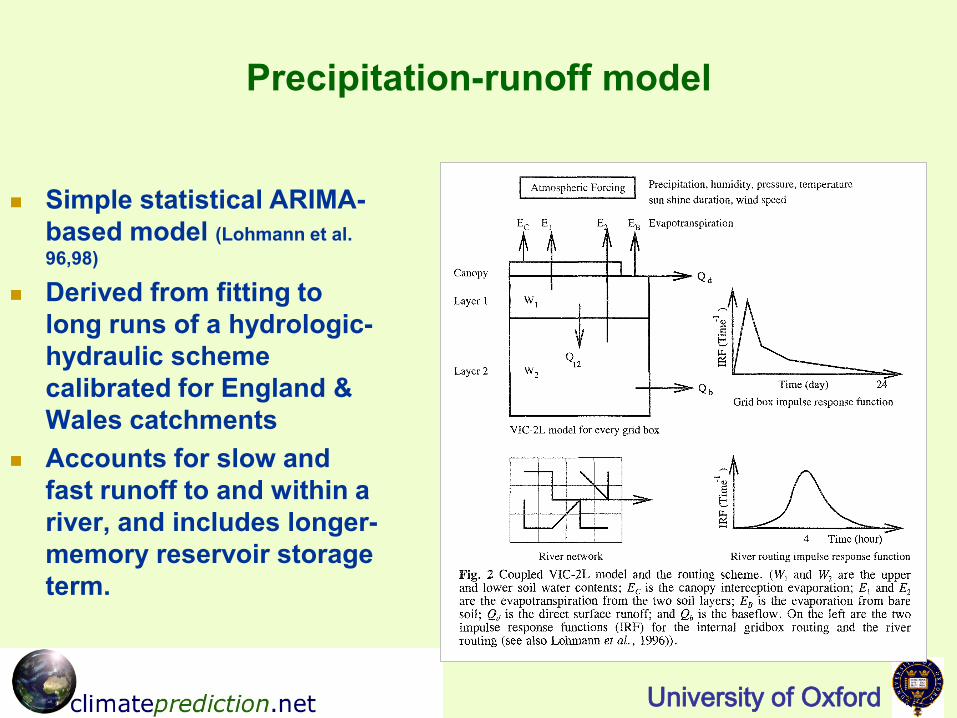
Precipitation-runoff model
Simple statistical ARIMA-
based model (Lohmann et al.
96,98)
Derived from fitting to
long runs of a hydrologic-
hydraulic scheme
calibrated for England &
Wales catchments
Accounts for slow and
fast runoff to and within a
river, and includes longer-
memory reservoir storage
term.

University of Oxford
Results:
Hydrology
Power spectra of
synthesized daily river
runoff for England &
Wales autumns.
Runoff variability
adequately
represented for a
range of timescales
ERA-40 = black line
A2000 climate 5-95% conf.= blue lines

University of Oxford
Results:
Change in daily runoff returns
Return periods
generally decrease in
the A2000 climate,
relative to 39 out of
40 “non-industrial”
climates
GHG increase
responsible for more
frequent heavy
runoff events

University of Oxford
Results:
Attributable risk of Autumn 2000 flooding
Significantly increased
(10% level) risk of A2000
climate flooding, relative
to all four GCM-based
estimates of non-
industrial climates.
Aggregate „best
guess‟ is a near-
trebling of risk
FAR of UK Autumn
2000 flooding = 0.6

University of Oxford
Results:
Robustness to atmospheric model used?
FAR = combination of
thermodynamic and
circulation response.
Similar values
predicted by observed
rainfall distribution,
range of temperature
changes and Clausius-
Clapeyron.
Result is not
dominated by
circulation response:
more likely to be
robust.Explicitly
modelled
Simple
thermodynamic
model

University of Oxford
The circulation pattern of interest: Autumn 2000
geopotential height anomaly at 300hPa
Blackburn & Hoskins (2001)

University of Oxford
The role of circulation: which way does the
cloud move?
University of Oxford
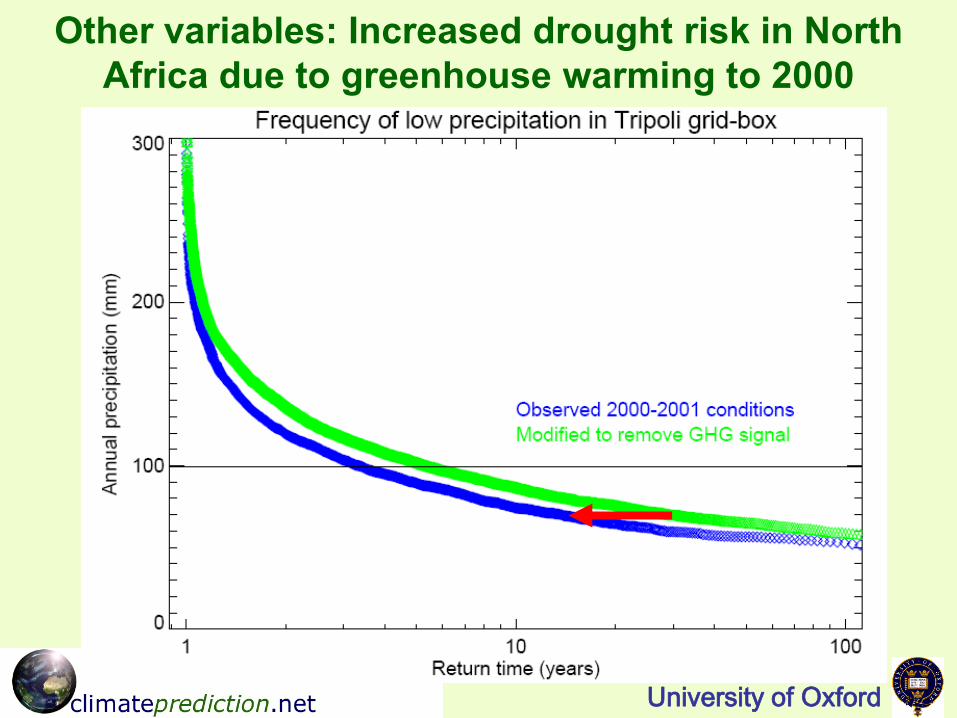
Other variables: Increased drought risk in North
Africa due to greenhouse warming to 2000

University of Oxford
Methodological issues
Experimental design: prescribed SSTs, interactive
mixed layer relaxed to observed SSTs, fully
coupled?
Modelling set-up: allowing for uncertainty in
atmospheric model through perturbed physics or
multi-model ensembles.
Identical problem to seasonal forecasting, could use
identical tools.
Problem of selection bias: only solved with a regular
assessment.

University of Oxford
And, of course, human influence is not the only
factor to be explored: Woollings et al, 2010, on
the role of solar variability in European winters

University of Oxford
Who cares? Impact of “personal experience” on
public perceptions of global warming
Source: Maibach, NOAA Attribution Workshop, 2010

University of Oxford

University of Oxford

University of Oxford
Who cares? The lawyers…
“Plaintiffs ... must show that, more probably than
not, their individual injuries were caused by the risk
factor in question, as opposed to any other cause.
This has sometimes been translated to a
requirement of a relative risk of at least two.”
(Grossman, 2003)
Those who suspect they are being harmed by
climate change (or by climate change litigation) will
need an objective scientific framework for causal
attribution.
But current evidence is that non-scientific issues will
keep courts busy for the foreseeable future.

University of Oxford
Who cares? The UNFCCC
$100 billion per year by 2020 pledged to assist poor
countries in adapting to climate change.
Much larger sums in national adaptation plans.
But what adaptation measures are eligible?
– Heatwave resilience in Russia?
– Riverine flood protection in Pakistan?
– Home insulation against cold winters in Europe.
Urgent need to agree methods of impact attribution
and develop a global impact inventory.
University of Oxford
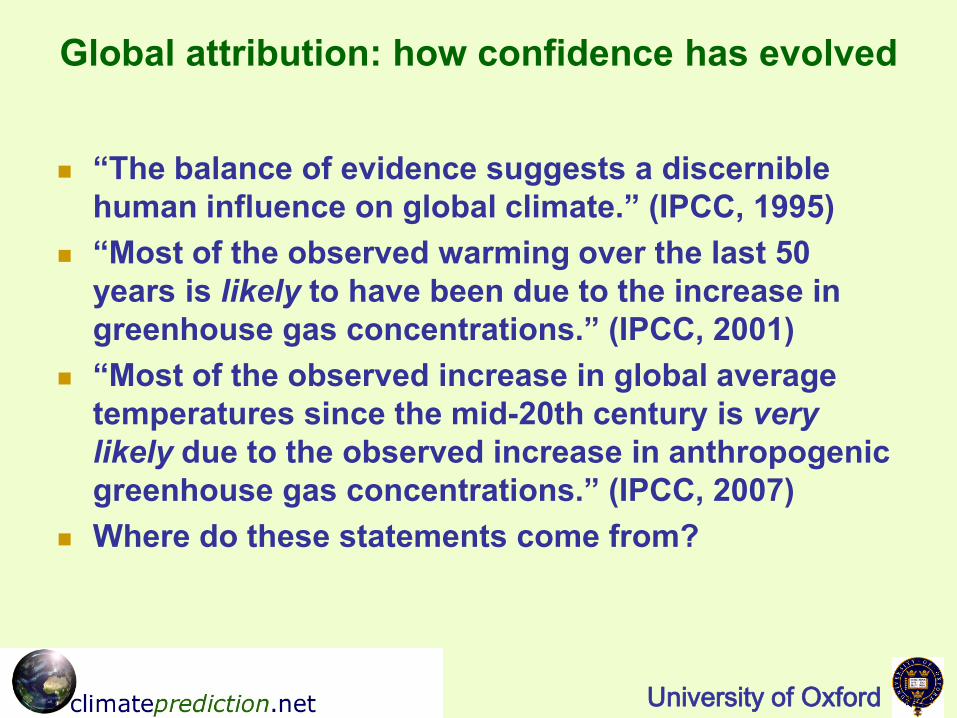
Global attribution: how confidence has evolved
“The balance of evidence suggests a discernible
human influence on global climate.” (IPCC, 1995)
“Most of the observed warming over the last 50
years is likely to have been due to the increase in
greenhouse gas concentrations.” (IPCC, 2001)
“Most of the observed increase in global average
temperatures since the mid-20th century is very
likely due to the observed increase in anthropogenic
greenhouse gas concentrations.” (IPCC, 2007)
Where do these statements come from?

University of Oxford
Observed (dots) and simulated (lines)
temperature response to all external drivers
Northern hemisphere
Southern hemisphere

University of Oxford
After subtracting best-fit response to
sulphates and natural drivers

University of Oxford
After subtracting best-fit response to
greenhouse gas and natural drivers

University of Oxford
After subtracting best-fit response to
all anthropogenic drivers