Embed Size (px)
Citation preview

Attribution of HazeAttribution of HazeProject UpdateProject Update
Stationary Sources Forum and Stationary Sources Forum and Implementation Workgroup Meeting, Implementation Workgroup Meeting,
PhoenixPhoenixDecember 14, 2004December 14, 2004
Joe Adlhoch Joe Adlhoch -- Air Resource Specialists, Inc.Air Resource Specialists, Inc.

OutlineOutline
Project OverviewProject OverviewData InputsData Inputs
Emissions DataEmissions DataMonitoring DataMonitoring DataModelingModeling
Analysis and ResultsAnalysis and ResultsRegional Extinction and EmissionsRegional Extinction and EmissionsAttribution ResultsAttribution ResultsInitial GroupingsInitial GroupingsState Impacts on Class I AreasState Impacts on Class I AreasRegional Assessment Regional Assessment -- FireFire
Major Findings and Next StepsMajor Findings and Next Steps

IntroductionIntroduction
WRAP Strategic Plan (2003)WRAP Strategic Plan (2003)ARS contracted to integrate and synthesize ARS contracted to integrate and synthesize availableavailable 2002 monitoring, modeling, and 2002 monitoring, modeling, and emissions data to identify:emissions data to identify:
Geographic source areas of emissions that contribute to Geographic source areas of emissions that contribute to impairment at federal and tribal Class I areasimpairment at federal and tribal Class I areasMass and species distributions of emissions by source Mass and species distributions of emissions by source category within each geographic source areacategory within each geographic source areaThe amount of natural and anthropogenic emissions The amount of natural and anthropogenic emissions affecting, and the associated visibility impact at, each Class affecting, and the associated visibility impact at, each Class I areaI area
WRAP Strategic PlanWRAP Strategic PlanPhase IPhase I20032003--0505
Phase IIPhase II20052005--0707
Purpose:Purpose:Dry run for Phase II.Dry run for Phase II. Refine and apply Phase IRefine and apply Phase I
approaches for SIP/TIPapproaches for SIP/TIPpurposes.purposes.
Scale:Scale: Regional.Regional. Regional and Regional and subregionalsubregional..
Apportionment:Apportionment:96/02 source contributions.96/02 source contributions.Areas each plan to address.Areas each plan to address.
2002 source contributions.2002 source contributions.Reduction obligations.Reduction obligations.
Strategies:Strategies: Identify options, screen.Identify options, screen. Cost/benefit, select, design.Cost/benefit, select, design.
Communication:Communication: Public education.Public education. Public acceptance.Public acceptance.
Major Major State/TribalState/Tribal
submittals:submittals:2002 emissions inventory.2002 emissions inventory. Modeling run specifications.Modeling run specifications.

AoH Phase I Report StructureAoH Phase I Report Structure
Supporting Reports
(Web-based)
Summary Report(Hardcopy and
Web-based)
WRAP Data Centers

AoH Phase I Web PageAoH Phase I Web Page
http://wrapair.org/forums/aoh/ars1/AoH_Summary_Report_Draft.pdf

DeliverablesDeliverables
Prepared 96 regional/state emissions mapsPrepared 96 regional/state emissions mapsPrepared data summaries for 85 sitesPrepared data summaries for 85 sitesReviewed and analyzed 2002 attribution results Reviewed and analyzed 2002 attribution results for over 100 federal and tribal Class I areasfor over 100 federal and tribal Class I areasDetermined regional groupings of source Determined regional groupings of source impacts across the WRAP regionimpacts across the WRAP regionDeveloped project web page to support findingsDeveloped project web page to support findingsPrepared draft summary reportPrepared draft summary report

Primary Data InputsPrimary Data Inputs
Emissions Inventories (EI)Emissions Inventories (EI)Tracks pollution estimates of source categories and aerosol Tracks pollution estimates of source categories and aerosol speciesspeciesSpatial variation and source strength in EIs affects monitoring Spatial variation and source strength in EIs affects monitoring data and model resultsdata and model resultsConfidence in these data is mediumConfidence in these data is medium
Monitoring DataMonitoring DataSnapshot of aerosol pollution at a given locationSnapshot of aerosol pollution at a given locationConfidence in these data is highConfidence in these data is high
ModelingModelingAllows us to estimate the transformation and movement and Allows us to estimate the transformation and movement and fate of emissions in the atmospherefate of emissions in the atmosphereModel performance is tested by comparisons to monitoring Model performance is tested by comparisons to monitoring datadata

Emissions Data SetEmissions Data Set
EPA 2002 NEI not useable for this purpose EPA 2002 NEI not useable for this purpose →→WRAP facilitated development of “interim” WRAP facilitated development of “interim” 2002 emissions2002 emissions
PointPointAreaAreaMobile (OnMobile (On--Road & NonRoad & Non--Road)Road)Road Dust (Paved & Unpaved)Road Dust (Paved & Unpaved)FireFireWindblown DustWindblown DustBiogenicsBiogenicsModeling Domain Boundary ConditionsModeling Domain Boundary Conditions
AoH interim 2002 EI

Point and Area SourcesPoint and Area SourcesSectorSector WRAP StatesWRAP States CENRAP StatesCENRAP States
Point SourcesPoint Sources
EGUsEGUs ETS/CEM data and EIAETS/CEM data and EIA--767 based 767 based estimates for 2002estimates for 2002
WRAP 1996 point source fileWRAP 1996 point source file
Copper smeltersCopper smelters SOSO22 emissions provided by smelter emissions provided by smelter companiescompanies
Not applicableNot applicable
NonNon--utilities, nonutilities, non--smeltersmelter IAS model projections from 1996 to IAS model projections from 1996 to 20022002Year 2000 facilityYear 2000 facility--level SOlevel SO22emissions substituted for major 9emissions substituted for major 9--State emittersState emitters
IAS model projection from 1996 to IAS model projection from 1996 to 20022002
Area SourcesArea Sources Applied 1999Applied 1999--2002 growth factors 2002 growth factors to 1999 NEI area source emission to 1999 NEI area source emission estimatesestimates
Applied 1999Applied 1999--2002 growth factors 2002 growth factors to 1999 NEI area source emission to 1999 NEI area source emission estimatesestimates
Geographic extent: US States, Canada and MexicoGeographic extent: US States, Canada and MexicoEmissions outside the WRAP and CENRAP regions are from Emissions outside the WRAP and CENRAP regions are from the other RPOs and the EPAthe other RPOs and the EPAPrepared by E.H. Pechan and AssociatesPrepared by E.H. Pechan and Associates
AoH interim 2002 EI

Mobile SourcesMobile Sources
Emissions were estimated for the 1996 base year and four future Emissions were estimated for the 1996 base year and four future years years –– 2003, 2008, 2013, 20182003, 2008, 2013, 2018
Road Dust (2002 interpolated between 1996 and 2018)Road Dust (2002 interpolated between 1996 and 2018)2003 Mobile Emissions used for “interim” 20022003 Mobile Emissions used for “interim” 2002
OnOn--road (EPA MOBILE6 and PART5)road (EPA MOBILE6 and PART5)OffOff--road (EPA NONROAD2000)road (EPA NONROAD2000)
One known limitation:One known limitation:EPA has updated the NONROAD model twice in the last 3 years EPA has updated the NONROAD model twice in the last 3 years ––NONROAD2000 emission estimates are noticeably higher than the NONROAD2000 emission estimates are noticeably higher than the NONROAD2004 estimatesNONROAD2004 estimatesCalifornia provided mobile source emissions estimatesCalifornia provided mobile source emissions estimates
Geographic extent: US States, Canada and MexicoGeographic extent: US States, Canada and MexicoEmissions outside the WRAP region are from the other RPOs Emissions outside the WRAP region are from the other RPOs and the EPAand the EPAPrepared by ENVIRONPrepared by ENVIRON
AoH interim 2002 EI

Fire EmissionsFire Emissions
Actual 2002 wildland fire and prescribed fire Actual 2002 wildland fire and prescribed fire emission inventoriesemission inventoriesAgricultural fire emissions estimates were from Agricultural fire emissions estimates were from Section 309 workSection 309 workSpecific location, date, size and fuel loading for Specific location, date, size and fuel loading for each fire event.each fire event.Geographic extent: WRAP regionGeographic extent: WRAP regionSome emissions outside the WRAP region were Some emissions outside the WRAP region were included, but were incompleteincluded, but were incompletePrepared by Air Sciences, Inc.Prepared by Air Sciences, Inc.
AoH interim 2002 EI

Biogenics and Windblown DustBiogenics and Windblown Dust
Data Inputs:Data Inputs:Land Use/Land Cover (BELD3, NALCC, NLCD)Land Use/Land Cover (BELD3, NALCC, NLCD)Windblown Dust Soil Characteristics (STATSGO; Soil Windblown Dust Soil Characteristics (STATSGO; Soil Landscape of Canada; Intl. Soil Reference and Information Landscape of Canada; Intl. Soil Reference and Information Centre)Centre)Meteorological Data (2002 36Meteorological Data (2002 36--km MM5 )km MM5 )Agricultural Data (BELD3, RUSLE2, CTIC)Agricultural Data (BELD3, RUSLE2, CTIC)
Emissions Estimation Models:Emissions Estimation Models:Biogenic Emissions Inventory System (BEIS3)Biogenic Emissions Inventory System (BEIS3)WRAP Windblown Dust Emissions ModelWRAP Windblown Dust Emissions Model
EI includes modeling domainEI includes modeling domainPrepared by the Regional Modeling CenterPrepared by the Regional Modeling Center
AoH interim 2002 EI

Modeling Domain Boundary ConditionsModeling Domain Boundary Conditions
Boundary conditions derived from annual simulation of Boundary conditions derived from annual simulation of the GEOSCHEM global chemicalthe GEOSCHEM global chemical--transport model. transport model.
GEOSCHEM by Daniel Jacob at HarvardGEOSCHEM by Daniel Jacob at HarvardKey modeled species and grid information were mapped Key modeled species and grid information were mapped from “GEOSCHEM” to CMAQ species by from “GEOSCHEM” to CMAQ species by DaewonDaewon Byun at Byun at University of Houston.University of Houston.Earlier simulations used a seasonal average from Earlier simulations used a seasonal average from GEOSCHEM.GEOSCHEM.AoH final simulations use an annual 2002 simulation with 3AoH final simulations use an annual 2002 simulation with 3--hour time steps.hour time steps.CMAQ initial conditions created by running a “spinCMAQ initial conditions created by running a “spin--up” up” period from Dec 17period from Dec 17--31, 2001.31, 2001.
AoH interim 2002 EI

WRAP Annual 2002 EmissionsWRAP Annual 2002 EmissionsNOx SO2
AoH interim 2002 EI
NH3 PM2.5 PMC

Monitoring Data SetMonitoring Data Set
IMPROVE IMPROVE –– National program to monitor National program to monitor atmospheric aerosols in mandatory federal and atmospheric aerosols in mandatory federal and tribal class I areas (tribal class I areas (CIAsCIAs))Speciated aerosol samples collected every 3 daysSpeciated aerosol samples collected every 3 daysData are used to calculate visibility impairment Data are used to calculate visibility impairment expressed as extinction, deciviews, or visual expressed as extinction, deciviews, or visual range:range:
Tied to Regional Haze Rule requirementsTied to Regional Haze Rule requirementsSome sites have > 15 year historySome sites have > 15 year history

IMPROVE Aerosol Sampler SystemsIMPROVE Aerosol Sampler Systems
•Sulfur>>Sulfate•Fine Soil
•Nitrate•Sulfate(backup)
•Organic Carbon•Elem. Carbon
• CoarseMass

WRAP includes 116 (of 156) Mandatory Federal Class I Areas
WRAP Tribal Class I Areas:• Spokane Tribe• Northern Cheyenne Tribe• Fort Peck Tribes• Confederated Salish and
Kootenai Tribes• Yavapai-Apache Nation• Hualapai Tribe (pending)


Sample IMPROVE Data Timeline PlotSample IMPROVE Data Timeline Plot

Redwood NP (CA) Spokane Indian Reservation (WA)
Sequoia NP (CA) Sawtooth W (ID)

AoH ModelingAoH Modeling
Regional dispersion modelingRegional dispersion modelingTrajectory modelingTrajectory modeling

Regional Scale ModelingRegional Scale Modeling
WRAP Regional Modeling CenterWRAP Regional Modeling Centerhttp://pah.cert.ucr.edu/aqm/308/http://pah.cert.ucr.edu/aqm/308/
CMAQ model runs using 2002 “interim” EIs and CMAQ model runs using 2002 “interim” EIs and MM5 dataMM5 dataCMAQ CMAQ –– EPAEPA--developed model for regional analysisdeveloped model for regional analysisTagged Species Source Apportionment (TSSA)Tagged Species Source Apportionment (TSSA)
Use “Tagged Species” tracers to track chemical Use “Tagged Species” tracers to track chemical transformations and deposition across domaintransformations and deposition across domainAdd source type tracers for key species and for defined Add source type tracers for key species and for defined regions and source categoriesregions and source categoriesContribution results at each receptor site Contribution results at each receptor site –– no need for no need for aerosol samplers to be presentaerosol samplers to be present

0 0 0 0 0 0 0 0 0 0 0 0 0 91 91 91 91 91 91 91 91 91 91 91 91 91 91 91 91 91 91 91 91 91 91 91 91 91 91 91
0 0 0 0 0 0 0 0 0 0 0 0 0 91 91 91 91 91 91 91 91 91 91 91 91 91 91 91 91 91 91 91 91 91 91 91 91 91 91 91
0 0 0 0 0 0 0 0 0 0 0 0 0 91 91 91 91 91 91 91 91 91 91 91 91 91 91 91 91 91 91 91 91 91 91 91 91 91 91 91
0 0 0 0 0 0 0 0 0 0 0 0 0 91 91 91 91 91 91 91 91 91 91 91 91 91 91 91 91 91 91 91 91 91 91 91 91 91 91 91
0 0 0 0 0 0 0 0 0 0 0 0 0 91 91 91 91 91 91 91 91 91 91 91 91 91 91 91 91 91 91 91 91 91 91 91 91 91 91 91
0 0 0 0 0 0 0 0 0 0 0 0 0 91 91 91 91 91 91 91 91 91 91 91 91 91 91 91 91 91 91 91 91 91 91 91 91 91 91 91
0 0 0 0 0 0 0 0 0 0 0 0 0 91 91 91 91 91 91 91 91 91 91 91 91 91 91 91 91 91 91 91 91 91 91 91 91 91 91 91
0 0 0 0 0 0 0 0 0 0 0 0 0 91 91 91 91 91 91 91 91 91 91 91 91 91 91 91 91 91 91 91 91 91 91 91 91 91 91 91
0 0 0 0 0 0 0 0 0 0 0 0 0 91 91 91 91 91 91 91 91 91 91 91 91 91 91 91 91 91 91 91 91 91 91 91 91 91 91 91
0 0 0 0 0 0 0 0 0 0 0 0 0 0 91 91 91 91 91 91 91 91 91 91 91 91 91 91 91 91 91 91 91 91 91 91 91 91 91 91
0 0 0 0 0 0 0 0 0 0 0 0 0 0 91 91 91 91 91 91 91 91 91 91 91 91 91 91 91 91 91 91 91 91 91 91 91 91 91 91
0 0 0 0 0 0 0 0 0 0 0 0 0 0 0 91 91 91 91 91 91 91 91 91 91 91 91 91 91 91 91 91 91 91 91 91 91 91 91 91
0 0 0 0 0 0 0 0 0 0 0 0 0 0 0 91 91 91 91 91 91 91 91 91 91 91 91 91 91 91 91 91 91 91 91 91 91 91 91 91
0 0 0 0 0 0 0 0 0 0 0 0 0 0 0 4 4 91 91 91 91 91 91 91 91 91 91 91 91 91 91 91 91 91 91 91 91 91 91 91
0 0 0 0 0 0 0 0 0 0 4 4 0 0 0 4 4 4 4 4 4 91 91 91 91 91 91 91 91 91 91 91 91 91 91 91 91 91 91 91
0 0 0 0 0 0 0 0 0 0 4 4 4 4 4 4 4 4 4 4 4 4 4 4 4 4 91 91 91 91 91 91 91 91 91 91 91 91 91 91
0 0 0 0 0 0 0 0 0 0 4 4 4 4 4 4 4 4 4 4 4 4 4 4 4 4 5 5 11 11 11 11 11 91 91 91 91 91 91 91
0 0 0 0 0 0 0 0 0 0 4 4 4 4 4 4 4 4 4 4 4 4 4 4 4 5 5 11 11 11 11 11 11 11 11 11 11 91 91 91
0 0 0 0 0 0 0 0 0 0 4 4 4 4 4 4 4 4 4 4 4 4 4 4 4 5 5 11 11 11 11 11 11 11 11 11 11 11 11 11
0 0 0 0 0 0 0 0 0 0 4 4 4 4 4 4 4 4 4 4 4 4 4 4 4 5 5 11 11 11 11 11 11 11 11 11 11 11 11 11
0 0 0 0 0 0 0 0 0 0 3 4 4 4 4 4 4 4 4 4 4 4 4 4 4 5 5 11 11 11 11 11 11 11 11 11 11 11 11 11
0 0 0 0 0 0 0 0 0 3 3 3 4 4 4 4 4 4 4 4 4 4 4 4 5 5 5 5 11 11 11 11 11 11 11 11 11 11 11 11
0 0 0 0 0 0 0 0 0 3 3 3 4 4 4 4 4 4 4 4 4 4 4 4 5 5 5 5 5 11 11 11 11 11 11 11 11 11 11 11
0 0 0 0 0 0 0 0 0 3 3 3 3 3 3 4 4 4 4 4 4 4 4 4 5 5 5 5 5 11 11 11 11 11 11 11 11 11 11 11
0 0 0 0 0 0 0 0 3 3 3 3 3 3 3 3 3 3 3 3 3 3 3 3 5 5 5 5 5 11 11 11 11 11 11 11 11 11 11 11
0 0 0 0 0 0 0 0 3 3 3 3 3 3 3 3 3 3 3 3 3 3 3 3 3 5 5 5 5 11 11 11 11 11 11 11 11 11 11 11
0 0 0 0 0 0 0 0 3 3 3 3 3 3 3 3 3 3 3 3 3 3 3 3 5 5 5 5 5 11 11 11 11 11 11 11 11 11 11 11
0 0 0 0 0 0 0 3 3 3 3 3 3 3 3 3 3 3 3 3 3 3 3 3 5 5 5 5 5 5 11 11 11 11 11 11 11 11 11 11
0 0 0 0 0 0 3 3 3 3 3 3 3 3 3 3 3 3 3 3 3 3 3 5 5 5 5 5 5 5 11 11 11 11 11 11 11 11 11 11
0 0 0 0 0 0 3 3 3 3 3 3 3 3 3 3 3 3 3 3 3 3 3 5 5 5 5 5 5 5 5 11 11 11 11 11 11 11 11 11
0 0 0 0 0 0 3 3 3 3 3 3 3 3 3 3 3 3 3 3 3 3 3 5 5 5 5 5 5 5 5 5 5 5 5 10 10 10 10 10
0 0 0 0 0 0 3 3 3 3 3 3 3 3 3 3 3 3 3 3 3 3 5 5 5 5 5 5 5 5 5 5 5 5 5 10 10 10 10 10
0 0 0 0 0 0 1 1 3 3 3 3 3 3 3 3 3 3 3 3 3 3 5 5 5 5 5 5 5 5 5 5 5 5 5 10 10 10 10 10
0 0 0 0 0 0 1 1 1 1 1 3 3 3 3 3 3 3 3 3 3 3 5 5 5 5 5 5 5 5 5 5 5 5 5 10 10 10 10 10
0 0 0 0 0 1 1 1 1 1 1 1 1 1 1 3 3 3 3 3 3 3 5 5 5 5 5 5 5 5 5 5 5 5 5 10 10 10 10 10
0 0 0 0 0 1 1 1 1 1 1 1 1 1 1 2 2 2 2 3 3 3 5 5 5 5 5 5 5 5 5 5 5 5 5 10 10 10 10 10
0 0 0 0 1 1 1 1 1 1 1 1 1 1 2 2 2 2 2 2 2 2 2 2 5 5 5 5 5 5 5 5 5 5 5 10 10 10 10 10
0 0 0 0 1 1 1 1 1 1 1 1 1 1 2 2 2 2 2 2 2 2 2 2 2 2 2 2 6 5 5 5 5 5 5 10 10 10 10 10
0 0 0 0 1 1 1 1 1 1 1 1 1 1 2 2 2 2 2 2 2 2 2 2 2 2 2 2 6 6 6 6 6 6 6 10 10 10 10 10
0 0 0 0 1 1 1 1 1 1 1 1 1 1 2 2 2 2 2 2 2 2 2 2 2 2 2 2 6 6 6 6 6 6 10 10 10 10 10 10
0 0 0 0 1 1 1 1 1 1 1 1 1 2 2 2 2 2 2 2 2 2 2 2 2 2 2 6 6 6 6 6 6 6 10 10 10 10 10 10
0 0 0 0 1 1 1 1 1 1 1 1 1 2 2 2 2 2 2 2 2 2 2 2 2 2 2 6 6 6 6 6 6 6 6 10 10 10 10 10
0 0 0 0 0 1 1 1 1 1 1 1 1 2 2 2 2 2 2 2 2 2 2 2 2 2 2 6 6 6 6 6 6 6 6 6 6 6 6 9
0 0 0 0 0 1 1 1 1 1 1 1 1 2 2 2 2 2 2 2 2 2 2 2 2 2 2 6 6 6 6 6 6 6 6 6 6 6 6 9
0 0 0 0 0 1 1 1 1 1 1 1 1 1 2 2 2 2 2 2 2 2 2 2 2 2 2 6 6 6 6 6 6 6 6 6 6 6 9 9
0 0 0 0 0 0 1 1 1 1 1 1 1 1 2 2 2 2 2 2 2 2 2 2 2 2 6 6 6 6 6 6 6 6 6 6 6 6 9 9
0 0 0 0 0 0 1 1 1 1 1 1 1 1 1 2 2 2 2 2 2 2 2 2 2 2 6 6 6 6 6 6 6 6 6 6 6 6 9 9
0 0 0 0 0 0 1 1 1 1 1 1 1 1 1 1 2 2 2 2 2 2 2 2 2 2 6 6 6 6 6 6 6 6 6 6 6 6 9 9
0 0 0 0 0 0 1 1 1 1 1 1 1 1 1 1 2 2 2 2 2 2 2 2 2 2 6 6 6 6 6 6 6 6 6 6 6 6 9 9
91 91 91 91 91 91 91 91 91 91 91 91 91 91 91 91 91 91 91 91 91 91 91 91 91 91 9
91 91 91 91 91 91 91 91 91 91 91 91 91 91 91 91 91 91 91 91 91 91 91 91 91 91 9
91 91 91 91 91 91 91 91 91 91 91 91 91 91 91 91 91 91 91 91 91 91 91 91 91 91 9
91 91 91 91 91 91 91 91 91 91 91 91 91 91 91 91 91 91 91 91 91 91 91 91 91 91 9
91 91 91 91 91 91 91 91 91 91 91 91 91 91 91 91 91 91 91 91 91 91 91 91 91 91 9
91 91 91 91 91 91 91 91 91 91 91 91 91 91 91 91 91 91 91 91 91 91 91 91 91 91 9
91 91 91 91 91 91 91 91 91 91 91 91 91 91 91 91 91 91 91 91 91 91 91 91 91 91 9
91 91 91 91 91 91 91 91 91 91 91 91 91 91 91 91 91 91 91 91 91 91 91 91 91 91 9
91 91 91 91 91 91 91 91 91 91 91 91 91 91 91 91 91 91 91 91 91 91 91 91 91 91 9
91 91 91 91 91 91 91 91 91 91 91 91 91 91 91 91 91 91 91 91 91 91 91 91 91 91 9
91 91 91 91 91 91 91 91 91 91 91 91 91 91 91 91 91 91 91 91 91 91 91 91 91 91 9
91 91 91 91 91 91 91 91 91 91 91 91 91 91 91 91 91 91 91 91 91 91 91 91 91 91 9
91 91 91 91 91 91 91 91 91 91 91 91 91 91 91 91 91 91 91 91 91 91 91 91 91 91 9
91 91 91 91 91 91 91 91 91 91 91 91 91 91 91 91 91 91 91 91 91 91 91 91 91 91 9
91 91 91 91 91 91 91 91 91 91 91 91 91 91 91 91 91 91 91 91 91 91 91 91 91 91 9
91 91 91 91 91 91 91 91 91 91 91 91 91 91 91 91 91 91 91 91 91 91 91 91 91 91 9
91 91 91 91 91 91 91 91 91 91 91 91 91 91 91 91 91 91 91 91 91 91 91 91 91 91 9
91 91 91 91 91 91 91 91 91 91 91 91 91 91 91 91 91 91 91 91 91 91 91 91 91 91 9
11 11 11 11 91 91 91 91 91 91 91 91 91 91 91 91 91 91 91 91 91 91 91 91 91 91 9
11 11 11 11 11 11 11 11 11 11 15 15 15 15 15 15 15 15 15 15 15 15 15 22 22 22 2
11 11 11 11 11 11 11 11 11 11 15 15 15 15 15 15 15 15 15 15 15 15 15 15 22 22 2
11 11 11 11 11 11 11 11 11 11 15 15 15 15 15 15 15 15 15 15 15 15 15 15 22 22 2
11 11 11 11 11 11 11 11 11 11 15 15 15 15 15 15 15 15 15 15 15 15 15 15 22 22 2
11 11 11 11 11 11 11 11 11 11 15 15 15 15 15 15 15 15 15 15 15 15 15 15 22 22 2
11 11 11 11 11 11 11 11 11 11 15 15 15 15 15 15 15 15 15 15 15 15 15 15 22 22 2
11 11 11 11 11 11 11 11 11 11 15 15 15 15 15 15 15 15 15 15 15 15 15 15 22 22 2
11 11 11 11 11 11 11 11 11 11 15 15 15 15 15 15 15 15 15 15 15 15 15 15 15 22 2
11 11 11 11 11 11 11 11 11 11 15 15 15 15 15 15 15 15 15 15 15 15 15 15 15 22 2
11 11 11 11 11 11 11 11 11 11 26 26 26 26 26 26 26 26 26 26 26 26 26 26 26 22 2
11 11 11 11 11 11 11 11 11 11 26 26 26 26 26 26 26 26 26 26 26 26 26 26 26 22 2
10 10 10 10 11 11 11 11 11 11 26 26 26 26 26 26 26 26 26 26 26 26 26 26 26 22 2
10 10 10 10 10 10 10 10 10 10 26 26 26 26 26 26 26 26 26 26 26 26 26 26 26 26 2
10 10 10 10 10 10 10 10 10 10 26 26 26 26 26 26 26 26 26 26 26 26 26 26 26 26 2
10 10 10 10 10 10 10 10 10 10 26 26 26 26 26 26 26 26 26 26 26 26 26 26 26 26 2
10 10 10 10 10 10 10 10 10 26 26 26 26 26 26 26 26 26 26 26 26 26 26 26 26 26 2
10 10 10 10 10 10 10 10 10 26 26 26 26 26 26 26 26 26 26 26 26 26 26 26 26 26 1
10 10 10 10 10 10 10 10 10 26 26 26 26 26 26 26 26 26 26 26 26 26 26 26 26 26 1
10 10 10 10 10 10 10 10 10 39 39 39 39 39 39 39 39 39 39 39 39 39 26 26 26 26 1
10 10 10 10 10 10 10 10 10 39 39 39 39 39 39 39 39 39 39 39 39 39 39 39 39 39 1
10 10 10 10 10 10 10 10 10 39 39 39 39 39 39 39 39 39 39 39 39 39 39 39 39 39 1
10 10 10 10 10 10 10 10 10 39 39 39 39 39 39 39 39 39 39 39 39 39 39 39 39 39 3
10 10 10 10 10 10 10 10 10 39 39 39 39 39 39 39 39 39 39 39 39 39 39 39 39 39 3
9 9 9 9 10 10 10 10 10 39 39 39 39 39 39 39 39 39 39 39 39 39 39 39 39 39 3
9 9 9 9 9 9 9 9 9 9 9 9 9 39 39 39 39 39 39 39 39 39 39 39 39 39 3
9 9 9 9 9 9 9 9 9 9 9 9 9 39 39 39 39 39 39 39 39 39 39 39 39 39 3
9 9 9 9 9 9 9 9 9 9 9 9 9 39 39 39 39 39 39 39 39 39 39 39 39 39 3
9 9 9 9 9 9 9 9 9 9 9 9 9 50 50 50 50 50 50 50 50 50 50 50 50 50 5
9 9 9 9 9 9 9 9 9 9 9 9 9 50 50 50 50 50 50 50 50 50 50 50 50 50 5
9 9 9 9 9 9 9 9 9 9 9 9 9 50 50 50 50 50 50 50 50 50 50 50 50 50 50 0 0 0 0 0 1 1 1 1 1 1 1 1 1 1 1 1 2 2 2 2 2 2 2 6 6 6 6 6 6 6 6 6 6 6 6 6 9 9
0 0 0 0 0 0 0 1 1 1 1 1 1 1 1 1 1 1 2 2 2 2 2 2 2 6 6 6 6 6 6 6 6 6 6 6 6 9 9 9
0 0 0 0 0 0 0 1 1 1 1 1 1 1 1 1 1 1 1 2 2 2 2 2 2 7 7 7 6 6 6 6 6 6 6 6 6 9 9 9
0 0 0 0 0 0 0 0 1 1 1 1 1 1 1 1 1 1 1 1 2 2 2 2 2 7 7 7 7 7 7 7 7 7 7 6 6 9 9 9
0 0 0 0 0 0 0 0 1 1 1 1 1 1 1 1 1 1 1 1 1 2 2 7 7 7 7 7 7 7 7 7 7 7 7 7 7 8 8 8
0 0 0 0 0 0 0 0 1 1 1 1 1 1 1 1 1 1 1 1 1 2 2 7 7 7 7 7 7 7 7 7 7 7 7 7 7 8 8 8
0 0 0 0 0 0 0 0 0 1 1 1 1 1 1 1 1 1 1 1 1 1 2 7 7 7 7 7 7 7 7 7 7 7 7 7 7 8 8 8
0 0 0 0 0 0 0 0 0 0 0 1 1 1 1 1 1 1 1 1 1 1 1 7 7 7 7 7 7 7 7 7 7 7 7 7 7 8 8 8
0 0 0 0 0 0 0 0 0 0 0 1 1 1 1 1 1 1 1 1 1 1 1 7 7 7 7 7 7 7 7 7 7 7 7 7 7 8 8 8
0 0 0 0 0 0 0 0 0 0 0 0 0 1 1 1 1 1 1 1 1 1 1 7 7 7 7 7 7 7 7 7 7 7 7 7 7 8 8 8
0 0 0 0 0 0 0 0 0 0 0 0 0 0 1 1 1 1 1 1 1 1 1 7 7 7 7 7 7 7 7 7 7 7 7 7 7 8 8 8
0 0 0 0 0 0 0 0 0 0 0 0 0 0 0 1 1 1 1 1 1 1 7 7 7 7 7 7 7 7 7 7 7 7 7 7 8 8 8 8
0 0 0 0 0 0 0 0 0 0 0 0 0 0 0 1 1 1 1 1 1 1 7 7 7 7 7 7 7 7 7 7 7 7 7 7 8 8 8 8
0 0 0 0 0 0 0 0 0 0 0 0 0 0 0 1 1 1 1 1 1 1 7 7 7 7 7 7 7 7 7 7 7 7 7 7 8 8 8 8
0 0 0 0 0 0 0 0 0 0 0 0 0 0 0 92 92 92 92 92 92 1 7 7 7 7 7 7 7 7 7 7 7 7 7 7 8 8 8 8
0 0 0 0 0 0 0 0 0 0 0 0 0 0 0 0 92 92 92 92 92 92 7 7 7 7 7 7 7 7 7 7 7 7 7 7 8 8 8 8
0 0 0 0 0 0 0 0 0 0 0 0 0 0 0 0 92 92 92 92 92 92 92 7 7 7 7 7 7 7 7 7 7 7 7 7 8 8 8 8
0 0 0 0 0 0 0 0 0 0 0 0 0 0 0 0 92 92 92 92 92 92 92 92 92 7 7 7 7 7 7 7 7 7 7 7 8 8 8 8
0 0 0 0 0 0 0 0 0 0 0 0 0 0 0 0 92 92 92 92 92 0 92 92 92 92 92 7 7 7 7 7 7 7 7 7 8 8 8 8
0 0 0 0 0 0 0 0 0 0 0 0 0 0 0 0 0 92 92 92 92 0 0 0 92 92 92 92 92 7 7 7 7 7 7 8 8 8 8 8
0 0 0 0 0 0 0 0 0 0 0 0 0 0 0 0 0 92 92 92 92 0 0 0 0 92 92 92 92 92 7 7 7 7 7 8 8 8 92 92
0 0 0 0 0 0 0 0 0 0 0 0 0 0 0 0 0 92 92 92 92 0 0 0 0 92 92 92 92 92 92 92 92 92 92 92 92 92 92 92
0 0 0 0 0 0 0 0 0 0 0 0 0 0 0 0 0 92 92 92 92 0 0 0 0 92 92 92 92 92 92 92 92 92 92 92 92 92 92 92
0 0 0 0 0 0 0 0 0 0 0 0 0 0 0 0 0 0 92 92 92 0 0 0 0 92 92 92 92 92 92 92 92 92 92 92 92 92 92 92
0 0 0 0 0 0 0 0 0 0 0 0 0 0 0 0 0 0 0 92 92 92 0 0 0 92 92 92 92 92 92 92 92 92 92 92 92 92 92 92
0 0 0 0 0 0 0 0 0 0 0 0 0 0 0 0 0 0 0 92 92 92 0 0 0 0 92 92 92 92 92 92 92 92 92 92 92 92 92 92
0 0 0 0 0 0 0 0 0 0 0 0 0 0 0 0 0 0 0 0 92 92 92 0 0 0 92 92 92 92 92 92 92 92 92 92 92 92 92 92
0 0 0 0 0 0 0 0 0 0 0 0 0 0 0 0 0 0 0 0 0 92 92 92 0 92 0 92 92 92 92 92 92 92 92 92 92 92 92 92
0 0 0 0 0 0 0 0 0 0 0 0 0 0 0 0 0 92 0 0 0 92 92 92 0 0 0 92 92 92 92 92 92 92 92 92 92 92 92 92
0 0 0 0 0 0 0 0 0 0 0 0 0 0 0 0 0 0 92 92 92 92 92 92 0 0 0 0 92 92 92 92 92 92 92 92 92 92 92 92
0 0 0 0 0 0 0 0 0 0 0 0 0 0 0 0 0 0 0 92 92 92 92 92 0 0 0 0 92 92 92 92 92 92 92 92 92 92 92 92
0 0 0 0 0 0 0 0 0 0 0 0 0 0 0 0 0 0 0 0 92 92 92 92 92 0 0 0 0 0 92 92 92 92 92 92 92 92 92 92
0 0 0 0 0 0 0 0 0 0 0 0 0 0 0 0 0 0 0 0 92 92 92 92 0 0 0 0 0 92 92 92 92 92 92 92 92 92 92 92
0 0 0 0 0 0 0 0 0 0 0 0 0 0 0 0 0 0 0 0 0 92 92 92 92 0 0 0 0 0 92 92 92 92 92 92 92 92 92 92
0 0 0 0 0 0 0 0 0 0 0 0 0 0 0 0 0 0 0 0 0 0 92 92 92 92 0 0 0 0 0 92 92 92 92 92 92 92 92 92
0 0 0 0 0 0 0 0 0 0 0 0 0 0 0 0 0 0 0 0 0 0 0 92 92 92 0 0 0 0 0 0 92 92 92 92 92 92 92 92
0 0 0 0 0 0 0 0 0 0 0 0 0 0 0 0 0 0 0 0 0 0 0 0 92 92 0 0 0 0 0 0 92 92 92 92 92 92 92 92
0 0 0 0 0 0 0 0 0 0 0 0 0 0 0 0 0 0 0 0 0 0 0 0 92 92 92 0 0 0 0 0 92 92 92 92 92 92 92 92
0 0 0 0 0 0 0 0 0 0 0 0 0 0 0 0 0 0 0 0 0 0 0 0 92 92 92 0 0 0 0 0 92 92 92 92 92 92 92 92
0 0 0 0 0 0 0 0 0 0 0 0 0 0 0 0 0 0 0 0 0 0 0 92 92 92 92 0 0 0 0 0 0 92 92 92 92 92 92 92
0 0 0 0 0 0 0 0 0 0 0 0 0 0 0 0 0 0 0 0 0 0 0 0 92 92 92 0 0 0 0 0 0 0 0 92 92 92 92 92
0 0 0 0 0 0 0 0 0 0 0 0 0 0 0 0 0 0 0 0 0 0 0 0 0 92 92 0 0 0 0 0 0 0 0 0 92 92 92 92
0 0 0 0 0 0 0 0 0 0 0 0 0 0 0 0 0 0 0 0 0 0 0 0 0 0 92 92 92 0 0 0 0 0 0 0 92 92 92 92
0 0 0 0 0 0 0 0 0 0 0 0 0 0 0 0 0 0 0 0 0 0 0 0 0 0 0 92 92 92 0 0 0 0 0 0 0 92 92 92
9 9 9 9 9 9 9 9 9 9 9 9 9 50 50 50 50 50 50 50 50 50
9 9 9 9 9 9 9 9 9 9 9 9 9 50 50 50 50 50 50 50 50 50
9 9 9 9 9 9 9 9 9 9 9 9 9 50 50 50 50 50 50 50 50 50
9 9 9 9 9 9 9 9 9 9 9 9 9 50 50 50 50 50 50 50 50 50
8 8 8 8 8 9 9 9 9 9 9 9 9 50 50 50 50 50 50 50 50 50
8 8 8 8 8 8 8 8 8 8 8 20 20 20 20 20 20 20 20 20 20 20
8 8 8 8 8 8 8 8 8 8 8 60 60 60 60 60 60 60 20 20 20 20
8 8 8 8 8 8 8 8 8 8 8 60 60 60 60 60 60 60 20 20 20 20
8 8 8 8 8 8 8 8 8 8 8 60 60 60 60 60 60 60 20 20 20 20
8 8 8 8 8 8 8 8 8 8 8 60 60 60 60 60 60 60 20 20 20 20
8 8 8 8 8 8 8 8 8 8 8 60 60 60 60 60 60 60 20 20 20 20
8 8 8 8 8 8 8 8 8 8 8 60 60 60 60 60 60 60 20 20 20 20
8 8 8 8 8 8 8 8 8 8 60 60 60 60 60 60 60 60 20 20 20 20
8 8 8 8 8 8 8 8 8 8 60 60 60 60 60 60 60 60 60 60 60 60
8 8 8 8 8 8 8 8 8 8 60 60 60 60 60 60 60 60 60 60 60 60
8 8 8 8 8 8 8 8 8 8 60 60 60 60 60 60 60 60 60 60 60 60
8 8 8 8 8 8 8 8 8 8 60 60 60 60 60 60 60 60 60 60 60 60
8 8 8 8 8 8 8 8 8 8 60 60 60 60 60 60 60 60 60 60 60 60
8 8 8 8 8 8 8 8 8 8 60 60 60 60 60 60 60 60 60 60 60 60
8 60 60 60 8 8 8 8 8 8 60 60 60 60 60 60 60 60 60 60 60 60
92 60 60 60 60 60 60 60 60 60 60 60 60 60 60 60 60 60 60 60 60 60
92 92 60 60 60 60 60 60 60 60 60 60 60 60 60 60 60 60 60 60 60 60
92 92 92 60 60 60 60 60 60 60 60 60 60 60 60 60 60 60 60 60 60 60
92 92 92 92 60 60 60 60 60 60 60 60 60 60 60 60 60 60 60 60 60 60
92 92 92 92 92 60 60 60 60 60 60 60 60 60 60 60 60 60 60 60 60 60
92 92 92 92 92 60 60 60 60 60 60 60 60 60 60 60 60 60 60 60 60 60
92 92 92 92 92 92 60 60 60 60 60 60 60 60 60 60 60 60 60 60 60 60
92 92 92 92 92 92 60 60 60 60 92 92 92 92 92 60 60 60 60 60 60 60
92 92 92 92 92 92 92 92 60 60 92 92 92 92 92 92 60 60 60 60 60 60
92 92 92 92 92 92 92 92 92 92 92 92 92 92 92 92 60 60 60 60 60 60
92 92 92 92 92 92 92 92 92 92 92 92 92 92 92 92 92 60 60 60 60 60
92 92 92 92 92 92 92 92 92 92 92 92 92 92 92 92 92 60 60 60 60 60
92 92 92 92 92 92 92 92 92 92 92 92 92 92 92 92 92 60 60 60 60 60
92 92 92 92 92 92 92 92 92 92 92 92 92 92 92 92 92 92 60 60 60 60
92 92 92 92 92 92 92 92 92 92 92 92 92 92 92 92 92 92 60 60 60 60
92 92 92 92 92 92 92 92 92 92 92 92 92 92 92 92 92 92 92 60 60 60
92 92 92 92 92 92 92 92 92 92 92 92 92 92 92 92 92 92 92 60 60 60
92 92 92 92 92 92 92 92 92 92 92 92 92 92 92 92 92 92 92 60 60 60
92 92 92 92 92 92 92 92 92 92 92 92 92 92 92 92 92 92 92 92 92 92
92 92 92 92 92 92 92 92 92 92 92 92 92 92 92 92 92 92 92 92 92 92
92 92 92 92 92 92 92 92 92 92 92 92 92 92 92 92 92 92 92 92 92 92
Traced Area: WRAP Modeling DomainTraced Area: WRAP Modeling Domain
Each state is distinguished by a unique number in the source area mapping file
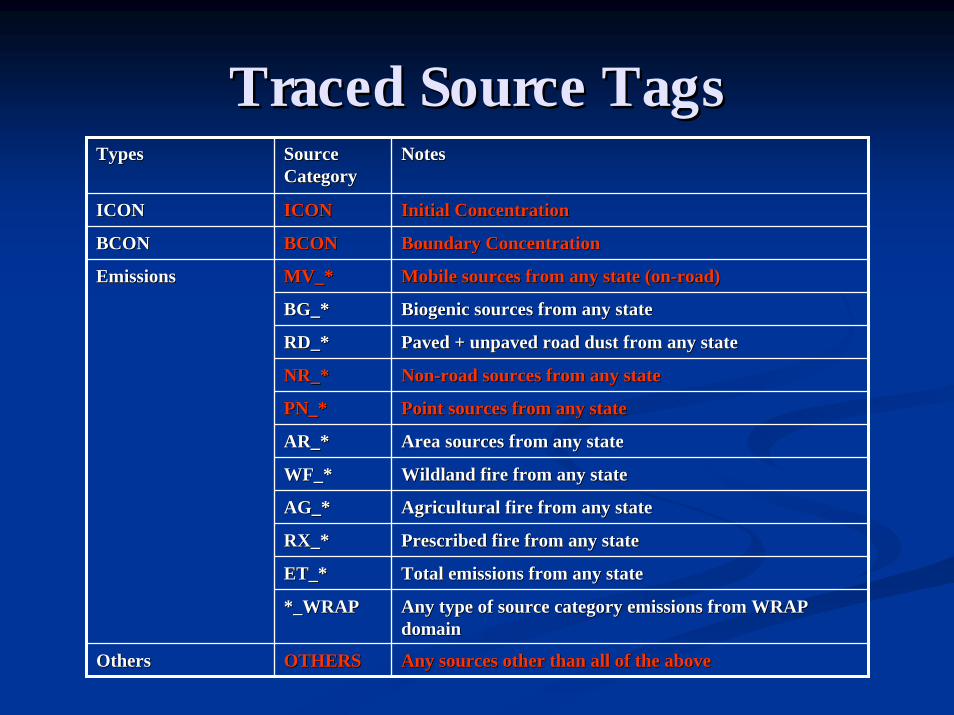
TypesTypes Source Source CategoryCategory
NotesNotes
*_WRAP*_WRAP Any type of source category emissions from WRAP Any type of source category emissions from WRAP domaindomain
ICONICON ICONICON Initial ConcentrationInitial Concentration
BCONBCON BCONBCON Boundary ConcentrationBoundary Concentration
MV_*MV_* Mobile sources from any state (onMobile sources from any state (on--road)road)
BG_*BG_* Biogenic sources from any stateBiogenic sources from any state
RD_*RD_* Paved + unpaved road dust from any statePaved + unpaved road dust from any state
NR_*NR_* NonNon--road sources from any stateroad sources from any state
PN_*PN_* Point sources from any statePoint sources from any state
AR_*AR_* Area sources from any stateArea sources from any state
WF_*WF_* Wildland fire from any stateWildland fire from any state
AG_*AG_* Agricultural fire from any stateAgricultural fire from any state
RX_*RX_* Prescribed fire from any statePrescribed fire from any state
ET_*ET_* Total emissions from any stateTotal emissions from any state
OthersOthers OTHERSOTHERS Any sources other than all of the aboveAny sources other than all of the above
EmissionsEmissions
Traced Source TagsTraced Source Tags

Trajectory Regression Analysis (TRA)Trajectory Regression Analysis (TRA)
Desert Research InstituteDesert Research InstitutePart of WRAP Causes of Haze Assessment Part of WRAP Causes of Haze Assessment (COHA)(COHA)http://coha.dri.edu/index.htmlhttp://coha.dri.edu/index.html
Meteorological back trajectories run for 2000 Meteorological back trajectories run for 2000 –– 2002 to 2002 to determine flow patterns for each IMPROVE sitedetermine flow patterns for each IMPROVE siteTRA finds the best fit between the time air spends TRA finds the best fit between the time air spends over a defined area (source region) and the air quality over a defined area (source region) and the air quality parameter measured at an IMPROVE siteparameter measured at an IMPROVE siteContribution results at each IMPROVE siteContribution results at each IMPROVE site
No results for unmonitored No results for unmonitored CIAsCIAsMonitored locations must have sufficient dataMonitored locations must have sufficient data

Back Trajectory Back Trajectory Residence Time Residence Time
SummariesSummaries
20% worst sulfate days 20% worst sulfate days (2000 (2000 –– 2002)2002)W, SW, SE show highest W, SW, SE show highest residence times at Great residence times at Great Sand DunesSand DunesNW, W, S show highest NW, W, S show highest residence times at residence times at Craters of the MoonCraters of the Moon
Great Sand Dunes, Colorado
Craters of the Moon, Idaho

TRA Source Regions TRA Source Regions -- ExampleExample

Used for Used for comparison of comparison of TSSA and TRA TSSA and TRA resultsresultsBoundary states Boundary states (inner circle)(inner circle)U.S. regions U.S. regions (outer circle)(outer circle)International International (Can., Mex.)(Can., Mex.)Other (ocean, Other (ocean, gulf, boundary gulf, boundary conditions, conditions, unknown or not unknown or not able to attribute)able to attribute)
Source Region Grouping Source Region Grouping -- ExampleExample

TSSATSSAErrors and uncertainties in gridded meteorological dataErrors and uncertainties in gridded meteorological dataEmissions inventories uncertain and in some cases Emissions inventories uncertain and in some cases incompleteincompleteTSSA TSSA –– new application in CMAQnew application in CMAQ36 km grid resolution is too coarse to resolve near field 36 km grid resolution is too coarse to resolve near field effectseffects
TRATRAStatistical technique Statistical technique –– has associated uncertainty limitshas associated uncertainty limitsBased on EDAS back trajectories Based on EDAS back trajectories –– uncertainty increases as uncertainty increases as you move away from the end time and dateyou move away from the end time and date“Edge effect” for “Edge effect” for CIAsCIAs or source regions near the boundary or source regions near the boundary of a stateof a state
Modeling UncertaintiesModeling Uncertainties
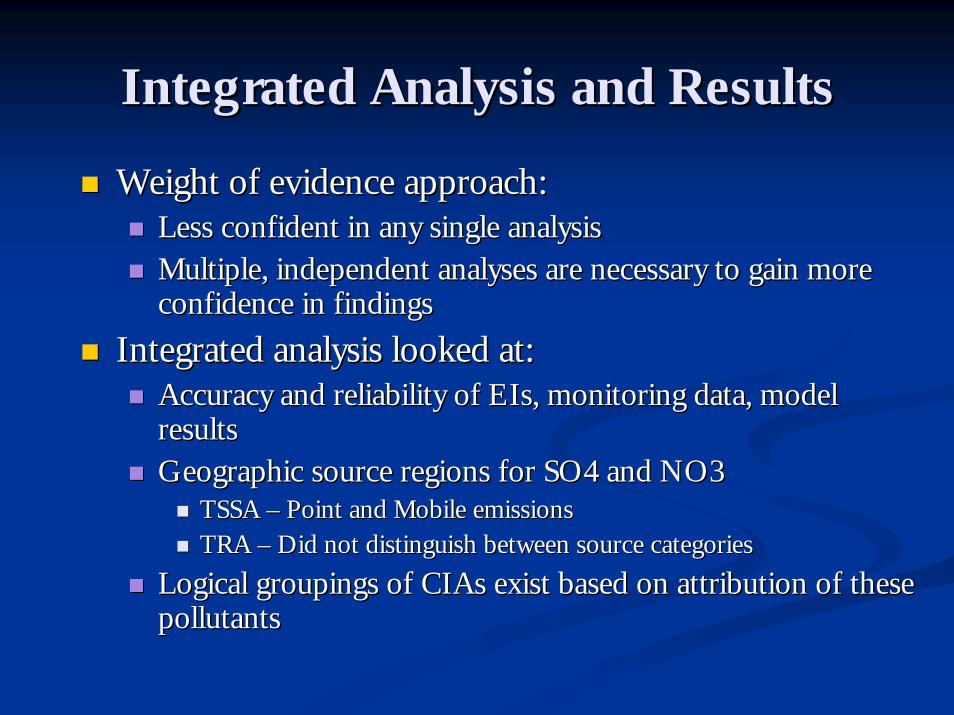
Integrated Analysis and ResultsIntegrated Analysis and Results
Weight of evidence approach:Weight of evidence approach:Less confident in any single analysisLess confident in any single analysisMultiple, independent analyses are necessary to gain more Multiple, independent analyses are necessary to gain more confidence in findingsconfidence in findings
Integrated analysis looked at:Integrated analysis looked at:Accuracy and reliability of EIs, monitoring data, model Accuracy and reliability of EIs, monitoring data, model resultsresultsGeographic source regions for SO4 and NO3Geographic source regions for SO4 and NO3
TSSA TSSA –– Point and Mobile emissionsPoint and Mobile emissionsTRA TRA –– Did not distinguish between source categoriesDid not distinguish between source categories
Logical groupings of Logical groupings of CIAsCIAs exist based on attribution of these exist based on attribution of these pollutantspollutants

Weight of Evidence Approach Weight of Evidence Approach ––ConsiderationsConsiderations
TSSA ResultsTSSA ResultsSupported by other analyses?Supported by other analyses?What if contradicted by other analyses?What if contradicted by other analyses?
TRA ResultsTRA ResultsNoisy data Noisy data –– statistical interpretation requiredstatistical interpretation requiredFarther source regions must be larger to compensate for increasiFarther source regions must be larger to compensate for increasing ng uncertainties in longer trajectoriesuncertainties in longer trajectoriesDo we see possible “edge effects”?Do we see possible “edge effects”?
Monitoring DataMonitoring DataReasonably accurate and certain measurementsReasonably accurate and certain measurementsAs a snap shot, can’t demonstrate cause and effectAs a snap shot, can’t demonstrate cause and effect
EmissionsEmissionsEI are estimates, not directly measuredEI are estimates, not directly measuredDo EI inputs support attribution results?Do EI inputs support attribution results?

Aerosol Extinction
Sulfate Extinction
Nitrate Extinction
Organics Extinction
2002 WRAP Aerosol/Species Extinction2002 WRAP Aerosol/Species Extinction

SOSO22 Emissions (WRAP 2002 Interim EI)Emissions (WRAP 2002 Interim EI)

NONOXX Emissions (WRAP 2002 Interim EI)Emissions (WRAP 2002 Interim EI)

Sample State Sample State Emissions Emissions
Summary for NOxSummary for NOx
State map with 36 x 36 State map with 36 x 36 km gridded emissionskm gridded emissionsBrief text description of Brief text description of NOxNOxBreakdown of stateBreakdown of state--wide NOx emissions by wide NOx emissions by source typesource type
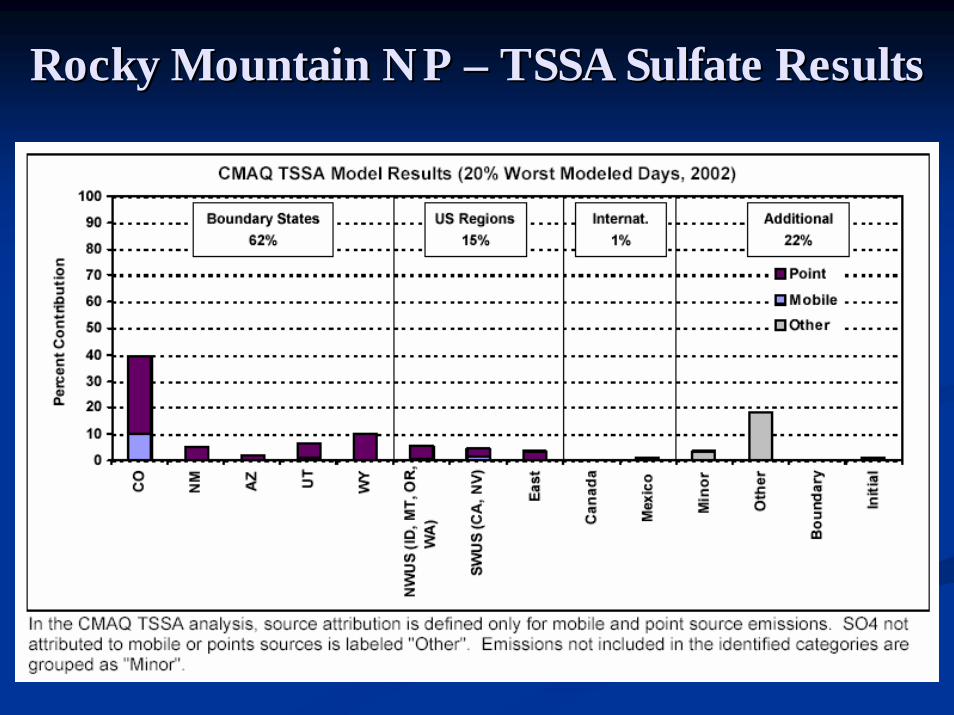
Rocky Mountain NP Rocky Mountain NP –– TSSA Sulfate ResultsTSSA Sulfate Results

Rocky Mountain NP Rocky Mountain NP –– TRA Sulfate ResultsTRA Sulfate Results

Rocky Mountain NP Rocky Mountain NP –– TSSA Nitrate ResultsTSSA Nitrate Results

Colorado emissions Colorado emissions are a major contributor are a major contributor in both methodsin both methodsBorder states impact Border states impact ROMO in both ROMO in both methods (49methods (49--67%)67%)Other US regions also Other US regions also contribute in both contribute in both methods (16methods (16--27%)27%)Largest differences Largest differences between TSSA and between TSSA and TRA seen in TRA seen in attribution from attribution from Colorado and Colorado and WyomingWyoming
Attribution Summary for Rocky Mountain NPAttribution Summary for Rocky Mountain NP
Source RegionsImpacting TSSA TRA TSSA
Rocky Mountain NP Sulfate (%) Sulfate (%) Nitrate (%)Colorado 40 31 28New Mexico 6 4 4Arizona 2 9 3Utah 8 4 10Wyoming 11 1 8NW US (ID, MT, OR, WA) 7 9 6SW US (CA, NV) 5 7 10East 4 11 4Canada 0 2 4Mexico 1 5 0Minor 3 -- 8Other 19 -- 22Boundary 0 -- 0Initial 1 -- 0Pacific Coast -- 8 --Pacific Ocean -- 8 --Gulf of Mex. -- 3 --Atlantic Ocean -- 2 --
Contribution by Method
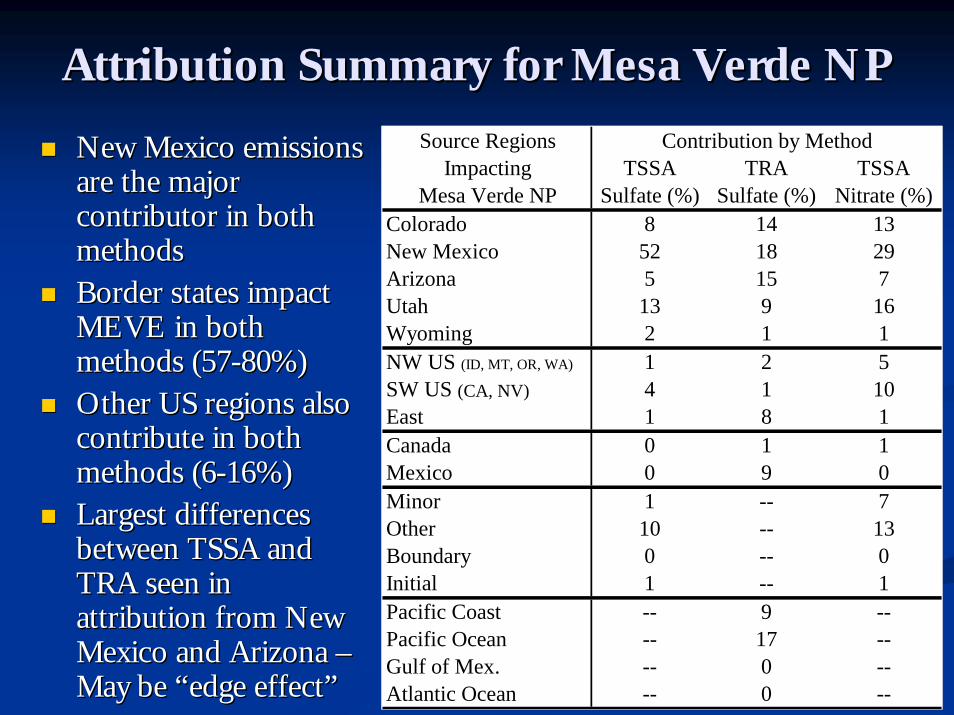
New Mexico emissions New Mexico emissions are the major are the major contributor in both contributor in both methodsmethodsBorder states impact Border states impact MEVE in both MEVE in both methods (57methods (57--80%)80%)Other US regions also Other US regions also contribute in both contribute in both methods (6methods (6--16%)16%)Largest differences Largest differences between TSSA and between TSSA and TRA seen in TRA seen in attribution from New attribution from New Mexico and Arizona Mexico and Arizona ––May be “edge effect”May be “edge effect”
Attribution Summary for Mesa Verde NPAttribution Summary for Mesa Verde NP
Source RegionsImpacting TSSA TRA TSSA
Mesa Verde NP Sulfate (%) Sulfate (%) Nitrate (%)Colorado 8 14 13New Mexico 52 18 29Arizona 5 15 7Utah 13 9 16Wyoming 2 1 1NW US (ID, MT, OR, WA) 1 2 5SW US (CA, NV) 4 1 10East 1 8 1Canada 0 1 1Mexico 0 9 0Minor 1 -- 7Other 10 -- 13Boundary 0 -- 0Initial 1 -- 1Pacific Coast -- 9 --Pacific Ocean -- 17 --Gulf of Mex. -- 0 --Atlantic Ocean -- 0 --
Contribution by Method

““Edge Effect” Explanation for Edge Effect” Explanation for Sulfate TRA ResultsSulfate TRA Results
Trajectory points Trajectory points every 3 hours may every 3 hours may not accurately not accurately represent high represent high emission source emission source regions near the regions near the edges of statesedges of statesTherefore, TRA Therefore, TRA results may miss or results may miss or underestimate the underestimate the impact from these impact from these regionsregions

24 groupings24 groupingsBased on Based on source region source region attribution and attribution and species signal species signal strength and strength and similaritysimilarityGroupings Groupings similar for SO4 similar for SO4 and NO3and NO3
Initial Grouping of Initial Grouping of CIAsCIAs by Sulfate by Sulfate and Nitrate Source Attributionand Nitrate Source Attribution

Available Attribution InformationAvailable Attribution Information
Attribution Support
Species TSSATrajectory Regression
Back Trajectory Summaries Emissions Monitoring
Sulfate x x x x xNitrate x x x x
Organics x x xElem. Carbon x x x
Soil x x xCoarse x x x
Extinction x x x
Other Supporting DataAttribution Results
More information for some species than othersMore information for some species than othersCredibility of results depend on how well all categories Credibility of results depend on how well all categories of information agreeof information agree

Colorado’s Contribution to SulfateColorado’s Contribution to Sulfate
0%5%
10%15%20%25%30%35%40%45%50%
Mou
nt Z
irkel
W
Roc
ky M
ount
ain
NP
Raw
ah W
Eagl
es N
est W
Flat
Top
s W
Gre
at S
and
Dun
es N
P
Mar
oon
Bel
ls-S
now
mas
s W
Bla
ck C
anyo
n of
Gun
niso
n N
P
Wes
t Elk
W
La G
arita
W
Wem
inuc
he W
Mes
a Ve
rde
NP
Peco
s W
San
Pedr
o Pa
rks
W
Ban
delie
r NM
Bos
que
del A
pach
e W
Whi
te M
ount
ain
W
Salt
Cre
ek W
Gila
W
Can
yonl
ands
NP
Arc
hes
NP
Cap
ital R
eef N
P
Bry
ce C
anyo
n N
P
Win
d C
ave
NP
Bad
land
s N
P
CO NM UT SD
Con
trib
utio
n to
CIA

Colorado’s Contribution to NitrateColorado’s Contribution to Nitrate
0%5%
10%15%20%25%30%35%40%45%50%
Roc
ky M
ount
ain
NP
Eagl
es N
est W
Raw
ah W
Mou
nt Z
irkel
W
Gre
at S
and
Dun
es N
P
Mar
oon
Bel
ls-S
now
mas
s W
La G
arita
W
Bla
ck C
anyo
n of
Gun
niso
n N
P
Mes
a Ve
rde
NP
Flat
Top
s W
Wes
t Elk
W
Wem
inuc
he W
Peco
s W
San
Pedr
o Pa
rks
W
Ban
delie
r NM
Whi
te M
ount
ain
W
Salt
Cre
ek W
Car
lsba
d C
aver
ns N
P
Bos
que
del A
pach
e W
Gila
W
Chi
ricah
ua N
M
Arc
hes
NP
Can
yonl
ands
NP
Win
d C
ave
NP
Bad
land
s N
P
CO NM AZ UT SD
Con
trib
utio
n to
CIA

Attribution MatrixAttribution Matrix<<<<< Source Regions (States, etc.) >>>>>
<<
<<
< C
lass I Areas >
>>
>>
Contributions (%) to CIAs by Source Regions:
Which source regions affect CIAs?
Which CIAs do source regions affect?

Regional Assessment Regional Assessment -- FireFireA.A. The difference between the CMAQThe difference between the CMAQ--modeled visibility impacts with modeled visibility impacts with
and without all fire emissions.and without all fire emissions.This model run is designed to isolate the effect of fire emissioThis model run is designed to isolate the effect of fire emissions ns on visibility from the effect of all other emissions sources in on visibility from the effect of all other emissions sources in the the model.model.
B.B. The difference between the CMAQThe difference between the CMAQ--modeled visibility impacts with modeled visibility impacts with “natural” fire emissions, and all fire emissions.“natural” fire emissions, and all fire emissions.
This model run is designed to isolate the effect of This model run is designed to isolate the effect of “anthropogenic” fire emissions on visibility from the effect of “anthropogenic” fire emissions on visibility from the effect of all other emissions sources in the model, including “natural” all other emissions sources in the model, including “natural” fire.fire.
C.C. The difference between the CMAQThe difference between the CMAQ--modeled visibility impacts with modeled visibility impacts with all fire emissions, and without anthropogenic fire emissions.all fire emissions, and without anthropogenic fire emissions.
This model run is designed to isolate effects of “natural” fire This model run is designed to isolate effects of “natural” fire emissions on visibility from the effect of all other emissions emissions on visibility from the effect of all other emissions sources in the model, including “anthropogenic” fire.sources in the model, including “anthropogenic” fire.
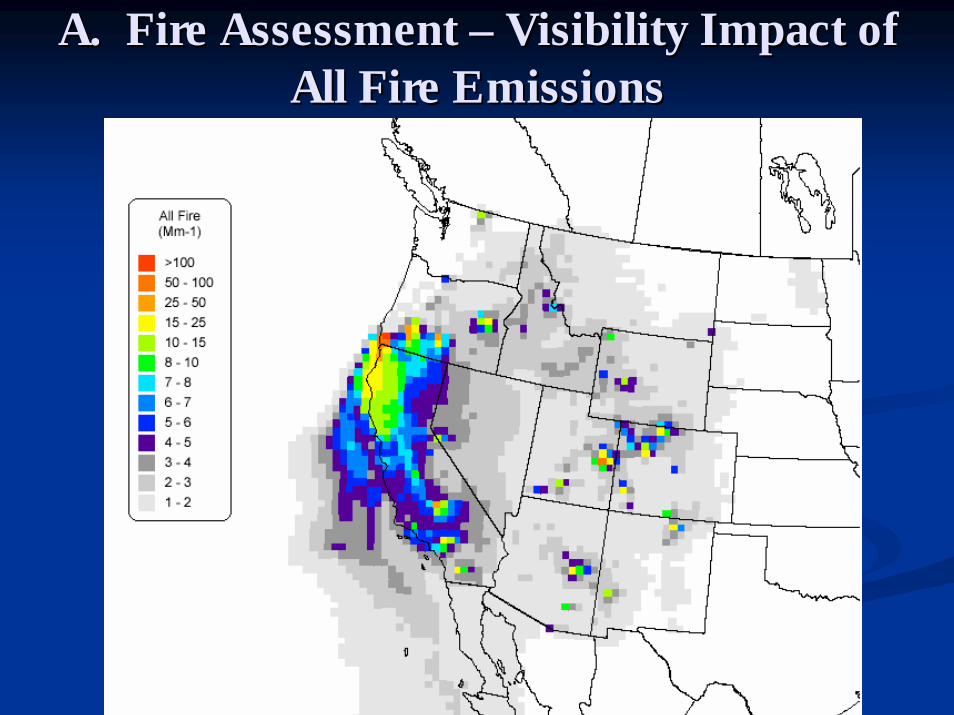
A. Fire Assessment A. Fire Assessment –– Visibility Impact of Visibility Impact of All Fire EmissionsAll Fire Emissions

B. Fire Assessment B. Fire Assessment –– Visibility Impact of Visibility Impact of Anthropogenic FiresAnthropogenic Fires

C. Fire Assessment C. Fire Assessment –– Visibility Impact of Visibility Impact of Natural FiresNatural Fires

Major FindingsMajor Findings
Compiled attributions for 125 Class I areasCompiled attributions for 125 Class I areasIndependent apportionment methods generally Independent apportionment methods generally consistent in identifying source regionsconsistent in identifying source regionsAoH weight of evidence method generally applicable AoH weight of evidence method generally applicable to haze attributionto haze attributionEmissions from mobile and point source categories:Emissions from mobile and point source categories:
SOSO22 and NOand NOxx are regional pollutants, comprising a are regional pollutants, comprising a significant percentage of each state’s emissionssignificant percentage of each state’s emissionsBoth are important contributors to light extinctionBoth are important contributors to light extinctionModeled emissions from each WRAP region state impact Modeled emissions from each WRAP region state impact Class I areas of one or more other states and tribesClass I areas of one or more other states and tribes

Next StepsNext Steps
Draft report to be released 12/17/04 on the WRAP Draft report to be released 12/17/04 on the WRAP AoH web site:AoH web site:http://www.wrapair.org/forums/aoh/ars1/documents/AoH_http://www.wrapair.org/forums/aoh/ars1/documents/AoH_Summary_Report_Draft.pdfSummary_Report_Draft.pdf
Review comments need to be directed to ARS by Review comments need to be directed to ARS by 1/20/05 1/20/05 –– use “AoH Draft Review” as the euse “AoH Draft Review” as the e--mail mail subject. Esubject. E--mail to: mail to: jadlhochjadlhoch@[email protected] Workgroup to review compiled comments and AoH Workgroup to review compiled comments and complete report by end of January, 2005complete report by end of January, 2005Results and recommendations to help preparation for Results and recommendations to help preparation for AoH Phase II project (starts midAoH Phase II project (starts mid--2005)2005)