Embed Size (px)
Citation preview

Nanoscale
PAPER
Cite this: Nanoscale, 2017, 9, 17387
Received 19th June 2017,Accepted 7th October 2017
DOI: 10.1039/c7nr04386d
rsc.li/nanoscale
Attomolar detection of extracellular microRNAsreleased from living prostate cancer cells by aplasmonic nanowire interstice sensor†
Siyeong Yang,‡a Hongki Kim,‡a Kyung Jin Lee,a Seul Gee Hwang,b,c
Eun-Kyung Lim,b,c,d Juyeon Jung,b,c Tae Jae Lee,e Hee-Sung Park,*a
Taejoon Kang *b,c,d and Bongsoo Kim *a
Prostate cancer (PC) is the second leading cause of cancer death for men worldwide. The serum pros-
tate-specific antigen level test has been widely used to screen for PC. This method, however, exhibits a
high false-positive rate, leading to over-diagnosis and over-treatment of PC patients. Extracellular
microRNAs (miRNAs) recently provided valuable information including the site and the status of the
cancers and thus emerged as new biomarkers for several cancers. Among them, miR141 and miR375 are
the most pronounced biomarkers for the diagnosis of high-risk PC. Herein, we report an attomolar detec-
tion of miR141 and miR375 released from living PC cells by using a plasmonic nanowire interstice (PNI)
sensor. This sensor showed a very low detection limit of 100 aM as well as a wide dynamic range from
100 aM to 100 pM for all target miRNAs. In addition, the PNI sensor could discriminate perfectly the
diverse single-base mismatches in the miRNAs. More importantly, the PNI sensor successfully detected
the extracellular miR141 and miR375 released from living PC cell lines (LNCaP and PC-3), proving the
diagnostic ability of the sensor for PC. We anticipate that the present PNI sensor can hold great promise
for the precise diagnosis and prognosis of various cancer patients as well as PC patients.
Introduction
MicroRNAs (miRNAs) are single-stranded, small, and noncod-ing RNAs that play important roles as regulators in numerousbiological processes.1,2 Recently, it has been reported that mul-tiple miRNAs are dysregulated in several human cancers, sup-porting the hypothesis that miRNAs are involved in theinitiation and progression of cancers.3,4 The dysregulatedmiRNAs can be released into biological fluids via various path-ways and thus the expression pattern of miRNAs in cancercells can be mirrored in biological fluids.5,6 Consequently,
extracellular miRNAs released from cancer cells have been con-sidered as promising noninvasive cancer biomarkers.
Prostate cancer (PC) is one of the most common cancersand the second leading cause of cancer death for men world-wide.7 Although the serum prostate-specific antigen (PSA) leveltest has been widely used to diagnose PC, the high false-positive rate of this test has limited the accurate diagnosis ofPC.8,9 The US Preventive Services Task Force even rec-ommended that physicians should not routinely perform PCscreening based on serum PSA levels.10 Therefore, it is highlyimportant to develop a novel PC-specific biomarker detectionmethod. In 2008, it was firstly reported that the level ofmiR141 is upregulated in the serum of metastatic PC com-pared with healthy controls and benign prostatic hyperplasiapatients.11 Since then, numerous studies have been conductedto investigate miRNA markers for PC in biological fluids and itwas known that the extracellular miR141 and miR375 canprovide valuable information of the status and location of thePC site.12,13 Moreover, extracellular miR141 and miR375 havebeen the most pronounced biomarkers for high-risk PC,including castrate-resistant PC and metastatic PC, whichaccount for approximately 15% of PC diagnoses and have thepotential to progress to a lethal phenotype.14,15 Thus, it iscritical to develop a sensor that is capable of detecting extra-
†Electronic supplementary information (ESI) available. See DOI: 10.1039/c7nr04386d‡These authors contributed equally to this work.
aDepartment of Chemistry, KAIST, 291 Daehak-ro, Yuseong-gu, Daejeon 34141,
Korea. E-mail: [email protected], [email protected] Monitoring BioNano Research Center, 125 Gwahak-ro, Yuseong-gu, KRIBB,
Daejeon 34141, Korea. E-mail: [email protected] of Nanobiotechnology, KRIBB School of Biotechnology, UST,
217 Gajeong-ro, Yuseong-gu, Daejeon 34113, KoreadBioNano Health Guard Research Center, 125 Gwahak-ro, Yuseong-gu, KRIBB,
Daejeon 34141, KoreaeNano-bio Application Team, NNFC, 291 Daehak-ro, Yuseong-gu, Daejeon 34141,
Korea
This journal is © The Royal Society of Chemistry 2017 Nanoscale, 2017, 9, 17387–17395 | 17387
Publ
ishe
d on
10
Oct
ober
201
7. D
ownl
oade
d by
Kor
ea A
dvan
ced
Inst
itute
of
Scie
nce
& T
echn
olog
y / K
AIS
T o
n 20
/11/
2017
12:
53:2
6.
View Article OnlineView Journal | View Issue

cellular miR141 and miR375 with high sensitivity and speci-ficity. Recently, the optical and electrochemical sensors havebeen developed for the detection of miR141 in PC celllysate.16,17 While these sensors provide high sensitivity formiR141 through signal amplification processes, it is moredesirable to detect the extracellular miRNAs released fromliving PC cells rather than the miRNAs in PC cell lysate for thepractical diagnosis of PC patients. Furthermore, thesimultaneous detection of miR141 and miR375 might lead theaccurate diagnosis of PC patients.
Herein, we report a plasmonic nanowire (NW) interstice(PNI) sensor which can detect the extracellular miR141 andmiR375 released from living PC cells into a culture medium.This sensor shows an extremely low detection limit of 100 aMfor both miR141 and miR375, and a wide dynamic range from100 aM to 100 pM, covering the typical concentration range ofextracellular miRNAs in the bloodstreams of patients.18,19
Additionally, the PNI sensor can completely discriminate thesingle-base mismatches of miR141 and miR375. This excellentsensing capability of the PNI sensor enables the simultaneousdetection of miR141 and miR375 released from the living PCcells (LNCaP and PC-3), showing the potential applicability toa novel PC diagnostic method. Since the PNI sensor can beeasily modified for capturing the desired target miRNAs, main-taining the superior sensing ability of miRNAs, we expect thatthe PNI sensor could apply to the diagnosis and prognosis ofthe several miRNA-related diseases.
Experimental sectionMaterials
Au powder (99.99%) and sodium dodecyl sulfate (SDS) werepurchased from Sigma-Aldrich. All miRNAs, including thetarget miRNAs and single-base mismatched miRNAs, were pur-chased from Bioneer (Daejeon, Korea). The thiolated probelocked nucleic acid (LNA) and Cy5-tagged reporter LNA werepurchased from Eurogentec (Seraing, Belgium). Sequences ofall miRNAs, probe LNA, and reporter LNA used in this researchare described in the ESI (Table S1†). Saline sodium citrate(SSC) buffer solution and ultrapure water were purchased fromBiosesang (Sungnam, Korea). The miRNeasy serum/plasma kitwas purchased from Qiagen (Germany).
Instrumentation
The surface-enhanced Raman scattering (SERS) spectra weremeasured using a custom-built micro-Raman system on anOlympus BX41 microscope. A 633 nm He/Ne laser (MellesGriot) was used as an excitation source, and the laser wasfocused on the PNI sensor through a 100× objective (numericalaperture = 0.7, Mitutoyo). The polarization of the laser wasdirected by rotating a half-wave plate. The SERS signals wererecorded with a thermodynamically cooled electron-multiply-ing charge-coupled device (Andor) mounted on a spectrometerwith a 1200 groove per mm grating (Dongwoo Optron). Theacquisition time for all SERS spectra was 100 s. Two holo-
graphic notch filters were used to remove the 633 nm light.The cell media were centrifuged using a Microfuge 22R centri-fuge (Beckman Coulter). A field-emission scanning electronmicroscope (FE-SEM, Nova230) was used to obtain SEMimages. A field-emission transmission electron microscope(FE-TEM, Tecnai F30 ST) was used to obtain TEM images,high-resolution TEM (HRTEM) images, selected area electrondiffraction (SAED) patterns, and fast Fourier transform (FFT)patterns.
Preparation of the PNI sensor
Using the chemical vapor transport method described in a pre-vious report, single-crystalline Au NWs were synthesized on asapphire substrate in a horizontal quartz tube furnacesystem.20 Au powder in an alumina boat was placed in thecentre of the heating zone. The sapphire substrate was posi-tioned a few centimeters downstream from the Au powder.The source temperature was increased to 1100 °C while thechamber pressure was maintained at 5–10 Torr. Ar gas flowedat a rate of 100 standard cubic centimeters per minute totransport the Au vapor. The Au NWs were grown on the sub-strate for a reaction time of 1 h. The single-crystalline Au NWshave a rhombic cross-section, an atomically smooth surfacewith a diameter of about 200 nm, and a length of several tensof micrometers (Fig. S1 in the ESI†). To modify the surface ofthe Au NWs with the capture-probe LNA, the as-synthesized AuNWs were incubated in a solution of 10 nM probe LNA, 3×SSC, and 0.04% SDS for 12 h at room temperature. The exces-sive LNA was rinsed with a solution of 2× SSC and 0.1% SDS.The probe LNA-modified Au NWs were transferred on Aufilms. The Au films were prepared on Si substrates after elec-tron beam-assisted deposition of a 10 nm-thick film of Cr fol-lowed by a 300 nm-thick film of Au. The Au NWs were posi-tioned into the desired alignment on the Au films by using acustom-built nanomanipulator.21
Cell culture and purification of extracellular miRNAs
The following human cell lines were used and obtained fromthe ATCC: two human prostate cancer cell lines (PC-3 andLNCaP) and a human cervical cancer cell line (HeLa). Thenormal prostate cell line (RWPE-1) was a kind gift from Prof.Namhoon Cho at Yonsei University. All cell lines were testedfor mycoplasma contamination and cultured at 37 °C under ahumidifying atmosphere at 5%. The LNCaP cells and RWPE-1cells were grown in RPMI-1640 medium supplemented with10% (v/v) of fetal bovine serum (FBS), penicillin (100 U ml−1),and streptomycin (100 mg ml−1).22,23 The PC-3 cells weremaintained in FK-12 supplemented with 10% (v/v) of FBS,penicillin (100 U ml−1), and streptomycin (100 mg ml−1).24 TheHeLa cells were cultured in DMEM supplemented with 10%(v/v) of FBS, penicillin (100 U ml−1), and streptomycin (100 mgml−1).25 The cells were passaged two to three times a week fortotal RNA extraction, until reaching a confluency of 90%. Next,the media were collected and centrifuged at 14 000g for 10 minto discard the remaining cells and cellular debris. Then, thesupernatant was filtered using a 0.2 µm pore filter (syringe
Paper Nanoscale
17388 | Nanoscale, 2017, 9, 17387–17395 This journal is © The Royal Society of Chemistry 2017
Publ
ishe
d on
10
Oct
ober
201
7. D
ownl
oade
d by
Kor
ea A
dvan
ced
Inst
itute
of
Scie
nce
& T
echn
olog
y / K
AIS
T o
n 20
/11/
2017
12:
53:2
6.
View Article Online
filter, GE Healthcare). All of the miRNAs were purified fromthe collected media using the miRNeasy serum/plasma kit(Qiagen) according to the manufacturer’s protocol. The finalpurified solution containing extracellular miRNAs (10 μl) wasdiluted to 200 μl of 5× SSC.
Detection of extracellular miRNAs by the PNI sensor
The PNI sensor was incubated with the extracellular miRNAsin a 5× SSC buffer solution at 42 °C using a rotating hybridiz-ation incubator (Agilent) for 16 h. After hybridization, the PNIsensors were rinsed with a pre-warmed solution of 2× SSCbuffer solution containing 0.1% of SDS at 42 °C to removenon-bonded miRNAs. Next, the sensor was immersed in amixture solution of reporter LNAs (10 nM) at 64 °C for 1 h.Finally, the PNI sensor was rinsed with a 2× SSC buffer solu-tion containing 0.1% of SDS and ultrapure water, dried withblowing N2, and measured using the micro-Raman system.
qRT-PCR assay
The quantitative real-time polymerase chain reaction(qRT-PCR) was performed on a Bio-Rad CFX96 TM real-timesystem with a GoTaq® 1-step RT-qPCR System (Promega). Thesamples were incubated in a 96-well plate at 37 °C for 15 minfor reverse transcription. Next, the samples were incubated at95 °C for 10 min and followed by 40 cycles of 95 °C for 10 s,60 °C for 30 s, and 72 °C for 30 s. The GAPDH gene was usedas a control gene and the RWPE-1 cell line was used as a
control cell. Primer sequences are as follows: miR141, forward,5′-CGTCAGATGTCCGAGTAGAGGGGGAACGGCGTAACACTGTC-TGGTAAAGA-3′, reverse, miScript universal primer (Qiagen);miR375, forward, 5′-AGC CGTTTGTTCGTTCGGCT-3′, reverse,miScript universal primer (Qiagen); GAPDH, forward,5′-ATGGGTGTGAACCATGAGAAG-3′, reverse, 5′-AGTTGTCATG-GATGACCTTGG-3′.
Results and discussionPrinciple of extracellular miRNA detection by the PNI sensor
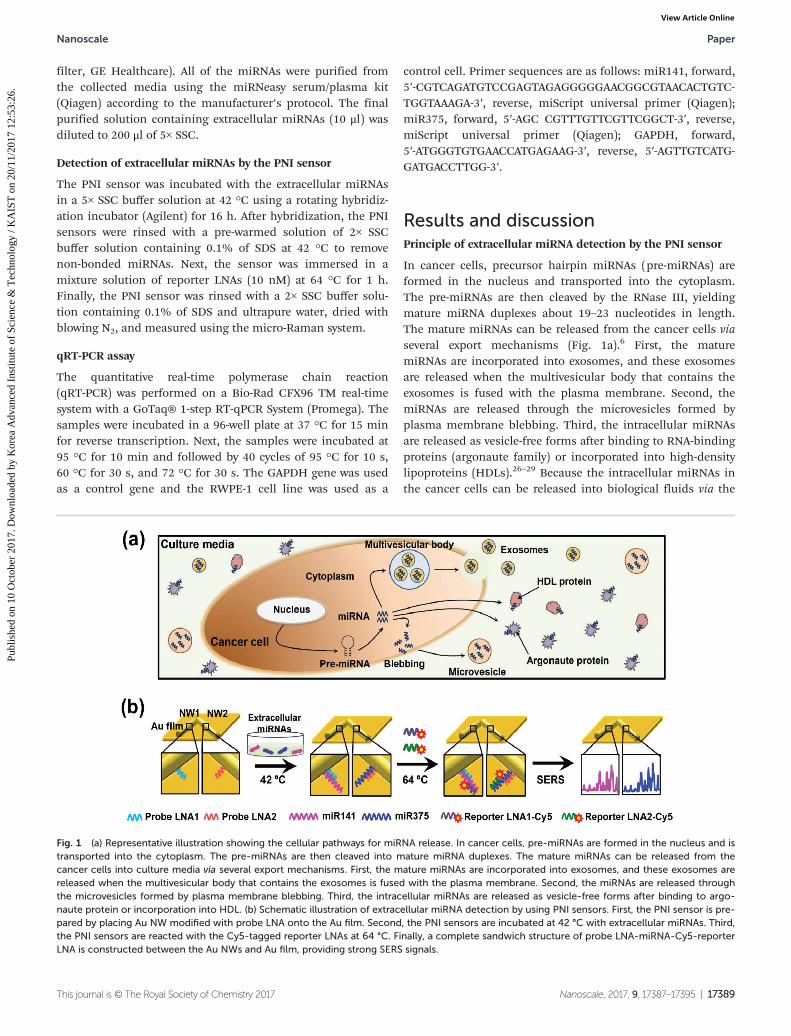
In cancer cells, precursor hairpin miRNAs (pre-miRNAs) areformed in the nucleus and transported into the cytoplasm.The pre-miRNAs are then cleaved by the RNase III, yieldingmature miRNA duplexes about 19–23 nucleotides in length.The mature miRNAs can be released from the cancer cells viaseveral export mechanisms (Fig. 1a).6 First, the maturemiRNAs are incorporated into exosomes, and these exosomesare released when the multivesicular body that contains theexosomes is fused with the plasma membrane. Second, themiRNAs are released through the microvesicles formed byplasma membrane blebbing. Third, the intracellular miRNAsare released as vesicle-free forms after binding to RNA-bindingproteins (argonaute family) or incorporated into high-densitylipoproteins (HDLs).26–29 Because the intracellular miRNAs inthe cancer cells can be released into biological fluids via the
Fig. 1 (a) Representative illustration showing the cellular pathways for miRNA release. In cancer cells, pre-miRNAs are formed in the nucleus and istransported into the cytoplasm. The pre-miRNAs are then cleaved into mature miRNA duplexes. The mature miRNAs can be released from thecancer cells into culture media via several export mechanisms. First, the mature miRNAs are incorporated into exosomes, and these exosomes arereleased when the multivesicular body that contains the exosomes is fused with the plasma membrane. Second, the miRNAs are released throughthe microvesicles formed by plasma membrane blebbing. Third, the intracellular miRNAs are released as vesicle-free forms after binding to argo-naute protein or incorporation into HDL. (b) Schematic illustration of extracellular miRNA detection by using PNI sensors. First, the PNI sensor is pre-pared by placing Au NW modified with probe LNA onto the Au film. Second, the PNI sensors are incubated at 42 °C with extracellular miRNAs. Third,the PNI sensors are reacted with the Cy5-tagged reporter LNAs at 64 °C. Finally, a complete sandwich structure of probe LNA-miRNA-Cy5-reporterLNA is constructed between the Au NWs and Au film, providing strong SERS signals.
Nanoscale Paper
This journal is © The Royal Society of Chemistry 2017 Nanoscale, 2017, 9, 17387–17395 | 17389
Publ
ishe
d on
10
Oct
ober
201
7. D
ownl
oade
d by
Kor
ea A
dvan
ced
Inst
itute
of
Scie
nce
& T
echn
olog
y / K
AIS
T o
n 20
/11/
2017
12:
53:2
6.
View Article Online

above mechanisms, the expression pattern of miRNAs incancer cells can be mirrored in biological fluids. This allowsthe extracellular miRNAs to act as cancer biomarkers. Theextracellular miRNAs have strong advantages over protein bio-markers. The miRNAs are stable under harsh conditions suchas boiling, pH, and multiple freeze–thaw cycles.30,31 Inaddition, the sequences of most miRNAs are conserved amongdifferent species.32 Therefore, identifying the extracellularmiRNAs derived from cancer cells is highly desired for thediagnosis of cancers.
To accurately determine the expression patterns of miRNAsin biological fluid samples, it is required to overcome theinconsistent measurement results caused by low specificitiesand complicated sensing procedures. The optimum miRNAdetection method should have (1) highest sensitivity with awide dynamic range for accurate expression patterns, (2)superb specificity to discriminate the single-base mismatchesof miRNAs, and (3) simple processing steps to minimizemeasurement variation. SERS is a fascinating phenomenonthat significantly increases the Raman signal of moleculeslocated within sub 10 nm metallic interstices (hot spots).33,34
SERS has been employed for the sensitive detection of miRNAsdue to its single-molecule sensitivity, molecular specificity,and insensitivity to quenching.35,36 Previously, our group deve-loped a PNI nanostructure which provides strong, reproduci-ble, and stable SERS signals.37,38 By combining the PNI nano-structure with the bi-temperature hybridization process,miRNAs could be detected sensitively and selectively.39,40 Weemployed a similar sensing strategy with our previous report.Particularly, in this study, we focused on extracellular miR141and miR375 that are the most pronounced biomarkers for PC.Detection and quantification of extracellular miRNAs presentat very low concentrations are quite important for practicaldiagnosis and prognosis for cancer patients.11 For the appli-cation of the PNI sensor to the diagnosis of PC, we tried todetect miR141 and miR375 simultaneously as depicted inFig. 1b. In the first step, single-crystalline Au NWs were syn-thesized in the vapor phase as described in the previousreport20 and the surfaces of Au NWs were modified with probeLNAs through Au–S chemical bonding. LNAs are artificiallymodified nucleotides with a controlled Tm value, enhancingthe affinity for their complementary strands.41 The probeLNA1 was designed for capturing the miR141 and the probeLNA2 was designed for capturing miR375. The probe LNA1-modified Au NW (NW1) and the probe LNA2-modified Au NW(NW2) were aligned at specific positions on an Au film byusing a custom-built nanomanipulator. Because the Au NWswere optically monitored in situ while being transferred, theNW1 and NW2 could be clearly distinguishable withoutadditional identification labels. In the second step, the PNIsensors were incubated at 42 °C with extracellular miRNAs.During the incubation, miR141 hybridized with the probeLNA1 of NW1 and miR375 hybridized with the probe LNA2 ofNW2, respectively. Next, the PNI sensors hybridized withmiR141 and miR375 were immersed in a reporter LNA solu-tion (containing reporter LNA1-Cy5 and reporter LNA2-Cy5)
and incubated at 64 °C. This second hybridization process at64 °C enables the precise discrimination of single-based mis-matches of miRNAs (Fig. S2 in the ESI†). After the bi-tempera-ture hybridization process, the perfectly hybridized structureof the probe LNA1-miR141-Cy5-reporter LNA1 remained onNW1 and the structure of the probe LNA2-miR375-Cy5-reporterLNA2 remained on NW2. Finally, we obtained SERS signalsfrom both NW1 and NW2 to identify the presence of miR141and miR375 in the extracellular miRNAs. Only in the presenceof the perfectly matched target miRNAs, PNI sensors couldprovide strong SERS signals of Cy5. Although miR141 andmiR375 were selected as target miRNAs in this study, the PNIsensor could be applied to detect all types of miRNAs byemploying the desired probe and reporter LNAs.
Attomolar detection of miRNAs by the PNI sensor
We examined the detection limit and the dynamic range of thePNI sensor for miR141 and miR375, respectively. The optimalmiRNA sensor should have low detection limit and a widedynamic range because the levels of miRNAs released fromcancer cells into the circulatory system are very low and varyfrom person to person. Fig. 2a shows the SERS spectra of Cy5obtained from the PNI sensor by varying the concentration ofmiR141. The miR141 samples were prepared using serialdilutions, and a blank sample solution was prepared as acontrol. The SERS signals of Cy5 gradually decreased as theconcentration of miR141 decreased. Notably, the SERS signalswere still distinguishable at 100 aM from the signals of blanksolution. Fig. 2b also shows the SERS spectra of Cy5 measuredfrom the PNI sensor by varying the concentration of miR375.Similar to the miR141 result, the SERS signals decreased withdecreasing the concentration of miR375 and the signals werevisible at the low concentration of 100 aM. This suggests thatthe PNI sensor can detect miR141 and miR375 at the low con-centration of 100 aM, corresponding to 50 zeptomoles in a500 µl volume. Fig. 2c displays the intensity of the Cy51580 cm−1 band plotted as a function of the miR141(magenta) and miR375 (blue) concentrations. Both intensitieswere quite linearly increased throughout the concentrationrange from 100 aM to 100 pM in spite of the differentsequences of miR141 and miR375. We further confirmed thedynamic range of PNI sensors by obtaining the linearly fittedlines of 1580 cm−1 band intensity versus the concentration ofmiR141 (magenta) and miR375 (blue) (Fig. 2d). The fitted lineswere determined to be y = 1646.6x + 27 622.8 with an R2 valueof 0.99585 for miR141, and y = 1699.1x + 28 743.0 with an R2
value of 0.99482 for miR375 (x = log concentration).Additionally, we performed a spike-in experiment using Cel-miR-39. Similar to the miR141 and miR375 results, the SERSintensity proportionally increased within the Cel-miR-39 con-centration range of 100 aM to 100 pM (Fig. S3a in the ESI†).Moreover, the PNI sensor could detect Cel-miR-39 in humanserum (Fig. S3b in the ESI†). Consequently, we tried to detectmiR141 and miR375 in human serum by using the PNI sensor.The samples were prepared by spiking miR141 and miR375into human serum, respectively, and the control was a pure
Paper Nanoscale
17390 | Nanoscale, 2017, 9, 17387–17395 This journal is © The Royal Society of Chemistry 2017
Publ
ishe
d on
10
Oct
ober
201
7. D
ownl
oade
d by
Kor
ea A
dvan
ced
Inst
itute
of
Scie
nce
& T
echn
olog
y / K
AIS
T o
n 20
/11/
2017
12:
53:2
6.
View Article Online

human serum. The total RNAs were purified by employing amiRNeasy serum/plasma kit and the purified miRNAs wereapplied to the PNI sensors. Fig. S4† shows the intensity of the1580 cm−1 band plotted as a function of the spiked miR141and miR375 concentrations. The SERS intensities almost line-arly increased from 100 fM to 1 nM as the spiked concen-tration of miRNAs increased. This demonstrates that thepresent method can detect miRNAs even in human serum.The well-defined PNI nanostructure which provides a highlyreproducible SERS hot spot line, straightforward probe LNAimmobilization, and simple miRNA–LNA hybrid formationwith equalized stabilities seems to collectively contribute tothe observed equally enhanced and highly reproducible SERSsignals for miR141 and miR375.
Perfect discrimination of single-base mismatches in miRNAsby the PNI sensor
Currently, more than 24 000 miRNAs have been identified andthey often have similar sequences.42 In addition, the membersof a specific miRNA family usually differ only by a single basein a sequence, because miRNAs that differ by a single-basesequence have different biological roles during the occurrence,inhibition, and metastasis of cancers.43–45 The optimal miRNAsensor should exhibit a complete specificity that can detect the
miRNA with an intact sequence. To investigate the specificityof a PNI sensor, we prepared four kinds of single-base mis-matched miRNAs (miR141 A, miR141 B, miR375 A, andmiR375 B). The miR141 A and miR375 A had a mismatchedsingle base on the probe LNA recognition site, respectively,and the miR141 B and miR375 B had a mismatched singlebase on the reporter LNA recognition site. All nucleotidesequences are shown in the inset of Fig. 3. The mismatchedbases in miR141 A, B and miR375 A, B are marked in red. TheLNA sequences in the probe LNA1, 2 and reporter LNA1, 2 aremarked in blue. Fig. 3 shows the plot of Cy5 1580 cm−1 bandintensity obtained from the PNI sensors for perfectly matchedand single-base mismatched miRNAs. The concentration of allmiRNAs was 100 pM. When the single-base mismatchedmiRNAs (miR141 A, B and miR375 A, B) were present, feature-less SERS signals were obtained from the PNI sensors. In con-trast, significantly strong SERS signals were measured fromthe PNI sensors in the presence of miR141 and miR375 withintact sequences. In the miRNA sensing procedure using thePNI sensor, the unstable single-base mismatched miRNA–LNAhybridized structures were destroyed at the temperature overTm. Therefore, we near-perfectly excluded the possibility ofdetecting single-base mismatched miRNAs. Meanwhile, theSERS signals of miR375 A and B were slightly stronger than
Fig. 2 (a) SERS spectra of Cy5 measured from PNI sensors by varying the concentration of miR141 from 0 M to 1 nM. (b) SERS spectra ofCy5 measured from PNI sensors by varying the concentration of miR375 from 0 M to 1 nM. (c) Plots of 1580 cm−1 band intensity versus the concen-trations of miR141 and miR375. The data represent the mean plus and minus standard deviation from ten measurements. (d) Linearly fitted lines of1580 cm−1 band intensity versus the concentrations of miR141 and miR375 (x = log concentration).
Nanoscale Paper
This journal is © The Royal Society of Chemistry 2017 Nanoscale, 2017, 9, 17387–17395 | 17391
Publ
ishe
d on
10
Oct
ober
201
7. D
ownl
oade
d by
Kor
ea A
dvan
ced
Inst
itute
of
Scie
nce
& T
echn
olog
y / K
AIS
T o
n 20
/11/
2017
12:
53:2
6.
View Article Online
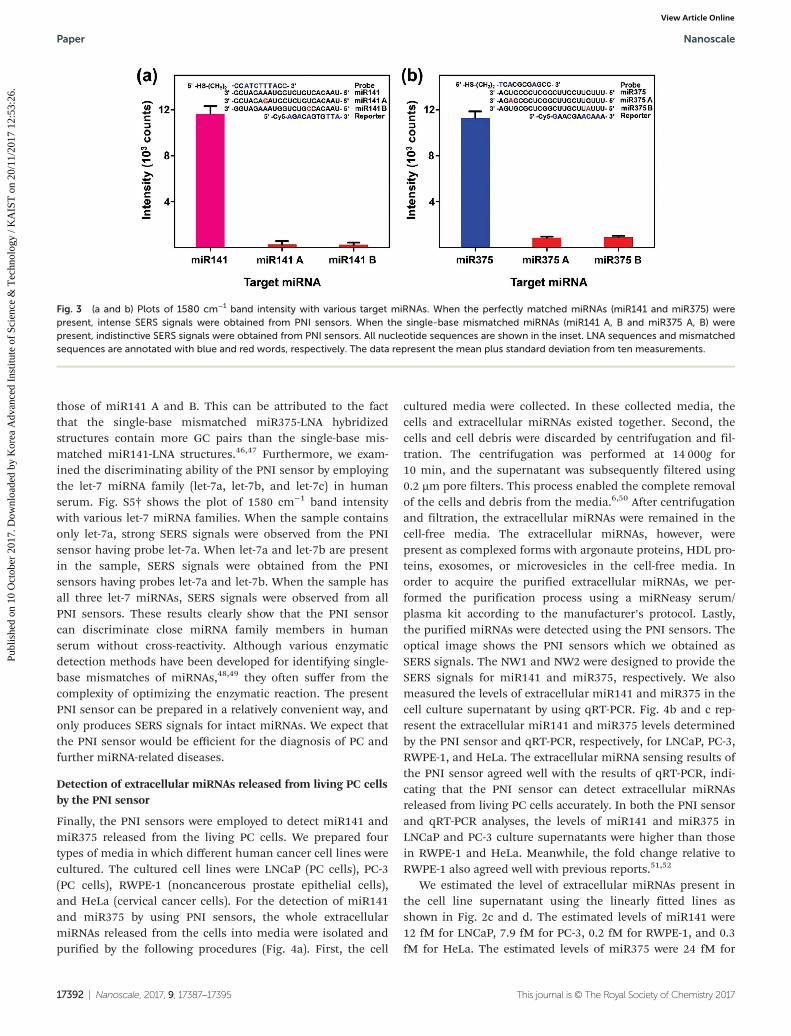
those of miR141 A and B. This can be attributed to the factthat the single-base mismatched miR375-LNA hybridizedstructures contain more GC pairs than the single-base mis-matched miR141-LNA structures.46,47 Furthermore, we exam-ined the discriminating ability of the PNI sensor by employingthe let-7 miRNA family (let-7a, let-7b, and let-7c) in humanserum. Fig. S5† shows the plot of 1580 cm−1 band intensitywith various let-7 miRNA families. When the sample containsonly let-7a, strong SERS signals were observed from the PNIsensor having probe let-7a. When let-7a and let-7b are presentin the sample, SERS signals were obtained from the PNIsensors having probes let-7a and let-7b. When the sample hasall three let-7 miRNAs, SERS signals were observed from allPNI sensors. These results clearly show that the PNI sensorcan discriminate close miRNA family members in humanserum without cross-reactivity. Although various enzymaticdetection methods have been developed for identifying single-base mismatches of miRNAs,48,49 they often suffer from thecomplexity of optimizing the enzymatic reaction. The presentPNI sensor can be prepared in a relatively convenient way, andonly produces SERS signals for intact miRNAs. We expect thatthe PNI sensor would be efficient for the diagnosis of PC andfurther miRNA-related diseases.
Detection of extracellular miRNAs released from living PC cellsby the PNI sensor
Finally, the PNI sensors were employed to detect miR141 andmiR375 released from the living PC cells. We prepared fourtypes of media in which different human cancer cell lines werecultured. The cultured cell lines were LNCaP (PC cells), PC-3(PC cells), RWPE-1 (noncancerous prostate epithelial cells),and HeLa (cervical cancer cells). For the detection of miR141and miR375 by using PNI sensors, the whole extracellularmiRNAs released from the cells into media were isolated andpurified by the following procedures (Fig. 4a). First, the cell
cultured media were collected. In these collected media, thecells and extracellular miRNAs existed together. Second, thecells and cell debris were discarded by centrifugation and fil-tration. The centrifugation was performed at 14 000g for10 min, and the supernatant was subsequently filtered using0.2 µm pore filters. This process enabled the complete removalof the cells and debris from the media.6,50 After centrifugationand filtration, the extracellular miRNAs were remained in thecell-free media. The extracellular miRNAs, however, werepresent as complexed forms with argonaute proteins, HDL pro-teins, exosomes, or microvesicles in the cell-free media. Inorder to acquire the purified extracellular miRNAs, we per-formed the purification process using a miRNeasy serum/plasma kit according to the manufacturer’s protocol. Lastly,the purified miRNAs were detected using the PNI sensors. Theoptical image shows the PNI sensors which we obtained asSERS signals. The NW1 and NW2 were designed to provide theSERS signals for miR141 and miR375, respectively. We alsomeasured the levels of extracellular miR141 and miR375 in thecell culture supernatant by using qRT-PCR. Fig. 4b and c rep-resent the extracellular miR141 and miR375 levels determinedby the PNI sensor and qRT-PCR, respectively, for LNCaP, PC-3,RWPE-1, and HeLa. The extracellular miRNA sensing results ofthe PNI sensor agreed well with the results of qRT-PCR, indi-cating that the PNI sensor can detect extracellular miRNAsreleased from living PC cells accurately. In both the PNI sensorand qRT-PCR analyses, the levels of miR141 and miR375 inLNCaP and PC-3 culture supernatants were higher than thosein RWPE-1 and HeLa. Meanwhile, the fold change relative toRWPE-1 also agreed well with previous reports.51,52
We estimated the level of extracellular miRNAs present inthe cell line supernatant using the linearly fitted lines asshown in Fig. 2c and d. The estimated levels of miR141 were12 fM for LNCaP, 7.9 fM for PC-3, 0.2 fM for RWPE-1, and 0.3fM for HeLa. The estimated levels of miR375 were 24 fM for
Fig. 3 (a and b) Plots of 1580 cm−1 band intensity with various target miRNAs. When the perfectly matched miRNAs (miR141 and miR375) werepresent, intense SERS signals were obtained from PNI sensors. When the single-base mismatched miRNAs (miR141 A, B and miR375 A, B) werepresent, indistinctive SERS signals were obtained from PNI sensors. All nucleotide sequences are shown in the inset. LNA sequences and mismatchedsequences are annotated with blue and red words, respectively. The data represent the mean plus standard deviation from ten measurements.
Paper Nanoscale
17392 | Nanoscale, 2017, 9, 17387–17395 This journal is © The Royal Society of Chemistry 2017
Publ
ishe
d on
10
Oct
ober
201
7. D
ownl
oade
d by
Kor
ea A
dvan
ced
Inst
itute
of
Scie
nce
& T
echn
olog
y / K
AIS
T o
n 20
/11/
2017
12:
53:2
6.
View Article Online

LNCaP, 14.3 fM for PC-3, 0.16 fM for RWPE-1, and 0.18 fM forHeLa. The concentrations of miR141 and miR375 in theLNCaP sample were higher than those in the PC-3 sample,agreeing with the previous reports obtained from celllysates.53,54 The PNI sensor can quantitate the extracellularmiRNAs unlike other methods that provide relative amounts orindirectly quantifying amounts of miRNAs. The high sensi-tivity, wide dynamic range, and near-perfect single-base dis-crimination of the PNI sensor would enable the diagnosis andprognosis of various cancers.
Conclusions
We developed a PNI sensor which can detect extracellularmiR141 and miR375 released from living PC cell lines. Theproposed PNI sensor exhibited an extremely low detectionlimit of 100 aM, a wide dynamic range from 100 aM to 100pM, and a perfect discrimination of single-base mismatches intarget miRNAs. By using the PNI sensor, we clearly observedthat miR141 and miR375 were released only from livinghuman PC cell lines (LNCaP and PC-3). In addition, we esti-mated the absolute amount of the released miR141 andmiR375 from each PC cell line. The highly sensitive andexactly quantifiable PNI sensor could be useful for the precisediagnosis of PC patients and will be further valuable fordetecting other disease-related extracellular miRNAs.
Conflicts of interest
There are no conflicts to declare.
Acknowledgements
This work was supported by the Global Frontier Project(H-GUARD_2014M3A6B2060489 and H-GUARD_2014M3A6B2060507) through the Center for BioNano Health-Guard fundedby the Ministry of Science and ICT (MSIT), Public Welfare &Safety Research Program (NRF-2012M3A2A1051682 andNRF-2013M3A2A107399) through the National ResearchFoundation (NRF) of Korea funded by MSIT, NRF grant(2017R1A2B4010073) funded by MSIT, and the KRIBB initiativeResearch Program.
Notes and references
1 E. Kim, J. Yang, J. Park, S. Kim, N. H. Kim, J. I. Yook,J.-S. Suh, S. Haam and Y.-M. Huh, ACS Nano, 2012, 6, 8525–8535.
2 M. Zouari, S. Campuzano, J. Pingarrón and N. Raouafi,Biosens. Bioelectron., 2017, 91, 40–45.
3 W. Wu, C. Lee, C. Cho, D. Fan, K. Wu, J. Yu and J. Sung,Oncogene, 2010, 29, 5761–5771.
Fig. 4 (a) Schematic illustration of the isolation and purification of extracellular miRNAs released from cancer cells. First, the cancer cell culturedmedia were collected and the collected media were centrifuged and filtered to discard the cancer cells and cell debris. Next, cell-free media werepurified using a miRNeasy serum/plasma kit to obtain the extracellular miRNAs. Lastly, the extracellular miRNAs were detected using the PNIsensors. The optical image shows the PNI sensors which we obtained as SERS signals. The NW1 and NW2 were designed to provide the SERS signalfor miR141 and miR375, respectively. The scale bar denotes 500 nm. (b) Extracellular miR141 and (c) miR375 levels determined by the PNI sensor(blue bar) and qRT-PCR (magenta bar) for four kinds of cell culture supernatants (LNCaP, PC-3, RWPE-1, and HeLa). Left axes are the 1580 cm−1
band intensities measured from PNI sensors and right axes are the fold change relative to RWPE-1 obtained from qRT-PCR. SERS data represent themean plus standard deviation from ten measurements. qRT-PCR data represent the mean plus standard deviation from three measurements.
Nanoscale Paper
This journal is © The Royal Society of Chemistry 2017 Nanoscale, 2017, 9, 17387–17395 | 17393
Publ
ishe
d on
10
Oct
ober
201
7. D
ownl
oade
d by
Kor
ea A
dvan
ced
Inst
itute
of
Scie
nce
& T
echn
olog
y / K
AIS
T o
n 20
/11/
2017
12:
53:2
6.
View Article Online

4 J. Lu, G. Getz, E. A. Miska, E. Alvarez-Saavedra, J. Lamb,D. Peck, A. Sweet-Cordero, B. L. Ebert, R. H. Mak andA. A. Ferrando, Nature, 2005, 435, 834–838.
5 N. Kosaka, H. Iguchi and T. Ochiya, Cancer Sci., 2010, 101,2087–2092.
6 H. Schwarzenbach, N. Nishida, G. A. Calin and K. Pantel,Nat. Rev. Clin. Oncol., 2014, 11, 145–156.
7 R. L. Siegel, K. D. Miller and A. Jemal, CA-Cancer J. Clin.,2016, 66, 7–30.
8 A. Sita-Lumsden, D. A. Dart, J. Waxman and C. Bevan,Br. J. Cancer, 2013, 108, 1925–1930.
9 Z. H. Chen, G. L. Zhang, H. R. Li, J. D. Luo, Z. X. Li,G. M. Chen and J. Yang, Prostate, 2012, 72, 1443–1452.
10 V. A. Moyer, Ann. Intern. Med., 2012, 157, 120–134.11 P. S. Mitchell, R. K. Parkin, E. M. Kroh, B. R. Fritz,
S. K. Wyman, E. L. Pogosova-Agadjanyan, A. Peterson,J. Noteboom, K. C. O’Briant and A. Allen, Proc. Natl. Acad.Sci. U. S. A., 2008, 105, 10513–10518.
12 I. Giusti and V. Dolo, BioMed Res. Int., 2014, 2014, 561571.13 X. Huang, M. Liang, R. Dittmar and L. Wang, Int. J. Mol.
Sci., 2013, 14, 14785–14799.14 J. C. Brase, M. Johannes, T. Schlomm, M. Fälth, A. Haese,
T. Steuber, T. Beissbarth, R. Kuner and H. Sültmann,Int. J. Cancer, 2011, 128, 608–616.
15 P. J. Bastian, S. A. Boorjian, A. Bossi, A. Briganti,A. Heidenreich, S. J. Freedland, F. Montorsi, M. Roach,F. Schröder and H. Van Poppel, Eur. Urol., 2012, 61, 1096–1106.
16 C. Yang, B. Dou, K. Shi, Y. Chai, Y. Xiang and R. Yuan,Anal. Chem., 2014, 86, 11913–11918.
17 X.-P. Wang, B.-C. Yin, P. Wang and B.-C. Ye, Biosens.Bioelectron., 2013, 42, 131–135.
18 M. Labib, S. M. Ghobadloo, N. Khan, D. M. Kolpashchikovand M. V. Berezovski, Anal. Chem., 2013, 85, 9422–9427.
19 S. Campuzano, M. Pedrero and J. M. Pingarrón, Anal.Bioanal. Chem., 2014, 406, 27–33.
20 Y. Yoo, K. Seo, S. Han, K. S. Varadwaj, H. Y. Kim, J. H. Ryu,H. M. Lee, J. P. Ahn, H. Ihee and B. Kim, Nano Lett., 2010,10, 432–438.
21 T. Kang, S. M. Yoo, I. Yoon, S. Y. Lee and B. Kim, NanoLett., 2010, 10, 1189–1193.
22 E. H. Nunlist, I. Dozmorov, Y. Tang, R. Cowan, M. Centolaand H.-K. Lin, J. Steroid Biochem. Mol. Biol., 2004, 91, 157–170.
23 Y. Cha, J. Lee, H. Han, B. Kim, S. Kang, Y. Choi andN. Cho, Prostate, 2016, 76, 937–947.
24 M. W. Roomi, V. Ivanov, T. Kalinovsky, A. Niedzwiecki andM. Rath, In Vivo, 2005, 19, 179–183.
25 J. Kwon, S.-R. Lee, K.-S. Yang, Y. Ahn, Y. J. Kim,E. R. Stadtman and S. G. Rhee, Proc. Natl. Acad. Sci. U. S.A., 2004, 101, 16419–16424.
26 G. K. Joshi, S. Deitz-McElyea, T. Liyanage, K. Lawrence,S. Mali, R. Sardar and M. Korc, ACS Nano, 2015, 9,11075.
27 J. D. Arroyo, J. R. Chevillet, E. M. Kroh, I. K. Ruf,C. C. Pritchard, D. F. Gibson, P. S. Mitchell, C. F. Bennett,
E. L. Pogosova-Agadjanyan and D. L. Stirewalt, Proc. Natl.Acad. Sci. U. S. A., 2011, 108, 5003–5008.
28 D. D. Taylor and C. Gercel-Taylor, Gynecol. Oncol., 2008,110, 13–21.
29 A. Turchinovich, L. Weiz and B. Burwinkel, Trends Biochem.Sci., 2012, 37, 460–465.
30 J. C. Brase, D. Wuttig, R. Kuner and H. Sültmann, Mol.Cancer, 2010, 9, 306.
31 X. Chen, Y. Ba, L. Ma, X. Cai, Y. Yin, K. Wang, J. Guo,Y. Zhang, J. Chen and X. Guo, Cell Res., 2008, 18, 997–1006.
32 P. Landgraf, M. Rusu, R. Sheridan, A. Sewer, N. Iovino,A. Aravin, S. Pfeffer, A. Rice, A. O. Kamphorst andM. Landthaler, Cell, 2007, 129, 1401–1414.
33 Y. Shen, X. Cheng, G. Li, Q. Zhu, Z. Chi, J. Wang and C. Jin,Nanoscale Horiz., 2016, 1, 290–297.
34 S. Choi, J. Hwang, S. Lee, D. W. Lim, H. Joo and J. Choo,Sens. Actuators, B, 2017, 240, 358–364.
35 L. Tong, H. Wei, S. Zhang and H. Xu, Sensors, 2014, 14,7959–7973.
36 J. Docherty, S. Mabbott, W. E. Smith, J. Reglinski,K. Faulds, C. Davidson and D. Graham, Analyst, 2015, 140,6538–6543.
37 R. Gwak, H. Kim, S. M. Yoo, S. Y. Lee, G.-J. Lee, M.-K. Lee,C.-K. Rhee, T. Kang and B. Kim, Sci. Rep., 2016, 6, 19646.
38 I. Yoon, T. Kang, W. Choi, J. Kim, Y. Yoo, S.-W. Joo,Q.-H. Park, H. Ihee and B. Kim, J. Am. Chem. Soc., 2008,131, 758–762.
39 T. Kang, H. Kim, J. M. Lee, H. Lee, Y. S. Choi, G. Kang,M. K. Seo, B. H. Chung, Y. Jung and B. Kim, Small, 2014,10, 4200–4206.
40 M. Lee and Y. Jung, Angew. Chem., Int. Ed., 2011, 50, 12487–12490.
41 B. Vester and J. Wengel, Biochemistry, 2004, 43, 13233–13241.
42 A. Kozomara and S. Griffiths-Jones, Nucleic Acids Res., 2014,42, D68–D73.
43 Z. Yu, Z. Li, N. Jolicoeur, L. Zhang, Y. Fortin, E. Wang,M. Wu and S.-H. Shen, Nucleic Acids Res., 2007, 35, 4535–4541.
44 M. S. Nicoloso, H. Sun, R. Spizzo, H. Kim,P. Wickramasinghe, M. Shimizu, S. E. Wojcik, J. Ferdin,T. Kunej and L. Xiao, Cancer Res., 2010, 70, 2789–2798.
45 S. Shin, B. Y. Won, C. Jung, S. C. Shin, D. Y. Cho, S. S. Leeand H. G. Park, Chem. Commun., 2011, 47, 6611–6613.
46 J. D. Pettigrew and J. A. Kirsch, Philos. Trans. R. Soc.London, Ser. B, 1998, 353, 369–379.
47 W. A. Rees, T. D. Yager, J. Korte and P. H. Von Hippel,Biochemistry, 1993, 32, 137–137.
48 Q. Xu, K. Chang, W. Lu, W. Chen, Y. Ding, S. Jia, K. Zhang,F. Li, J. Shi and L. Cao, Biosens. Bioelectron., 2012, 33, 274–278.
49 X. Wang, X. Lou, Y. Wang, Q. Guo, Z. Fang, X. Zhong,H. Mao, Q. Jin, L. Wu and H. Zhao, Biosens. Bioelectron.,2010, 25, 1934–1940.
50 A. Turchinovich, L. Weiz, A. Langheinz and B. Burwinkel,Nucleic Acids Res., 2011, 39, 7223–7233.
Paper Nanoscale
17394 | Nanoscale, 2017, 9, 17387–17395 This journal is © The Royal Society of Chemistry 2017
Publ
ishe
d on
10
Oct
ober
201
7. D
ownl
oade
d by
Kor
ea A
dvan
ced
Inst
itute
of
Scie
nce
& T
echn
olog
y / K
AIS
T o
n 20
/11/
2017
12:
53:2
6.
View Article Online

51 J. Xiao, A. Y. Gong, A. N. Eischeid, D. Chen, C. Deng,C. Y. Young and X. M. Chen, Prostate, 2012, 72, 1514–1522.
52 J. M. Pickl, D. Tichy, V. Y. Kuryshev, Y. Tolstov, M. Falkenstein,J. Schüler, D. Reidenbach, A. Hotz-Wagenblatt, G. Kristiansenand W. Roth, Oncotarget, 2016, 7, 59589.
53 S. M. Lynch, K. M. O’neill, M. M. McKenna, C. P. Walshand D. J. McKenna, Prostate, 2016, 76, 1146–1159.
54 P. Costa-Pinheiro, J. Ramalho-Carvalho, F. Q. Vieira,J. Torres-Ferreira, J. Oliveira, C. S. Gonçalves, B. M. Costa,R. Henrique and C. Jerónimo, Clin. Epigenet., 2015, 7, 42.
Nanoscale Paper
This journal is © The Royal Society of Chemistry 2017 Nanoscale, 2017, 9, 17387–17395 | 17395
Publ
ishe
d on
10
Oct
ober
201
7. D
ownl
oade
d by
Kor
ea A
dvan
ced
Inst
itute
of
Scie
nce
& T
echn
olog
y / K
AIS
T o
n 20
/11/
2017
12:
53:2
6.
View Article Online