Embed Size (px)
Citation preview

Ghent University Faculty of Arts and Philosophy
Attitudes towards native and non-native accents of English
A sociolinguistic study in Flemish secondary school education
Supervisor: Prof. Dr. A.M. Vandenbergen
Dissertation submitted in partial fulfilment of the requirements for the degree of
“Licenciaat in deTaal- en Letterkunde: Germaanse Talen”
by Joke Tavernier
August 2007


Acknowledgements The English language, and specifically its pronunciation, has always been of particular
interest to me. Deciding to study Germanic languages was therefore a relatively easy choice.
Similarly, the subject of this dissertation seemed to fit my interests perfectly and I am glad
that, by means of writing this piece of work, I was able to finish four interesting years of
academic study. However, it would have proved very difficult to do this on my own, and
therefore, a number of people deserve to be mentioned here.
First of all, I would like to thank my supervisor, professor A.M. Vandenbergen, for
although our meetings were scarce, she always gave her professional opinion and guidance.
Next, I wish to thank Beverly Collins for his help with the selection of the speakers
and his valuable advice concerning the procedure of the recordings.
Furthermore, I also express my thanks to Christel Janssens, who kindly offered to give
up her English classes so that I was able to conduct my experiment. Of course, I should not
forget to mention the 119 respondents for their kind cooperation, because without them the
realisation of this dissertation would not have been possible.
I would especially like to thank my parents for giving me the opportunity to study and
my sister Marijke for her moral support and her helping hand with the entry of the data.
Last, but definitely not least, I am very grateful to all my friends and my boyfriend
Zef, who were always there for me and managed to cheer me up when things did not go the
way I planned them.

TABLE OF CONTENTS
1 INTRODUCTION ................................................................................................................................. 7
2 THE STUDY OF LANGUAGE ATTITUDES...................................................................................... 10
2.1. Theoretical framework................................................................................................................. 10
2.1.1 A tentative definition of ‘a language attitude’ ............................................................................. 10
2.1.2 The measurement of langua attitudes ....................................................................................... 12
2.1.2.1 Measurement techniques ......................................................................................... 13
2.2. An overview of early and recent research on language attitudes in various contexts.......... 16
2.2.1 Early research ........................................................................................................................... 16
2.2.2 More recent research and its criticism on the early research .................................................... 21
2.2.3 Other relevant research: English as a foreign language in Flanders and Sweden .................... 27
3 METHODOLOGY AND HYPOTHESES............................................................................................ 35
3.1. Method .......................................................................................................................................... 35
3.2. Speakers and speech material.................................................................................................... 37
3.3. Informants .................................................................................................................................... 40
3.4. Hypotheses and expectations regarding the results of the present experiment ................... 42
4 ANALYSIS AND DISCUSSION OF THE RESULTS......................................................................... 46
4.0. Preliminary remarks..................................................................................................................... 46
4.1. The personality scales................................................................................................................. 50
4.1.1 The competence dimension ...................................................................................................... 50
4.1.1.1 The native English speakers .................................................................................... 51
4.1.1.2 The non-native English speakers ............................................................................. 52
4.1.1.3 Comparison and interpretation ................................................................................. 53
4.1.2 The social attractiveness dimension.......................................................................................... 57
4.1.2.1 The native English speakers .................................................................................... 57
4.1.2.2 The non-native English speakers ............................................................................. 58
4.1.2.3 Comparison and interpretation ................................................................................. 59
4.1.3 The personal integrity dimension............................................................................................... 64
4.1.3.1 The native English speakers .................................................................................... 64
4.1.3.2 The non-native English speakers ............................................................................. 65
4.1.3.3 Comparison and interpretation ................................................................................. 67
4.1.4 The social status dimension ...................................................................................................... 70
4.1.4.1 The native English speakers .................................................................................... 70
4.1.4.2 The non-native English speakers ............................................................................. 72
4.1.4.3 Comparison and interpretation ................................................................................. 74

4.2. The speech scales ....................................................................................................................... 80
4.2.1 The status dimension ................................................................................................................ 80
4.2.1.1 The native English accents....................................................................................... 81
4.2.1.2 The non-native English accents ............................................................................... 81
4.2.1.3 Comparison and interpretation ................................................................................. 82
4.2.2 The aesthetic dimension ........................................................................................................... 86
4.2.2.1 The native English accents....................................................................................... 86
4.2.2.2 The non-native accents ............................................................................................ 87
4.2.2.3 Comparison and interpretation ................................................................................. 88
4.2.3 The solidarity dimension............................................................................................................ 91
4.2.3.1 The native English accents....................................................................................... 91
4.2.3.2 The non-native accents ............................................................................................ 93
4.2.3.3 Comparison and interpretation ................................................................................. 95
5 CONCLUSIONS .............................................................................................................................. 100
5.1. General findings......................................................................................................................... 100
5.2. Discussion of the hypotheses .................................................................................................. 103
5.3. Concluding remarks .................................................................................................................. 106
6 BIBLIOGRAPHY ............................................................................................................................. 108
APPENDIX……………………………………………………………………………………………………112
6

1 INTRODUCTION
“[D]ialect may have an objective reality in the way people talk, but it seems quite clear that
it at the same time has a subjective reality in the kinds of consistent attitudes which people
hold toward one another’s speech. These kinds of attitudes are probably as important a part
of the sociolinguistic picture as the objective data which we find in speech corpora”(Shuy
and Williams 1973: 95).
Starting from the idea that language is much more than a series of uttered sounds, a frenzy
of sociolinguistic studies cropped up from the 1950s onwards, devoted to finding out the
social meanings that were attached to certain speech styles. Howard Giles and Ellen B.
Ryan (1982: 208) indicated that these studies have shown that a lot can be discerned from
the way a person speaks, viz. his or her “psychological states, category memberships and
behavioural capabilities.” Furthermore, since language is said to construct our identity,
attitudes towards language are ultimately attitudes towards the users of language (Holmes
2001: 242). Therefore, language attitudes are sometimes perceived to have far-reaching
effects. This is often the case, for example, in the context of employment, where certain
accents are regarded as unfit for the job because of connotations of criminality or
dimwittedness (Thomas 1999: 186).
Traditionally, with regard to the study of the attitudes towards English and its varieties, the
research field focussed on the attitudes of native speakers towards their own language as
well as other languages and language varieties. More recently, however, attention has been
drawn to how non-native respondents evaluate particular English varieties (e.g. Van
Bezooijen 1988; Botterman 1995), while other studies aimed at eliciting the attitudes of
native speakers towards non-native English varieties (e.g. Palmer 1973). This development
can be regarded as a consequence of the contemporary status of English as an international
language or lingua franca. English is no longer exclusively ‘owned’ by its native speakers,
since it has been found that, nowadays, non-native English speakers outnumber the native
ones 3 to 1 (Power 2007). Braj K. Kachru (1988: 3) stated that this spread of English as a
world language caused linguistic interactions in English to be of three possible types:
native speaker and native speaker, native speaker and non-native speaker, and non-native
speaker and non-native speaker. The first two types, as has been mentioned, have already
7

served as focus of attention in previous language attitude studies. The last type, however,
has not nearly received as much interest as the two preceding types when it comes to the
study of language attitudes.
The aim of this study, then, was to discover the attitudes of non-native speakers of English
towards native as well as non-native varieties of English. More specifically, the focus was
on how three native and four non-native Dutch and Flemish English accents were
evaluated in Flanders, among Flemish secondary school students. Previous research
conducted in Flanders indicated that Flemings held sometimes very strong opinions about
several native varieties of English (Botterman 1995; Simon 2005) and, in the light of the
ever so international society, it was deemed interesting to find out whether this target
group would reveal clear attitudes towards non-native varieties of English as well. The
general purpose of the present dissertation will be to investigate the reactions which these
native and non-native accents evoke as well as the assumptions underlying these reactions
(cf. Botterman 1995: 7).
The experiment involved 119 respondents in the sixth form of a Flemish secondary school
and was carried out by means of a questionnaire1. After listening to a tape-recording of a
particular English accent, the informants were asked to answer questions concerning the
personality of the speaker in question on various personality traits. Furthermore, they were
required to state their opinions about the accents themselves.
Chapter two serves as a general framework for the present study. In a first part, some
attention is drawn to the definition of a language attitude and the measurement techniques
that are generally used for the study of language attitudes. A second part gives an overview
of attitudinal research ranging from its origin to the more recent studies carried out in this
field of study.
Chapter three expands some more on methodology, giving information on the informants,
the speech samples and the questionnaire used for the present experiment. Furthermore,
some hypotheses are postulated for the expected results of the current study.
1 A copy of the questionnaire used in the present experiment is included in the appendix to this dissertation.
8

Chapter four forms the body of the present dissertation, drawing attention to the analysis
and discussion of the obtained results for the present experiment carried out in Flanders.
The results will be described along two groups, one concerning the attitudes towards the
speakers as persons, the other focussing on the evaluations of the accents as such.
The fifth and final chapter describes the general findings for the experiment, checks the
validity of the formulated hypotheses and ends with some concluding remarks.
9

2 THE STUDY OF LANGUAGE ATTITUDES
2.1. Theoretical framework
Language attitudes are interpreted in various ways in the existing research. Some of the
studies focus on attitudes towards language itself – asking informants to evaluate a
particular language variety as “beautiful”, “ugly” etc. Others broaden the perspective by
eliciting the attitudes towards the speakers of the language as well (Fasold 1984: 148). This
is why John R. Edwards (1982: 22) says that “most studies of language attitudes, in fact,
would be more accurately termed studies of attitudes towards speakers of language
varieties.” Whether these studies either choose to focus on only a particular language or
include research on attitudes towards speakers and speech communities, they all have
certain terminologies and measurement techniques in common. These two ‘building
blocks’ of language attitude study are described in what follows.
2.1.1 A tentative definition of ‘a language attitude’
When studying language attitudes it is essential to take on a larger “foundational
perspective” by referring to the importance of the general theory on term ‘attitude’ (Baker
1992: 8). According to Baker there has been a tendency of previous studies on language
attitudes to ignore the extensive literature on the definition and measurement of attitudes,
which results in research that is “naïve, not well defined [and] prone to replicate previous
mistakes” (1992: 8).
Agreement on the definition of attitude, however, has not proved to be simple.
Ralph W. Fasold (1984: 147) mentions two opposite theories about the nature of attitudes.
On the one hand the behaviourist view defines attitude as single units which can be found
in the reactions people have to social situations. Attitudes are thus recognised by
investigating observable behaviour (Baker 1992: 11; Vandermeeren 1996: 158). On the
other hand, mentalists describe attitudes as mental processes or an internal state, rather
than observable behaviour. According to the latter, attitudes act as intermediate variables
between the stimuli affecting a person and that person’s response – i.e. overt behaviour
(Fasold 1984: 147; Vandermeeren 1996: 158).
10

Apart from these competing theories, it seems easiest to describe attitude on a more
general level as “a psychological orientation toward a particular stimulus, the attitude-
object” (K. Williams and Jones 2005: 278). Since this dissertation evolves around a
research on language attitudes it is important to embed the more specific term language
attitude within these general definitions of attitude. The main difference between the two is
that language attitudes have language as their attitude-object. Colin Baker (1992: 8)
confirms this idea when he claims that language attitude scholars apply attitude research in
certain contexts, which gives them merely a different focus than pure attitude theorists.
Most language attitude research is based on the aforementioned mentalist view
which – unlike the behaviourists – considers attitudes to have three sub-components (Ryan,
Giles and Sebastian 1982: 7; Edwards 1982: 20; Fasold 1984: 148; Baker 1992: 12-13;
Oakes 2001: 29). This method of analysing attitudes is also referred to as the tripartite
model (K. Williams and Jones 2005: 278) which basically means that in every attitude a
cognitive (thought), an affective (feeling) and a behavioural (action) element are
combined. This is shown schematically in figure 1.1.
The cognitive component refers to our thoughts and beliefs about the attitude-
object. For example a belief in the value of the Irish language may lead to a favourable
attitude towards it (Baker 1992: 12). These thoughts are linked with certain positive or
negative feelings about the attitude-object, which form the affective component. Finally,
the behavioural component refers to the influence attitudes have on behaviour. Within the
same example of Baker (1992: 13), a person who has a favourable attitude towards the
Irish language might decide to send his/her children to a bilingual school. However, Baker
(1992: 13) also mentions that it is important to note that this action component of attitude
is not always an indicator of external behaviour. This means that there often are
inconsistencies between how we really behave and the way we say we want to behave – as
elicited in questionnaires or interviews (Vandermeeren 1996: 158). This is because people
are social beings whose behaviour is influenced by social context and the presence of other
people (Vandermeeren 1996: 159).
11

Fig. 1.1. The three sub-components of an attitude: affect, cognition and behaviour (Adapted
from Oakes 2001: 29).
Behaviour
Cognition
Affect
Attitude
Edwards (1982: 20) recapitulates the multicomponential attitude model as follows:
“[O]ne knows or believes something, has some emotional reaction to it and, therefore, may
be assumed to act on this basis”. Directed specifically at language the definition of attitude
turns into “any affective, cognitive or behavioural index of evaluative reactions toward
different language varieties or their speakers” (Ryan, Giles and Sebastian 1982: 7).
2.1.2 The measurement of language attitudes
Measuring language attitudes has proved to be difficult as many techniques devised to
elicit them have been criticised openly and frequently (Obiols 2002). A prevailing
impediment to the measurement of language attitudes seems to be tied to the social nature
of the attitude object – i.e. language – and its evaluation (Baker 1988: 116; 1992: 12;
Oakes 2001: 30; Vandermeeren 1996: 158-159). Edwards (1982: 21) explains this social
character of language evaluation as follows:
[E]valuations of language varieties – dialects and accents – do not reflect either linguistic or aesthetic quality per se, but rather are expressions of social convention and preference which, in turn, reflect an awareness of the status and prestige accorded to the speakers of theses varieties. (italics in original, my underlining.)
Leigh Oakes (2001: 30) and Baker (1992: 12) state that the difficulty of measuring
language attitudes has to do with the fact that the three components – cognition, affect and
behaviour – may not always be in harmony. A person may overtly express a favourable
attitude, whereas more covertly s/he may conceal negative feelings or beliefs (Baker 1992:
12). As mentioned above when describing the behavioural component, it is because people
are social beings, influenced by what is considered socially desirable, that there often exist
12

inconsistencies between actual behaviour and reported behaviour. Oakes (2001: 30)
explains this further with an example: “a mother may encourage her child to learn French
(behaviour), believing that it will be important for his or her future career (cognition), yet
all the while possibly loathing the language herself (affect)”. Both Baker (1992: 12) and
Oakes (2001: 30) are reserved when it comes to attitude measurement. They question
whether or not researches are able to delve further than the cognitive component, which
may only reflect surface evaluations, and elicit deep-seated feelings and anxieties (the
affective component) – especially when these are considered socially unacceptable.
Correspondingly, Fasold (1984: 147) remarks that the mentalist view on language
attitudes poses problems for its empirical research, because regarding a language attitude
as a mental state instead of observable behaviour makes the researcher entirely dependent
on the person’s report of what his/her attitude is. According to Fasold this sort of self-
reported data is of questionable validity – presumably for the same reasons as Baker and
Oakes – which led many scholars to devise methods of eliciting people’s attitudes without
them being conscious of the process.
2.1.2.1 Measurement techniques
There are three assessment techniques relevant to the study of language attitudes, generally
referred to as content analysis (of societal treatment), direct measurement and indirect
measurement (Ryan, Giles and Sebastian 1982: 7-8; Knops and van Hout 1988: 6-9; Oakes
2001: 30-31).
Content analysis of the societal treatment, although mostly overlooked in theories
on language attitudes, is as good a method to give information about views on language
varieties than the direct and indirect measurement techniques (Ryan, Giles and Sebastian
1982: 7). Generally, it encompasses all language attitude studies using autobiographical,
observational, ethnographic or historiographic methods (Knops and van Hout 1988: 6).
This entails that attitudes are not elicited by means of explicit requests to respondents but
from the various public ways in which the target language varieties are treated, such as
government and educational language policies and the analyses of literature and business
documents, newspapers and broadcasting media (Ryan, Giles and Sebastian 1982: 7;
Oakes 2001: 30; Knops and van Hout 1988: 7). This method emphasises the group as
opposed to the individual and is characterised by its unobtrusive research approach (Oakes
13

2001: 30; Knops and van Hout 1988: 7). Uus Knops and Roeland van Hout (1988: 7)
mention that this type of measurement is especially useful in cases where restrictions of
time and space prevent direct access to the subjects of research.
However, methodological debate concerning the study of language attitude has
largely focussed on whether to use a direct or an indirect measurement technique (Obiols
2002: 2). Direct measurement distinguishes itself from the content analysis because it lacks
an unobtrusive approach and uses a series of direct questions instead (Knops and van Hout
1988: 7). Subjects are asked to respond to a questionnaire or interview questions regarding
language evaluation (e.g. how favourably a variety is viewed), language preference (e.g.
which of two language varieties is preferred in certain situations), reasons for learning a
particular language, opinions on language planning activities and the evaluation of the
social groups who use a particular variety (Ryan, Giles and Sebastian 1982: 7; Knops and
van Hout 1988: 7; Oakes 2001: 31). As opposed to the content analysis, in which the
investigator infers people’s attitudes from their behaviour, the subjects themselves are
urged to reveal their attitudes (Knops and van Hout 1988: 7). But it is precisely for this
reason that the direct method has been criticised, since it allows the subjects to choose their
answers rationally which gives them opportunity to respond in a way they consider is most
approved of by the researcher and society and disguise their true – possible sexist or racist
– feelings at the same time (Obiols 2002: 3; Preston 2001: 41).
The indirect method has been developed to circumvent this possible manipulation
of the attitudes and to include the affective component – which is often irrational and
involves prejudices (Obiols 2002: 3; Preston 2001: 41). The aim is thus to elicit covert
language attitudes instead of public ones by means of techniques designed to keep the
subjects unaware of the purpose of the investigation. Preventing subjects from knowing
that their language attitudes are being measured makes it impossible for them to respond in
a self-flattering or socially acceptable manner (Knops and van Hout 1988: 8-9; Fasold
1984: 149). Therefore, Knops and van Hout (1988: 8) are of the opinion that “the term
disguised measurement would be more appropriate”. Probably the best known and most
used indirect method to measure language attitudes is the matched-guise technique,
developed by Wallace Lambert and his associates in 1960 (Ryan, Giles and Sebastian
1982: 8; Edwards 1982: 22; Fasold 1984: 149; Knops and van Hout 1988: 8; Oakes 2001:
31; Preston 2001: 41; Obiols 2002: 3). Respondents are asked to evaluate the personal
characteristics of apparently different speakers whose voices are recorded on tape, unaware
of the fact that they are hearing the same speaker using different linguistic varieties. Since
14

every voice sample conceals the same speaker, evaluations can not be influenced by factors
such as gender, age and voice quality (Thomas 1999: 183). Judgements are then considered
to confirm stereotyped prejudices towards the given linguistic varieties and, what is more,
towards the social group that uses that variety (Obiols 2002: 4). Edwards (1982: 22) points
out that with the matched-guise technique “it is not the speech per se which is evaluated,
but rather the speaker.” This widely used technique thus seems to provide useful
information, because its indirect method manages to gather less rational and, hence, more
spontaneous and sincere responses (Obiols 2002: 5). Nevertheless, it has been criticised for
its experimental features – eliciting attitudes within classrooms and laboratories gives the
technique an artificial or unnatural character – which allegedly reduce the value of the
judgements (Obiols 2002: 4). Consequently, many alternatives to the original ‘standard
method’ in language attitudes have been developed, taking into account natural settings
and the dynamic character of people’s speech styles (Knops and van Hout 1988: 8).
15

2.2. An overview of early and recent research on language attitudes in various contexts
In this section, a number of previous studies on language attitudes conducted in various
countries will be discussed. Obviously, this overview is not to be regarded as exhaustive,
but rather as a selection of those studies that were deemed relevant to the present
investigation. The previous research on language attitudes as described below should
complete the second chapter, which in its whole can operate both as a theoretical and
functional framework when contemplating the results of the current study.
In a first part the origin and spread of this field of study in Britain and the United States is
described. A second part is dedicated to later research that deviates in various ways from
the original studies, performed in countries such as the United States, the Netherlands and
Finland. The third and last part of this overview focuses on language attitude study in
Flanders and Sweden and gives special attention to the most recent development of English
as a foreign language.
2.2.1 Early research2
When considering the object of study – i.e. language attitudes – in a rather broad sense,
one could argue that its research goes back hundreds of years, or even as far as Aristotle –
who claimed that the way people spoke had an influence on their perceived credibility.
Some descriptive research in the early twentieth century brought under attention the idea
that certain language varieties were associated with prestige and others with various kinds
of stigma. Further studies conducted in the 1930s and 1940s in Britain and the USA were
the first attempts to prove that people are able to accurately evaluate the personality of
others on the basis of their speech (Bradac 1990: 388).
However, if language attitude research is more narrowly referred to as “the explicit,
scientific study of attitudinal consequences of dissimilar language varieties,” (Bradac
1990: 388) it seems that the first study on language attitudes was conducted some forty
years ago. In 1960, Lambert, Hodgson, Gardner, and Fillenbaum introduced the
abovementioned matched-guise technique as a means of assessing language attitudes
2 For this section, information will not be drawn from the primary sources, but from overviews given by Bradac (1990) and Edwards (1982).
16

(Edwards 1982: 22; Knops 1988: 105; Bradac 1990: 388; Preston 2001: 41). Their study
aimed to elicit attitudinal responses towards French and English in French-speaking
Canada. They played recordings of bilingual speakers reading a prose passage once in the
French version and once in the translated English one. English- and French-speaking
judges were then asked to rate these passages on scales of opposites that relate to the
speaker’s intelligence, likeability etc. The results showed that not only the English-
speaking respondents evaluated the English speakers more favourably on traits such as
kindness and intelligence, but, quite unexpectedly, the same reactions were found for the
French-speaking respondents. These findings led Lambert and his colleagues to conclude
mainly two things. On the on hand, their research definitely made clear that the evaluation
of a person’s personality can depend strongly on his or her language. On the other hand,
from the unexpected result that the lower-status group of French Canadians had positive
attitudes towards the speech of the higher-status group of English Canadians the
investigators deduced the work of stereotyped evaluative reactions (Edwards 1982: 22;
Knops 1988: 105).
This study of Lambert et al. not only set off a frenzy of language attitude research
around the globe, its innovative method seems to have set the standard in this field of study
for a long time (Preston 2001: 41). James J. Bradac (1990: 388) describes their matched-
guise technique as “perhaps the earliest attempt to exert experimental control over
potentially confounding speaker idiosyncrasies.” Also the use of semantic-differential
scales to rate the evaluations and formal prose passages to reduce the influence of content
on respondent reactions has dominated in the measurement of language attitudes (Bradac
1990: 389).
The early language attitude research adhered quite strictly to these techniques and
mainly focussed on the evaluations of speakers who represent geographical – and therefore
also often ethnic, political and socio-economic – differences (Bradac 1990: 389-390).
In Britain, for example, Strongman and Woosley 1967 (Edwards 1982: 23; Bradac 1990:
390) used the matched-guise technique to investigate the reactions of English
undergraduates (half of them were northerners and half southerners) to Yorkshire and
London accents. Results showed that both groups of respondents rated speakers of both
northern and southern accents in the same way, the former being highly associated with
honesty and reliability, the latter with self-confidence. The northern judges, however,
17

seemed to show extra loyalty to their own Yorkshire accent as they judged its speakers
having a high degree of kind-heartedness and a low degree of irritability.
Cheyne 1970 (Edwards 1982: 23; Bradac 1990: 390) did research on the attitudes
towards Scottish and English regional accents and found that generally Scottish speakers
were regarded by both Scottish and English judges as having a lower status than the
English guises. Yet, on personality traits such as ‘friendly’ and ‘likeable’, Scottish
speakers were rated more highly and especially so by Scottish raters.
Howard Giles 1970 (Edwards 1982: 23; Bradac 1990: 390) seems to have wanted
to conduct a research with a larger scope then the ones mentioned by Strongman &
Woosley and Cheyne. He included a total number of thirteen different accents residing in
the UK and investigated how they were perceived by British secondary school children.
His results indicate a sort of hierarchy of prestige, with RP – i.e. “Received
Pronunciation”, the non-regional standard accent also referred to as ‘BBC English’,
‘Oxford English’ or ‘the Queen’s English’ – at the top, followed by foreign (e.g. West
Indian) and regional (e.g. South Welsh) English accents and with urban accents (e.g.
Cockney, Birmingham) at the bottom.
Attitudes towards language varieties have also been studied outside of Europe. In the
United States, for example, early language attitude research seems to support the findings
of the British studies (Edwards 1982: 26).
Tucker and Lambert 1967 (Edwards 1982: 26; Bradac 1990: 390) concluded from
their research that northern white as well as southern white and southern black college
students rated GA guises – i.e. “General American” also referred to as ‘Network English’3
– more favourably than all other American English dialect users, such as black speakers,
used in the study.
This early research on language attitudes taken together led Lambert 1967 (Edwards 1982:
23; Preston 2001: 41) to make some generalisations about the structure of the attitudes
measured so far. He noticed that respondents’ evaluations of the speaker’s personality
could be grouped according to three different dimensions or “factor groups”, viz.
3 GA is generally considered as a collection of accents which are similar in the fact that they do not show any regional – esp. eastern or southern – features. RP, on the other hand, was originally a regional accent but developed because of the prestige of its users to the non-regional standard accent. RP is thus much more a social accent – used largely by middle- and upper-class speakers – than GA (Van Dale dictionary 2004).
18

competence, personal integrity and social attractiveness4. These dimensions are each a
combination of a number of personality traits related to the speaker, with competence
referring to the speaker’s intelligence and industriousness, personal integrity indicating his
or her helpfulness and trustworthiness and social attractiveness reflecting the speaker’s
friendliness and sense of humour.
Keeping this in mind, further studies showed that these evaluating dimensions were
often at work (Preston 2001: 42). General findings show high ratings for standard accents
on the competence dimension and greater integrity and attractiveness evaluations for non-
standard (regional) accents. Linda Thomas (1999: 183) points out that previous studies
carried out in the UK and the US showed that:
Speakers who score high on the status scale, tend to score low on the solidarity scale; that is, they are not seen as being particularly friendly or sincere. Speakers who score high on the solidarity scale tend to score low on the status scale; that is, they are not seen as being particularly intelligent or confident.
Surprisingly, these evaluations generally tend to be the same for both standard- and
regional-accented speakers. This means that a high-status group, for instance speakers with
an RP accent, judge their own accent positively on the status/competence dimension and
negatively on dimensions underlying solidarity. A low-status group, on the other hand,
expresses the same attitude, assigning their own local variety with advantages on personal
traits such as friendliness, but disadvantages on traits relating to competence.
Evidence for these general associations can be withdrawn from the fact that a lot of
politicians feel it is necessary to work on their accent – for example Margaret Thatcher
took elocution lessons – exactly because they are aware of these associations between an
RP accent and characteristics such as reliability and intelligence (O’Driscoll 1990: 56).
Thomas (1999: 186) also mentions politicians who emphasise their non-prestige accent in
order to appeal to a more lower status group.
Edwards (1982: 26) mentions the importance of the social context in which these findings
occur, an idea that Janet Holmes (2001) also emphasises in a more general sense when she
discusses the study of language attitudes. Change of context includes a change in
evaluation patterns, Edwards says. He refers more specifically to the interest in ethnicity
and pride among American blacks and to the feelings of nationalism among French 4 Other researchers (e.g. Ryan, Giles and Sebastian 1982) have often taken personal integrity and social attractiveness as one solidarity dimension (Preston 2001: 42).
19

Canadians as illustrations of backgrounds that need to be taken into account when studying
language attitudes in the United States and Quebec respectively, for they may result in
different attitudes than the ones that are generally found – i.e. these ethnic group members
and regional speakers may be perceived more favourably.
More generally, the concept of context is essential in the study of language
attitudes, because people always evaluate others within a certain context. Holmes (2001:
343) states that this should be taken into consideration at all times when talking about
people’s attitudes towards particular languages or language varieties. People do not judge
intrinsic linguistic qualities, but they are led by certain social or political prejudices when
they evaluate a language. She formulates this idea as follows:
People generally do not hold opinions about languages in a vacuum. They develop attitudes towards languages which reflect their views about those who speak the languages, and the contexts and functions with which they are associated. When people listen to accents or languages they have never heard before, their assessments are totally random. (2001: 343)
Thomas (1999: 184) explains this further and says that, basically, “we talk about the
language as a cover for talking about the people.” The stereotypes influencing our
judgement reside within a particular speech community – enhanced by broadcast media
such as TV and film – and are thus not a character of the language itself. People who are
unfamiliar with a certain language variety will make other judgements than those who do
know the variety, exactly because the former are not able to link the language variety to its
speakers and the stereotypes usually surrounding them.
Already in the early language attitude studies investigators indicate that by means
of the matched-guise technique stereotyped evaluative reactions are elicited. This is,
according to Knops, also formulated by Lambert himself. Once a speaker is characterised
by the respondents into ethnic categories such as ‘French Canadian’ or ‘English Canadian’
s/he “is assigned the beliefs and feelings associated with that particular category” (Knops
1988: 105).
20

2.2.2 More recent research and its criticism on the early research
According to Bradac (1990: 391) alternatives to the methodology and subject of the early
language attitude research cropped up from the 1970s onwards.
For example, Frederick Williams (1973) used an alternative form of the matched-
guise technique – using visual cues on top of the linguistic features to elicit attitudes – to
shed light on how language attitudes come about. In a number of studies, Williams aimed
to elicit stereotyped attitudes of black and white teachers towards children of various
ethnic backgrounds (black, white and Mexican-American) in order to show that these
stereotypes about a particular ethnic group play an important role in “how a person
perceives another person’s speech characteristics” (p.126). He came to the conclusion that
these stereotyped sets of attitudes seem to be even more important than he originally
anticipated. One of his studies can serve as what he himself describes as “some evidence of
how this [stereotype] bias may effect ratings” (p.125). In this study he presented a number
of white teachers with video samples of white, black and Mexican-American children who
are all dubbed with the same standard English speech. Williams noticed, however, that the
ratings of this speech sample clearly differed depending on the ethnic group of the child in
vision. The black child, who was dubbed with exactly the same audio track than the white
child, was still evaluated as, what Williams calls in this study, more ‘ethnic-non-standard’.
This allowed Williams to assume that “persons tend to employ stereotyped sets of attitudes
as anchor points for their evaluation of whatever is presented to them as a sample of a
person’s speech” (p.126).
In another study, Leslie A. Palmer (1973) distanced herself from previous language
attitude study both in method and subject. She pointed out that not much research had been
done so far on attitudes towards English as a foreign language. Based on the hypothesis
that foreign speakers may elicit unfavourable reactions because their speech deviates both
grammatically and phonologically from the norms residing in the native English-speaking
community, Palmer aimed to investigate native speakers’ reactions to various non-native
English accents. The difference with previous research is that the subjects used to elicit the
language attitudes do not belong to a well-defined stable group within a particular
geographical area and, moreover, every speaker has a different degree of competence in
English.
The respondents were students from Georgetown University who had a minimum
experience with foreign languages. They were asked to evaluate speakers with Arabic,
21
Lingala, Spanish and Vietnamese language backgrounds. Unlike the method that is usually
used in earlier studies, the speech samples that were used in Palmer’s study existed in
different formats. On one tape segment the speaker could be heard reading a short text – as
was the traditional method – while on another he or she was asked to retell what s/he had
read. The third sample, finally, consisted of the speaker narrating an event from his or her
own experience. All respondents evaluated each of these samples for every non-native
accent on speech scales –i.e. rating the speech on accuracy of pronunciation, hesitation,
grammatical errors etc – as well as personality scales – rating the personality of the speaker
on various dimensions.
Results showed that most respondents were not able to identify the native language of the
speakers, with an exception of the Spanish speakers. This caused that no stereotypical
reactions to particular foreigners could be inferred and therefore it was deemed
“impossible to determine the extent to which variance might be caused by negative or
positive reactions to stereotypes and the extent to which it is caused by differences in L2
ability” (p.48).
Knops (1988) criticised the pioneering work of Lambert on various points. Firstly,
he claimed that it is too simple to assume that it is sufficient to assign speakers to a
particular ethnic group on the basis of their speech. More realistically, a person’s accent
also indicates his or her social class and thus more categories can be assigned to a single
speaker by listening to his or her way of speaking. Secondly, Knops mentioned that
language attitudes “vary across contexts and situations” (p.106). Respondents may be
asked to evaluate speech in different settings – e.g. the speech style or language variety
used at home as opposed to at school. This also includes the nature of the speech sample,
going from a formal prose passage to an extract of free conversation. Thirdly, Lambert
supposedly reduced the importance of the speech cues themselves, for introducing the
matched-guise technique meant a manipulation of variables such as speech tempo, pitch
and intonation. Especially this last point was of particular importance to Knops. He wanted
to find out in what way the linguistic stimuli themselves influence the evaluations of the
speakers. More specifically, his focus was on the potential “effect of phonological versus
phonetic deviations from standard pronunciation on language attitudes” (p.109). He
presented a number of Dutch university students with speech samples – a combination of
isolated words and fragments of running speech – of standard and various regional accents
from the Netherlands and Flanders and asked the respondents to rate both the speaker’s
22

speech and personality on semantic-differential scales. Results showed that there is a clear
relation between the evaluations on speech scales and the ones on personality scales:
Speech scales referring to traditional norms for good or correct articulation correlate highly with personality scales referring to speakers’ social and intellectual status. Speech scales displaying raters’ concern with the naturalness and aesthetic qualities of speech correlate highly with personality scales relating to the social attractiveness of speakers. (p.119)
Additionally, phonological deviations from standard pronunciation seemed to be more
decisive determinants of language attitudes than phonetic deviations. Overall, Knops was
able to conclude that different realizations of consonant and vowel phonemes had a part to
play in eliciting attitudes towards varieties of Dutch.
The study of Renée Van Bezooijen (1988) ties up with Knops’ third point of
criticism on traditional language attitude studies which availed themselves of the matched-
guise technique. This measurement technique looks upon idiosyncratic voice features, such
as specific pronunciation, prosody and voice quality as “disturbing factors that have to be
controlled for” (p.86). The voice samples that were then used to elicit language attitudes
did not vary when it comes to person linked voice features so that evaluations could only
be based on the language or dialect used. Van Bezooijen regarded this as a shortcoming of
previous language attitude research and aimed to assess the effect of various vocal
parameters – prosody, such as pitch, tempo and loudness as well as voice quality and
pronunciation5 – on the attribution of personality characteristics.
The speech material consisted of extracts from interviews with male Dutch speakers of
different ages who were all born in Nijmegen and from various social backgrounds.
Informants, university students from Nijmegen as well as autochthonous Nijmegen
inhabitants and four foreign listener groups (English, Kenyan, Mexican and Japanese),
were asked to rate these samples on voice scales as well as personality and social status
scales. Van Bezooijen was interested in using foreign informants and confronting them
with a language that was completely unintelligible to them, because she assumed that they
would perhaps base themselves on other cues than language variety to attribute social
status, level of education etc. to the speakers.
She was able to conclude that prosody, and pitch variation in particular, appeared to have
the biggest influence on the attribution of personality traits. This seemed to be true, not
5 With ‘pronunciation’ Van Bezooijen meant “precision of articulation and articulatory variations due to differences in regional and social background” (1988: 86).
23

only for the Dutch-speaking informants but also for the English, Kenyan, Mexican and
Japanese respondents, for they all associated various features of pitch, such as varied pitch
patterns, a wide pitch range and a large quantity of pitch movements – i.e. a ‘lively’
manner of speaking – with self-confidence, dominance, willpower as well as reliability and
sense of humour. So apparently, even if the language is unknown to the hearer, it is
possible to perceive variations in pitch. Further, Van Bezooijen noticed that the foreign
judges correlated voice quality with the social status of the speaker (e.g. the more
harshness, the lower the level of education), whereas in the intracultural setting – i.e. the
Dutch-speaking informants – voice quality was only related to attractiveness. Finally, with
regard to the importance of pronunciation, Van Bezooijen noticed a different evaluation
according to each informant group. The foreign listeners did not react to the pronunciation
patterns of the speakers, for they did not possess the linguistic knowledge to make a
distinction between the different accents. The Dutch-speaking respondents attributed
pronunciation with education, social position and intelligence. The autochthonous group,
however, related the Nijmegen accented speakers also with negative traits such as passivity
and uncertainness. According to Van Bezooijen, this could be due to the fact that this
group did not know the Nijmegen accent and it seems thus that accent has the largest effect
on language attitude when the listeners recognise it and connect it with clear connotations.
On the whole, Van Bezooijen indicates with this study the influence other factors than
language variety on the evaluation of a speaker’s personality.
More recently, Dennis R. Preston (2001) also believes it is necessary to review the
traditional method used in language attitude studies. He wants to embed this field of study
in a general folk theory by paying attention to the non-linguist’s underlying beliefs about
language.
According to Preston, it is important that before the researcher approaches his or her
language attitude study in a traditional way, it should be assured that the respondents are
able to form a mental map of the particular language variety, i.e. they ought to determine
where they think the speaker is from and at least have knowledge of the area with which a
sample voice can be identified. The problem with earlier language attitude research is that
this kind of “mental mapping” is has not been taken into consideration. Yet, a respondent
who is not able to recognise a sample voice as coming from its right origin cannot be said
to evaluate that particular regional speech. Instead, one has to conclude that the respondent
only assesses that particular sample. Preston makes this clear with an example:
24

For example, if one submitted a voice from New England to California judges and the judges agreed that the speaker was “intelligent”, “cold”, “fast” and so on, researchers could reasonably conclude that Californians judged that voice sample in that way. They should not conclude, however, that that is what Californians believe about New England voices, for a majority of the judges might not have agreed that the voice was from New England. (Perhaps they would have called it a “New York” voice.) More generally, Californians may not even have a concept of “New England” speech. Perhaps the most detailed mental map of regional US speech available to them is one which simply identifies the “Northeast”. (p.51-52)
Language attitude research which lets respondents literally draw their own map of regional
varieties could present a possible solution to this problem. To make this kind of studies
completely socially and methodologically correct, Preston even suggests to let the
respondents themselves decide which characteristics are needed for judging the speech
samples. “The method is to go to the respondents themselves,” he says (p.54) and he
further explains that he prefers a more direct approach that does not make use of actual
voice samples.
In the case of his own study, he let 147 informants from the state Michigan – varied in
gender, status and age – draw up maps of the US regional speech and concluded that the
US “South” and “North” appeared most frequently. He asked another large number of
Michigan respondents, when showing them a map of the US with all the speech regions
that the former group of 147 had drawn, to list characteristics they associated with the
speech of the various regions. These are preparations that preceded the actual study, which
consisted of asking 85 Michigan university students to rate various regions on scales
existing of traits that were abstracted from the previous study. Preston focussed for the
results on the two most important regions, “South” and “North”, and noticed that they fit in
perfectly with the general findings of the early language attitude research. The majority
variety, i.e. the “North”, was rated favourably on social status and the minority variety, i.e.
the “South”, had positive reactions on solidarity traits.
Preston concludes that taking into account these social and/or geographical “maps” is just
as – or maybe even more – important when studying language attitudes than looking purely
at the linguistic facts. If the focus only lies on linguistic theory “one moves up (and away
from) the concrete reality of language as a cognitively embedded fact” (p.63) and thus
language becomes something abstract, Preston says. It is vital that researches factor in the
language ideologies (or, more generally, “folk theory”) which underlie the evaluations of
the respondents.
25

Perhaps in the most drastic sense, Irene Hyrkstedt and Paula Kalaja (1998) also criticised
the traditional research on language attitudes. Not only did they reject the widely used
matched-guise technique, they thought it necessary to redefine the concept of attitude as
well. Language attitudes were then described not in the mentalist way as concepts in the
minds of subjects, but as heterogeneous notions constructed in discourse that differ
depending on the setting.
Their study started from the perspective of English as a foreign language and aimed to
elicit the attitude of a number of young Finns towards the role of English in Finland. Their
method consisted of drawing conclusions from the subjects’ written responses to a text that
expressed arguments against the use of English in Finland. Results showed that a positive
attitude seemed to be a little more prevalent than a negative one, drawn from arguments
given by the subjects such as belief in the strength of the Finnish language and the
advantages of knowing English (referred to as the nationalist and utilitarian repertoire
respectively). Hyrkstedt and Kalaja focussed both on the way in which the subjects argued
their attitude and on the content of their arguments and thereby concluded that, when
taking a discourse-analytic stance in the study of language attitudes, an attitude proves not
to be a stable but rather a variable concept. Subjects argued their agreement or
disagreement with the argumentation given in the sample text based on various points of
view, going from a nationalist to a utilitarian one.
Unlike the early research into language attitudes with its traditional methodology, these
researchers seem to give way to, instead of to suppress, the variability of responses.
So far this overview of language attitude research has focussed on primary results obtained
by the early studies into the subject in the 1960s and 1970s, where general findings
indicated that low-status groups – using regional varieties – were associated with high
ratings on the solidarity dimension whereas high-status groups – using standard varieties –
scored highly on the competence dimension. Moreover, these findings were said to be a
sign of underlying stereotypical reactions to certain groups of people.
In section 2.2.2, research that deviated from these early studies was described. This
included changes in methodology on the one hand – e.g. F. Williams (1973) decided to use
visual cues, Palmer (1973) drew on more naturalist speech samples, Preston (2001)
brought mental maps into his research, and Hyrksted and Kalaja (1998) drastically took
another methodological turn by employing a qualitative discourse-analysis – and changes
26

in perspectives on the subject of study on the other hand – e.g. the use of non-native
English accents by Palmer (1973), degree of accent as a way of eliciting attitudes in
Knops’ (1988) study, the study of the relative importance of speaker idiosyncrasies such as
pronunciation, prosody, and voice quality as well as the use of foreign respondents by Van
Bezooijen (1988) and Hyrksted’s and Kalaja’s (1998) study on evaluations of English as a
foreign language.
The first part (2.2.1) and the next one (2.2.2) contains the description of studies that show
similarities, either in its method or in its subject perspective, with the current study and are
therefore considered relevant to be included in this overview. Another number of studies
dedicated to language attitudes in Flanders and Sweden are treated separately in a third
section below (2.2.3) for, although they were similarly considered to relate to this study,
they did not fit within either one of the other sections.
2.2.3 Other relevant research: English as a foreign language in
Flanders and Sweden
First, it seems desirable to expand a little more on language attitude studies performed in
Flanders, since they share the same language context as the current study. However, this
will need an expansion on potentially influential elements for the study of language
attitudes in this area, viz. the position of English in Flanders and more generally the
Flemish language situation.
Flanders, the northern part of Belgium, is part of the Dutch language area in
combination with the state of the Netherlands. Dutch is considered the standard language
for both areas, although it is more appropriate to speak of two different standard varieties
because of lexical and syntactic differences (Knops and van Hout 1988: 4; De Caluwe
2001). In total, there are about 20 million Dutch speakers in the Netherlands (14 million)
and Flanders (6 million) combined (Knops and van Hout 1988: 4).
The Flemish live in a quite complex country when it comes to language. Belgium is a
federalised stated divided into three communities based on linguistic-cultural entities, viz.
the Flemish-, the French- and the German-speaking community (De Cock 2006: 1).
Moreover, the capital, Brussels, officially has a bilingual Dutch-French status. Belgium is
nonetheless often wrongly considered as a bilingual country instead of, rightly so, a
trilingual one. Michaël Goethals (1997: 105-106) makes this quite clear and says that
27

it is not the case that all Belgians (…) are bilingual in the sense that they can easily/fluently switch from Dutch to French or vice versa, nor that they can operate in both these languages, nor that they are confronted with these languages daily (…) French is a foreign language for Flemish inhabitants, just as (or for many even more than) English is.
Plurilingualism has always been held in a high regard by both Flemish government and
citizens, maybe partly due to the fact that the Dutch language plays a relative little role on
a worldly scale (Goethals 1997: 107). This influenced a positive attitude towards the
education of foreign languages, with French being taught from the age of 10-11 onwards
and English from the age of 13-14. In secondary schools, French seems to dominate the
educational area – as it occurs at an earlier stage in the pupils’ education – although
English plays a bigger role in the minds of Flemish youngsters. They feel more acquainted
with the language seeing that it is omnipresent in the media and cultural life (De Cock
2006: 4). Films, pop songs and advertising are penetrating the Flemish society with
English. Its influence is even further increased due to the part it plays in politics and in
business contexts.
The combination of the attention given to English in education – secondary schools offer
two to four hours of English a week – and the increasing role it plays in the Flemish
society results in a high degree of familiarity with and a considerable level of capability
among the Flemish-speaking population, especially with regard to the younger generations
(Simon 2005: 14).
Jean-Marc Dewaele (2005) starts from this Flemish language situation for his study on
language attitudes towards French and English in Flanders. He pointed out that both
function as a foreign language and aimed to elicit 18-year-old Flemings’ attitudes towards
them. Overall, he concluded that the attitudes towards English were much more positive as
measured by the pupils’ individual and social context.
They were asked to fill in a questionnaire and answer a number of statements such as “I
read French/English regularly” or “learning French/English is fun”. Additionally, they had
to rate their self-perceived competence of either language on a scale (poor, fair, good) and
answer a question measuring their politicocultural identity (“I define myself as a Belgian
more than a Fleming”).
Dewaele discovered that ratings measuring the degree of contact/use of the foreign
languages always ended up higher for English than for French, that self-perceived
competence was on the whole rated higher for English than for French and that those who
28

described themselves as Flemings before Belgians had negative attitudes towards French.
At the social level, these results could refer to the different historical backgrounds of both
languages. French has long been superior in Flanders which can explain the at times hostile
reactions of Flemings to the French-speaking Belgian community. English, however, is not
preceded by a turbulent history of occupation in Flanders. Furthermore, in the present
globalised society, English has the ‘advantage’ of being associated with popular culture
and is therefore considered hip and trendy. The respondents’ positive attitude towards
English may thus be influenced by its status as a lingua franca, i.e. “a tool allowing
communication with people from other countries” (p.133). At the individual level,
Dewaele links the measured attitudes to self-perceived competence, the frequency of use
and the anxiety to communicate in the foreign language in question. The degree of
competence in French being rather low – as stated by the respondents themselves – can be
related to the fact that they are not confident speaking the language and thus use it less
frequently than English.
Paradoxically, it seems that, although French has been instructed to the Flemish youngsters
more intensely and for a longer time, English has acquired the status of a second language,
whereas French has become a foreign language (p.133).
Johan De Caluwe (1992) read up on language attitude study in Flanders and more
specifically, on attitudes towards Dutch as it is spoken in the Netherlands. He expanded
upon the history of the relationship between the Flemish and the northern Dutch variety in
another study (2001) and noted that for years, the norm for the whole Dutch language area
(comprising the so-called northern Dutch area, i.e. the Netherlands, and southern Dutch
area, i.e. Flanders) appeared to be the variety of Dutch spoken in the northern part. The
term ‘variety’, however, does not seem really applicable here since Dutch was considered
one standard language of which Flemish Dutch was nothing more than an ‘incomplete’
form. From 1980 onwards the latter has been recognised as a valuable national variety of
Dutch (2001: 54). De Caluwe points out that this change is partly due to the influence of
the Belgian media (television, radio) that started spreading the Flemish variety and thereby
juxtaposing it with the northern Dutch variety (1992: 62). The attitudes of Flemings
towards the Dutch language changed accordingly and evolved from an association of high
prestige with northern Dutch to a more finely tuned view on both varieties.
De Caluwe (1992) summarised a number of studies dedicated to the Flemish attitudes
towards the northern variety of Dutch and found that, overall, Flemings prefer their own
Flemish variety, although the attitudes differ depending on the type of questioning in the
29

research and on whether it is the pronunciation, the fluency or the vocabulary they are
evaluating. Their inclination to choose the Flemish variety over northern Dutch is much
stronger when they are asked directly whether they want to speak with the northern variety
themselves. Other research using an indirect method to elicit the Flemings’ attitude –
playing speech samples of both varieties – discovered that when it comes to competence
and fluency, respondents revealed a positive attitude towards their northern neighbours. On
the whole, however, Flemings seem to really detest the northern Dutch pronunciation –
associating it with personality traits such as “arrogant” and “blasé” (1992: 57-58).
Particularly relevant to the present study is the dissertation by Ann Botterman
(1995) on the attitudes of Flemish students in their first year of higher education on five
national accents of English (RP, Irish, Scottish, American and Australian). Her results
showed that, even though the respondents were non-natives and thus did not use the
language they were evaluating on a daily basis, the accents seemed “to convey so much
more than a person’s origin” (p.107).
Botterman conducted a matched-guise experiment and asked Flemish respondents to rate
these five native English accents on both personality and speech scales. She discovered
that, overall, the RP accent appeared to have the most positive evaluations on personality
traits underlying competence and social status. Additionally, the male American speaker
was also assigned with nearly the same favourable competence traits, although he was
viewed less prestigious than the RP-speakers. The remaining Irish, Scottish and Australian
speech samples undermined the superiority of the RP-speakers on the personal integrity
dimension as well as on some traits reflecting the social attractiveness of the speaker – e.g.
“kindness” and “generosity”. These results of the evaluations on the personality scales
indicate a correlation between competence and social status. Those speakers who were
assigned to the middle- or upper-class – e.g. the male RP-speaker – were generally viewed
as being relatively competent.
Furthermore, Botterman pointed out a correlation between the findings of the ratings on the
personality scales and the ones on the speech scales. The RP accent, for example, scored
high on pleasantness (the aesthetic dimension) and intelligibility (the status dimension)
which clearly links up with its favourable evaluations of the speakers’ competence and
social status. It could then be said that the judges based themselves on the degree of
attractiveness of the speaker’s accent to evaluate his or her personality (p.106).
Finally, Botterman remarks that as far as the solidarity dimension goes – respondents were
asked whether they wanted their teachers or they themselves to speak with the accent heard
30

on the tape – the American accent seemed to elicit the most favourable reactions. She
refers to the possibility of ‘covert prestige’ because all other results indicate high ratings –
on both speech as personality scales – for the RP accent, and not the American one (p.106).
In another study, Ellen Simon (2005) equally used Flemish students as a target
group, although she also involved a small number of university teachers, to elicit their
attitude towards the English pronunciation target for Flemish advanced learners of English
in particular. She questioned whether the until now prevailing pronunciation model of RP
in both secondary and higher education is still tenable in the contemporary Flemish
society. English is now being used internationally by an increasing number of non-native
speakers and, moreover, the influence of the American media seems to result in kind of
mixed pronunciation. Is it then still feasible or necessary for students to speak ‘native-
like’?
The results of the survey she conducted, containing a number of multiple-choice questions,
showed that “Flemish students of English appear to be very RP-oriented” (p.19). The
majority of the students as well as the lecturers expressed that it is important to speak with
a native-like accent. Additionally, nearly all the students claimed that they aim at an RP-
like variety of English, which led Simon to conclude that no change in the RP
pronunciation model seems to be required. However, she remarked that results could
potentially be influenced by the particular target group used in her survey:
[I]t should be kept in mind that the target group discussed in this paper is formed by students majoring in English at university level. Their aspirations as far as the mastering of English is concerned might be very different from those of students taking English as minor subject (p.14-15).
Like Simon, Goethals (1997) stated that English pronunciation in Flanders is
mainly following the British example but that, at the same time, it seems increasingly
“infected by American influences” (p.110). He further indicated the existence of a Flemish
variant of ‘educated European English’ – sometimes referred to as ‘Flemenglish’ – which
displays its own type of pronunciation together with a number of grammatical or lexical
errors and which is “as recognisably different from the Dutch English in the Netherlands as
from the German or French Englishes” (p.110).
Apart from this language attitude research conducted in Flanders, it seems noteworthy to
mention a last number of studies that aimed to shed more light on the contemporary
31

Americanisation of society and its influence on the attitudes towards English of Swedish
university and secondary school students.
Mats Mobärg (1999, 2002) noticed that in Sweden today, there appears to be a
conflict between the British English pronunciation as it is taught at school and the
American English pronunciation gaining popularity among students outside of school. Just
like Simon (2005), who based herself on these Swedish language attitude studies for her
own survey, Mobärg (1999) wondered whether this increasing exposure to the American
English variety through popular media created a change in young pupils’ preference for
one of the two native English varieties. He discovered a clear correlation between media
preferences – elicited by asking the pupils to state their favourite TV programmes, films,
actor/actress and singer/group and determining whether these were dominated by
American answers – and language attitudes. Those pupils who preferred American media
output similarly expressed a preference for American English (2002: 119).
In a further study (2002) he found that the traditional school accent, i.e. RP, seemed to
dominate when it comes to the pupils’ own pronunciation, although quite regularly an
American accent cropped up. The RP accent increased when they were asked to read a
formal text, which led Mobärg to believe that they generally associate RP with formal
styles and GA with informal styles.
The study of Marie Söderlund and Marko Modiano (2002) started from the same
point of view, viz. the Americanisation process in most European countries and showed
that there is a discrepancy between the pronunciation goals in English language learning
and the actual linguistic behaviour of the students in Sweden (p.148). Filling in a
questionnaire, upper secondary school students admitted that they used a mixed form of
English pronunciation – referred to as ‘Mid-Atlanctic English’ – but that they were overall
more exposed to the American variety and, what is more, that they preferred this variety
over the British one. The authors concluded that there should be some important rethinking
as far as the educational standard, up till now still dominantly British English, is
concerned.
Margareta Westergren-Axelsson (2002) came up with slightly different results,
possibly due to the fact that she performed a study among University students of English
(cf. Simon 2005). When students were asked to give the variety they preferred, a majority,
however small, still indicated British English. Moreover, the author also discovered, when
listening to the students’ own pronunciation of English, that although a vast majority used
mixed British and American accents, there was still “a clear bias towards British English”
32

(p.132). In explaining their answers, students who reported that they use a mixed English
accent seemed to deplore the influence the American media has on their pronunciation and
described it as something “impossible to resist” (p.141). However, results concerning the
students’ self-reported use of an English variety indicated no clear preference for either a
British, an American or a mixed English variety.
Westergren-Axelsson concluded, in the same way as Söderlund and Modiano (2002), that
it is no longer feasible to aim for a one-accent-only approach in Swedish education, for the
students themselves not only mix different varieties in their use of the English language
due to the exposure to non-British English-speaking cultures, their positive attitude
towards the prestigious British-variety has become less vehement. She pointed out that,
even though there is still a small majority that prefers British English, “attitudes towards
the two varieties [BrE and AmE] seem somewhat more balanced” (p.143). On the one
hand, British English is positively evaluated for the beauty and pleasantness of its sound
and because of associations such as politeness, neatness and correctness. On the other
hand, positive reactions towards the American English variety are not referring to its
beauty, elegance or prestige but they are motivated with answers underlying other types of
values, such as “more relaxed” and “comes natural” (p.143).
Generally, these Swedish studies come to the conclusion that the influence of the
American English variety is increasing and has an effect on the pupils’ and students’
attitudes towards English as well as their English pronunciation. In Flanders, as
investigated by Simon (2005), this Americanisation process does not yet seem as prevalent.
Nevertheless, some remarks should be made on the research method. Asking students
directly which variety they prefer may only reveal their conscious overt attitudes which
correspond to what they think is expected of them. Similarly, measuring their type of
pronunciation by letting them read a text aloud is “hardly representative of the English
used in a natural communicative situation” (Westergren-Axelsson 2002: 137).
In this third section a selection of language attitude studies conducted in Flanders was
discussed in order to complete the framework for the current research.
All authors dedicate considerable attention to the fact that Flanders is a region with a
complex language situation. Flemings experienced difficulty defining their own mother
tongue, on the one hand distinguishing it from the northern Dutch variety (cf. De Caluwe
1992, 2001) and on the other hand fighting for its rights as opposed to French (the other
indigenous Belgian language) (cf. Dewaele 2005). Recently, the situation has become even
33

more complex with the spread of English as an international language (De Cock 2006;
Dewaele 2005; Simon 2005; Goethals 1997).
This complex situation has interested abovementioned authors to start a research on
language attitudes in Flanders. De Caluwe (1992) shed light on the predominantly negative
attitudes of Flemings towards the speech of their northern neighbours. Dewaele (2005)
discovered in his study that Flemish youngsters appeared to treat English as a second
language and French as a foreign one, for they indicated a higher degree of exposure to and
competence in the former language. He partly attributed this result to the contemporary
status of English as a lingua franca. As far as the various varieties of English is concerned,
Simon’s study (2005) showed that, although English is increasingly used by non-native
speakers which results in problems for the pronunciation model, Flemish university
students still clearly preferred to learn an native RP-like accent. Furthermore, Botterman
(1995) discovered that Flemish students were able to evaluate native English speakers on
various personality scales, which indicates that they, non-natives, have some degree of
familiarity with this language. She concluded that, overtly, RP was rated as most
prestigious, but as to speaking the language themselves, respondents seemed to prefer the
American variety. Goethals (1997) seems to agree both with Simon and Botterman when
he states that dominating attention is given to British English in Flemish education, but at
the same time there is an increasing influence of an American accent.
The Swedish studies correlated with some of the Flemish studies (Simon 2005; Goethals
1997) – and were therefore regarded relevant to mention – in the prevailing view that
English has become a world language which influences non-native speakers. However, the
former studies added more positive results with regard to the attitude and influence of the
American English variety among Swedish pupils and students.
34

3 METHODOLOGY AND HYPOTHESES In this chapter, detailed explanation will be given on the exact method as well as an
elaboration on the speech samples and informants used for the present research.
Additionally, based on previous research discussed in the second chapter, some
expectations and hypotheses regarding the results will be expressed.
3.1. Method
The present study was performed in order to draw a picture of the contemporary attitudes
of Flemish secondary school students in a suburb of Antwerp towards various native and
non-native accents of English. More specifically, the accents that were selected to elicit
these attitudes were three native ones, viz. RP, American English and Irish English along
with four non-native ones, viz. two Flemish English and two Dutch English accents. The
non-native accents were chosen to reflect two different degrees of ‘foreignness’: one which
indicated a pronunciation rather close to the RP accent and one which showed much more
pronounced signs of the speakers own native language – i.e. the southern Dutch variety
often referred to as ‘Flemish’ or the northern Dutch variety.
Following previous dissertations dedicated to the study of language attitudes
(Botterman 1995; Hiels 1996) this study opted for an indirect method to elicit language
attitudes, however without conducting a matched-guise experiment. Finding a person who
could read a text passage in all seven accents in a realistic way seemed quite impossible.
Instead, seven different male speakers with seven different language backgrounds were
recorded to represent the native and non-native accents. The sex of the speakers was the
same for all speech samples as a way of controlling for the possible gender-based
evaluations. However, the idiosyncratic characteristics of the speakers, going from voice
quality to differences in reading style and tempo, could not be fully controlled for and they
might potentially prove to have an influence on the students’ attitudes (cf. Knops 1988;
Van Bezooijen 1988). But as formerly expressed by Greet Hiels (1996: 14), this
disadvantage was deemed a rather minor problem for the present research as compared
with the perceived shortcomings of the direct method. The latter technique makes
respondents aware of the fact that their language attitudes are being measured, which
would give them opportunity to conceal their true covert beliefs and react in a manner
which they think is socially acceptable or according to the expectations of the researcher
35

(cf. 2.1.2.1). Moreover, the advantage of not using a matched-guise technique should also
be noted, viz. that every accent used in the experiment was considered authentic
(Botterman 1995: 14).
Respondents were asked to fill in a questionnaire after listening to the speech
sample in question, which aimed to measure their attitudes towards the recorded speaker
on both personality and speech scales. Since the informants used for the present
experiment were secondary school pupils and therefore no students of English, the
questionnaire was drawn up in Dutch to avoid possible misinterpretations (Botterman
1995: 15).
A first part was dedicated to the evaluation of the speakers’ personality on 21 seven-point
rating scales. These scales were selected on the basis of previous research into the field
(Botterman 1995; Hiels 1996; Soukop 2001), and the technique, known as semantic-
differential scaling, is quite common in the measuring of language attitudes. It requires the
evaluation of a stimulus on a scale consisting of adjectival opposites (Hiels 1996: 15).
Generally, these personality traits are divided into three, in the case of this study four,
dimensions, viz. relating to the speaker’s competence, social attractiveness and personal
integrity. Personality characteristics such as intelligence, ambition and leadership were
provided to refer to the first dimension (competence). The second dimension (social
attractiveness) was measured through personality traits such as friendliness, politeness and
likeability. Further, a person’s honesty, tolerance and trustworthiness were considered to
be part of the third dimension (personal integrity). A fourth dimension was added here, viz.
the speaker’s social status, following the previous experiments conducted by Botterman
and Hiels with the prospect of possible comparison of the obtained results. This was
elicited by ratings on scales covering a person’s authority and richness together with
multiple choice questions asking for the speaker’s social class and profession.
A second part was added consisting of the so-called speech scales which aimed to measure
the attitudes towards the accents themselves. Again following Botterman and Hiels, the
assessment of the accents was considered on three dimensions: a status dimension (as
measured by characteristics such as “intelligible” and “educated”), an aesthetic dimension
(e.g. does the accent sound pleasant?) and a solidarity dimension. The latter was not
elicited on a seven-point rating scale, but gathered from two direct questions asking
whether the informants wanted to speak with the accent themselves and whether they
wanted their teacher to use the pronunciation in question.
36

Finally, in addition to some general information on the respondents, such as age, sex and
social background, students also indicated their thoughts on the usefulness to learn English
and their interest in English as a course in school on seven-point rating scales.
The present experiment was carried out in a Flemish secondary school in a suburb
of Antwerp and measured the language attitudes of a total number of 119 pupils. It took
place during normal class hours and a short explanation of the task and its purpose was
given before the speech samples were played. Since it was preferred to use an indirect
method to elicit the language attitudes it was necessary to make sure the judges were as
uninformed as possible about the actual aim of the experiment. Therefore, it was said that
they were part of a research into “the ability of listeners to form an opinion of a speaker’s
personality using speech cues only” (Hiels 1996: 16).
The pupils were given the questionnaire after they had listened to the tape one time. The
speech sample was not played again for it was believed that this would invite respondents
to focus on particular speech cues which could possibly make their answers too conscious
and therefore less spontaneous.
3.2. Speakers and speech material
The earliest research into language attitudes focussed on various native accents as
evaluated by native respondents (cf. Lambert et al. 1960). As the field of study further
progressed, other researchers felt is was desirable either to elicit the attitudes of non-native
respondents towards native accents (cf. Van Bezooijen 1988) or, the other way round, they
used speech samples representing non-native accents and asked native speakers to evaluate
them on various traits (cf. Palmer 1973)6.
The present study, however, started from yet another research possibility. Non-native
speakers of English were not only asked to evaluate various native English accents (RP,
Irish English and American English) – a perspective that is not unknown for the study of
language attitudes (cf. Botterman 1995) – this study also aimed to elicit their attitude
towards a number of non-native English accents (Flemish English and Dutch English).
Elucidating the existing attitudes of Flemish youngsters towards Flemish and Dutch
varieties of English could therefore be considered an asset to the study of language
6 This is more elaborately explained in section 2.2.1 and 2.2.2 of the previous chapter.
37

attitudes, for no other studies have been found on the language attitudes of non-native
respondents towards non-native speakers of English.
The speakers whose speech formed the basis of the present experiment were
contacted with the help of various sources. As far as the native accents is concerned, the
Irish English- and American English-speaking males were Erasmus-students living in
Leuven and the remaining RP-speaker was a professor of English who previously taught at
the English department of the university of Ghent. The latter, living in Utrecht, the
Netherlands, put me into contact with the two Dutch English-speaking males. One of them,
being brought up by a British English-speaking father, had only a slight Dutch accent
filtering through his English pronunciation, whereas the other showed much clearer signs
of his mother tongue in his English accent. Finally, the two Flemish English accents were
recorded in Flanders. The one speaking with a more pronounced accent had no experience
with English but for the language courses he was instructed in secondary school, whereas
the more RP-like speaking Flemish male was a professor teaching at the department of
language & communication of the university of Ghent and was therefore more familiar
with the English language7.
These seven speech samples were selected from a total of 19 different native and non-
native accents recorded in Flanders and the Netherlands over a period of several weeks.
Initially, the idea was to include two American English accents and two British English
varieties – the non-regional RP accent and other national English accents such as Irish or
Scottish. Several American English-speaking males from various regions were recorded –
e.g. California, Mid-West, Louisiana etc. – but many of them had to be excluded because
of practical reasons (noise on the background, too many hesitations or mistakes on the part
of the speaker etc.) or because the accent was not pronounced enough as the speaker was
living abroad for a period of time8. Consequently, only one recording of an American
accent which was considered pronounced enough – the speaker being an Erasmus-student
only living in Flanders for a couple of months – and contained the least hesitations was
included in the experiment. Furthermore, other native English accents such as a Canadian
7 The non-native accents will from now on be referred to as: a broad Flemish, a slight Flemish, a broad Dutch and a slight Dutch (English) accent. 8 One of them stated that he had lived in Norway and in the Netherlands each for a period of three years, another had spent a certain amount of his childhood in Japan and Hong Kong and yet another admitted that he had lived abroad for more than 35 years and did not speak English most of the time. These examples are of course a consequence of the fact that is was not possible, for obvious practical reasons, to record the native accents in the nations at hand, i.e. the United States, Ireland and the UK, which would lead to more representative accents.
38

or an Australian variety were not selected for the same reasons stated above and for the
additional reason that these would make the experiment too extensive – resulting in five
native accents on top of the four non-native ones.
Overall, the seven selected speech samples were found to be as consistent as possible when
it comes to reading rate, voice quality, background noise as well as the social background
of the speakers. In order to obtain personal information (age, degree, nationality) each
speaker was asked to fill in a form. The highest consistency was found in the speakers’
social background, since they were all either students at university or had already obtained
a university or higher education degree – two of them even had a PhD. This led to the
conclusion that all recorded speakers had middle- to upper-class social backgrounds. It
should be noted, however, that it proved very difficult to reach a high degree of
consistency when only 19 recordings were at hand. Therefore, there are still rather large
differences when it comes to the age of the speakers – all seven were between the ages of
18 and 67, although four of them were in their twenties – as well as the reading rate for
each speech sample – going from one and a half minute to a little over two minutes. Of
course, these differences should be taken into account at all times when contemplating the
results of the experiment.
Each speaker was asked to read the same short text fragment with a length of about
three hundred words. When it comes to studying language attitudes, it is common to use a
text that is both neutral in terms of content and simple regarding its grammar and
vocabulary. Extracts which are explicitly political or scientific are thus not considered
suitable. This traditional approach was preferred for the current research by selecting a text
which was thought not to evoke any strong reactions among the respondents. Initially, the
same extract from Lewis Carroll’s ‘Alice’s Adventures in Wonderland’ used in the
experiment by Hiels (1996) was selected. However, it seemed that this kind of prose
passage had been frequently used in the early research period and was subsequently
criticised for its “little real-world import” (Bradac 1990: 389). Bearing this criticism in
mind, it was considered necessary to make use of a more naturalistic message – although
asking the speakers to read it aloud still gave the experiment an unnatural setting. The
definitive excerpt used for the current experiment was a short text on the profession of
nursing and was taken from a handbook on English grammar (Thompson 2004: 80). Some
adjustments were made to the text, such as removing explicit geographical references (e.g.
39
‘London’) and filling in blanks9. Before the actual experiment was carried out, some pilot
respondents were confronted with the passage and they were asked whether they were able
to understand it and whether they had any strong feelings about its content after they had
read it. Since no such problems were assessed, the text was considered applicable for the
present study.
3.3. Informants
The seven selected test tapes were played to a total of 119 respondents who were all
Flemish pupils in the sixth form of a secondary school in a suburb of Antwerp. The
experiment was carried out in seven different classes, with the number of pupils ranging
from 13 for the smallest class to 22 for the biggest class. Each group listened to and
subsequently evaluated only one speech sample. The informants had an average age of 18
of which the majority were females (72 out of 119 or 61%) and a strong minority were
males (47 out of 119 or 39 %). Four of the groups were only instructed two hours of
English a week; this were the pupils majoring in social sciences, maths and economics.
The remaining three groups, majoring in languages in combination with either science,
economics or maths (along with one group that followed Latin and therefore only majored
in languages) were instructed three hours of English a week.
These Flemish participants have been chosen to participate in the present experiment for
various reasons.
First of all, however, it should be noted that the initial plan was for the present
research to take place among Flemish university students of English, for it is generally
believed that they have a greater knowledge of the English language and its varieties.
Moreover, using this target group would make comparison with previous studies (cf.
Botterman 1995; Simon 2005) possible. The reason why this plan was not followed
through was mainly practical. Finding a considerable amount of University students eager
enough to participate in this sort of experiment voluntarily was deemed quite difficult and
time-consuming. Once this group of volunteers would be put together, there would still be
the remaining question of finding the appropriate moment and accommodation for
9 A copy of the both the original and the adjusted text fragment is included in the appendix to this
dissertation.
40
conducting the experiment. Performing the research in a secondary school, on the other
hand, did not require as much preparatory work and could more easily carried out in
different classes during normal teaching hours.
Secondly, it should also be pointed out that using secondary school students, i.e.
non-linguists, as informants for this kind of experiment could present the potential problem
of unfamiliarity with the various English accents. However, this does not mean that the
research would be invaluable. It merely entails that other types of conclusions should be
made from the results, e.g. if the informants would not be able to recognise a certain accent
it could refer to their limited knowledge of the English language, which in itself is a
valuable conclusion. Moreover, language attitude research conducted among Swedish
secondary school students showed that these respondents have a rather good knowledge of
the English language and were successfully able to recognise its various varieties (cf.
Mobärg 1999: 61; Söderlund and Modiano 2002: 155). Therefore, it could be assumed that
secondary school students in Flanders, a region paying similar attention to the teaching of
English in its schools than Sweden, would be just as competent as their Swedish
counterparts.
Furthermore, agreeing with Hiels (1996: 19), it was considered that a secondary
school could easily provide the current research with a certain amount of informants
representing a rather homogenous group. Variables such as age as well as regional and
social background of the respondents proved to be relatively constant in this context. In the
case of the present study, all informants were middle-class General Secondary Education10
pupils in the sixth form of a Flemish secondary school aged between 17 and 20. It was
assumed that the General Secondary Education pupils would have the best knowledge of
the English language, since this type of education offers the largest amount of English
classes to its pupils (cf. Goethals 1997: 108).
This brings us to a last practical consideration for the choice of the secondary
school in question. Luckily enough, this school consisted exactly of seven different classes
of General Secondary Education pupils in their sixth form and was therefore chosen as the
perfect location for the present experiment.
10 In Dutch this is referred to as ASO or “Algemeen Secundair Onderwijs” and this is distinguished from technical secondary education (TSO), secondary education in the arts (KSO) and vocational secondary education (BSO). The first type generally leads to university or other forms of higher education, the second and third type are generally leading directly to a job or to some non-universitary forms of higher education and the last type is mostly skill-oriented (De Cock 2006: 2).
41

3.4. Hypotheses and expectations regarding the results of the present experiment
Keeping in mind the previous research on language attitudes performed in Flanders and
elsewhere (cf. 2.2.3), certain expectations for the results of the present study can be
expressed.
First, a few hypotheses can be formulated for the expected evaluations of the non-
native accents. In this context it seems important to refer to the status of English in
Flanders (cf. Goethals 1997; Dewaele 2005; Simon 2005) and more generally even, to the
spread of English as a world language (Ferguson 1981; Kachru 1988; House 2003; Power
2007). In our contemporary globalised society the English language plays an increasingly
important role. It is the language of international politics, business, the internet and other
modern technologies. Globalisation has made a village of the world and “English is its
language” (Power 2007). Yet, this entails problems when it comes to the norm for the
English pronunciation, because in the present-day situation “non-native English speakers
outnumber native ones 3 to 1,” Carla Power notes. She sums up a number of so-called New
Englishes such as ‘Japlish’, ‘Hinglish’ and ‘Spanglish’ as a way of referring to the fact that
these non-native speakers are increasingly shaping the English language. Flemings are not
left out when it comes to using English as a lingua franca. Goethals (1997: 110) for
example, mentions the existence of a Flemish English variety sometimes called
‘Flemenglish’. As for the pronunciation of these non-native varieties, Power says:
With native speakers a shrinking minority of the world’s Anglophones, there’s a growing sense that students should drop trying to emulate Brighton or Boston English, and embrace their own local varieties. (…) it’s native speakers who have most to lose. Cambridge dons who insist on speaking the Queen’s English could be met with giggles – or blank stares.
In the light of these remarks, it can be assumed that the Flemish pupils in the present
research will evaluate the non-native accents rather positively. Dewaele (2005) discovered
that Flemish youngsters admitted that they use English quite frequently, but their English
utterances will hardly be exchanged with native speakers since English is still a foreign
language in Flanders. They will thus rather use English to converse with other non-native
speakers and one could question if in such contexts a native-like accent is still required (cf.
42

Simon 2005). This objection could cause the Flemish respondents of this study to assess
the native accents in a negative way.
However, in the context of education it was found that a native English accent, esp.
RP, was still set as the norm and preferred by both lecturers and students (cf. Goethals
1997; Simon 2005). Since the present experiment was set within an educational context,
negative results can be expected for the non-native accents. This attitude is to be perceived
more clearly when a comparison is made between the slight and broad non-native accents.
If the former is rated more positively, this could indicate that the respondents find it
important not to let the non-native features shine through when speaking English.
Furthermore, following the findings of De Caluwe (1992) which indicated that Flemings
generally detest the pronunciation of their northern neighbours, it is assumed that the
Dutch English accents will be perceived more unfavourably than the Flemish ones.
Secondly, a few hypotheses can also be formulated for the expected evaluations of
the native accents. Power (2007) admits that “despite – or perhaps because of – all the New
Englishes cropping up, it’s the American and British versions that still carry prestige”.
Previous research conducted in Sweden (cf. Mobärg 1999, 2002; Söderlund and Modiano
2002; Westergren-Axelsson 2002) discovered that as a result of an increasing exposure to
popular media, an Americanisation process is taking place in society, which has a positive
influence on the attitudes of the Swedish youngsters towards the American English variety.
This positive attitude was especially related to informal speech styles. Swedish university
students of English, however, still claimed to prefer the British English variety. The results
of the survey performed by Simon (2005) among Flemish university students of English
confirms the latter, as they showed that these respondents were “very RP-oriented” (p.19).
It seems thus that Flemish secondary school students will be especially confronted
with American English as well as RP in their daily lives. The former reaches them through
popular culture, i.e. pop songs, films, soaps, while the latter is exposed to them in school.
Other native English accents (e.g. Irish English), however, are varieties with which this
group of people rarely comes into contact. This is also the perspective from which
Botterman (1995: 19) started her research on language attitudes of Flemish students in
higher education. She discovered positive evaluations for the RP-speaker on the
competence and social status dimension, together with high ratings of the Irish English
accent in terms of social attractiveness and especially concerning personal integrity. The
American English variety received the highest ratings on what Botterman named the
solidarity dimension.
43

Bearing all these findings in mind as well as the fact that the informants are secondary
school students, it is assumed that the RP-speaker will be judged favourably on more
formal traits such as competence and social status (due to the importance of this accent in
education), whereas the American speaker is expected to be evaluated favourably on more
informal traits such as social attractiveness and personal integrity (due to the dominating
attention this variety receives in popular media). In addition, the Irish accent is presumed
to either have no clear evaluation pattern, since the target group may not be familiar with
this accent, or to have the same ratings as in Botterman’s study, viz. a positive evaluation
on the social attractiveness and personal integrity dimensions.
To sum up, a total of seven hypotheses have been postulated. The first three are concerned
with the results for the evaluations of the non-native accents, whereas the last four refer to
the expected ratings of the native accents:
H1: (a) the non-native accents will be rated positively, considering the
contemporary status of English as a lingua franca. (b) the native accents will then
be perceived in a more negative way, taking the same context into account.
H2: (a) the non-native accents will be rated negatively, as a reflection of the
importance of a native-like pronunciation in an educational context. (b) this attitude
will be further enhanced by a more negative evaluation of the broad non-native
accents.
H3: the Dutch English accents will be rated unfavourably in comparison with the
Flemish English accents, following previous attitude studies conducted in Flanders
(De Caluwe 1992).
H4: the RP-accented speaker will be judged favourably on the competence and
social status dimensions, indicating the importance of this accent in formal and
educational contexts.
H5: The American-accented speaker will be evaluated favourbly on the social
attractiveness and personal integrity dimensions, indicating the influence of the
generally Americanised popular media on the informants.
H6: The Irish accent will have no clear evaluation pattern, indicating the
informants’ unfamiliarity with the accent.
44

H7: The Irish-accented speaker will be rated positively on the social attractiveness
and personal integrity dimensions, referring to the previous results obtained by
Botterman (1995).
When it comes to the first and the second hypotheses, which clearly contradict one another,
it is expected that at least one of the two will find support in the eventual results of the
present experiment, depending on which underlying context (either the status of English as
a lingua franca or the importance of the educational context) has the most influence on the
Flemish secondary school students who are used as informants in this study. The same
remark counts for the contradiction between the sixth and the seventh hypotheses, i.e. the
assumption that at least one of these two will be confirmed.
In order to find out whether these hypotheses will prove to be valid or not, the results for
the present experiment will be first extensively analysed in the following chapter. In the
concluding chapter, these hypothesis will then be given a closer look.
45

4 ANALYSIS AND DISCUSSION OF THE RESULTS
4.0. Preliminary remarks
Before analysing the actual results of the present research it is noteworthy to make some
introductory comments.
First of all, some remarks ought to be made on the respondents’ familiarity with the
various accents used in the present experiment. Following previous research conducted
among secondary school students (cf. 2.2) it was believed that this was a valuable target
group for a language attitude study. The aforementioned experiments conducted in Sweden
had shown that secondary school students were on the whole quite successful when asked
to indicate the origin of a native speaker of English after listening to his or her voice on
tape. Moreover, taking an example closer to home into account, Dewaele (2005)
discovered that the majority of his respondents – Flemish secondary school students – not
only admitted that they preferred English over French, they also said they were generally
more exposed to English and used this language relatively often. This last finding was
assumed to imply that Flemish youngsters would also be able to recognise various English
accents.
When performing the present experiment, however, it soon became quite clear that these
earlier findings were not applicable in the Flemish secondary school in question.
Correctness rates for the seven speech samples are shown in Table 1:
The correct country of
origin % guessed correctly Other countries guessed
(significant % between brackets)
England (RP) 76,5 United States, the Netherlands, Australia
United States 7,7 England (53,8), Ireland, Flanders, Australia
Ireland 14,3 United States (47,6), England (23,8), Flanders, Australia, Scotland
Flanders (slight Flemish accent)
18,2 England (63,6), Australia, United States
Flanders (broad Flemish accent)
85,7 The Netherlands, Other
The Netherlands (slight Dutch accent)
6,3 England (37,5), Ireland (31,3), Flanders, United States
The Netherlands (broad Dutch accent)
93,8 United States
Table 1: Correctness rates for the seven speech samples.
46

Apparently, the only recorded speakers the informants were relatively successfully able to
relate to its rightful country of origin were the RP-accented speaker along with the two
broad non-native accents. These three speech samples clearly stood out as far as correct
guesses is concerned, since fairly poor results were found for the other native and non-
native tapes.
Not surprisingly, low correctness rates were found for the Irish English speech sample.
Since the target group of the present study is not often exposed to this type of English
variety in the media, this result was to some extent already expected (cf. 3.4). The same
counts for the two non-native speakers who only slightly let their mother tongue shine
through when reading the English text fragment. Their pronunciation showed some
similarities with an RP-accent which accounts for the considerable amount of pupils who
guessed these speakers came from England. Particularly for the slight Flemish English
accent this was the case, since its speaker was a professor teaching at the Language &
Communication department of a Flemish University – an environment that still emphasises
the standard British pronunciation (i.e. RP) when it comes to speaking English.
Especially the results for the American English speaker came as a surprise, for it was
expected that the high exposure to American popular culture in the informants’ daily lives
would result in the majority of the pupils recognising the accent (cf. 3.4). Nevertheless,
among the 13 Flemish pupils that this speech sample was played to, only one of them
ticked the United States-box, whereas more than half of them thought they had listened to
someone from England. This result could have been caused by various circumstances. It
should be taken into account, for example, that only a small group rated this speech sample
and thus, these pupils can not be considered representative for all Flemish secondary
school students. Perhaps these thirteen students did not watch a lot of American soaps or
listened to American pop songs – things that have been proven to have a positive influence
on young people’s familiarity with an American English accent (cf. 2.2.3). This could have
been elicited if an additional question on media preferences was added to the
questionnaire, but this was unfortunately not done. Further, the previous language attitude
studies among secondary school students in Sweden as well as Dewaele’s research opted
for a more direct approach, asking clear questions such as “What type of English do you
prefer” and “what type of English are you most exposed to?” (Söderlund and Modiano
2002: 52-53). Perhaps, this is a more suitable technique for measuring the language
attitudes of this specific type of informants and, if it were applied in the present experiment
clearer evaluations for certain speech samples could have been found.
47

The three accents that the majority of the informants did manage to associate with its
rightful origin were perhaps the ones they were most exposed to. The RP-accent is the one
they hear most in school, since it is still largely this accent that is considered the
pronunciation goal for pupils learning English (cf. Goethals 1997; Simon 2005). This,
together with the fact that the present experiment was set during class hours (i.e. in an
educational context), could account for the high correctness ratings of the RP speech
sample.
The most strikingly correctness rates were found for the strongly pronounced non-native
accents. During the experiment, pupils were sometimes jumping up in excitement and
laughing loudly when hearing this, according to them, “preposterous/absurd/ridiculous”
accent (as they shouted these remarks for everyone to hear). Clearly, as Table 1 shows,
they had no difficulty at all in recognising the right nationality of these speakers. A
possible explanation for these high ratings is that is was easy for them to recognise a
Flemish influence in the English accent because they speak with such a variety themselves
– and perhaps even their teachers do so. When it comes to the Dutch accent, correctness
ratings were even higher, which can partly be accounted for against the background of a
long tradition of Flemings making jokes about the accent of their northern neighbours (and
vice versa) which perhaps makes these Dutch features immediately recognisable in a
foreign accent as well.
After trying to explain the results shown in Table 1, it should also be noted that,
obviously, this low degree of familiarity with four out seven speech samples used in the
present study involves consequences for the interpretation of the informants’ measured
attitudes. When it comes to evaluating languages or accents unknown to the respondents,
previous research has shown that no pattern can be distinguished from the results. This has
been explained by Holmes (2001):
The listeners’ reactions to languages and dialects that are familiar to them are (…) compared with their reactions to languages which are unfamiliar. Using this method, it has been found that responses to a familiar language form a pattern. The pattern reflects the prestige of the speakers of the language in the community whose views are being sought. Responses to unfamiliar dialects and languages, however, form no pattern and are randomly distributed. The same is true for accents. (…). (p.361-362)
As for the results of the present research, these remarks on familiarity and unfamiliarity
with the presented speech samples ought to be kept in mind at all times.
48

Secondly, it has to be noted that several questions that were included in the questionnaire
will not be dealt with for the analyses of the results, because this would make the analyses
too extensive or because the results that were obtained for these questions did not show
any clear patterns. This was especially the case for question asking the informants to guess
the age of the speakers and the question requiring the informants to express their interest in
English as a course in school, both showing randomly distributed answers. Furthermore,
the sex of the informants was not evenly distributed so that it was not valid to divide the
analysis of the results along this line.
As for the question included to elicit the informants’ attitude towards the usefulness of
learning English, the results were quite interesting and will be mentioned here, so that they
can be kept in mind when contemplating the results in chapter four. All informants
expressed quite unanimously that it was very useful to learn English, explaining their
answers by mentioning that it is a world language and therefore makes it possible to
communicate with people from other countries. Apparently, the informants were aware of
the status of English as an international language and regarded this as a highly positive or
useful phenomenon.
In the following chapter, the results that were derived from the personality scales and from
the speech scales will be described, each in a separate part. Moreover, for each personality
or speech dimension, the results for the native accents and non-native accents will be dealt
with separately, before analysing the entire group of accents as a whole. It was believed
that this approach would make the analysis more surveyable and comprehensive than when
all accents were only discussed as a whole.
49

4.1. The personality scales
In this section, the evaluations of the various speech samples on the four discerned
dimensions, i.e. competence, social attractiveness, personal integrity and social status, will
be discussed. These ratings are said to reflect the attitude of the informants towards the
various English-accented speakers as persons.
4.1.1 The competence dimension
In the present experiment, seven characteristics were thought to reflect the speaker’s
competence, viz. “intelligent”, “not nervous”, “ambition”, “possessing leadership
qualities”, “industrious”, “self-confident” and “competent”. For each of these
characteristics the speaker was rated on a seven-point rating scale with the low numbers
representing the favourable end of the scale11.
The perceived competence of the various native and non-native speakers of English was
measured by obtaining the mean scores of the seven personality traits related to
competence. These mean scores were determined by calculating the average of all scores
acquired from the informants. As already mentioned in the third chapter, each test tape
containing one English-accented speaker was played to a group ranging from 13 to 22
secondary school students.
It is important to always bear in mind, when contemplating the mean scores, that the lower
numbers stand for favourable evaluations and that the higher numbers represent
unfavourable evaluations of the various characteristics. More simply put, a mean score of
1.82 for a personality trait such as “intelligent” indicates that this speaker is perceived to be
highly intelligent, especially when compared with a speaker who only received a mean
score of 4.13 on the same characteristic (Botterman 1995: 34; Hiels 1996: 32).
11 It should be noted here that the “nervous”-trait was presented wrongly in the questionnaire, with the favourable end represented by the highest numbers. However, this mistake was noticed when handling the data and the scale was turned around so that also for this trait the favourable end, i.e. “not nervous”, would be represented by the lower numbers.
50

4.1.1.1 The native English speakers
The mean scores for the seven included personality traits that were considered to reflect the
speakers’ competence are shown below in Table 2:
Personality traits RP AmE IrE “intelligent” 1.82 3.15 3.43 “not nervous” 1.82 2.15 2.57 “ambitious” 3.47 4.54 3.90 “possessing leadership qualities” 3.35 4.62 3.90 “industrious” 3.65 4.62 3.62 “self-confident” 2.76 2.92 2.95 “competent” 2.41 3.31 3.05 TOTAL ‘competence’ 2.76 3.62 3.35 Table 2: The native speakers’ competence as perceived by the informants.
These figures clearly show that the RP-speaker is perceived as being relatively more
intelligent, ambitious, self-confident, competent and more suitable for leadership than the
two other native English-speakers. Moreover, he is thought to be the least influenced by his
nerves (as measured on the “not nervous” trait). The only characteristic for which he did
not get the most positive rating is “industrious”, since the Irish English speech sample
received a slightly higher score on this trait.
When contemplating the figures shown in Table 2 a little further, it can be seen that there is
some kind of hierarchy for the ratings on the characteristics “ambitious”, “possessing
leadership qualities”, “industrious” and “competent”, with the RP-speaker rated most
favourably followed by the American speaker and with the Irish speaker at the bottom.
This hierarchy does not hold true, however, when considering the personality traits
intelligence, nervousness and self-confidence. In these cases the Irish speaker received
more positive ratings than the American one, although the RP-speaker still keeps his place
on top of the hierarchy. Results for the American and Irish speech samples on the
competence dimension seem quite evenly distributed, with four characteristics rated more
positive for the former and three characteristics judged more favourably for the latter
accent. On the whole, the second hierarchy (with the American accent at the bottom) seems
to outweigh the first one, for the total score (obtained by adding up the mean scores for all
seven competence-reflecting traits and dividing this sum by seven (cf. Hiels 1996: 35)) of
the ratings on the competence dimension shows that the American speaker is averagely
evaluated most unfavourably.
51

One consistency that seems to stand out is the overall positive evaluation of the RP-
speaker. The differences between the evaluations of the other two native English accents
are relatively negligible, with total ratings of 3.62 for the American accent and 3.35 for the
Irish speech sample. There thus seems to be a gap between the positive ratings for the RP-
speaker on the one hand and more negative evaluations for the American and Irish
speakers on the other hand. This is to some extent in accordance with the results for the
perceived competence of the same three native English speakers found in Botterman’s
study (1995: 35).
4.1.1.2 The non-native English speakers
The informants’ evaluations of the non-native speech samples on the seven personality
traits underlying the competence dimension are shown below in Table 312. These figures
are discussed separately from the ones obtained for the native speakers, because it was
deemed interesting to first examine the interrelations in each group of accents before
actually looking at the evaluations of all seven accents at the same time.
Personality traits FlemE (s) FlemE (b) DutchE (s) DutchE (b)
“intelligent” 3.45 4.00 3.06 4.13 “not nervous” 1.91 3.50 4.19 4.67 “ambitious” 5.27 4.86 4.19 3.33 “possessing leadership qualities”
4.86 5.21 3.88 4.88
“industrious” 4.73 5.38 3.69 3.13 “self-confident” 3.09 4.57 3.56 3.81 “competent” 3.45 4.23 3.31 3.81 TOTAL ‘competence’ 3.82 4.54 3.70 3.96 Table 3: The non-native speakers’ competence as perceived by the informants.
Looking at the total scores for all seven traits reflecting the competence dimension, it
seems that the informants regarded the slight Dutch English speaker as the most
competent, although it can be seen that the scores between the two Dutch speakers and the
slight Flemish English speaker are not far apart. When regarding the figures for the traits
separately it becomes even more clear that there are few differences in the ratings for these
three speakers. The slight Dutch English speaker was perceived most intelligent, most
competent and most suitable for leadership, the broad Dutch English speaker received most
12 For clarification, the (s) and (b) in this Table stand for ‘slight’ accent and ‘broad’ accent respectively.
52

positive ratings for the characteristics ambition and industriousness and the slight Flemish
English speech sample was judged most favourably on two personality traits, viz. “self-
confident” and “not nervous”. The most positive ratings on the seven traits thus seem quite
evenly divided among these three speech samples, which indicates that is not really a clear
pattern or hierarchy to be discerned from these figures.
What does stand out when contemplating Table 3 is not the most positive rated speech
sample but the one that was perceived most unfavourably, viz. the Flemish speaker with a
broad accent. On four of the seven competence-reflecting traits this speech sample shows
the most negative ratings. These characteristics are: “possessing leadership qualities”,
“industrious”, “self-confident” and “competent”. The total score of 4.54 is also
distinguishably higher – reflecting a more negative attitude – than the other three total
figures.
Finally it also seems worth mentioning that the more pronounced non-native accents are on
the whole perceived less favourably than the less marked non-native accents, particularly
on traits such as intelligence, having leadership qualities, self-confidence and competence.
4.1.1.3 Comparison and interpretation
The separately discussed results for the native and non-native speakers’ perceived
competence will now be related to each other in this additional section. Moreover, some
suggestions will be made as for the interpretation of the evaluations. Table 4 shows the
mean scores for all seven speech samples on the seven competence-reflecting traits:
Personality traits RP AmE IrE
FlemE (s)
FlemE (b)
DutchE (s)
DutchE (b)
“intelligent” 1.82 3.15 3.43 3.45 4.00 3.06 4.13 “not nervous” 1.82 2.15 2.57 1.91 3.50 4.19 4.67 “ambitious” 3.47 4.54 3.90 5.27 4.86 4.19 3.33 “possessing leadership qualities”
3.35 4.62 3.90 4.86 5.21 3.88 4.88
“industrious” 3.65 4.62 3.62 4.73 5.38 3.69 3.13 “self-confident” 2.76 2.92 2.95 3.09 4.57 3.56 3.81 “competent” 2.41 3.31 3.05 3.45 4.23 3.31 3.81 TOTAL ‘competence’
2.76 3.62 3.35 3.82 4.54 3.70 3.96
Table 4: The native and non-native speakers’ competence as perceived by the informants.
53

It seems that, when looking at the overview of the figures relating to the competence
dimension presented in Table 4, the RP-speaker maintains his top position in the hierarchy.
He received highest ratings for intelligence, leadership qualities, self-confidence,
competence and was perceived the least nervous of all seven speech samples. With the
exception of the “not nervous” trait, the two broadly accented non-native speakers were
assessed least favourably on exactly the same four characteristics that were rated the most
positive for the RP-speaker. Furthermore, the non-native accents are on the whole
perceived more negatively in terms of competence than the native speakers, with the
broadly accented Flemish speaker receiving the lowest ratings. It can thus be said that what
was true when consulting the results for each group separately remains accurate when
comparing the evaluations for all seven speech samples. In other words, the RP accent is
associated with the highest ratings whereas the two broad Flemish and Dutch accents are
downgraded the most of all seven accents.
Although the American and Irish English accents received more positive ratings than the
two slightly accented non-native speakers, the differences between ratings for these four
speech samples are only minimal. Therefore, it seems most important to remember that
ratings seem to be divided into two camps: a highly positive one (RP) and a highly
negative one (broad Flemish English and broad Dutch English) with the four remaining
speech samples as an intermediary level between the two.
As for the interpretation of these results, the preliminary remarks concerning the
familiarity with the various accents should be taken into account. The results for the three
speech samples that are most marked appear to be the ones with high correctness rates
among the informants (cf. Table 1).
Firstly, most of the Flemish pupils rating the RP speech sample were aware of
which nationality they were evaluating, which could explain the high ratings on traits such
as intelligence, self-confidence, competence and leadership qualities. These positive
evaluations can be related to the dominating position of the RP pronunciation in the
Flemish educational system. Associating a certain accent with the standard pronunciation
model in school would account for the association of the RP-speaker with a high degree of
competence. Moreover, the Flemish pupils were possibly also aware of the social
connotations of this variety as an accent mostly used by the upper classes. Consequently,
they related this type of speaking to prestigious and highly educated people and therefore
indicated the RP-accented speaker in this study as highly intelligent and likely to have a
54

leadership position. It should be mentioned here that Botterman (1995: 38) concluded that
the same underlying assumptions were responsible for the high rating of the RP speech
sample in her research. Moreover, some evidence for the fact that the informants in the
present experiment associated RP with either high status jobs or education can be found
when looking at the section in the questionnaire in which the informants were asked to
attribute an occupation to the speaker. They could choose from eight possibilities, ranging
from very high status jobs to being unemployed. The results showed that 53 % of the
informants placed the RP speaker in the highest rank offered, viz. having a profession such
as a doctor or a lawyer. Another strong minority of 35,3 % believed this speaker to have a
function in education, such as a teacher or professor. Comparing this to the other speech
samples, it appears that the association with a high prestigious job only occurred in such a
majority in the case of the RP speaker.
Secondly, the speech sample containing the broad Flemish English speaker was
also correctly related to its country of origin by most respondents. As the abovementioned
results have shown, this type of speaking was looked down on the most in terms of
competence. Additionally, a similar negative evaluation was found for the broad Dutch
English speaker, which at the same time is the speech sample that received the highest
correctness rates. Apparently, it thus seems that the informants regarded a speaker with a
high degree of ‘foreignness’ in his accent as absolutely not intelligent, competent, self-
confident and having the least possibility of a leadership position. These results can be
explained by means of some remarks made by Simon (2005: 15,17) and Palmer (1973: 42).
They both stated that speakers with foreign English accents are generally associated with
an overall low degree of competence, since deviations – grammatically and/or
phonologically – from the norms of the native English-speaking communities indicate a
limited knowledge of the language. In the case of this study, these remarks seem to hold
true, since it appeared that the informants judged the Flemish and Dutch speech samples
more negatively than all three native test tapes when it comes to the speakers’ competence.
Moreover, the more pronounced non-native speakers received even lower ratings than the
non-native speakers with only a slight foreign accent. The context in which the experiment
was set, i.e. during class hours, could have influenced these results even further, since the
importance of a ‘correct’ standard English pronunciation is generally stressed and all
accents that deviate from the norm are as good as rejected.
Finally, when it comes to the American, Irish and two slightly accented non-native
speech samples, the informants appeared not really to know which nationality it was they
55

were evaluating, which makes interpretations of the results more difficult. This is because
no underlying conceptions of the speakers and speaker communities can be said to have an
influence on the informants’ attitudes. It has been shown that these four speech samples
did not elicit such clear attitudes in terms of competence than the ones which were familiar
to the informants. For the two native accents, figures seemed quite evenly distributed and
the same can be said for the two slightly accented non-native speakers. Following Holmes
(2001), the attitudes towards these unfamiliar accents will perhaps rather be based on
intrinsic linguistic features, such as voice quality and reading rate, than on preconceived
opinions about the nationalities of the speakers. Although it should be taken into account
that speaker idiosyncrasies can just as well have an effect on the evaluation of speech cues
with which the informants are familiar, it is thought that these have a stronger effect on the
ratings of unfamiliar accents or languages. Van Bezooijen (1988), for example, found that
foreign judges based their evaluation of various Dutch speech samples on voice quality and
prosody rather than on pronunciation, as it was impossible for them to perceive different
accents of a language they had never heard.
56

4.1.2 The social attractiveness dimension
After having presented the results for the various speakers’ perceived competence, a
second category of personality traits included in the questionnaire which were believed to
reflect the speakers’ social attractiveness will now be discussed.
This dimension was measured by six characteristics, viz. “friendly”, “polite”, “likeable”,
“sense of humour”, “sociable” and “introvert”.
4.1.2.1 The native English speakers
Once more, it was decided to first treat the results for the native English speakers and non-
native English speakers separately before looking at the obtained results for all seven
speech samples together. The mean scores attributed to the three native speakers of English
in terms of their social attractiveness are shown in Table 5:
Personality traits RP AmE IrE
“friendly” 3.00 3.38 4.38 “polite” 1.82 3.08 3.43 “likeable” 3.47 3.69 4.14 “sense of humour” 5.94 5.46 5.62 “sociable” 4.35 4.15 4.38 “introvert” 3.06 4.08 3.76 TOTAL ‘social attractiveness’ 3.60 3.97 4.29 Table 5: the native speakers’ social attractiveness as perceived by the informants.
It can be deduced from these figures that, again, the RP-speaker was on the whole
evaluated most positively compared to the other two native English speakers. For four out
of the six included personality traits reflecting social attractiveness, the RP-speaker
received the highest ratings, viz. friendliness, politeness, likeability and ‘introvertiveness’.
The second place is generally occupied by the American speaker and the last place is
reserved for the Irish speech sample. This hierarchy (1: the RP speaker, 2: the American
speaker, 3: the Irish speaker) can be perceived for the mean scores of the first three
characteristics: friendliness, politeness and likeability as well as in the total scores for all
six characteristics taken together.
However, it also seems worth mentioning that the American speaker has the most
favourable ratings when it comes to sense of humour and sociability, although it appears
that the figures for these characteristics are rather similarly negative for all three native
57

accents (ranging from a mean score of 4.15 for the American speaker’s perceived
sociability to a mean score of 5.94 for the RP-speaker’s alleged sense of humour).
Especially when it comes to sense of humour all native speakers were perceived fairly
negatively, with mean scores of 5.46 and more. Thus, as far as these two characteristics is
concerned, i.e. “sociable” and “sense of humour”, the RP-speaker loses his superior
position in the hierarchy.
Finally, concerning the results for the evaluations of the Irish speaker’s social
attractiveness, it can be seen that in addition to having the last place on the hierarchy when
it comes to the first three personality traits (friendliness, politeness and likeability), he has
also been perceived the least sociable of the three native English speakers.
4.1.2.2 The non-native English speakers
An overview of the perceived social attractiveness of the four non-native speakers of
English as measured on the six personality traits can be seen in Table 6 below:
Personality traits FlemE (s) FlemE (b) DutchE (s) DutchE (b) “friendly” 4.14 4.14 3.50 3.19 “polite” 3.00 4.07 3.44 3.56 “likeable” 4.55 3.79 3.69 3.56 “sense of humour” 6.18 5.29 4.88 4.56 “sociable” 5.36 4.71 3.94 3.94 “introvert” 2.64 2.92 3.75 3.81 TOTAL ‘social attractiveness’
4.31 4.15 3.86 3.77
Table 6: The non-native speakers’ social attractiveness as perceived by the informants.
It can be discerned from these ratings of the non-native speakers’ social attractiveness that
the broad Dutch-accented speaker is perceived most favourably concerning friendliness,
likeability, sense of humour and sociability. However, the professed advantage for the
Dutch speaker with a broad accent on these traits is not really convincing, since the
differences with the slight Dutch accent are often only minimal. On sociability, for
example, these two non-native speakers received exactly the same mean score of 3.94.
The second most favourable ratings are generally reserved for the slightly accented Dutch
speaker. This counts for the characteristics friendliness, politeness, likeability and sense of
humour. With only a small difference in the total scores for the Flemish-accented speakers,
these two speech samples were on the whole perceived the least favourably.
58
These observations make it possible to postulate a hierarchy in the results for the non-
native speakers’ social attractiveness relating to four included personality traits, viz.
friendliness, likeability, sense of humour and sociability. The first position is for these
characteristics always for the speaker with a broad Dutch English accent, followed directly
by the slightly accented Dutch speaker and with the two Flemish speakers at the bottom
position. Apart from the results for the friendliness characteristic (which shows precisely
the same mean score of 4.14 for both Flemish accents), the speaker with the least
pronounced Flemish English accent is rated even more negatively than his Flemish
counterpart when it comes to sociability, sense of humour and likeability.
However, it appears that this hierarchy completely falls apart as far as the speakers’
politeness and ‘introvertiveness’ is concerned. On these characteristics, it is the speaker at
the hierarchy’s bottom position that now climbs up to the top and receives the most
positive ratings of all four non-native speech samples, i.e. the speaker with a slight Flemish
English accent. Moreover, the speaker that previously enjoyed a superior position, i.e. the
broadly accented Dutch speaker, is perceived relatively unfavourably, with a last position
for the “introvert” characteristic and an all but last place related to politeness.
Finally, when contemplating the total scores for all six social attractiveness-reflecting
traits, it seems that on the whole the Dutch speakers are perceived more favourably than
the Flemish speakers. Results could then be seen to reflect two groups of evaluation: a
rather negatively viewed Flemish one and an overall more positive Dutch one. This is also
noticeable in the small mutual differences between the total scores of each group, 3.77 and
3.86 for the Dutch speech samples along with 4.15 and 4.31 for the Flemish speakers.
4.1.2.3 Comparison and interpretation
After discussing the results for the native and non-native speakers’ social attractiveness
separately, this section will be devoted to an analysis of these results for the total number
of seven speech samples as a whole. The figures concerning social attractiveness of all
seven speakers are reflected in Table 7:
59

Personality traits RP AmE IrE
FlemE (s)
FlemE (b)
DutchE(s)
DutchE(b)
“friendly” 3.00 3.38 4.38 4.14 4.14 3.50 3.19 “polite” 1.82 3.08 3.43 3.00 4.07 3.44 3.56 “likeable” 3.47 3.69 4.14 4.55 3.79 3.69 3.56 “sense of humour” 5.94 5.46 5.62 6.18 5.29 4.88 4.56 “sociable” 4.35 4.15 4.38 5.36 4.71 3.94 3.94 “introvert” 3.06 4.08 3.76 2.64 2.92 3.75 3.81 TOTAL ‘social attractiveness’
3.60 3.97 4.29 4.31 4.15 3.86 3.77
Table 7: The native and non-native speakers’ social attractiveness as perceived by the informants.
It seems, when looking at the figures for all seven accents together, that some adjustments
have to be made to the patterns that were found when splitting up the results in a native and
a non-native group. In what follows, some general findings are expressed.
First, it can be seen in Table 7 that the RP-speaker is not only perceived the
friendliest, the most polite and the most likeable compared with the other native speakers,
he maintains these positive ratings when the non-native speech samples are taken in as
well. Especially when it comes to politeness, the RP-speaker clearly stands out from all the
other speakers (with a mean score of 1.82). This could possibly be related to the idea that
an RP accent will be more associated with situations where it is important to be polite,
since this is the pronunciation used by British royalty and upper classes as well as the
model aimed at in school. Such associations with formal contexts will not be made for the
other accents.
Second, this means that the broadly accented Dutch speaker loses his top position
that he had within the non-native group on the characteristics friendliness and likeability to
the RP-speaker, but he remains the favourite when it comes to sense of humour and
sociability and this counts for the whole group of seven speakers. These are the same two
characteristics for which the American speaker was rated the highest compared with the
other two native accents, but it thus seems that when the whole group of accents is
considered the American speaker is perceived less humorous and less sociable than the
Dutch speakers. It is clearly noticeable that these two traits stand out from the other four
social attractiveness-reflecting characteristics, because they received on the whole, for all
speakers, rather negative ratings of the informants, with figures never below a mean score
of 3.94. Although it can be seen that the two Dutch speakers are thought to be the most
humorous and sociable of all seven speakers, even they were rated rather negatively.
60

However, there is a clear gap between the mean scores for the Dutch speakers and those
for all other speakers on these traits, the latter being much more negative.
The reason why the Dutch speakers are considered more humorous and sociable can be
linked to the stereotypes surrounding these people, especially among Flemings. In
Flanders, the northern neighbours are typically described as more spontaneous and
extraverted, which could explain why they are in the present experiment rated most
positively on traits that underlie these stereotypes. Moreover, especially for the Dutch
speaker with a broad accent, some links can be seen with the results for the politeness and
“introvert” traits, on which this speaker was evaluated rather negatively. Being associated
with a high degree of sociability and sense of humour seems to go together, according to
the informants, with a low degree of politeness and ‘introvertiveness’, which actually does
make sense. A very sociable person is not likely to have an introverted character. As for
the low degree of politeness, this also could refer to the stereotypical idea of the Dutchman
as a ‘blabbermouth’, always saying what s/he thinks with perhaps too little concern for the
consequences. This association between sociability and sense of humour versus politeness
and ‘introvertiveness’ is not so clear for the other Dutch speaker, probably because of the
poor results this speech sample received with regard to correctness rates (cf. Table 1)
which makes it difficult for the informants to base their evaluations on knowledge of the
stereotypical views on the speaker residing in the speech community.
Further, some of the ratings for the slightly accented Flemish speaker deserve to be
mentioned here. He received the highest ratings on ‘introvertiveness’ of all seven speakers
whereas on the characteristics likeability, sense of humour and sociability he was
perceived the least favourable. In order to suggest an interpretation of these figures, it has
to be mentioned that that this speaker read the text passage exceptionally slowly and
perhaps a little too articulated compared to the other speakers. Some of the informants
indicated during the experiment that they found this irritating which could explain the
negative ratings for likeability and sense of humour.
When it comes to the favourable ratings for the “introvert” trait, two possible reasons can
be given. On the one hand, taking into account that the other Flemish speaker was
perceived as the second most introverted person, this positive rating could refer to the
stereotypical idea of Flemings as reserved and modest people, particularly compared to the
stereotypical loud and extraverted Dutchman. This assumption is enhanced when
considering the results only for the non-native accents: the Flemish speakers score the
highest and the Dutch speakers the lowest on this trait. On the other hand, another possible
61

reason for the slightly accented Dutch speaker to be perceived the most introverted person
can be related to his RP-like pronunciation. After the high ratings for the Flemish speakers
on this trait, it is the RP-speaker who is next with a mean score of 3.06. Moreover, within
his own native group, the RP-speaker even received the most positive ratings for this
“introvert” characteristic. This association between an RP-accent and ‘introvertiveness’
can perhaps be linked to the results for the politeness trait, referring both to the cliché of
‘the stiff upper lip’ and the stereotypical Brit who is perceived to be polite and reserved in
every situation. The RP-like pronunciation of the Flemish speaker with a slight accent can
thus be associated to some extent with the same stereotypes, since this speaker also has
high ratings on politeness and ‘introvertiveness’. In this context, it should also be noted
that both the RP and the slight Flemish English speech samples – and thus not only the
latter – lasted about half a minute longer than the other five test tapes. This idiosyncratic
feature has to be kept in mind when similarities are found in the results for these two
speakers.
Not much can be said for the perceived social attractiveness of the American and
Irish speakers when their mean scores on the six personality traits are compared to the
mean scores of the five remaining speech samples. From the total scores it can be deduced
that they are on the whole perceived rather negatively on the social attractiveness
dimension, but is difficult to try to give an explanation for these results since, as has
already been mentioned, almost none of the respondents who rated their speech samples
were able to recognise the nationality of the speakers as American and Irish. Therefore,
informants could only base themselves on intrinsic linguistic factors to evaluate the
personality of the speakers. A possible reason, then, for the more negative total score for
the Irish speaker than the American one could be that the informants’ judgement was
influenced by the exceptionally fast reading rate of the Irish speaker compared to the other
speakers.
Overall, the ratings for these six social attractiveness-reflecting traits seem to be divided in
three groups or patterns: one containing the first three characteristics friendliness,
politeness and likeability on which the RP-speaker is rated most favourably, a second one
for the sociability and sense of humour traits which showed the highest ratings for the two
Dutch speakers, especially so for the one with the more pronounced accent, and finally, a
third pattern can be discerned for the last characteristic, “introvert”, for which the Flemish
speaker with a slight accent was given the most positive evaluation.
62

According to the final scores it is the RP-speaker who is on the whole perceived the
most socially attractive whereas the slightly accented Flemish speaker is believed to have
the least socially attractive qualities.
63

4.1.3 The personal integrity dimension
A third group of personality traits on which the informants were asked to evaluate the tape-
recorded speaker in question were the ones related to the speakers’ personal integrity.
The questionnaire contained five characteristics that were thought to underlie this
dimension in the speakers’ personality, viz. “honest”, “tolerant”, “trustworthy”, “modest”
and “open-minded”. The technique that was used to measure the evaluations remained
unchanged, meaning that informants were asked to rate these personality traits on a seven-
point rating scale with the more favourable ratings represented by the lower figures.
In what follows, the results for perceived personal integrity of the native speakers will be
dealt with in a first part, followed by a second part on the degree of personal integrity
attributed to the non-native speakers and, finally, in a third part this dimension will be
looked at for all seven speech samples combined.
4.1.3.1 The native English speakers
Table 8 indicates the evaluations of the respondents on the five characteristics pertaining to
the native English speakers’ personal integrity.
Personality traits RP AmE IrE “honest” 2.88 2.50 2.90 “tolerant” 3.24 3.54 3.95 “trustworthy” 2.71 3.46 3.38 “modest” 3.94 3.62 4.38 “open-minded” 3.12 3.46 4.00 TOTAL ‘personal integrity’ 3.18 3.32 3.72 Table 8: The native speakers’ personal integrity as rated by the informants.
It seems that the most favourable ratings on the personal integrity dimension are divided
relatively equally among the RP-speaker and the American speaker. The former was
perceived the most tolerant, trustworthy and open-minded, whereas the latter received the
most positive ratings for honesty and modesty.
However, it seems important to mention that often only slight differences were found
between the mean scores for these two speakers. This is especially the case for the
speakers’ honesty, tolerance and open-mindedness. Thus, when contemplating the more
positive ratings for either the American or RP accent on one of these characteristics, it
64

should be taken into account that this superior position is only obtained by a means of a
small difference.
The Irish speaker was related to the most negative ratings on almost all personality traits.
He was evaluated as the least honest, tolerant, modest and open-minded of all three native
English speakers. Only with regard to perceived trustworthiness the American speaker was
viewed most unfavourably – although the difference with the mean score for the Irish
speaker on this trait is minimal. Moreover, it is also on the trustworthiness characteristic
that the RP-speaker clearly distinguishes himself from the other two native English
speakers with a very positive mean score of 2.71.
Furthermore, some attention must be drawn to the “honesty” characteristic included in
Table 8. Although the American speaker was evaluated most favourably for this trait, it
seems worth mentioning that the mean scores for the perceived honesty of all three native
speakers are relatively positive, especially when compared with the mean scores for the
other personal integrity-reflecting traits.
On the whole, the total scores indicate that the RP-speaker is related to the highest degree
of personal integrity, closely followed by the American speaker and with the Irish speaker
in last position. This same hierarchy was found when it comes to the results for the native
English speakers on the social attractiveness dimension.
4.1.3.2 The non-native English speakers
After the analysis of the results for the degree of personal integrity attributed to the native
English speakers, some general findings concerning the evaluations of the non-native
English speakers on the personal integrity dimension will be described. Table 9 gives an
overview of these ratings for the non-native English speakers:
Personality traits FlemE (s) FlemE (b) DutchE (s) DutchE (b) “honest” 3.00 3.77 4.63 3.88 “tolerant” 3.77 3.93 3.50 4.00 “trustworthy” 3.50 4.07 3.25 4.00 “modest” 3.68 2.85 4.13 4.75 “open-minded” 4.14 4.29 4.06 3.81 TOTAL ‘personal integrity’ 3.62 3.78 3.91 4.09 Table 9: The non-native speakers’ personal integrity as perceived by the informants.
65

The results as shown in Table 9 seem quite consistent along two of the characteristics, viz.
tolerance and trustworthiness. For each of these two traits the first position is always
occupied by the Dutch speaker with a slight accent, followed by the slightly accented
Flemish speaker and with the two non-native speakers speaking with a more pronounced
foreign accent at the bottom positions. However, for the three remaining characteristics this
pattern can not be discerned. Therefore, it seems necessary to treat these three personality
traits separately for the analysis of the results.
The mean scores for the first included trait, i.e. honesty, show that the most positive ratings
were assigned to the two Flemish speakers as opposed to more negative ratings for both
Dutch speakers. Looking at the mean scores for each speaker individually, however, it
appears that the slightly accented Flemish speaker was clearly evaluated as having the
highest degree of honesty, whereas the broadly accented Dutch speaker was perceived as
the least honest person.
When it comes to modesty, the most favourable rating was attributed the broad Flemish
speech sample. This speaker seemed to be perceived as a particular modest person, since
the mean score of 2.85 forms a big gap with the other mean scores for this trait. As was
seen for the speakers’ honesty, it is also with regard to their modesty that the two Flemish
speakers received more favourable evaluations than the two Dutch speech samples.
Finally, on the characteristic open-mindedness it is the broadly accented Dutch speaker
who obtained the most favourable ratings, followed by a more negative mean score for the
other Dutch speaker. The two Flemish speech samples show only a minimal difference in
mean scores for this trait and are both generally viewed the least open-minded. Thus, for
the last included personality trait underlying the speakers’ personal integrity, it is the two
Dutch speakers who have a superior position.
Overall, three patterns of evaluation have been discussed for the results shown in Table 9:
one which includes the most positive ratings for the slightly accented non-native speakers
(concerning the tolerance and trustworthiness characteristics), a second one which
indicated more favourable mean scores for the Flemish speakers as opposed to the Dutch
speech samples (regarding the honesty and modesty traits) and, finally, a third pattern was
found showing a superior position for the Dutch speakers and a minor position for the
Flemish speakers (concerning the speakers’ open-mindedness).
It seems that that the second pattern outweighs the other two perceived patterns when
consulting the total scores for the personal integrity dimension.
66

4.1.3.3 Comparison and interpretation
Several suggestions will now be made for the interpretation of some of the previous stated
results for the personal integrity dimension. In addition, some attention will be drawn to
the analysis of the data for all speech samples on this dimension as shown in Table 10:
Personality traits RP AmE IrE FlemE
(s) FlemE
(b) DutchE
(s) DutchE
(b) “honest” 2.88 2.50 2.90 3.00 3.77 4.63 3.88 “tolerant” 3.24 3.54 3.95 3.77 3.93 3.50 4.00 “trustworthy” 2.71 3.46 3.38 3.50 4.07 3.25 4.00 “modest” 3.94 3.62 4.38 3.68 2.85 4.13 4.75 “open-minded” 3.12 3.46 4.00 4.14 4.29 4.06 3.81 TOTAL ‘personal integrity’
3.18 3.32 3.72 3.62 3.78 3.91 4.09
Table 10: The native and non-native speakers’ personal integrity as perceived by the informants.
It proves quite difficult to find a clear and consistent pattern in the figures presented in
Table 10 if the mean scores for the five characteristics are regarded individually – as
opposed to just analysing the total scores. It seems that, when looking at the native and
non-native group of accents separately, it is easier to make some remarks on the mutual
relations between the various mean scores. However, some ratings do seem to stand out in
Table 10.
This is especially the case, for example, for the modesty trait. The two broad non-
native accents account for the highest as well as the lowest score on this characteristic and,
moreover, the gap between these two mean scores is quite large. To be more specific, it is
the broadly accented Flemish speaker that is generally perceived to be very modest (with a
mean score of 2.85) whereas the broadly accented Dutch speaker is viewed as absolutely
not modest (having a mean score of 4.75). In order to interpret these ratings, they can
perhaps be related to the findings for the same speakers’ ‘introvertiveness’ and politeness
(personality traits that reflect social attractiveness) as discussed in 4.1.2. After all, being
polite, modest and introverted are all characteristics that seem to share the same qualities.
Therefore, it can be said that the same stereotypical range of thoughts that was assumed to
underlie the ratings for the two mentioned social attractiveness-relating traits, could also be
applied to explain the ratings for the speakers’ modesty. In other words, the informants
probably perceived the Flemish speaker (especially the one with the broad accent, since
this is the one with the highest correctness rates of both Flemish speakers) as being a
modest person because of the preconceived idea of Flemings as generally reserved and
67

quiet people. As for the Dutch speaker (again, the one with the broad accent shows the
clearest evaluations because of the fact that the majority of the informants who rated this
speaker recognised him as being a Dutchman. The same can not be said for the other Dutch
speaker), the associations with the stereotypical extraverted Dutchman can be said to
account for the highly negative rating he received for the modesty characteristic.
Another personality trait included in Table 10 that needs to be discussed is honesty.
Taking all seven speech samples into account, it is the American speaker who is perceived
the most honest, closely followed by the other native speakers. The non-native speakers, all
having more negative mean scores for this trait than the native speakers, are then perceived
as less honest, with the slightly accented Dutch speaker having the lowest score. Within the
group of non-native accents, the Flemish speakers received higher ratings than the Dutch
speakers when it comes to the speakers’ honesty. The reason why the latter were attributed
the lowest ratings for this traits is perhaps the underlying negative perception of Dutchmen
as being ‘brutally honest’, saying what is on their mind without considering that people
might get hurt in the process. Therefore, it seems that this negative rating can be linked
with the negative rating for the Dutch speakers’ modesty, since both ratings could possibly
be explained by the same stereotypes. However, it is very important to keep in mind that
these offered interpretations are highly tentative and should not be considered as
irrefutable.
A last mean score that catches the eye whilst contemplating the ratings for all seven
speech samples, is the highly positive mean score of 2.71 for the RP-speaker’s evaluated
trustworthiness. He is thus perceived to be the most trustworthy person, not only compared
with the other native speakers but also when the whole group of speech samples is taken
into account. Additionally, it seems worth mentioning here that this same speaker is also
regarded the most tolerant and open-minded of all native and non-native speakers. Thus,
with regard to the most favourable ratings for these three characteristics, viz.
trustworthiness, tolerance and open-mindedness, the results that were found for only the
native accents remain accurate if the results of the non-native accents are considered as
well.
The fact that the RP-speaker was perceived most favourably on three of the five included
personal integrity-reflecting traits, which gives him the most positive rating on the personal
integrity dimension as a whole, does not correspond to previous findings for the
evaluations of an RP accent. Holmes (2001: 350), for example, stated that it is most
common for an RP accent to be highly evaluated on the status dimension because of
68

associations with a high level of education and high status jobs, but, when it comes to the
solidarity dimension, it is usually the non-standard native English accents that score the
highest. Moreover, the Flemish study by Botterman (1995) – that, among other accents,
also elicited attitudes towards RP, American and Irish accents – found positive evaluations
for the Irish accent on the personal integrity dimension. This would mean for the present
study that the Irish speech sample should have more favourable ratings than the RP speech
sample when it comes to social attractiveness and personal integrity. However, a hierarchy
that deviates from this pattern was found for the three native English accents for the results
of both these dimensions, viz. with the RP-speaker in a superior position, followed by the
American speaker and in each case with the Irish speaker downgraded the most on almost
all individual traits.
One could wonder here why the Irish speech sample used in this study was associated with
such negative attitudes towards the speaker’s personal integrity, when earlier research –
British studies as well a Flemish one – have indicated the opposite result. It seems that,
once more, the only valuable explanation should be linked with the low correctness rates
for this accent. Since very few informants knew which accent it was they were rating, they
could hardly be familiar with the positive associations regarding social attractiveness and
personal integrity that are usually surrounding it, which makes it not surprising that the
evaluations of this speech sample do not fit within a logical pattern. As mentioned before,
they probably based themselves on the fast reading rate of the speaker to attribute him with
negative ratings.
Furthermore, it seems that, until now, the RP-speaker is rated most favourably by the
informants on all three personality dimensions so far discussed. He is thus not only
perceived the most intelligent and competent person but also the friendliest, the most
likeable (social attractiveness), tolerant and trustworthy (personal integrity). A possible
explanation for the positive ratings on the solidarity dimensions is difficult, as these results
deviate from previous found evaluation patterns of an RP accent. Possibly, the speaker
idiosyncrasies account for some of these positive evaluations, as the voice of the RP-
speaker was overall rated the most beautiful and pleasant. Moreover, these results can also
be looked at in a juxtaposing way, i.e. by saying that this speaker is rated more positive
than the other accents. In this sense, it is not necessary to give explanations for the positive
ratings as such, but it is sufficient to conclude that the informants clearly think that using a
standard native English accents reflects most positively on your personality in almost every
sense – as opposed to using, for example, a foreign accent.
69

4.1.4 The social status dimension
The last three personality traits that were included in the questionnaire which have not
been discussed so far are seen to reflect the speakers’ social status. These are:
“authoritative”, “rich” and “educated”. Apart from evaluating three characteristics on a
seven-point rating scale, the informants were also asked to evaluate the speakers’ social
status by means of choosing between three possibilities – i.e. lower, middle or higher class
– offered in a direct multiple choice question. Thus, the results for this dimension will be
analysed by looking at the mean scores for three personality traits on the one hand and by
referring to the views on the speakers’ social class as elicited from the multiple choice
question on the other hand.
Results for the native and non-native speech samples will first be analysed separately
before going into the elicited evaluations of all seven speech samples as a whole.
4.1.4.1 The native English speakers
In order to analyse the results for the elicited social status of the native speakers, an
overview of the mean scores for the three personality traits that were believed to reflect a
person’s social status is shown in Table 11:
Personality traits RP AmE IrE “authoritative” 3.65 4.15 3.71 “rich” 3.24 3.92 3.86 “educated” 1.53 2.46 2.33 TOTAL ‘social status’ 2.80 3.51 3.30 Table 11: The native speakers’ social status as perceived by the informants.
A high degree of consistency can be found in these figures, because for all three
characteristics the same continuum of accents seems to be apparent. The RP-speaker was
perceived as the most authoritative, educated and the richest, the Irish speaker occupies the
second place on the continuum and the American speaker is related to the lowest degree of
social status as measured by the mean scores for the three characteristics presented in
Table 11. It seems worth mentioning here that the same hierarchy of native accents was
found for the competence dimension.
The most positive ratings can be seen for the speakers’ perceived ‘educatedness’. All three
native speakers were evaluated as being highly educated, but there is a clear gap between
70

the mean score of 1.53 for the RP-speaker and the ratings of 2.33 and 2.46 for the Irish and
American speaker respectively. As for the richness trait, the RP-speaker was also perceived
most favourably, although this time, only small difference exist between the three
measured mean scores. The most negative figure that can be seen in Table 11 is the mean
score of 4.15 for the American speaker’s alleged authority. The RP-speaker as well as the
Irish speech sample were attributed with more positive mean scores for “authoritative”,
although, again, the former received a slightly more favourable rating than the latter.
In order to find out whether the American speaker was also downgraded the most when it
comes to the social class he was assumed to belong to, the results that were obtained
concerning the native speakers’ social class will now be discussed. As already mentioned
earlier, the questionnaire contained a multiple choice question which required the
informants to indicate the alleged social class of the speaker, i.e. lower, middle or higher
class. Table 12 shows the results for the perceived social class of the native speakers, with
every figure presenting the number of informants (expressed in percentage) assigning each
of the native speakers to a specific social class.
Social class RP AmE IrE Higher class 76,5 25 28,6 Middle class 23,5 75 71,4 Lower class 0 0 0 Table 12: The native speakers’ social class as perceived by the informants.
The continuum of accents that was perceived for the results of the natives speakers’ social
status seems to be confirmed when consulting the results for the native speakers’ social
class. The RP-speaker obtained a strikingly high degree of social class, with no less than
76,5 % of the informants assigning him to the higher social class. Furthermore, a minority
of 23,5 % agreed that this speaker was a member of the middle social class.
As for the perceived social class of the American and Irish speaker, an opposite
arrangement appears to be noticeable, since each of these speakers were assumed to have a
higher class position by the minority of respondents whereas a convincing majority ticked
the ‘middle class’-box for the social class of these speakers. Although the difference
between these two speakers’ social class is relatively negligible, the American speaker was
somewhat more related to the middle social class than the Irish speaker. Therefore, a
similar hierarchy can be found for the native speakers social status and social class, viz.
71

with the RP-speaker having a strong first position, followed by the more negatively
evaluated Irish and American speakers.
Remarkably, not one of the informants who were asked to rate the native accents placed
these speakers in the lower social class. This indicates that the informants had a tendency
to attribute a relatively high social class to all native speakers, although the RP-speaker
was obviously perceived to have the highest social position.
4.1.4.2 The non-native English speakers
In this section, a closer look will be taken at the social status and social class assigned to
the various non-native speech samples. First, the results for the three personality traits
reflecting the non speakers’ social status will be described. An overview of these results
can be seen in Table 13:
Personality traits FlemE (s) FlemE (b) DutchE (s) DutchE (b) “authoritative” 4.45 5.36 4.00 4.75 “rich” 3.05 4.14 3.69 3.44 “educated” 2.27 3.57 2.63 3.13 TOTAL ‘social status’ 3.26 4.36 3.44 3.77 Table 13: The non-native speakers’ social status as perceived by the informants.
The results for the assessed social status of the non-native speakers does not seem to form
a consistent pattern – as was found for the social status of the native speakers. However,
some general remarks can be made when considering the mean scores presented in Table
13.
Similarities can be found, for example, between the results for the “authoritative” trait and
the “educated” characteristic. To be more specific, it appears that the slightly accented
speakers received more positive mean scores for each of these characteristics than the
broadly accented speakers. With regard to the perceived authority, it can be seen that all
non-native speakers are rated rather negatively, but that there is considerable difference
between the most favourable rating for the slightly accented Dutch speaker (with a mean
score of 4.00) and the least favourable one for the broadly accented Flemish speaker (with
a mean score of 5.36). As for the attributed ‘educatedness’ there is again a noticeable
discrepancy between the assessments for the non-native speakers with only a slight
Flemish or Dutch English accent and the ratings for the non-native speakers with a more
72

pronounced foreign accent. Once more, the former were perceived more favourably (with
highly positive mean scores of 2.27 and 2.63) than the latter (with more negative mean
scores of 3.13 and 3.57).
However, as far as the perceived ‘richness’ is concerned, the results do not fit the pattern
that was described for the other two social status-reflecting personality traits. The
informants evaluated the slightly accented Flemish speaker as the most wealthy person,
followed by the two Dutch speakers and with the broadly accented Flemish speaker as the
allegedly least wealthy person.
What does seem consistent for all the ratings for the social status dimension combined, is
that the Flemish speaker with a pronounced foreign accent was perceived least favourably
concerning all three traits. This is also reflected in the negative total score of 4.36 for this
speaker.
As was done earlier for the analysis of the native speakers’ evaluated social status, a
comparison will be made between the analysis of the results for the three included
characteristics and the obtained answers on the multiple choice question asking the
informants to identify the speakers’ social class. An overview of the perceived social class
of the non-native speakers is shown in Table 14 (again, with each figure representing the
percentage of informants attributing a particular social class to each of the speakers).
Social class FlemE (s) FlemE (b) DutchE (s) DutchE (b) Higher class 45,5 7,1 26,7 37,4 Middle class 50 85,8 66,7 56,3 Lower class 4,5 7,1 6,6 6,3 Table 14: The non-native speakers’ social class as perceived by the informants.
Concerning the broadly accented Flemish speaker, there seems to be a consistency between
the perceived social status and the attributed social class. He was perceived least
favourably in terms of social status and, apparently, the informants also believed he was
least likely to be a member of the higher social class. Only a meagre 7,1 % of the
respondents assigned this speaker to the higher social class. Additionally, 85,8 % of the
informants placed this Flemish speaker in the middle social class, which is the most
convincing majority of all the percentages presented for the perceived middle social class
of the four non-native speakers.
73

Furthermore, the speaker who was perceived to have the highest social class of all non-
native speech samples was the slightly accented Flemish speaker. A strong minority of
45,5 % placed him in the high social class, although a faintly larger percentage of
informants indicated him as belonging to the middle social class (50 %). This correlates
with the same speaker’s highly perceived ‘educatedness’ and richness.
The two Dutch speakers’ assessed social class seems to have an intermediary position
between the results for the social class of the two Flemish speakers. In other words, they
were both assigned to the higher social class by a minority of the informants, but this
minority is somewhat larger than the one for the broadly accented Flemish speaker on the
one hand and smaller than the one for the slightly accented Flemish speaker on the other
hand. Moreover, the Dutch speakers are perceived by more than half of the informants as
being a member of the middle social class. When comparing these evaluations of the Dutch
speakers’ social class with the results for their perceived social status, some inconsistencies
seem to exist. The previous stated pattern for the non-native speakers’ social status –
indicating that the slightly accented speakers were perceived the most favourable in terms
of social status – appears only to hold true for the slightly accented Flemish speaker, who
was also assigned with the highest social position, as shown in Table 14. However, the
slightly accented Dutch speaker, who received a similar positive rating concerning
‘educatedness’ and richness than the speaker with a slight Flemish accent, seems to be
more associated with the middle social class. Moreover, a higher percentage of informants
related the broadly accented Dutch speaker to the higher social class, although the
difference with the other Dutch speaker is only minimal (37,5 % for the broadly accented
Dutch speaker and 26,7 % for the slightly accented Dutch speaker).
Only small percentages can be seen for the speakers’ alleged lower social class. However,
they seem to confirm the continuum that has been discussed so far, viz. the slightly
accented Flemish speaker the least associated with the lower class, the Dutch speakers take
an intermediary position and the broadly accented Flemish speaker seems to be assigned to
the lower social class the most.
4.1.4.3 Comparison and interpretation
The results for the native and non-native speakers that have been discussed separately
above, will now be juxtaposed and some tentative interpretations will be suggested for the
74
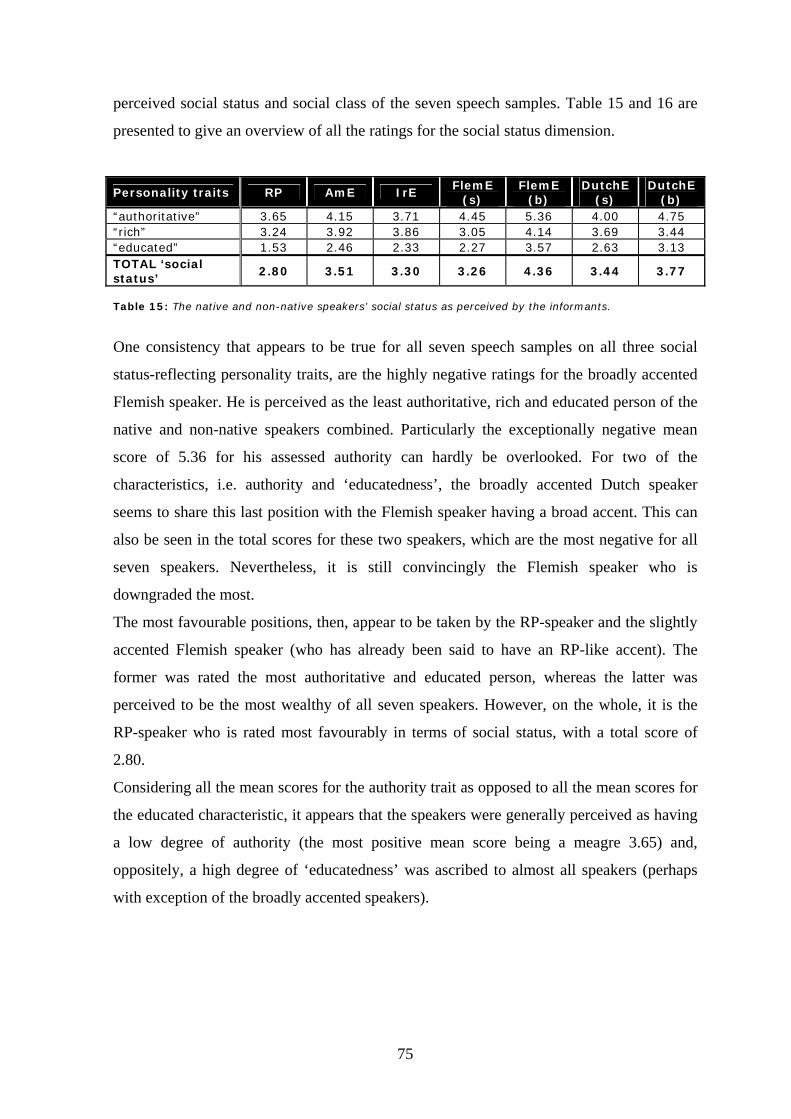
perceived social status and social class of the seven speech samples. Table 15 and 16 are
presented to give an overview of all the ratings for the social status dimension.
Personality traits RP AmE IrE FlemE
(s) FlemE
(b) DutchE
(s) DutchE
(b) “authoritative” 3.65 4.15 3.71 4.45 5.36 4.00 4.75 “rich” 3.24 3.92 3.86 3.05 4.14 3.69 3.44 “educated” 1.53 2.46 2.33 2.27 3.57 2.63 3.13 TOTAL ‘social status’
2.80 3.51 3.30 3.26 4.36 3.44 3.77
Table 15: The native and non-native speakers’ social status as perceived by the informants.
One consistency that appears to be true for all seven speech samples on all three social
status-reflecting personality traits, are the highly negative ratings for the broadly accented
Flemish speaker. He is perceived as the least authoritative, rich and educated person of the
native and non-native speakers combined. Particularly the exceptionally negative mean
score of 5.36 for his assessed authority can hardly be overlooked. For two of the
characteristics, i.e. authority and ‘educatedness’, the broadly accented Dutch speaker
seems to share this last position with the Flemish speaker having a broad accent. This can
also be seen in the total scores for these two speakers, which are the most negative for all
seven speakers. Nevertheless, it is still convincingly the Flemish speaker who is
downgraded the most.
The most favourable positions, then, appear to be taken by the RP-speaker and the slightly
accented Flemish speaker (who has already been said to have an RP-like accent). The
former was rated the most authoritative and educated person, whereas the latter was
perceived to be the most wealthy of all seven speakers. However, on the whole, it is the
RP-speaker who is rated most favourably in terms of social status, with a total score of
2.80.
Considering all the mean scores for the authority trait as opposed to all the mean scores for
the educated characteristic, it appears that the speakers were generally perceived as having
a low degree of authority (the most positive mean score being a meagre 3.65) and,
oppositely, a high degree of ‘educatedness’ was ascribed to almost all speakers (perhaps
with exception of the broadly accented speakers).
75

Social class RP AmE IrE FlemE
(s) FlemE
(b) DutchE
(s) DutchE
(b) Higher class 76,5 25 28,6 45,5 7,1 26,7 37,4 Middle class 23,5 75 71,4 50 85,8 66,7 56,3 Lower class 0 0 0 4,5 7,1 6,6 6,3 Table 16: The native and non-native speakers’ social class as perceived by the informants.
The most persistent findings for the speakers’ social status stated above are also reflected
in the speakers’ assessed social class (cf. Table 16).
First, the broadly accented Flemish speaker is the least associated with a higher social class
as well as the most assigned to the middle social class of all seven speech samples.
Moreover, a very small minority of 7,1 % believed he was a member of the lower class,
which appears to be the largest percentage for this class for all speakers. This correlates
with his least favourable position concerning the three personality traits reflecting social
status.
Second, both the RP-speaker and the slightly accented Flemish speaker seem to be the
most attributed to the higher social class. This corresponds to their top positions
concerning their assessed authority, richness and ‘educatedness’. However, a clear
advantage can be detected for the RP-speaker, who is the only one that was placed in the
higher social class by the majority of the informants. The same superior position was found
for this speaker regarding the social status ratings.
Additionally, a remark can be made for the results of the speakers’ attributed social class
that does not seem to fit with the results for the social status-reflecting characteristics. That
is to say, it appears that the non-native speakers were as a whole more associated with the
lower social class than the native speakers. Although this only concerns very small
minorities, it seems striking that none of the informants who were asked to rate the native
speakers felt that the lower class was applicable to these speakers.
Apparently, to some extent, a link can be made between the results for the competence
dimension and the findings for the social status dimension. This connection will be kept in
mind when offering some general explanations for the results that were found for the
speakers’ social status.
First of all, it became clear that the RP-speaker was evaluated most favourably in
terms of social status, not only within the group of native speakers, but also when all
speech samples were considered. Exactly the same result was found for the competence
dimension. It appears, thus, that the informants regarded someone with an RP accent as
76

being most intelligent, competent, self-confident, suitable for leadership (the competence-
reflecting traits) as well as having the most authority and being the most educated (the
social status-reflecting traits) of all speakers. Presumably, the same underlying
assumptions about an RP accent underlie these findings, viz. the importance of this way of
speaking in education. This is also what Botterman (1995: 57,59) refers to when she tries
to explain the high rating on prestige and social class that was found for the RP speech
sample in her study. She assumes that it is the teachers who make the pupils aware of the
high status position of an RP accent while at the same time they discourage the use of other
varieties of English. This could give a reasonable explanation for the favourable
evaluations of the RP-speaker and the less favourable evaluations of all other speakers in
terms of social status. Furthermore, some associations with British films which often
portray the lives of upper class people could account for the majority of informants
assigning the RP-speaker to the higher social class (Botterman 1995: 60).
The Irish and American speakers were both in terms of competence and social
status perceived more negatively than the RP-speaker. Moreover, although there often
were only slight differences between their obtained mean scores, it was the Irish speaker
who was generally rated more favourably than the American speaker. As has been
mentioned for their perceived competence, it is difficult to link these ratings to certain
assumptions about American and Irish speakers, since low correctness rates were found for
both speech samples (cf. Table 1). However, it can be said that informants did seem to
recognise these accents as deviations from the RP-norm, which is indicated by the more
negative evaluations of these speakers on traits reflecting social status and competence.
As for the non-native speakers, particularly the ratings for the slight Flemish
English speech sample and the broad Flemish English speech sample caught the eye. The
former was perceived most favourably within the group of non-native speakers both on
competence and on social status characteristics, whereas the opposite was true for the
latter, i.e. the broadly accented Flemish speaker was perceived the least favourable on the
same traits. Furthermore, the results for both personality dimensions showed that the
slightly accented speakers generally elicited more positive attitudes than the broadly
accented speakers. Therefore, it seems that informants considered that speaking with a
foreign accent is reserved for people who are not competent and have a low social status.
Specifically the speech sample that contained the broadly accented Flemish speaker
appeared to arouse these unfavourable reactions among the informants. This can be
explained by the fact that the informants are probably more exposed to a Flemish English
77
accent than a Dutch English one (since they were Flemings themselves). Because the
ratings for the competence dimension and the social status dimension are so similar, the
same underlying thoughts or assumptions can be applied for the interpretation of these
results. Again, it is thought that stressing an RP-like pronunciation in education could
result in overall negative attitudes towards any accent that deviates from this presumed
‘correct’ way of speaking. This is especially clear when contemplating the overall more
negative reactions to the more pronounced non-native accents as well as the more
favourable ratings for the non-native speakers with only a slight foreign accent.
Furthermore, it appeared that the native speakers as a whole were perceived as having a
higher degree of competence (looking at the total scores for the competence dimension)
and, moreover, none of them were assigned to the lower social class. This could possibly
point to the underlying idea that any native accent is preferred over a non-native accent,
although it should be said that this is a highly tentative assumption based on only a small
amount of data.
Additionally, some remarks ought to be made for the results of the evaluation of the
slightly accented Flemish speaker. He was seen to be assigned to the higher social class by
a relatively large minority of the informants, and, moreover, he received very positive
ratings for his perceived richness – for which he even received the highest rating of all
speakers – and ‘educatedness’, giving him a second position concerning the social status
dimension (after the RP-speaker). These findings could indicate that informants based
themselves for this positive evaluation of social status on the RP-like features in his
pronunciation. However, the similarities that have been found so far between the results for
the social status dimension and the ones for the competence dimension do not seem to be
entirely applicable for this speaker. Apparently, the informants were not so much guided
by his RP-like pronunciation when evaluating him for the competence-reflecting
characteristics, since the total score of 3.82 for this dimension sets him far apart from the
most favourable total score of 2.76 for the RP-speaker. This inconsistency can be
explained, once more, by the low correctness rates for the slightly accented Flemish
speaker. Table 1 shows that 63,6 % of the respondents who were asked to rate this speech
sample thought that they were listening to a person from England, which could account for
the high ratings on the social status dimension. However, a large minority did not think he
was English and therefore did not make any assumption with English speakers when
evaluating his speech. This group could possibly have based itself more on the slow
78

reading rate of this speaker, which could then account for the negative results on the
competence dimension.
Finally, what seems most important to keep in mind is that, again, the three speech
samples showing the most consistent and clear attitudes, i.e. the RP accent and the two
broad non-native ones, are the ones with the highest degree of familiarity among the
informants. The same was found for the competence dimension.
79

4.2. The speech scales
As it is generally believed that the evaluation of a speaker’s personality is closely related to
the evaluation of the accent of that speaker, it was deemed interesting to add a second type
of seven-point rating scales in this study, in order to find out whether there existed a
correlation between the speakers’ assessed personality and their accents (Hiels 1996: 61).
These so-called speech scales aimed at eliciting the attitudes of the informants towards the
various native and non-native accents as such, as opposed to the previously analysed
personality scales that measured the attitudes towards the speakers as persons.
More specifically, the questionnaire that was used for the present experiment contained
four seven-point rating speech scales, again with the low numbers representing the
favourable end of the scale. These were divided in a status dimension and an aesthetic
dimension. Furthermore, two direct questions were added to elicit the respondents’
solidarity with the accents. This method to elicit the attitudes towards the accents was the
same for the previous experiments conducted by Botterman (1995) and Hiels (1996).
It should be noted here that the analysis for the native and non-native accents will be dealt
with separately for each dimension, as was done for the personality scales, before turning
to the results for all the accents as one group.
4.2.1 The status dimension
The questionnaire contained two characteristics that were believed to reflect the status
dimension of the speakers’ accent, viz. “educated” and “intelligible”. These characteristics
were two possible answers, presented as a seven-point rating scale, to a question asking the
informants how they perceived the accent of the speaker. The results for the other two
provided answers to this question will be discussed in a following section on the aesthetic
dimension.
In other words, concerning this dimension, the informants were asked whether they
thought the accent they had listened to sounded educated and whether it was intelligible to
them. Once more, the more favourable answers were represented by the lower numbers.
80

4.2.1.1 The native English accents
The elicited attitudes of the informants towards the native speakers’ accents in terms of
status will be described by means of analysing the mean scores that were attributed to these
speech samples on both included characteristics, ‘educatedness’ and intelligibility, as can
be seen in Table 17:
status characteristics RP AmE IrE “educated” 1.71 3.69 3.90 “intelligible” 2.65 2.31 3.38 Table 17: The status dimension of the native speakers’ accents as perceived by the informants.
There seems to be an exceptionally clear preference for RP in terms of ‘educatedness’,
with an impressive mean score of 1.71. The American and Irish accents were perceived
noticeably less favourably, with mean scores of 3.69 and 3.90 respectively. This result is to
a great extent in accordance with the findings for the attitudes towards the same speech
samples with regard to competence and social status.
As for the second included speech characteristic, the American accent appeared to be more
clearly understood by the informants than the RP speech sample. However, it can be seen
that RP received a highly positive rating on the intelligibility characteristic as well. The
more negative rating for the Irish accent forms a visible gap with these other two
favourable mean scores. It should be mentioned here that Botterman (1995: 68-71)
discovered almost exactly the same results for the status dimension of the RP, American
and Irish accents she investigated in her study.
Some suggestions for the interpretation of the results found for the native accents’
perceived status will be given in a separate section that takes into account all speech
samples used for the present experiment.
4.2.1.2 The non-native English accents
Before turning to some general conclusions, however, the results for the assessed status of
the non-native speech samples will by analysed first. The mean scores for the
‘educatedness’ and intelligibility of the non-native accents are shown in Table 18:
81

status characteristics
FlemE (s) FlemE (b) DutchE (s) DutchE (b)
“educated” 2.38 4.64 3.38 4.81 “intelligible” 2.59 4.71 3.44 5.13 Table 18: The status dimension of the non-native speakers’ accents as perceived by the informants.
The results for the perceived status of the various non-native accents can be analysed along
a perfectly consistent continuum. The slightly accented Flemish speaker was perceived to
have the most educated and intelligible accent, with highly positive mean scores of 2.38 for
‘educatedness’ and 2.59 for intelligibility. The other slight non-native accent occupies the
second position on the continuum with fairly positive ratings for the two speech
characteristics. Finally, the two more marked non-native accents were assessed as having
the lowest status, with the Dutch accent completely at the bottom. This latter accent
received highly negative ratings for both ‘educatedness’ and intelligibility (as can be seen
from the mean scores of 4.81 and 5.31).
It thus seems that the slight non-native accents were both associated with a much more
higher status than the broad non-native accents. This result corresponds to some extent
with the findings for the non-native speakers’ competence and social status. That is to say,
it was discovered that the informants evaluated the broadly accented speakers much more
unfavourably than the other non-native speakers in terms of their competence and social
status and especially the Flemish speaker with a pronounced foreign accent appeared to be
downgraded the most. The evaluations of the accents’ status, however, seem to show that
this bottom position is reserved for the broad Dutch accent.
4.2.1.3 Comparison and interpretation
After contemplating the status dimension of the native and non-native accents individually,
some attention will now be drawn to the way in which these results relate to each other.
Furthermore, some tentative explanations will be offered to clarify the obtained mean
scores. Table 19 represents an overview of the ratings for the status of all seven speech
samples:
82

status characteristics
RP AmE IrE FlemE
(s) FlemE
(b) DutchE
(s) DutchE
(b) “educated” 1.71 3.69 3.90 2.38 4.64 3.38 4.81 “intelligible” 2.65 2.31 3.38 2.59 4.71 3.44 5.13 Table 19: The status dimension of the native and non-native speakers’ accents as perceived by the
informants.
A slightly different pattern can be found for each of the two status-reflecting
characteristics.
As for the assessed ‘educatedness’ of the various accents, RP does not only appear
to be regarded the most favourable of the native accents, it was moreover overwhelmingly
perceived as the most educated speech sample when the non-native accents were taken into
account as well. Next in line is the slight Flemish accent, which was also attributed with a
highly positive mean score for its ‘educatedness’. The other slight non-native accent then
follows with a fairly favourable rating in terms of status. So far, it appears that the three
accents occupying the top of the hierarchy for ‘educatedness’ are the ones with a standard
or standard-like British pronunciation. The American and Irish accents take the fourth and
fifth position and, once more, the two broad non-native accents were associated with the
least favourable ratings, in this case with the broad Dutch accent in last position.
These findings for the assessment of the accents as such seem to correlate with the
attitudes towards some of the speaker’s personality traits. The RP-speaker was seen to have
a superior position concerning personality traits reflecting his competence and social status
and the broadly accented non-native speakers were evaluated least favourably on the same
traits. The high level of ‘educatedness’ in the slight Flemish accent, according to the
informants that is, can also be said to relate to his perceived high social status.
In a research by Giles conducted in 1970 (cf. 2.2.1), it was discovered that a group of
British secondary school children associated RP with the highest degree of prestige
compared to other foreign, regional and urban English accents. Just as Botterman (1995:
69) concludes for the perceived status of RP in her study, it can be derived from the above
discussed results that apparently an RP accent “elicits similar attitudes in Britain [than] in
Flanders”. Of course, it should be kept in mind that the present study only measured the
attitudes of 119 Flemish respondents and results can not be considered representative for
all Flemings.
As far as the high ‘educatedness’ of the slight Flemish accent is concerned, it seems
plausible, again, that this result was obtained due to the RP-like features of this accent. The
83

elicited lower prestige for the American and Irish accents can than be explained by their
deviate pronunciation from the highly prestigious RP-norm. This is especially the case for
the American accent, for, although it is a frequently occurring accent in the popular media,
the emphasis in education is still on RP. Finally, the same underlying assumptions that
were thought to clarify the low scores for the pronounced non-native speakers’ competence
and social status, can be applied for these accents’ low ‘educatedness’. In other words, a
high degree of foreignness in the pronunciation of English is generally downgraded in an
educational context, because it is associated with a insufficient knowledge of the
phonology and grammar of the language. That is probably why the broad non-native
speech samples were perceived as non-educated accents.
A somewhat different picture has to be drawn with regard to the second speech
characteristic reflecting the status of the accents. It can no longer be said that the three
standard or standard-like British accents, i.e. RP and the two slight non-native accents,
received the most favourable ratings. Apparently, the American speech sample was
perceived the most intelligible of all the accents used in the present study, and thus not
only compared to the other native speech samples. Again, a plausible explanation for this
phenomenon can be given by referring to Botterman (1995: 69). She assumed that the high
level of intelligibility for the American speaker “was probably due to the frequent
opportunities they [the informants] have to see American films and soap operas”. The
credibility of this interpretation is increased when the previously mentioned studies by
Mobärg (1999, 2002), Söderlund and Modiano (2002) and Westergren-Axelsson (2002)
are taken into account, since all these authors started their research by referring to the
contemporary Americanisation process dominating most European countries, which
implies the high degree of exposure to American media products for the informants of this
study as well. The fact that only a very low percentage of the informants rating the
American speech sample were aware of the American nationality of the recorded speaker,
should again be taken into account when considering this interpretation. However, it does
not necessarily make this interpretation less valuable, because indicating whether the
accent is intelligible or not does not require any assumptions about American people, and,
moreover, it is very unlikely that none of these informants have never heard an American
accent before – and thus ‘escape’ the so-called Americanisation process.
Next, RP and the slight Flemish accent were similarly perceived as being relatively easy to
understand. Apart from the obvious explanation that the dominant position of an RP or RP-
like pronunciation in education accounts for these high ratings, two other remarks should
84

be made. One, the reason why the RP accent was perceived slightly less intelligible than
the unpronounced Flemish speech sample is probably due to the circumstances of the
experiment. More specifically, the tape recorder used for the experiment that aimed to
measure the attitudes towards the RP speech sample did not manage to reach the same
relatively high volume than the audio equipment used for the other six experiments.
Consequently, the respondents in the back of the class expressed during the playing of the
tape that they had difficulty hearing what the RP-speaker was saying. However, this
disadvantage seems to have only a small effect on the perceived intelligibility, because the
mean score of 2.65 is still rather high. Two, the slight Flemish accent’s high perceived
intelligibility should not only be related to its RP-like features, but also to the very slow
reading rate that this speaker used. This second remark is actually also applicable to the RP
speech sample, having a very similar recording time of approximately 2 minutes.
The Irish speech sample has a similar medium position for intelligibility than for
‘educatedness’. Moreover, it has already been mentioned that this accent was perceived the
least favourable of the native English accents. Botterman (1995: 70) related this negative
rating to an association with dialect speech, but, unlike Botterman’s study, the low
correctness rates for the Irish speech sample in the present research resulted in illogical
patterns in the elicited attitudes, which makes it unclear what the underlying assumptions
were on which the informants based themselves.
The slight Dutch accent received a rather similar mean score for intelligibility than for
‘educatedness’. However, comparing the assessed degree of intelligibility for this speech
sample with the other accents, this seems to be a rather negative rating. The only plausible
explanation that can be offered here is that this rating is based on certain idiosyncratic
features of the speaker.
Finally, what does seem to be consistent for the ratings on both speech
characteristics is the unfavourable position of the broad non-native accents. The negative
attitude towards a pronounced foreign accent seems to dominate even when all accents are
considered. Particularly the broad Dutch accent was associated with negative attitudes,
which seems to confirm the findings of De Caluwe (1992), who indicated that Flemings
generally look down on the northern Dutch pronunciation.
85

4.2.2 The aesthetic dimension
The accents’ aesthetic dimension was reflected by the rating of the following two
characteristics: “beautiful” and “pleasant”. Informants were asked to evaluate these
characteristics on a seven-point rating scale.
It seems worth mentioning here that the speech scales were limited to a minimum in the
questionnaire for the simple reason to keep the respondents as unaware as possible about
the aim of the research, i.e. eliciting their attitudes towards native and non-native accents
of English. For this reason, more attention was drawn to the evaluation of the various
speakers as persons on a larger number of personality scales (Botterman 1995: 76; Hiels
1996: 69). However, the small number of speech scales were still deemed necessary to
include in the research, because this would make it possible to discover potential
correlations between the evaluations of the speakers’ personality on the one hand and the
attitudes towards their speech on the other hand.
4.2.2.1 The native English accents
An overview of the mean scores for the native English accents’ perceived beauty and
pleasantness, together forming the aesthetic dimension, is shown in Table 20:
aesthetic characteristics RP AmE IrE “beautiful” 2.71 4.00 4.52 “pleasant” 3.24 3.92 4.48 Table 20: The aesthetic dimension of the native speakers’ accents as perceived by the informants.
It seems that the RP speech sample hardly received any negative ratings until now and,
once again, this trend appears to persist also for the evaluation of this accent’s aesthetic
value. The informants rated RP as the most beautiful and pleasant speech sample of all the
native accents, and, moreover, it is also the only accent that was perceived positively in
terms of the aesthetic dimension (with a clearly favourable mean score of 2.71 for beauty
and a fairly positive mean score of 3.24 for pleasantness).
Compared to the favourable evaluation of RP, the American accent was much less
considered as beautiful or pleasant in sound. The difference between these two speech
samples is particularly visible when it comes to the perceived beauty of the accents, for
which the American accent received a rather unfavourable mean score of 4.00 . As for
86

pleasantness, the divide between RP and the American accent is much smaller, but the
former still convincingly has the first position.
The Irish speech sample, then, was even more downgraded than the American accent and
was generally regarded as sounding rather ugly and unpleasant.
These results show that a consistent pattern exists in the native accents’ aesthetic
dimension, which could not be said for the status dimension of the same accents. Referring
to the results for the accents’ aesthetic dimension in Botterman’s (1995: 76-81) study, the
same hierarchy of accents was discovered (1: the RP accent, 2: the American accent, 3: the
Irish accent), although it has to be noted that the RP speech sample in the present study
received much more positive ratings than the RP speech sample in Botterman’s
experiment. Furthermore, the results for the aesthetic dimension in the current study seem
to show a pattern that has been found for all the other personality and speech scales that
have been discussed so far, viz. on the whole (i.e. by looking at the total scores) the RP
speech sample always received the most favourable ratings, followed by the more
unfavourable positions for the American and Irish speech samples. The ratings for these
last two accents have been seen to alternate, once with the American speaker least
favoured, once with the Irish speaker at the bottom. When it comes to the analysis of the
speech scales, it appears that until now, the Irish accent is evaluated most negatively of all
the native accents.
4.2.2.2 The non-native accents
The results for the aesthetic dimension of the four non-native speech samples will be
analysed by means of the mean scores attributed to the two included speech characteristics
reflecting this dimension, beauty and pleasantness, as presented in Table 21:
aesthetic characteristics FlemE (s) FlemE (b) DutchE (s) DutchE (b) “beautiful” 4.00 5.14 3.94 5.75 “pleasant” 4.55 5.07 4.13 5.38 Table 21: The aesthetic dimension of the non-native speakers’ accents as perceived by the informants.
These figures are in a large extent similar to the findings for the non-native accents’ status
dimension, although on a first glance it can be seen that these mean scores are all relatively
more negative than the ones obtained for the accents’ perceived status.
87

There is again a consistent hierarchy apparent in the figures for the non-native accents,
with the most favourable ratings for both beauty and pleasantness assigned to the slight
Dutch English accent. The slight Flemish English accent was evaluated very similarly,
especially for the “beautiful” characteristic (the mean scores for these accents being 3.94
and 4.00). The least favourable evaluations, then, were once more reserved for the broad
non-native accents. Moreover, similar to the results for the status dimension, the broad
Dutch speech sample was downgraded most of all with very negative mean scores of 5.75
for beauty and 5.38 for pleasantness.
Thus, the same pattern was found for the non-native accents’ ‘educatedness’, intelligibility,
beauty and pleasantness, viz. the slight non-native accents were related to much more
favourable mean scores than the pronounced non-native accents. Furthermore, for all these
speech characteristics, the respondents evaluated the broad Dutch accent least favourably.
However, what does seem different for the aesthetic dimension, is that the order for the
slight non-native accents was turned around. More specifically, the slight Flemish accent
was favoured over the slight Dutch accent in terms of status, but the latter elicited more
positive attitudes concerning the aesthetic characteristics than the former.
4.2.2.3 Comparison and interpretation
The mean scores for the aesthetic dimension of the native and non-native accents are
juxtaposed in Table 22. This overview will serve as the starting point to go deeper into the
relations between the results for these two groups of accents.
aesthetic characteristics
RP AmE IrE FlemE
(s) FlemE
(b) DutchE
(s) DutchE
(b) “beautiful” 2.71 4.00 4.52 4.00 5.14 3.94 5.75 “pleasant” 3.24 3.92 4.48 4.55 5.07 4.13 5.38 Table 22: The aesthetic dimension of the native and non-native speakers’ accents as perceived by the
informants.
When the mean scores for the seven speech samples are considered, it seems that the
evaluations of three accents are consistent along the two speech characteristics reflecting
the aesthetic dimension. First, RP elicited the most favourable attitudes in terms of beauty
and pleasantness, strengthening the superior position it already has when the previously
obtained results are taken into account. Apparently, the informants thought that this speech
88

sample sounded highly educated as well as beautiful and pleasant. It must be said here that
the mean scores for the aesthetic dimension of all the other accents were generally
unfavourable, forming a gap with the rather positive ratings for the RP speech sample.
The two other accents that induced consistent reactions on the two speech characteristics
included in Table 22 were the broad non-native speech samples. Similar to the results for
the status dimension, these pronounced foreign accents were perceived the least favourable
of all seven speech samples, again with the lowest ratings attributed to the broad Dutch
accent. Therefore, the same underlying assumptions can be applied to explain for these
negative evaluations, viz. the overall downgrading of any degree of foreignness in the
English pronunciation as well as the general disliking of a Dutch pronunciation among
Flemings.
Rather high on the continuum of accents regarding the aesthetic dimension was the
American accent. It was perceived the second most pleasant of all the speech samples, after
RP. This result could again, as was said for the assessed high degree of intelligibility of the
American accent, be related to the probably frequent exposure of Flemish youngsters to
American media products, such as films, soap operas and pop songs. Moreover, the
somewhat more positive evaluation of RP is most likely the result of the tradition to
emphasise this pronunciation in Flemish education while at the same time an American
accent is generally disapproved in the this context (Botterman 1995: 77). As for the
perceived beauty, the ratings for the American accent and the RP speech sample show a
much larger difference (4.00 for the former, 2.71 for the latter), which indicates that the
informants were still very clearly preferring RP over an American pronunciation. This
corresponds to some extent with the findings of Simon (2005), who indicated that Flemish
students showed an overwhelming preference for RP as a pronunciation model.
The slight Dutch and Flemish accents showed similar mean scores to the American accent,
although in terms of pleasantness the latter received a noticeably more favourable rating.
The slight Flemish accent was even regarded rather negatively on this characteristic
(showing a mean score of 4.55), even though it was attributed to a high degree of
‘educatedness’ and intelligibility (cf. 4.2.1). This perceived unpleasantness for the slight
Flemish accent can again be related to the slow reading rate of its speaker, which, as has
already been mentioned, evoked unfavourable reactions of the informants during the
experiment.
As for the Irish accent, results appear to be quite similar to the ratings that were found for
this accent on the status dimension. Within the group of native accents it was perceived to
89
have the lowest status as well as the least pleasant and beautiful in sound. When the non-
native accents are considered as well, this speech sample was still evaluated rather
unfavourable for both dimensions, placed just before the two ‘losing’ broad non-native
accents. This result could be due to the fast reading rate or voice quality of the speaker but
any certainty for this assumption can not be assured, since no techniques were included in
the questionnaire to measure the influence of these speaker idiosyncrasies on the
evaluations of the informants.
Recapitulating, it appears that the informants did not really differentiate between the status
of an accent and its aesthetic value when evaluating the seven speech samples included in
the present experiment. A correlation between the ratings for ‘educatedness’ on the one
hand and beauty and pleasantness on the other seemed, for example, was found for the RP
speech sample and the broad non-native accents. The former was perceived as highly
educated and thus very beautiful and pleasant as well. The opposite was the case for the
pronounced non-native speech samples. The attitudes towards the American accent showed
similarities between its assessed intelligibility and pleasantness, both being rather positive.
The Irish speech sample was rated negatively on all four speech characteristics that were
discussed along the status and aesthetic dimension. Only the slight Flemish accent seems to
form the greatest exception to these correlations, because it was seen to be perceived much
more favourable on the status dimension than on the aesthetic one. This could be explained
by the fact that half of the informants probably based themselves on the RP-like features of
this accent for their evaluations (63,6 % thought is was an English speaker), resulting in
the positive mean scores in terms of status, whereas the remaining respondents (the ones
who did not think that this speaker was English) presumably focussed on the slow reading
rate and therefore evaluated the accent as rather unpleasant.
90

4.2.3 The solidarity dimension
The last dimension that was included in the present experiment in order to analyse the
evaluation of the accents was named – in imitation of the study on language attitudes
performed by Botterman (1995: 82) – the solidarity dimension. As opposed to the
previously discussed status and aesthetic dimensions, the informants’ solidarity with the
various accents was not measured by means of seven-point rating scales. Instead, two
direct questions were included in the questionnaire, asking the respondents whether they
wanted to speak with the accent they had heard on the tape themselves and, secondly,
whether they preferred their English teachers to speak with the accent in question. The
informants were required to answer either ‘yes’ or ‘no’ and, moreover, they were asked to
explain their negative answers.
This dimension was, similar to the analysis of the previous dimensions, described in three
parts: one focussing on the native accents, a second one on the non-native accents and a
third which brought the previously discussed results together and suggested some
interpretations.
4.2.3.1 The native English accents
The obtained answers to the questions “Would you like to speak with a similar accent
yourself (when studying English as a second or third language)?” and “Would you like
your English teacher to speak with a similar accent?” for the group of native English
accents will be discussed in this section. An overview of the percentage of respondents
who answered ‘yes’ and ‘no’ to the former question is shown in Table 23:
speak with the accent yourself? RP AmE IrE Yes 52,9 46,2 33,3 No 47,1 53,8 66,7 Table 23: The solidarity dimension of the native speakers’ accents as perceived by the informants.
The hierarchy that emerges from these percentages seems to conform with the previously
obtained results for the evaluations of the native accents.
The only accent that elicited a positive answer by the majority of the informants was the
RP speech sample. No less than 52,9 % of the respondents indicated that they wanted to
speak with this accent themselves. Nonetheless, this entails that a very large minority of
91

47,1 % gave a negative answer to this question. Thus, although the RP speech sample was
seen to be associated with very high levels of ‘educatedness’, intelligibility and beauty,
quite a large number of the informants did not prefer this type of pronunciation for
themselves. However, compared to the other two native accents, this accent still evoked the
most positive reactions.
Almost the exact opposite results can be found for the American accent. In this case, a
large minority expressed they wanted to speak with this kind of accent and a small
majority said they did not. Once more, this seems to correspond to the fairly favourable
attitudes towards the same accent’s intelligibility and pleasantness on the one hand and
with the less favourable attitudes towards its ‘educatedness’ on the other hand.
Surprisingly, one third of the informants who listened to the Irish speech sample wished to
speak with this kind of English accent. This does not add up with the general unfavourable
reactions to this accent’s status and its very negatively perceived aesthetic value. However,
when comparing this with the answers for the other native accents, it seems that, yet again,
this speech sample was placed at the bottom of the hierarchy.
After having discussed the results for the informants’ preference to use any of the three
native accents for their own English pronunciation, the results for the second included
question will now be analysed, viz. the informants’ desire to have an English teacher with
the native accent in question. The figures that were acquired for this second question
concerning the native accents are shown in Table 24:
the accent for English teacher? RP AmE IrE Yes 35,3 46,2 28,6 No 64,7 53,8 66,7 Table 24: The informants’ desire to have a teacher with a certain native accent.
These figures indicate an unexpected difference with the answers for the other ‘solidarity
question’. The RP speech sample no longer elicited the most favourable responses, since
only a meagre 35,5 % of the informants wished to have an English teacher speaking with
an RP accent. A considerably larger minority wanted their teachers to speak with an
American accent. Moreover, it seems striking that the percentages presented in Table 24
for this accent are exactly the same as the ones obtained for the former question.
Apparently, the respondents who rated the American speech sample did not make a
distinction between their desire to speak this accent themselves and their wish to have an
92

American-accented English teacher, giving the same answer to each question (i.e. 46,2 %
answered ‘yes’ and 53,8 % answered ‘no’). The same minimal difference between the
percentages for both solidarity-eliciting questions can be found for the Irish speech sample.
Only one third of the informants wished to use an Irish English pronunciation and a
slightly smaller percentage expressed that they preferred their English teacher to use an
Irish accent.
It appears, then, that only the informants who rated the RP speech sample evaluated each
question significantly differently. Strangely enough, the majority of them did not want
their English teacher to use RP, although more than half of the same respondents preferred
to use this pronunciation themselves. Some explanations for this phenomenon will be
offered after the discussion of the results for the non-native accents.
4.2.3.2 The non-native accents
The obtained answers to the first solidarity-eliciting question, i.e. “Would you like to speak
with a similar accent yourself (when studying English as a second or third language)?”,
regarding the non-native accents is shown in Table 25:
speak with accent yourself?
FlemE (s) FlemE (b) DutchE (s) DutchE (b)
Yes 27,3 0 37,5 0 No 72,7 100 62,5 100 Table 25: The solidarity dimension of the non-native speakers’ accents as perceived by the informants.
The figures that immediately stand out on a first glance of Table 25, are the unanimously
negative answers for both the broad non-native accents. Not one of the informants who
evaluated these speech samples expressed the desire to speak with a pronounced Flemish
or Dutch English accent. This result is perfectly in accordance with the exceptionally
unfavourable attitudes towards the broad non-native accents’ aesthetic and status
dimensions.
The percentages for the slight non-native accents are clearly more divided. First, it can be
seen that they, on the whole, elicited more favourable answers than the pronounced non-
native speech samples – which also corresponds to the more positive evaluations for these
accents on the other speech scales. Second, however, only a minority of the respondents
(27,3 % for the Flemish accent and 37,5 % for the Dutch one) gave a positive answer to the
93

question whether to use the accent that they heard themselves when speaking English.
Furthermore, the slight Flemish accent appeared to evoke more negative reactions than the
slight Dutch speech sample.
It seems interesting to, once again, compare the results for the first question included in the
solidarity dimension to the obtained answers to the question that asked the informants to
express whether they wished to have their English teachers use the particular accent they
had listened to. An overview of the results for this second question concerning the non-
native accents is presented in Table 26:
the accent for English teacher?
FlemE (s) FlemE (b) DutchE (s) DutchE (b)
Yes 31,8 7 56,3 0 No 68,2 93 43,7 100 Table 26: The informants’ desire to have a teacher with a certain non-native accent.
Although some of the percentages have increased or decreased, the hierarchy of the non-
native accents has remained unchanged.
The slight Dutch accent elicited the most favourable answers among the informants –
compared to the other non-native accents – when it came to speaking the accent themselves
and the same result can be found for these informants’ desire to have a teacher speaking
with this accent. However, it must be noted that with regard to the pronunciation of their
teachers, a clear majority of 56,3 % gave positive answers, whereas the same can not be
said for the results concerning their own pronunciation (which indicated that only a
minority of 37,5 % answered ‘yes’ to using this accent).
The second most favoured accent was, again, the slight Flemish English accent. Around
one third of the informants expressed the desire to have such an accent and a slightly larger
minority wanted their teachers speaking with this accent.
Finally, the least favoured positions were once more reserved for the broad non-native
accents. However, the unanimity that was found for the negative answers to the question
asking the informants if they wanted to speak with the accent in question themselves,
seems to have disappeared for the slight Flemish accent (whereas it remained unchanged
for the broad Dutch speech sample). An almost negligible minority – actually equivalent to
only one informant – indicated the wish to have a teacher speaking with a pronounced
Flemish accent.
94

4.2.3.3 Comparison and interpretation
Some attention will now be drawn to the analysis of the results for the native and non-
native accents as an entire group. Furthermore, some tentative interpretations for the
discussed results for the accent’s solidarity dimension will be presented in this last section.
Table 27 represents the obtained figures for the entire group of accents concerning the first
solidarity-reflecting question – asking whether they wanted to speak with the particular
English accent they had assessed.
speak with accent yourself?
RP AmE IrE FlemE
(s) FlemE
(b) DutchE
(s) DutchE
(b) Yes 52,9 46,2 33,3 27,3 0 37,5 0 No 47,1 53,8 66,7 72,7 100 62,5 100 Table 27: The solidarity dimension of the native and non-native speakers’ accent as perceived by the
informants.
Taking all seven speech samples into account, it appears that the results for this first part of
the accents’ solidarity dimension are to a relatively great extent similar to the results that
were discovered for the status and aesthetic dimensions. With regard to the two latter
dimensions, the RP speech sample was evaluated most favourably (with the exception of
its perceived intelligibility, for which the American speech sample received the highest
ratings) and the broad non-native accents were regarded as sounding the least educated,
intelligible, beautiful and pleasant of all seven accents. Since the same pattern can be
discerned from the figures presented in Table 27, it seems that these ratings have
influenced the informants in their desire to speak with the accent in question themselves. In
other words, the speech sample that sounded the most educated, beautiful and pleasant to
the informants, i.e. RP, elicited the largest majority of positive answers of all speech
samples. On the other hand, the broad non-native accents were related to very negative
ratings concerning status and aesthetic value and thus no one preferred to speak English in
this way.
Some clarification ought to be offered, however, for the relatively large minority of
respondents who indicated that they disliked RP for their own English pronunciation (47,1
%). For this, references can be made to what the informants wrote to motivate their
negative answers, and, what seemed to recur the most were explanations such as “it sounds
boring and stiff” as well as “the speaker uses no intonation”. The former clarification in
particular can be said to relate to the stereotypical connotations of RP with the ‘stiff upper
95

lip’ mentality and therefore elicited the negative evaluation for the solidarity dimension.
Moreover, Mobärg (2002) assumed that youngsters – in his case, Swedish youngsters –
generally associated RP with formal styles and that, when they were asked which type of
English accent they preferred, a considerable number of these young people did not choose
RP. This was caused, according to Mobärg, by their generally great exposure to the
American popular media, which resulted in their preference for the American accent
instead.
As for the perceived solidarity with the American accent in the present experiment, the
tendency to prefer this accent over RP does not seem applicable here – as opposed to the
result that was found by Botterman (1995: 82-91) – since the majority of the informants,
however small (53,8 %), still indicated that they did not wish to speak with an American
accent themselves. Some of them even motivated this choice by adding “I prefer a British
English pronunciation” or “speaking without an accent has more credibility”. The latter
remark could refer to the standard non-regional RP accent and it is especially striking that
this informant associates this type of speaking with a positive rating of your personality.
On the other hand, it must be said that the percentage of 46,2 % indicating a favourable
stance towards the own use of an American accent can be seen to be the second largest of
all the seven speech sample. This result is in accordance with the fairly favourable position
the American accent occupied on the accent hierarchy concerning its pleasantness.
Therefore, the informants did appear to be influenced to a certain extent by the
contemporary Americanisation process.
The remaining accents, i.e. Irish English and the two slight non-native English speech
samples, can also be seen to have the same position on the continuum of accents for this
part of the solidarity dimension than the one they occupied for the pleasantness
characteristic. Therefore, it could be assumed that the informants based themselves on
what they thought sounded pleasant in order to decide whether to speak with the accent in
question themselves.
After RP and the American accent, it is the slight Dutch accent that appears to be next in
line on the hierarchy, with 37,5 % of the informants expressing favourable answers. Since
the informants were not asked in the questionnaire to explain their positive responses, it
can only be guessed why this minority preferred to speak with a slight Dutch accent. It
should be mentioned, however, that almost all respondents did not realise that they were
rating a Dutch English accent and that the only informant who did, indicated that she did
not want to speak with this accent herself. Clarifications for the negative answers (62,5 %)
96

with regard to speaking with this accent were for example: “I do not think it is a beautiful
accent” or “this accent is not appealing”. Both statements seem to assess the accent for its
aesthetic value, which confirms the previously mentioned assumption that informants
expressed the desire to speak or not to speak with the particular accent, based on whether
or not they believed it to be pleasant in sound.
The reason why 33,3 % of the respondents wished to speak with an Irish accent is also
quite difficult to provide, since it contradicts the overall negative ratings that were obtained
for this speech sample. Again, attention needs to be drawn to the low correctness rates for
this accent (cf. Table 1), which implies that the informants could not have based their
answers on assumptions about an Irish accent as such. In any case, it seems most important
to point at the fact that the majority of the respondents did not want to use this English
accent, an answer that most of them made clear by noting that they perceived the accent as
being ugly and unpleasant. Therefore, the correlation between the aesthetic dimension and
the first part of the solidarity dimension seem to hold true for this speech sample as well.
The results for the slight Flemish accent can be explained, once more, by means of its RP-
like features on the one hand and its slow reading rate on the other hand. The minority of
informants who expressed a favourable attitude were the ones who believed this speaker to
come from England and one of them even clarified his positive evaluation by writing: “it
sounds rather British and that is good”. A convincing majority, however, did not wish to
speak English in this way for reasons they described as “it sounds mincing and unnatural”
or “the speaker exaggerates too much which makes it irritating”. They clearly based
themselves on the manner in which the speaker read the text passage.
After this exposition on the first question included to measure the accents’ solidarity
dimension, a comparison will now be made with the results for the second question, viz.
“Would you like your English teacher to speak with a similar accent?”. The obtained
answers to this question for the seven speech samples as an entire group are shown in
Table 28:
the accent for your teacher?
RP AmE IrE FlemE
(s) FlemE
(b) DutchE
(s) DutchE
(b) Yes 35,3 46,2 28,6 31,8 7 56,3 0 No 64,7 53,8 66,7 68,2 93 43,7 100 Table 28: The informants’ desire to have a teacher with a certain native or non-native accent.
97

These figures present some very striking results, especially when compared to the results
for the first solidarity-eliciting question. RP seems to have been wiped off its pedestal, as it
only comes in third, after the slight Dutch accent and the American accent. Therefore, it
could be assumed that the informants rating the RP speech sample used other criteria to
assess the particular English accent in terms of their own solidarity than the ones they used
to answer the second question concerning the English accent for their teachers. Apparently,
these informants were much stricter when it came to deciding whether they wanted their
English teacher to use the accent in question. When referring to the written clarifications of
64,7 % of the informants who gave negative answers, it can be seen that they rejected an
RP pronunciation for their teachers because they felt that their lessons would then become
boring and they would have difficulties paying attention. The negative associations of RP
with dullness and formality seemed to dominate over the prestigious value of the accent
when the informants answered this second solidarity-eliciting question. The opposite is
true for the previous solidarity question. Furthermore, some of them related their negative
answer to the fairly low degree of intelligibility, writing things like: “I would not be able to
understand everything the teacher is saying”.
Finding an explanation for the 56,3 % of the informants who wanted a teacher
speaking with a slight Dutch accent is guesswork, since the informants were not required
to make their positive answers clear and, moreover, the preference for this accent over RP
has never been found in the previously described results. It seemed that some of them did
not want to speak with this accent themselves but they did want their teachers to use it.
These informants, as opposed to the ones rating the RP speech sample, can be said to be
less strict for the answer on this second question. Perhaps they felt it was enough for their
English teacher to speak with a native-like accent (taking into account that more than half
of the informants considered this speaker to speak with a native accent: 37,5 % thought he
was English and 31,3 % indicated that he was Irish, cf. Table 1). However, it could be
assumed that the informants based themselves on certain idiosyncratic features –
unfortunately undetectable which ones – to give their answer, since this speaker was not
related to a specific nationality by a convincing majority of the informants (which implies
that they were not really aware of, or taking into account the nationality of the speaker they
were rating).
The results for the remaining speech samples remained relatively unchanged. The
American accent elicited a large minority of favourable answers also with regard to the
choice of accent for the English teacher. However, because of the serious downgrading of
98

the RP speech sample for this question, the American accent appeared to be more favoured
when it comes to the pronunciation of teachers than the RP accent. This seems striking at
first sight, but it can probably explained by the fact that these accents were rated by two
different groups. In other words, the informants who rated the RP speech sample did not
give any evaluations whatsoever of an American accent and vice versa. Therefore, the fact
that the American accent seems to have elicited more positive answers on this second
question than the RP speech sample can be ascribed to the more strict character of the
informants who rated the latter accent. Obviously, this is only a suggestion for the
interpretation of this striking result and other possible explanations should not be excluded.
The Irish and slight Flemish speech samples were evaluated in almost exactly the
same way for the first and the second solidarity-eliciting questions. However, the slight
Flemish accent shows a little more favourable answers to the question concerning the
accent of the teachers, whereas the Irish speech sample shows a little less positive answers.
Finally, the most unanimous answers can be found for the broad non-native accents,
which counts for both questions. The informants did not want to speak with these accents
themselves nor did they want their teachers to do so. This, as has been said, ties in
perfectly with the overwhelmingly negative evaluations of these accents on the speech
scales (not taking into account the very small minority of 7 % that apparently preferred to
have a teacher with a broad Dutch accent). Some examples of the reasons they wrote down
to explain their negative answers to the first question are: “this accent deviates too much
from the real English”, “I want to learn the beautiful accent of the Brits”, “the aim for our
English pronunciation should not be a non-English accent” or “this accent does not sound
fluently and demonstrates a poor knowledge of the language”. These writings indicate that
the informants disapproved of any degree of foreignness in their own English accent and,
moreover, that they aimed at speaking with a British accent. This correlates with the
findings of Simon (2005) who discovered a preference of RP by Flemish university
students. As for the negative answers to the second question, the informants seemed to
have based themselves on the same range of thoughts, viz. indicating that a teacher needs
to speak with a British accent because s/he is expected to set the example and, therefore,
s/he can not speak with an accent reflecting an imperfect knowledge of the language.
99

5 CONCLUSIONS
5.1. General findings
In order to provide a general view of the attitudes of the Flemish secondary school students
used as informants in this study towards the three native and four non-native English
accents, the results that were obtained for the present experiment will be summarised. The
focus will be mostly on clear patterns which were discovered, so that this summary
presents an overview of the general attitudes of the informants towards the various
speakers and their speech.
The first part of the questionnaire that was used for the present experiment aimed at
eliciting the attitudes of the informants towards the personality of the seven native and
non-native speakers of English. In order to discover these attitudes, the informants rated
the speakers on a number of 21 personality traits which were divided into four dimensions,
reflecting the speaker’s competence, social attractiveness, personal integrity and social
status.
The RP-speaker was perceived most favourably in terms of competence within the
group of native accents as well as for the whole group of seven speech samples. The Irish
accent was evaluated somewhat more positive than the American accent and they were
both rated more favourably than the slight non-native accents. At the bottom of the
hierarchy of accents in terms of competence were the two broad non-native accents, with
the most unfavourable ratings for the broadly accented Flemish speaker.
As for the assessment of the various speakers on the social attractiveness
dimension, the RP-speaker generally elicited the most positive attitudes, whereas the
slightly accented Flemish speaker was rated least favourably. The two Dutch speakers and
the American speakers were rated fairly positively and, finally, the Irish speech sample and
the broad Flemish accent elicited almost similarly negative attitudes than the slightly
accented Flemish speaker. These results were not consistent for all personality traits that
were believed to reflect the speakers’ social attractiveness. For example with regard to
sociability and sense of humour, the RP-speaker occupied a lower position on the hierarchy
than the American speaker and the two Dutch speakers. The broad Dutch speaker was
evaluated the most favourable of all seven speech samples on these traits. Furthermore, in
100

terms of ‘introvertiveness’ the two Flemish speakers, especially the slightly accented one,
were favoured over all other speakers.
Relatively similar results to the ones on the social attractiveness dimension were
found for the native speakers on the personal integrity dimension. The RP-speaker evoked
once more the most favourable reactions, closely followed by the American speaker (who
on one characteristic, i.e. honesty, received the most positive ratings) and the Irish speaker
was downgraded the most of the three native speakers. Considering the non-native
speakers as well, either the Flemish speakers were evaluated more positively than the
Dutch speakers (in terms of honesty and modesty) or the slightly accented speakers
received more favourable ratings than the broadly accented speakers (in terms of tolerance
and trustworthiness). Looking at the seven speech samples as one group, the RP-speaker
maintained his superior position.
Finally, the last series of personality traits were thought to reflect the speaker’s
social status. The RP-speaker occupied a very convincingly first position, followed by a
fairly positive evaluation for the slightly accented Flemish speaker. Both the Irish and the
American speakers received more negative ratings, with the former eliciting slightly more
favourable attitudes than the former. The slight Dutch English speaker had a similar
middling position on the hierarchy than the Irish and American speakers and the two
broadly accented non-native speech samples were favoured the least concerning social
status, with the broad Flemish speaker at the bottom.
These last findings point to a correlation between the speakers perceived competence and
the assessment of their social status. Apart from the slightly accented Flemish speaker –
who was evaluated far more favourably on social status than on competence – the
hierarchy of accents is the same for both these personality dimensions. For example, the
RP-speaker was related to the highest degree of competence, which corresponds to the
highly positive ratings for this speaker regarding social status. Moreover, the most
convincing majority of all speakers believed the RP-speaker to be a member of the higher
social class. At the other end of the hierarchy, the broadly accented Flemish speaker was
attributed to the lowest degree of competence and social status of all speakers.
Furthermore, only a very small minority thought this speaker was a member of the higher
social class, whereas the most convincing majority placed him in middle class position.
Therefore, it can be said that, apparently, “a person’s competence is inextricably linked to
his or her social status” (Botterman 1995: 105).
101

The second part of the questionnaire was devoted to the evaluation of the various accents
on speech scales. The assessment of the speech samples was divided in three dimensions,
viz. the status dimension, the aesthetic dimension and the solidarity dimension.
The results for the accents’ status dimension were to some extent in accordance
with the findings for the speakers’ social status. With regard to ‘educatedness’ the RP
accent was overwhelmingly favoured in comparison with all other speech samples. The
slight Flemish English accent came in second with a highly positive score as well,
followed by middling positions for the slightly accented Dutch accent and the American
and Irish speech samples. The broad non-native accents once more occupied the bottom
position, although as opposed to the results for the speakers’ social status, it was the broad
Dutch English accent that was associated with the most negative ratings. As for
intelligibility, the first position was no longer occupied by the RP accent. Surprisingly, the
American accent was perceived to have the highest degree of intelligibility, followed by
positive ratings for the slight Flemish accent and RP. Apart from these changes, the
hierarchy remained relatively similar to the one described for ‘educatedness’, again with
the broad Dutch English accent at the bottom.
The RP speech sample was also the most favoured of all seven accents on the
aesthetic dimension. Moreover, this was the only accent that elicited positive evaluations
on this dimension as opposed to much more negative ratings for all the other speech
samples. Similar to the results for the accent’s status dimension, the slight non-native
accents were perceived more favourably than the broad non-native ones. The latter, once
again, occupied the bottom position on the hierarchy, with the broad Dutch English accent
related to the least favourable evaluations. The American speech sample received fairly
positive ratings, especially compared to the more unfavourable evaluation of the Irish
accent.
The results for the solidarity dimension of the accents showed a different picture
concerning the desire of the informants to have a teacher with a certain English accent, in
that the RP speech sample was no longer the most favoured accent (receiving a lower
percentage than the American accent, for instance). However, when it comes to the
question asking the informants whether they wanted to speak with the accent themselves,
the results showed a hierarchy of accents that was very similar to the one described for the
aesthetic dimension. This implies that the informants based themselves on the aesthetic
value of the accent for their answer to this question. Thus, the RP accent was favoured the
most, followed by a fairly positive result for the American accent and a more negative
102

result for the Irish accent. Further, more favourable responses were found for the slight
non-native accents than the broad non-native accents, the latter being preferred by no one
for their own English accent.
The reason why only a minority of the informants wished to have teacher speaking RP was
ascribed to the relatively strict character of the informants rating this speech sample and
was therefore not considered to overwhelmingly contradict the overall positive results for
this speech sample.
Considering these general findings it can be seen that some correlations exist between the
evaluations on the personality scales and the assessment on the speech scales (cf.
Botterman 1995: 106; Hiels 1996: 88). This is especially the case for the RP-speaker, who
was not only rated the most favourably on the various personality traits but also elicited the
most positive attitudes on the speech scales. For example, he was assigned to the higher
social class by a large majority of the informants and, moreover, his accent was related to a
very high degree of ‘educatedness’. The same correlation between the personality and
speech scales can also be found for the accents that were generally at the bottom of the
hierarchy, i.e the broad non-native speech samples. Their accents were generally associated
with a low aesthetic value and status which then relates to the unfavourable evaluations of
these speakers’ in terms of competence and social status.
5.2. Discussion of the hypotheses
Before turning to some concluding remarks concerning the results of the present
experiment, it seems interesting and necessary to shed some more light on the earlier
postulated hypotheses (cf. 3.4). Based on the information that was derived from previous
research on the study of language attitudes, seven hypotheses for the results of the present
study were expressed. The main focus of this section will be to check whether these
hypotheses proved to be valid or not, referring to the abovementioned general findings and
to some of the results described in the fourth chapter.
H1: (a) the non-native accents will be rated positively, considering the
contemporary status of English as a lingua franca. (b) the native accents will then
be perceived in a more negative way, taking the same context into account.
103

H2: (a) the non-native accents will be rated negatively, as a reflection of the
importance of a native-like pronunciation in an educational context. (b) this attitude
will be further enhanced by a more negative evaluation of the broad non-native
accents.
With regard to the first two hypotheses, the results that were discovered for the present
research rather convincingly validated the second hypothesis (the (b)-part in particular),
which at the same time entailed that the first one did not find support in the results.
Specifically the assumption that the broad non-native accents would receive more
unfavourable scores than the slight non-native accents was confirmed in the present
experiment. This was particularly the case for the competence and social status
dimensions, on which the broad Flemish and Dutch speakers were rated the least
favourably. As for the status, aesthetic and solidarity dimensions of the accents as such,
these speech samples were also related to the most negative evaluations. Summarizing, the
informants looked down on a high degree of foreignness in the English pronunciation, and,
therefore, the dominance of a native-like pronunciation in the Flemish educational context
seemed to overrule the status of English as a lingua franca.
H3: the Dutch English accents will be rated unfavourably in comparison with the
Flemish English accents, following previous attitude studies conducted in Flanders
(De Caluwe 1992).
The third hypothesis was too some extent confirmed by the results of the present study.
Comparing only the broadly accented non-native speakers, it was discovered that the
speaker with a broad Dutch accent was rated more unfavourably concerning the evaluation
of this accent on the status and aesthetic dimensions. Furthermore, it was found that the
Dutch speakers were evaluated more negatively on individual traits underlying the social
attractiveness (e.g. ‘introvertiveness’) and personal integrity (e.g. modesty, honesty)
dimensions. This confirms what De Caluwe (1992) said about Flemings generally
downgrading the accent of their northern neighbours, and associating them with
personality characteristics such as “arrogant” and “blasé” (cf. 2.2.3). However, the elicited
attitudes towards the non-native speech samples were more frequently seen to be
104

distributed along the slight-broad divide, as discussed for the second hypothesis, rather
than on the Flemish-Dutch one.
H4: the RP-accented speaker will be judged favourably on the competence and
social status dimensions, indicating the importance of this accent in formal and
educational contexts.
This hypothesis was validated in a large extent, since the RP speaker was seen to have the
a strong superior position in terms of competence and social status. What is more, this
speech sample was generally evaluated the most favourably on all other described
personality and speech dimensions as well. This indicates that the prestige of this accent
was overwhelmingly confirmed in the present research, and that the general downgrading
of this accent on social attractiveness- and personal integrity-reflecting traits was
undermined.
H5: The American accented speaker will be evaluated favourably on the social
attractiveness and personal integrity dimensions, indicating the influence of the
generally Americanised popular media on the informants.
Taking the abovementioned generally favourable ratings for the RP speaker into account, it
appeared that this hypothesis did not find support in the results for the present experiment.
Therefore, the influence of the American popular media on the Flemish pupils used as
informants did not prove to be as strong as expected. However, on certain individual
personality traits underlying the two dimensions mentioned in the hypothesis, the
American speech sample received more positive ratings than the RP speaker. This was the
case for the speaker’s perceived honesty (personal integrity) and sense of humour and
sociability (social attractiveness). Moreover, the American speaker was regarded as the
most intelligible and a relatively high percentage of the informants expressed a wish to
have a teacher with this accent. Thus, although the RP-speaker was on the whole the most
favourite accent, this hypothesis seems to be validated too some extent. A possible reason
for this unexpected result, i.e. the fact that this hypothesis was not confirmed, was offered
by referring to the low correctness rates for the American accent (cf. Table 1).
105

H6: The Irish accent will have no clear evaluation pattern, indicating the
informants’ unfamiliarity with the accent.
H7: The Irish-accented speaker will be rated positively on the social attractiveness
and personal integrity dimensions, referring to the previous results obtained by
Botterman (1995).
The last expectations that were formulated for the outcome of the present study, were with
regard to the Irish speech sample. It was discovered that the informants had a lot of
difficulty in recognising the nationality of this speaker, which confirms the sixth and not
the seventh hypothesis. On the whole, the Irish speaker was rated rather negatively on all
discerned dimensions, which clearly contradicts the expectation that this speech sample
would be rated favourably on personal integrity and social attractiveness. Because of the
low correctness rates for this accent, it proved quite difficult to explain these negative
ratings. Plausible clarifications were that informants either based themselves on particular
idiosyncratic features of the speaker or on the fact that this accent deviated from the RP-
norm.
5.3. Concluding remarks
The present study showed that the Flemish secondary school students seem to favour an
RP pronunciation over all other native and non-native accents. Moreover, they held a
similar strong opinion about the broad non-native English accents, although in this case it
was an overwhelmingly negative one. Apparently, even when the contemporary status of
English as a lingua franca is taken into consideration, the informants were absolutely not
keen on using or listening to non-native English accents.
It should be noted, however, that these results might be influenced by the fact that the
experiment was set in an educational context, in which the ‘correct’ pronunciation is
strongly emphasised and all deviations from the norm, thus also non-native accents, are
discouraged. Previous research has shown that non-native speakers of English elicit less
unfavourable attitudes “when the setting for their speech is the home rather than school”
(Knops 1988: 106). Further research is needed in order to find out whether the same
attitudes would be discovered towards the accents used in this study if the experiment was
not set in school but in a more informal context.
106

Furthermore, it was mentioned that four out of the seven speech samples did not sound
familiar to the informants. Consequently, illogical patterns were sometimes found in the
results because no underlying assumptions about the nationality of the speaker in question
could account for the obtained attitude. The respondents that were used for the present
experiment clearly did not have an extensive knowledge of the various varieties of English.
Possibly, however, their knowledge of these varieties would have proved to be better if
more explicit and pronounced accents were used. It should be kept in mind, then, that
further research using accents that are familiar to all informants could indicate completely
different results.
107

6 BIBLIOGRAPHY
Baker, Colin 1988 ‘Key Issues in Bilingualism and Bilingual Education’. Multilingual Matters 35.
Clevedon: Multilingual Matters Ltd. 1992 ‘Attitudes and Language’. Multilingual Matters 83. Clevedon: Multilingual Matters
Ltd. Botterman, Ann 1995 ‘Attitudes towards accents of English – a sociolinguistic study in Flanders’.
Unpublished Master Thesis. Ghent University. Bradac, James J. 1990 ‘Language Attitudes and Impression Formation’. In: H. Giles and W. P. Robinson
(eds.), Handbook of Language and Social Psychology. Chichester: John Wiley & Sons ltd., pp. 387-412.
De Caluwe, Johan 1992 ‘Attitudes van Vlamingen tegenover de taal van het Noorden’. In: Nederlands van
Nu, vol. 40, pp. 53-56. 2001 ‘Belgisch Nederlands versus Nederlands Nederlands’. In: J. Taeldeman, M. Devos
and J. De Caluwe (eds.), Het taallandschap in Vlaanderen. Ghent: Academia Press, pp. 49-58.
De Cock, Barbara 2006 “Flemish language policy in an era of globalisation”. Noves SL – Catalonian
Journal on Sociolinguistics, the electronic review of the Language Policy Secretariat devoted to sociolinguistics and related topics. Autumn-winter 2006. <http://www6.gencat.net/llengcat/noves/hm06tardor-hivern/decock1_2.htm> (24/5/2007)
Dewaele, Jean-Marc 2005 ‘Sociodemographic, Psychological and Politicocultural Correlates in Flemish
Students’ Attitudes towards French and English’. Journal of Multilingual and Multicultural Development, vol. 26, no. 2, pp. 118-137.
Edwards, John R. 1982 ‘Language attitudes and their implications among English speakers’. In: E.B. Ryan
and H. Giles (eds.), Attitudes towards language variation – social and applied contexts. London: Arnold, pp. 20-33.
Fasold, Ralph W. 1984 ‘Language Attitudes’. In: The Sociolinguistics of Society. Oxford: Blackwell, pp.
147-180.
108

Ferguson, Charles A. 1981 Foreword to B. B. Kachru (ed.), The Other Tongue: English across Cultures.
Oxford: Pergamon, pp. vii-xi. Giles, Howard and Ellen Bouchard Ryan 1982 ‘Prolegomena for developing a social psychological theory of language attitudes’.
In: E.B. Ryan and H. Giles (eds.), Attitudes towards language variation – social and applied contexts. London: Arnold, pp. 208-223.
Goethals, Michaël 1997 ‘English in Flanders (Belgium)’. World Englishes, vol. 16, no. 1, pp. 105-114. Hiels, Greet 1996 ‘Attitudes towards accents of English – a sociolinguistic study in England.’
Unpublished Master Thesis. Ghent University. Holmes, Janet 2001 ‘Attitudes and applications’. In: An introduction to sociolinguistics. London:
Longman, pp. 342-365. House, Juliane 2003 ‘English as a lingua franca: A threat to multilingualism?’ Journal of
Sociolinguistics, vol. 7, no. 4, pp. 556-578. Hyrkstedt, Irene and Paula Kalaja 1998 ‘Attitudes toward English and its functions in Finland: A discourse-analytic study’.
World Englishes, vol. 17, no. 3, pp. 345-357. Kachru, Braj B. 1988 ‘The sacred cows of English’. English Today, vol. 16, pp. 3-8. Knops, Uus 1988 ‘Attitudes towards Regional Variation in Dutch Pronunciation’. In: R. van Hout and
U. Knops (eds.), Language Attitudes in the Dutch Language Area. Dordrecht: Foris Publications, pp. 105-120.
Knops, Uus and Roeland van Hout 1988 ‘Language Attitudes in the Dutch Language Area: An Introduction’. In: R. van
Hout and U. Knops (eds.), Language Attitudes in the Dutch Language Area. Dordrecht: Foris Publications, pp. 1-23.
Mobärg, Mats 1999 ‘School goes to Hollywood: Attitudes towards British and American English
among Swedish school students’. In: C. Paradis (ed.), Recent trends in the pronunciation of English. Social, regional and attitudinal aspects. Scripta minora. Studier utgivna av Kungl. Humanistiska Vetenskapssamfundet i Lund 1998-1999:2. Almqvist & Wiksell International, pp. 49-70.
109

2002 ‘RP or GA? On Swedish School Students’ Choice of English Pronunciation’. In: M. Modiano (ed.), Studies in Mid-Atlantic English. HS-institutionens skriftserie nr 7. Högskolan i Gävle, pp. 119-131.
Oakes, Leigh 2001 ‘Language attitudes’. In: Language and National Identity: Comparing France and
Sweden. Amsterdam: John Benjamins Publishing Co., pp. 29-33. Obiols, Marina Solís 2002 “The Matched Guise Technique: a Critical Approximation to a Classic Test for
Formal Measurement of Language Attitudes”. Noves SL – Catalonian Journal on Sociolinguistics, the electronic review of the Language Policy Secretariat devoted to sociolinguistics and related topics. Summer 2002. <http://www6.gencat.net/llengcat/noves/hm02estiu/metodologia/a_solis1_5.htm> (08/07/2007)
O’Driscoll, James 1990 ‘Quality versus Equality: Making Value Judgements about Language’. Belgian
Essays on Language and Literature, Ghent: Academia Press, pp. 51-70. Palmer, Leslie A. 1973 ‘A preliminary report on a study of the linguistic correlates of raters’ subjective
judgements of non-native English speech’. In: R.W. Fasold and R.W. Shuy (eds.), Language Attitudes: Current trends and prospects. Washington D.C.: Georgetown University Press, pp. 41-59.
Preston, Dennis R. 2001 ‘Language with an Attitude’. In: J. K. Chambers, P. Trudgill and N. Shilling-Estes
(eds.), The handbook of Language Variation and Change. Blackwell Publishing, pp. 40-66.
Power, Carla 2007 “Not the Queen’s English”. Newsweek International, electronic version. 7/3/2007.
<www.msnbc.msn.com/id/7038031/site/newsweek/> (24/5/2007) Ryan, Bouchard E.; Giles, Howard and Richard J. Sebastian 1982 ‘An integrative perspective for the study of attitudes toward language variation’. In:
E.B. Ryan and H. Giles (eds.), Attitudes towards language variation – social and applied contexts. London: Arnold, pp. 1-19.
Simon, Ellen 2005 ‘How native-like do you want to sound? A study of the pronunciation target of
advanced learners of English in Flanders’, Moderna Språk, vol. XCIX, no. 1, pp. 12-21.
Söderland, Marie and Marko Modiano 2002 ‘Swedish Upper Secondary School Students and their Attitudes towards AmE, BrE
and Mid-Atlantic English’. In: M. Modiano (ed.), Studies in Mid-Atlantic English. HS-institutionens skriftserie nr 7. Högskolan i Gävle, pp. 147-171.
110

Soukup, Barbara 2001 ‘“Y’all Come Back Now, Y’Hear!?” Language Attitudes in the United States towards Southern American English’. Vienna English Working Papers, vol. 10, no. 2, pp. 56-68. Shuy, R. and Frederick Williams 1973 ‘Stereotyped attitudes of selected English dialect communities’. In: R.W. Fasold
and R.W. Shuy (eds.), Language Attitudes: Current trends and prospects. Washington D.C.: Georgetown University Press, pp. 85-96.
Thomas, Linda 1999 ‘Attitudes to language’. In: L. Thomas and S. Wareing (eds.), Language, society
and power – an introduction. London: Routledge, pp. 174-188. Thompson, Geoff 2004 Introducing Functional Grammar. London: Arnold, p. 80. Van Dale Grote woordenboeken Engels. 2004 Cd-rom, Van Dale Lexicografie, Utrecht/Antwerpen. Van Bezooijen, Renée 1988 ‘The Relative Importance of Pronunciation, Prosody, and Voice Quality for the
Attribution of Social Status and Personality Characteristics’. In: R. van Hout and U. Knops (eds.), Language Attitudes in the Dutch Language Area. Dordrecht: Foris Publications, pp. 85-103.
Vandermeeren, Sonja 1996 ‘Language attitudes on either side of the linguistic frontier: A sociolinguistic survey
in the Voeren/Fouron-area and in Old Belgium North’. In: M. Hellinger and U. Ammon (eds.), Contrastive Sociolinguistics. Berlin: Walter de Gruyter & Co, pp. 157-175.
Westergren-Axelsson, Margareta 2002 ‘“Refined” or ”Relaxed” English Pronunciation: Usage and Attitudes among
Swedish University Students’. In: M. Modiano (ed.), Studies in Mid-Atlantic English. HS-institutionens skriftserie nr 7. Högskolan i Gävle, pp. 132-146.
Williams, Frederick 1973 ‘Some research notes on dialect attitudes and stereotypes’. In: R.W. Fasold and
R.W. Shuy (eds.), Language Attitudes: Current trends and prospects. Washington D.C.: Georgetown University Press, pp. 113-128.
Williams, Kipling D. and Andrew Jones 2005 ‘Trial Strategy and Tactics’. In: N. Brewer and K. D. Williams (eds.), Psychology
and Law: An Empirical Perspective. New York: The Guilford Press, pp. 276-322.
111

APPENDIX
1a. Text fragment (original)
1b. Text fragment (adjusted version)
2. Questionnaire
112

1a. Text fragment (original)
113

1b. Text fragment (adjusted version)
Do the financial rewards match the emotional ones?
Emotionally, nursing is one of the most satisfying of professions. Imagine how rewarding
it is to nurse a stroke victim towards independence. Or to watch a critically ill patient go
into intensive care and come out of it in a stable condition. Or being recognised and
thanked by former patients.
Of course these sorts of experiences are worth a great deal. But you can’t live off
experiences any more than you can live off fresh air. So what sort of money can you expect
as a nurse?
A nurse’s salary is far from being the pittance of popular imagination. The very least a
newly qualified nurse can earn is €1400.
But the above salary is just the first rung on the pay ladder. The pay structure in nursing is
designed to reward the clinical skills and responsibilities of individual posts. In other
words, it’s no longer necessary for a nurse to leave the patient’s bedside in order to earn a
higher salary. Even better, each step-up or grade gets an automatic increment every year
for the first four years.
But what does it all mean in real terms (or rather real money?). Well, more than three out
of four staff nurses are currently in one of the higher grades. They earn up to €1700. And
what’s the money like if you go on to become a Ward Sister or (the male equivalent) a
Charge Nurse? They can earn as much as €1900. Not as bad as you thought, is it? Of
course, you’re unlikely to be attracted to nursing because of the money. But there’s no
reason in the world why you shouldn’t be.
114

2. Questionnaire Beste leerling, Als laatstejaarsstudente Germaanse Talen doe ik voor mijn thesis een onderzoek naar uw evaluatie van iemands persoonlijkheid met enkel diens stem als basis. Gelieve na het beluisteren van het geluidsfragment dan ook volgende vragenlijst zo eerlijk mogelijk in te vullen. Uw antwoorden zullen anoniem verwerkt worden en zijn dus strikt vertrouwelijk. Alvast heel erg bedankt voor de medewerking! Joke Tavernier I. Hoe komt deze persoon bij jou over? Hoe zou je de persoonlijkheid van deze persoon beschrijven?
Intelligent 1 2 3 4 5 6 7 Helemaal niet intelligent
Vriendelijk 1 2 3 4 5 6 7 Onvriendelijk
Beleefd 1 2 3 4 5 6 7 Onbeleefd
Eerlijk 1 2 3 4 5 6 7 Oneerlijk
Zenuwachtig 1 2 3 4 5 6 7 Helemaal niet zenuwachtig
Ambitieus 1 2 3 4 5 6 7 Helemaal niet ambitieus
Verdraagzaam 1 2 3 4 5 6 7 Onverdraagzaam
Leidinggevend 1 2 3 4 5 6 7 Helemaal niet leidinggevend
IJverig 1 2 3 4 5 6 7 Lui
Sympathiek 1 2 3 4 5 6 7 Onsympathiek
Zelfzeker 1 2 3 4 5 6 7 Onzelfzeker
Betrouwbaar 1 2 3 4 5 6 7 Onbetrouwbaar
Gezaghebbend 1 2 3 4 5 6 7 Helemaal niet gezaghebbend
Grappig 1 2 3 4 5 6 7 Helemaal niet grappig
Sociaal 1 2 3 4 5 6 7 Asociaal
Bescheiden 1 2 3 4 5 6 7 Opschepperig
Rijk 1 2 3 4 5 6 7 Arm
Introvert 1 2 3 4 5 6 7 Extravert
Bekwaam 1 2 3 4 5 6 7 Onbekwaam
Geschoold 1 2 3 4 5 6 7 Helemaal niet geschoold
115

Ruimdenkend 1 2 3 4 5 6 7 Helemaal niet ruimdenkend
II. Wat is de beroepstoestand van deze persoon volgens jou? Kies één van de volgende:
□ een vrij beroep (dokter, advocaat etc.) □ een leidinggevende functie (directeur, manager etc.) □ een functie in het onderwijs (leerkracht, professor etc.) □ bediende of winkelier □ arbeider □ student aan een hogeschool of universiteit □ gepensioneerd □ werkloos
III. Hoe oud is deze persoon volgens jou? Kies één van volgende mogelijkheden:
□ < 20 jaar □ 20-30 jaar □ 30-40 jaar □ 40-50 jaar □ 50-60 jaar □ > 60 jaar
IV. 1. Wat vind je van de stem van deze persoon?
mooi 1 2 3 4 5 6 7 lelijk
2. Hoe klinkt het accent van deze persoon?
beschaafd 1 2 3 4 5 6 7 onbeschaafd
mooi 1 2 3 4 5 6 7 lelijk
gemakkelijk verstaanbaar
1 2 3 4 5 6 7 moeilijk verstaanbaar
aangenaam 1 2 3 4 5 6 7 onaangenaam
3. Zou je zelf met dergelijk accent willen spreken (bij het leren van Engels als
tweede/derde taal)?
□ Ja □ Neen
Indien neen, waarom niet? …………………………………………………………………………………………………………………………………
4. Zou je een leraar/lerares Engels met dergelijk accent willen?
□ Ja □ Neen
Indien neen, waarom niet? …………………………………………………………………………………………………………………………………
116

5. Vind je het nuttig om Engels te leren?
Ja, ik vind het nuttig
1 2 3 4 5 6 7 Neen, ik vind het niet nuttig
Waarom wel/niet? …………………………………………………………………………………………………………………………………
V. 1. Waar komt deze persoon volgens jou vandaan?
□ Amerika □ Engeland □ Ierland □ Vlaanderen □ Nederland □ Australië □ Schotland □ Andere: ………………………………………………….
2. Tot welke sociale klasse hoort deze spreker volgens jou?
□ Hogere klasse □ Middenklasse □ Lagere klasse
VI. 1. In welk jaar ben je geboren?
19………..
2. Wat is je geslacht? □ Man □ Vrouw
3. Welke richting volg je op school? □ Humane wetenschappen □ Economie – moderne talen □ Economie – wiskunde □ Latijn – moderne talen □ Wetenschappen – moderne talen □ Wiskunde – moderne talen □ Wetenschappen – wiskunde □ Andere: …………………………………………..
4. Hoeveel uur Engels krijg je per week op school? □ 2 uur/week □ 3 uur/week □ Andere: …………………………………………..
117

5. Wat is het hoogste diploma dat je moeder/vader behaald heeft?
Vader Moeder
Lager onderwijs □ □
Secundair beroeps (BSO) □ □
Secundair technisch (TSO) □ □
Secundair kunstonderwijs (KSO) □ □
Secundair algemeen vormend (ASO) □ □
Niet universitair hoger onderwijs □ □
Universitair onderwijs □ □
6. Ben je al naar een Engels sprekend land geweest? Zo ja,
Welk land? ………………………………………………………………………………………………………………………………… Welke stad? ………………………………………………………………………………………………………………………………… Hoe lang? …………………………………………………………………………………………………………………………………
7. Heb je vrienden of familieleden die Engelstalig zijn?
□ Ja □ Neen
Zo ja, uit welk land? …………………………………………………………………………………………………………………………………
8. Wat vind je van Engels als vak op school?
boeiend 1 2 3 4 5 6 7 saai
Bedankt voor de medewerking!
118