Embed Size (px)
Citation preview

PATTERNS OF VULNERABILITY IN THE
FORESTRY, AGRICULTURE, WATER, AND COASTAL SECTORS OF SILAGO,
SOUTHERN LEYTE, PHILIPPINES

Manila Observatory Gemma Teresa T. Narisma, May Celine T.M. Vicente, Emmi B. Capili-Tarroja, Faye Abigail T.
Cruz, Rosa T. Perez, Raul S. Dayawon, Julie Mae B. Dado, Ma. Flordeliza P. Del Castillo, Marcelino Q. Villafuerte II, Leonard Christian G. Loo, Deanna Marie P. Olaguer,
Ma. Antonia Y. Loyzaga
World Agroforestry Centre Ma. Regina N. Banaticla-Altamirano, Lawrence T. Ramos, Christine Marie D. Habito,
Rodel D. Lasco
Edited by: Joel T. Maquiling
Patterns of Vulnerability in the Forestry, Agriculture, Water, and Coastal Sectors of
Silago, Southern Leyte, Philippines

Patterns of Vulnerability in Silago, Southern Leyte
The Manila Observatory (MO) is a scientific research institution established by the Jesuit order in the Philippines with over a hundred forty-five years of service in the fields of atmospheric and earth science. It advocates a science-based approach to sustainable development and poverty reduction through its principal focus on the areas of climate change and pre-disaster science. The Observatory actively confronts these challenges through investments and partnerships in scientific research which must inform and guide a safe and sustainable future for humankind.
The World Agroforestry Centre (ICRAF) is part of the alliance of the Consultative Group on International Agricultural Research (CGIAR) centres dedicated to generating and applying the best available knowledge to stimulate agricultural growth, raise farmers’ incomes and protect the environment. ICRAF combines excellence in scientific research and development (R&D) to address poverty, hunger and environmental needs through collaborative programs and partnerships and is proud to be part of a multi-sector effort to promote agroforestry in the Philippines, especially among swidden agriculturists (slash-and-burn farmers) and upland farmers.
The Deutsche Gesellschaft für Internationale Zusammenarbeit (GIZ), is a federally-owned enterprise that supports the German government in the field of international development cooperation. For more than 30 years now, GIZ has been cooperating with Philippine partners in strengthening the capacity of people and institutions to improve the lives of Filipinos in this generation and generations to come. Together we work to balance economic, social and ecological interests through multi-stakeholder dialogue, participation and collaboration.
Cover Photo: Emmi Capili-Tarroja
Copyright 2011 by
GIZ
except for Chapter 4 on Methodology and Results of Climate Analysis and Projected Change, which includes existing model, methodology, and results of the Regional Climate Systems Program of the Manila Observatory
and Joint Copyright on all spatial maps (Figures VII.15, VII.16, VII.17, VII.18, VII.19, VIII.1, VIII.3, VIII.7, VIII.8, VIII.9, VIII.10, IX.1, IX.2, IX.3, IX.4, IX.5, and IX.6) generated through the Center for Environmental Geomatics of the Manila Observatory
This study has been financed by the Deutsche Gesellschaft für Internationale Zusammenarbeit (GIZ) through the Project 'Adaptation to Climate Change and Conservation of Biodiversity in the Philippines (ACCBio)' with funding from the International Climate Initiative of the German Federal Ministry for the Environment, Nature Conservation and Nuclear Safety. The International Climate Initiative is based on a decision of the German Bundestag, the German Parliament. For more information, log on to http://www.bmu klimaschutzinitiative.de/en/about_the_ici
ISBN: 978-971-94565-1-3

Patterns of Vulnerability in Silago, Southern Leyte iii
ACKNOWLEDGEMENTS
A number of people and institutions have made this book possible. First, we would like to thank Mr. Friederike Eppen, from GIZ, for providing comments and inputs on the draft report.
Furthermore, we would like to express our gratitude to the following institutions for helping us in gathering the necessary data to complete this book:
Municipality of Silago • Municipal Planning and Development Coordinator’s Office (MPDC) • Municipal Agricultural Office (MAO) • Municipal Environment and Natural Resources Office (MENRO) • Municipal Health Office (MHO)
Regional Offices • National Economic and Development Authority (NEDA) • Department of Agriculture – Bureau of Agricultural Statistics (DA-BAS) • Department of Agriculture - Bureau of Fisheries and Aquatic Resources (DA-BFAR) • Department of Environment and Natural Resources (DENR)
GIZ • Regional Environment Information System (REIS) • Environment and Rural Development Program (EnRD) • Program for Sustainable Management and Natural Resources
Province of Southern Leyte • Provincial Planning and Development Office (PPDO)
Academe • Visayas State University – Institute of Tropical Ecology • University of the Philippines Visayas Tacloban Campus • Southern Leyte State University

Patterns of Vulnerability in Silago, Southern Leyte
FOREWORD
It is often said that climate change is an issue that requires global solutions and local actions. The Philippine Strategy on Climate Change Adaptation (PSCCA) picks up this principle by calling for an enabling environment for mainstreaming climate change adaptation based on a decentralized framework of good governance. It also calls for the establishment of credible science-based information linked to community knowledge on climate change and climate
change adaptation at scales relevant to decision-makers and practitioners. The National Framework Strategy on Climate Change likewise gives a policy directive of building the adaptive capacity of communities and resilience of ecosystem to climate change.
The Deutsche Gesellschaft für Internationale Zusammenarbeit (GIZ) advocates the mainstreaming of climate change adaptation in development processes. Part of that is the integration of adaptation into local development planning by using and enhancing existing planning instruments and frameworks with a perspective of climate change. Through the Department of Environment and Natural Resources and GIZ joint project “Adaptation to Climate Change and Conservation of Biodiversity (ACCBio),” we had the opportunity to work together with local government units in mainstreaming climate change adaptation in the Comprehensive Land Use Plan (CLUP) prepared by municipal governments. The CLUP guides the growth and sustainable development of municipal governments by considering all sectors significant in the development process within the territorial jurisdiction. As a tool that reflects the development goals of the local community, the CLUP is a key instrument for analysis of local development policies and programs with regard to the risks and opportunities that climate change poses, and identifying measures to tackle these changes. The opportunity to support the Municipality of Silago, Southern Leyte in updating its CLUP presented an exceptional and welcome prospect for integrating CCA in the local development context. This provided the link to the local level of the mostly national-level interventions of the ACCBio Project through the introduction of the instrument of ‘Climate Proofing for Development’ developed for the Philippine context with the Environmental Management Bureau of DENR.
This publication is a contribution to action at the level of governance where impacts of climate change and the need for adaptation are inseparable. It presents the results of the impact analysis and vulnerability assessment to climate change of the forestry, water, agriculture and coastal sectors of the Municipality of Silago, Southern Leyte, as an input to the sectoral studies of the CLUP. The Manila Observatory and the World Agroforestry Center ICRAF with contributions from the State Universities in the region and the regional government agencies provided the science on which adaptation planning can be based. The Municipality of Silago, with the assistance of the DENR-GIZ ACCBio Project and the Environment and Rural Development (EnRD) Program, then took on the challenge of integrating this in the revision of the CLUP.
The goal of the PSCCA is to build the capacity of communities to adapt to climate change and increase the resilience of natural ecosystems to climate change. We hope to have contributed a small but significant part to this endeavor.
MABUHAY TAYONG LAHAT!
DR. BERND-MARKUS LISS Principal Advisor, ACCBio Project

Patterns of Vulnerability in Silago, Southern Leyte v
MESSAGE FROM THE MAYOR OF SILAGO
Silago has observed the changes in climate in recent years, being subject to unpredicted weather extremes that triggered damages in the productive sectors and threatened the livelihoods and well-being of our local communities.
In order to address the challenges presented by a changing climate and prepare for adaptation to the impacts of climate change, we have taken the opportunity offered by GIZ to support the Municipality in the development of a climate proof Comprehensive Land Use Plan (CLUP). With the assistance of the ACCBio Project in coordination with the ENRD Program, we were in a position to assess our water, agriculture, forestry and coastal sectors with regard to climate change impacts, to analyze the vulnerabilities and to elaborate options for improved resilience and adaptation to climate change at the local level and integrate them into our CLUP. This report documents the scientific inputs of Manila Observatory and ICRAF, PIK in this process to integrate climate change adaptation into our local development planning.
In this regard, let me thank and congratulate all local government agencies and key stakeholders for their commitment and tireless efforts towards a local planning that responds to the challenges of climate change. Thanks to the support of GIZ, we are now confident that our CLUP will provide a good basis for future development of the Municipality of Silago to make our programs and projects more adaptive to the impacts of climate change, thus more sustainable.
DAGHANG SALAMAT KANINJONG TANAN! Mabuhay!
HON. MANUEL A. LABRADOR, SR. Municipal Mayor Silago, Southern Leyte

Patterns of Vulnerability in Silago, Southern Leyte
MESSAGE FROM THE EXECUTIVE DIRECTOR OF THE MANILA OBSERVATORY
On behalf of the Manila Observatory, I wish to extend our sincerest congratulations and deep appreciation to all who have been part of this breakthrough work on patterns of vulnerability. This work is intended to enhance the capacities of coastal communities, as politico-ecological units, in confronting the unique challenges and opportunities posed by climate change. This
publication represents a milestone in the achievement of our shared objective, namely, to address vulnerability by establishing the foundation for evidence-based policies in local governance.
The Manila Observatory wishes to thank the Municipality of Silago, the Deutsche Gesellschaft für Internationale Zusammenarbeit (GIZ) and the World Agroforestry Center (ICRAF) for the privilege of being able to work on this unique collaborative opportunity. In particular, we wish to extend a special thanks toHon. Manuel A. Labrador, Sr., his hospitality and the generosity of time and spirit he showed our teams during the course of the project. Moreover, we wish to express our sincerest appreciation to Dr. Bernd-Markus Liss and Ms. Agnes Balota of GIZ for their unwavering support, and to Dr. Rodel Lasco for contributing his valuable time and expertise. Lastly, I wish to acknowledge the hard work and leadership of Dr. Gemma T. Narisma and the vital contributions provided by Ms. Deanna Marie Olaguer and the entire Manila Observatory team.
It is hoped that Silago, the Province of Southern Leyte and other coastal communities may use this results of this collaboration in their search for ways to significantly overcome these patterns of vulnerability and achieve resilience in response to our changing climate.
MS. MA. ANTONIA YULO LOYZAGA Executive Director Manila Observatory

Patterns of Vulnerability in Silago, Southern Leyte vii
MESSAGE FROM THE DIRECTOR OF THE WORLD AGROFORESTERY CENTER (ICRAF)
The World Agroforestry Centre (ICRAF) exists to help smallholder farming communities develop their crops and manage their agricultural landscape in a more sustainable way. Being largely dependent on natural ecosystems and climate conditions for productivity often leaves these communities vulnerable to the brunt of climate variability and extremes which are expected to intensify as the climate changes. Thus, they are among the sectors who require
locally-suited adaptation and climate-proofing mechanisms with minimal investment costs.
ICRAF and its partners like GIZ and the Manila Observatory have in many occasions echoed the need to come up with locally-suited climate change adaptation interventions. This document is an instance of that call. It examines the vulnerability patterns in the forestry, agriculture, water and coastal sectors in the Municipality of Silago, Southern Leyte with the end aim of providing guidance to policy makers in the drafting of an updated and climate-informed Comprehensive Land Use Plan (CLUP).
The CLUP is a key instrument with how good governance, land use and natural resources are interfaced with climate. With a CLUP designed with climate vulnerability in mind, we hope that the local government of Silago would be in a better position to address its climate-related problems.
Well wishes to a more sustainable Silago!
DR. RODEL D. LASCO Director World Agroforestry Centre

Patterns of Vulnerability in Silago, Southern Leyte viii

Patterns of Vulnerability in Silago, Southern Leyte ix
TABLE OF CONTENTS
List of Figures xiList of Tables xvExecutive Summary xvii
I. Introduction 1 a. The Philippines and Climate Impacts 1 b. The CI:Grasp Project 1
II. The Study Area: Silago, Southern Leyte 3 a. Biophysical Profile 3 b. Geology, Climate and Topography 4 c. Land Use 6 d. Demographic Profile 7 e. Socioeconomic Profile 9 f. Basic Social Services 11
III. Overall Methodology and Process 15
a. Process Flow 15 b. Development of Impact Chains and Influence Diagrams 16
IV. Climate Analysis and Projected Change 19 a. Climate Profile of Silago, Southern Leyte 19 b. Regional Climate Modeling Simulations 19 c. Gridded Data and Model Results Validation 23 d. Climate Change Projections for Silago 26
V. Vulnerability and Impacts of Climate Change on Forestry Sector 37 a. The Forestry Sector of Silago 37 b. Impact Chain, Influence Diagram, and Indicator Data for the Forestry Sector of Silago 45 c. Climate Impacts and Patterns of Vulnerability 47 d. Adaptation and Mitigation Options for the Forest and Water Sectors of Silago 49
VI. Vulnerability and Impacts of Climate Change on the Water Sector 53 a. General Introduction: Water Sector 53 b. The Water Sector of Silago 54 c. Hydrological Analysis 57 d. Impact Chain, Influence Diagram, and Indicator Data for the Water Sector of Silago 60 e. Water Sector Adaptation Options 63
VII. Vulnerability and Impacts of Climate Change on the Agricultural Sector 65 a. General Introduction: Agriculture Sector 65 b. Philippine Agriculture 66 c. Agriculture in Eastern Visayas and Southern Leyte 70 d. The Agriculture Sector of Silago 73 e. Patterns of Vulnerability and Potential Impacts of Climate Change on Agriculture in
Silago 75
f. Adaptation Options for the Agriculture Sector 85
VIII. Vulnerability and Impacts of Climate Change on the Coastal Sector 91 a. General Introduction: Coastal Sector 91 b. Impact Chain, Influence Diagram, and Projections for the Coastal Sector of Silago 94

Patterns of Vulnerability in Silago, Southern Leyte x
IX. Discussion and Conclusion 101 a. The Study Area 101 b. Climate Projections 101 c. Climate Impacts and Key Vulnerabilities 101 d. Risk Implications of Future Climate Changes in Silago 103 e. Integration in Climate Change: Cross-Sector Relationships 110
References 115
Annexes 121 a. Project details of the Junction PPH Himayangan-Silago-Abuyog Junction PPH Road
Project 121 b. Evolution of Impact Chains 122

Patterns of Vulnerability in Silago, Southern Leyte xi
LIST OF FIGURES
Figure I.1. Map of Southeast Asia. 2
Figure II.1. Map of Region 8 – Eastern Visayas, Philippines. 3
Figure II.2. Map of the Municipality of Silago, Southern Leyte. 4
Figure II.3. Relief map of Silago, Southern Leyte showing non-disputed and disputed land area
5
Figure II.4. Boundary map of Silago showing national highway. 6
Figure II.5. Route from Tacloban to Silago (A) before and (B) after the completion of the Junction PPH-Himayangan-Silago-Abuyog Junction PPH Road.
13
Figure III.1. Process Flow of the ci:grasp Project for Silago, Southern Leyte, Philippines. 16
Figure IV.1. Area of study – Silago, Southern Leyte 19
Figure IV.2. Climate Classification of the Philippines based on modified Coronas 20
Figure IV.3. RegCM3 model domains. Domain covering the Philippines at 40 km spatial resolution and domain centered at Panay at 20 km spatial resolution (inside the box).
21
Figure IV.4. Topography map of Leyte island. Red marker indicates location of Silago. Blue marker indicates location of PAGASA meteorological observing stations.
22
Figure IV.5. Monthly mean temperature in Maasin from PAGASA, CRU and RegCM3. 23
Figure IV.6. As in Figure IV.5, but in Tacloban. 23
Figure IV.7. Monthly mean rainfall in Maasin from PAGASA, APHRODITE and RegCM3. 24
Figure IV.8. As in Figure IV.7, but in Tacloban. 24
Figure IV.9. Monthly average temperature in Silago from CRU (obs) and RegCM3 (model). 25
Figure IV.10. Monthly mean rainfall in Silago from APHRODITE (obs) and RegCM3 (model).
26
Figure IV.11. Simulated monthly mean temperature in Silago for the years 1961 to 1990 (baseline), 2010 to 2039 (2020s) and 2040 to 2069 (2050s).
27
Figure IV.12. As in Figure IV.11, but for rainfall. 27
Figure IV.13. Mean temperature difference (degrees Celsius) over Leyte island from the baseline climate (1960 to 1990) averaged (a) over November to February and (b) April to May in the 2020s, and (c) over November to February and (d) April to May in the 2050s.
28
Figure IV.14. As in Figure IV.13, but over Silago. Temperature difference values over each grid point are also displayed.
29

Patterns of Vulnerability in Silago, Southern Leyte xii
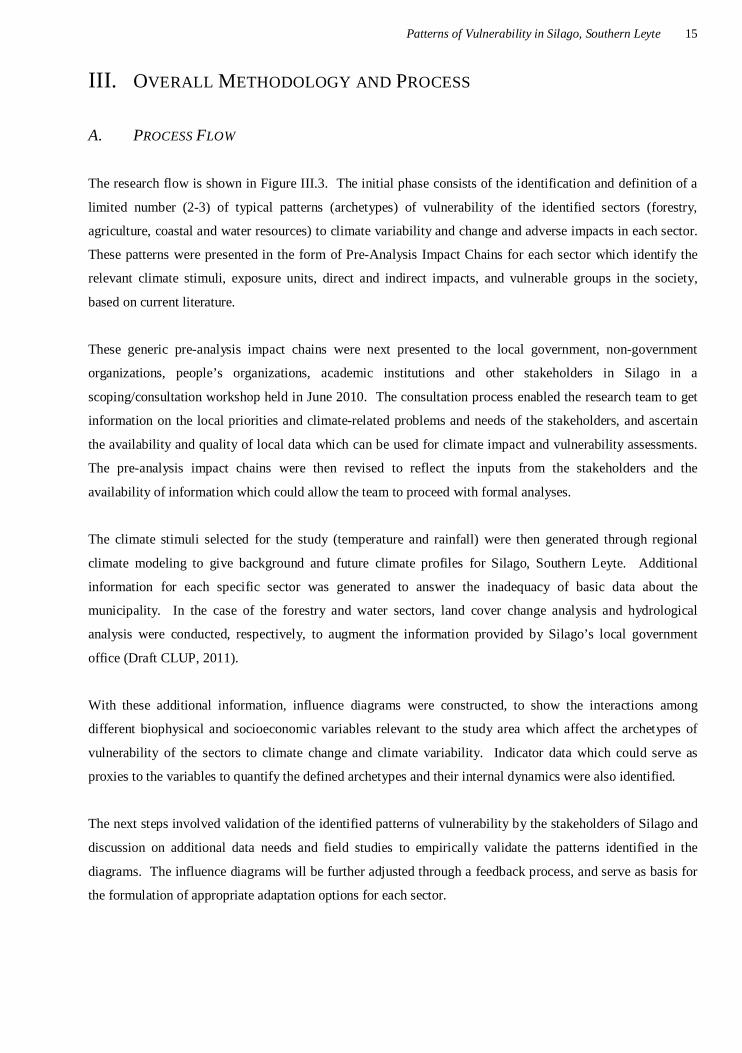
Figure IV.15. Mean rainfall percentage difference (%) over Leyte island from the baseline climate (1960 to 1990) averaged (a) over the dry season, (b) slightly wet season, and (c) wet season in the 2020s, and (d) over the dry season, (e) slightly wet season, and (f) wet season in the 2050s. Seasons are defined in Figure IV 10.
30
Figure IV.16. As in Figure IV.15, but over Silago. Rainfall percentage difference values over each grid point are also displayed.
31
Figure IV.17. Probability density functions of the monthly mean (a) daily maximum temperature, and (b) daily minimum temperature in Silago from the years 1961 to 1990, 2010 to 2039 and 2040 to 2069 from RegCM3.
32
Figure IV.18. Frequency distribution of days where the (a, b) daily maximum temperature and (c, d) daily minimum temperature exceeded defined thresholds in Silago from the years 1961 to 1990, 2010 to 2039 and 2040 to 2069 from RegCM3.
33
Figure IV.19. Frequency distribution of days where the daily rainfall is greater than or equal to 10 mm in Silago from the years 1961 to 1990, 2010 to 2039 and 2040 to 2069 from RegCM3.
35
Figure IV.20. Frequency distribution of the largest number of consecutive days where the daily rainfall is less than 1 mm (consecutive dry days) in Silago from the years 1961 to 1990, 2010 to 2039 and 2040 to 2069 from RegCM3.
35
Figure IV.21. Frequency distribution of the largest number of consecutive days where the daily rainfall is greater than or equal to 1 mm (consecutive wet days) in Silago from the years 1961 to 1990, 2010 to 2039 and 2040 to 2069 from RegCM3.
35
Figure V.1. Land cover map of Silago, Southern Leyte. 41
Figure V.2. Forest area in areas surrounding Abuyog-Silago Road in (A) 2000 and (B) 2009; forests became patchier near farm to market roads in Imelda and Catmon.
42
Figure V.3. L71113053_05320001204, 4 Dec. 2000, Bands 3, 2, 1. 43
Figure V.4. L71113053_05320030807, 7 Aug. 2003, Bands 3, 2, 1. 43
Figure V.5. L71113053_0532009072, 7 July 2009, Bands 3, 2, 1. 43
Figure V.6. Subset of Landsat 7 image, RGB composite B753. 44
Figure V.7. Spectral plots of training classes with corresponding band composites. 44
Figure V.8. Impact chain for forestry sector of Silago, Southern Leyte. 46
Figure V.9. Influence diagram for the forestry sector of Silago. 47
Figure VI.1. Silago’s major watersheds. 55
Figure VI.2. Flow of hydrological analysis in delineating watershed boundaries. 59
Figure VI.3. Influence diagram for the water sector of Silago. 60
Figure VI.4. Impact chain for water sector of Silago, Southern Leyte. 61
Figure VII.1. Projected changes in agricultural productivity in 2080 due to climate change with CO2 fertilization effects incorporated.
66

Patterns of Vulnerability in Silago, Southern Leyte xiii
Figure VII.2. Distribution of agricultural area by type of utilization. 67
Figure VII.3. Production of the 20 most important food and agricultural commodities (ranked by value) in the Philippines in 2008.
67
Figure VII.4. Philippine rice production. The red dots denote major El Nino Events. 68
Figure VII.5. Palay, Corn, and Coconut production in the Philippines from 1994-2009 70
Figure VII.6. Palay volume of production (metric tons) by province (2009). 71
Figure VII.7. Palay volume production in Southern Leyte. 71
Figure VII.8. Palay, coconut, and banana production in Southern Leyte. 71
Figure VII.9. Production volume of other crop types (cassava, camote, abaca, and corn) in Southern Leyte.
72
Figure VII.10. Estimated use of Inorganic Fertilizers in the Eastern Visayas Region. 72
Figure VII.11. Palay production and fertilizer use in Eastern Visayas. 73
Figure VII.12. Volume production in Silago from 2008-2010 for the different crop types. 75
Figure VII.13. Influence diagram illustrating the impacts of climate change on the agricultural sector.
76
Figure VII.14. Final influence diagram for the agricultural sector in Silago. 77
Figure VII.15. Land cover of Silago based on satellite based image analysis (2009). 78
Figure VII.16. Areas in Silago vulnerable to flooding due to increase in sea level at a) 1 meter, b) 2 meters, and c) 4 meters. Flooded areas are shaded in blue.
78
Figure VII.17. Projected increase in temperature by 2050 and the 2009 land cover of Silago. Larger red dots indicate higher increase in temperature.
80
Figure VII.18. Projected decrease in rainfall by 2050 and the 2009 land cover of Silago. Larger orange dots indicate drier conditions for 2050.
81
Figure VII.19. Existing major agricultural crops in Silago per barangay. 82
Figure VII.20. An illustration of the impacts of global warming on future shifts in climate into a new regime.
82
Figure VII.21. The projected changes in minimum temperatures in Silago showing a potential shift into a new regime by 2020 and 2050.
83
Figure VII.22. Rice Production-Consumption analysis for Silago based on the data from the municipal CLUP.
84
Figure VIII.1. Map of Municipality of Silago, Southern Leyte. 91
Figure VIII.2. Results of fish visual census carried out at Hingatungan, Silago, Southern Leyte.
93
Figure VIII.3. Population Density (2007) of Silago, Southern Leyte. The numbers indicate the registered fisherfolks as of September 2009.
93

Patterns of Vulnerability in Silago, Southern Leyte xiv
Figure VIII.4. Influence Diagram for the Coastal Sector of the Municipality of Silago, Leyte. 94
Figure VIII.5. Impact Chain for the Coastal Sector (1 of 2). 95
Figure VIII.6. Impact Chain for the Coastal Sector (2 of 2). 96
Figure VIII.7. Land Cover (2009) and Projected Temperature Increase (2020) of Silago, Southern Leyte. Inset: Percent Cover of Corals, Seagrasses, and Seaweeds during 2002 and 2003 in Hingatungan Marine Sanctuary. Changes in temperature will affect productivity of coastal ecosystems.
99
Figure VIII.8. Land Cover (2009) and Projected Temperature Increase (2050) of Silago, Southern Leyte. Inset: Percent Cover of Corals, Seagrasses, and Seaweeds during 2002 and 2003 in Hingatungan Marine Sanctuary. Changes in temperature will affect productivity of coastal ecosystems.
99
Figure VIII.9. Land Cover (2009) and Projected Rainfall Change (2020) of Silago, Southern Leyte. Inset: Percent Cover of Corals, Seagrasses, and Seaweeds during 2002 and 2003 in Hingatungan Marine Sanctuary. Changes in rainfall will affect pH and salinity of ocean waters thereby affecting coastal ecosystems.
100
Figure VIII.10. Land Cover (2009) and Projected Rainfall Change (2050) of Silago, Southern Leyte. Inset: Percent Cover of Corals, Seagrasses, and Seaweeds during 2002 and 2003 in Hingatungan Marine Sanctuary. Changes in rainfall will affect pH and salinity of ocean waters thereby affecting coastal ecosystems.
100
Figure IX.1. Areas and population densities vulnerable to a a) 1 meter-, b) 2 meter-, and c) 4-meter rise in sea level.
104
Figure IX.2. Projected increase in temperature by 2050 in Silago and the 2007 population density.
105
Figure IX.3. Projected decrease in rainfall by 2050 in Silago and the 2007 population density.
106
Figure IX.4. Malnourished children in Silago in 1999 per barangay expressed as a percentage of the population 14 years old and below
107
Figure IX.5. Forestry programs and projects in Silago. 108
Figure IX.6. Strategic agriculture and fisheries development zones in Silago. 108
Figure IX.7. Simple Schematic Diagram of Qualitative Cross-Sector Relationships. 110
Figure IX.8. Integrated risks and vulnerability assessment of Silago. 111

Patterns of Vulnerability in Silago, Southern Leyte xv
LIST OF TABLES
Table II.1. Land area by slope classification in the Municipality of Silago. 5
Table II.2. Land use classification in the Municipality of Silago. 6
Table II.3. Land capability classes in the Municipality of Silago, by topographical and soil characteristics.
7
Table II.4. Population by barangay in the Municipality of Silago, 2010 vs 2007. 8
Table II.5. Population, land area and population density by barangay in the Municipality of Silago as of 2010.
8
Table II.6. Population, number of households and average household size in Silago by barangay, as of 2010.
9
Table II.7. Comparative agriculture areas and production in Silago, 2008, 2009 and 2010. 10
Table II.8. Existing fishing grounds and aquaculture production. 11
Table II.9. Labor force population by sex and employment status, as of 2010. 14
Table V.1. Types of forest trees in the KICCFA CBFM project site by estimated area and percent of total area.
39
Table V.2. Percent land cover distribution of Leyte Island. 39
Table V.3. Percent land cover distribution of Silago, Southern Leyte, GTZ (2009) data. 40
Table V.4. Relative areas of cover classes resulting from supervised classification of LandSat 7 images and REIS (2009) data.
40
Table V.5. General Land Use and Forest Cover Type by Land Classification 42
Table V.6. Possible indicators of vulnerability to climate variability and climate change of the forestry and water sectors.
48
Table V.7. Adaptation options for forests and agriculture in the Pantabangan-Caranglan Watershed and their potential impacts on water resources, institutions and local communities.
50
Table VI.1. Incidence of acute watery diarrhea at national, regional and provincial levels, 2007 and 2008.
56
Table VI.2. Silago’s irrigation needs for paddy rice for one season versus available water supply.
57
Table VI.3. Possible indicators of vulnerability to climate variability and climate change of the forestry and water sectors.
63
Table VII.1. Number of Agricultural Farms in 2002. Source: Bureau of Agricultural Statistics. 67
Table VII.2. Land use for Silago based on the Municipal Ecological Profile in 2009. 73

Patterns of Vulnerability in Silago, Southern Leyte xvi
Table VII.3. Silago Land Capability Classes. 73
Table VII.4. Area, production, and Value of Production by Major Crops (1999). 74
Table VII.5. Comparative Agriculture Areas and Production, 2008, 2009 and 2010. 75
Table VII.6. Crops and the corresponding labor peaks and acitvites in Silago. 83
Table VII.7. Production-Consumption Analysis for Rice, 2000-2010. (Taken from the Silago CLUP, MPDO 2010)
84
Table VII.8. Adaptation options for the agricultural sector. 85
Table VIII.1. Physico-chemical parameters and GPS readings of Hingatungan Sanctuary, Silago, Southern Leyte.
92
Table VIII.2. Species composition, frequency of occurrence, cover of seaweeds and seagrasses and density associated invertebrates at the marine sanctuary of Hingatungan, Silago, Southern Leyte.
92
Table IX.1. Qualitative assessment of climate impacts and exposure,vulnerability indicators per barangay in Silago.
109
Table IX.2. Assessing adaptation potential 113
Table IX.3. Existing adaptation initiatives 114

Patterns of Vulnerability in Silago, Southern Leyte xvii
EXECUTIVE SUMMARY
The Study
For developing countries that are highly vulnerable to climate change such as the Philippines, sound
information on climate and its potential impacts need to be made available in a timely manner to enable
decision- and policy makers to formulate the appropriate adaptation measures to climate risks. The Potsdam
Institute for Climate Impact Research, PIK, in cooperation with the German Technical Cooperation, GTZ,
developed an interactive web-based platform called CI:Grasp (Climate Impact: Global and Regional
Adaptation Support Platform), which provides information on climate change, its physical and socio-
economic impacts, and adaptation options and experiences from across the world. The objective of the study
is to conduct a case study on the patterns of vulnerability and impacts of climate change on the forestry, water,
agriculture and coastal sectors of Silago, Southern Leyte, Philippines.
The process involved: 1) the identification and definition of impacts and typical patterns of vulnerability of
the four identified sectors to climate change and climate change variability; 2) regional climate modeling to
provide background and future climate profiles for Silago, Southern Leyte, 3) identification of crucial data and
information for each sector for impacts and vulnearbility analysis, and 4) identification of the different
physical and socio-economic variables that affect vulnerability, visualized through influence diagrams and
impact chains. Consultations with local stakeholders in the municipality of Silago were conducted to validate
the identified patterns, which could serve as basis for the formulation of appropriate adaptation options for
each sector in the municipality’s Comprehensive Land Use Plan.
The Study Area
The 4th class Municipality of Silago is one of the nineteen municipalities of Southern Leyte, located on the
eastern side of Region VIII (Eastern Visayas). Climate is classified as Type II, characterized by no distinct dry
season and a very pronounced maximum rainfall period from November to February. The municipality is
generally mountainous in the hinterlands and plain to sloping near the coasts. The 15 barangays that make up
the municipality are largely rural, with fishing and agriculture as the major source of livelihood, and rice and
coconut as the major products. Included in the Municipality’s identified development needs are insufficient
social services (health, education and access to safe water), low income and few livelihood opportunities, and
low agricultural productivity. Recently land transportation has improved significantly with the
construction/paving of a national road which now directly links the municipality to the provincial capital.

Patterns of Vulnerability in Silago, Southern Leyte xviii
Climate Projections
Climate projections for Silago were done using a regional climate model that downscaled the A1B scenario of
the ECHAM5 global climate model to a resolution of 20km. Modeled historical climate was validated using
ground observation data and results showed that the model was able to capture observed historical trends and
seasonal variability. Projected climate changes for Silago indicate: a) a slight increase in mean rainfall for the
dry season of 2020s and a decrease for all the other seasons. By the 2050s, mean rainfall is projected to
decrease throughout the year with up to 25% decline in the dry season; b) as much as 2.2 deg Celsius increase
in average temperature which may be expected during the warm dry months (of April & May) during the
2050s; c) warmer days and warmer nights are anticipated in the 2020s and 2050s. This is indicated by the
rightward shifts, i.e. shifts into higher values, in the extremes (the lower and upper tails) of the probability
distribution functions of the daily minimum and maximum temperatures; d) extremely high maximum and
minimum temperatures (90th Percentile of the baseline period: 1961 to 1990) could last throughout the year in
the 2050s; and e) consecutive dry days can occur for more than two months with fewer instances of month-
long consecutive wet days in the future.
Forest Sector Climate Impacts and Key Vulnerabilities
The municipality has high forest cover relative to other parts of the island; dipterocarp forest remnants are
now generally found in localities where large-scale logging was not profitable and where access was
hampered by the difficult terrain. Deforestation in recent years can be attributed to the clearing of forests for
commercial and marginal upland agriculture, and non-timber plantation establishment. Coconut plantations
dominate low-lying areas and are the usual end land use to forestlands after clearing and annual crop
cultivation. Five out of the 15 barangays of the municipality are situated in the hilly to mountainous interior
where these forest remnants are found. Currently, four barangays are involved in a community –based forest
management (CBFM) program. Forest cover loss over the last decade based on land cover change analysis
using remotely-sensed data is considered minimal. There is evidence of increasing fragmentation, giving way
to islands of scrubland and urban areas. Among the current important drivers of deforestation and degradation
are the expansion of farming activities in forest lands; the current scarcity of timber in the region in the face of
increasing demands for wood which could drive illegal logging activities, and road construction. A better
understanding of how these threats operate at the local scale is needed.
Future changes in climate could induce productivity gains in forest areas where water is not limiting, and
increases in productivity are not offset by deforestation or novel fire regimes. Strong warming, on the other
hand (the trend predicted for Silago) and its accompanying effects on water availability could potentially
induce drought conditions and negatively affect vegetation. A warming trend is also predicted to increase the
likelihood of more fire disturbances. For Silago, climate change projections include a greater warming inland,
where most of the forest land are located; these would have important implications to forest protection and
production activities. While CBFM project sites will be among the areas that will be strongly affected by these

Patterns of Vulnerability in Silago, Southern Leyte xix
changes in temperature and rainfall, attention should also be given to forest edges where most disturbances are
occurring. Communities situated in the forest lands are vulnerable to the impacts of climate due to their
poverty and high degree of dependence on forests for livelihood.
Water Sector Climate Impacts and Key Vulnerabilities
Silago`s forests provide important hydrological services availed not only by local residents but by adjacent
municipalities. Hydrological analysis shows that the Municipality’s river systems under average rainfall
conditions can very well supply irrigation needs. There is a potentially large supply of water .In the context of
the Municipality`s dependence on springs for both domestic use and irrigation needs, a continuing decrease in
forest cover may result in the long-term to decreased aquifer recharge, spring flow and base flow and instead
lead to increased runoff production, erosion and siltation. However, climate-sensitive variables are also
present, particularly 1) the incidence of enteric waterborne diseases, and 2) water siltation. Incidence of
enteric waterborne diseases can be exacerbated by the presence of favorable climatic (i.e. temperature,
moisture) and other environmental conditions. Meanwhile, siltation – although also greatly affected by land
use change – is aggravated by climate stimuli such as increase in rainfall, strong winds and occurrence of
extreme climate events. An urgent need of the hydro-forest sector is the establishment of an improved
distribution network to maximize the use of the currently underutilized water resources.
Agriculture Sector Climate Impacts and Key Vulnerabilities
Agriculture in Silago is extremely vulnerable to the projected negative impacts of climate change. Most of the
changes in the different climate variables analyzed, such as changes in minimum temperatures, rainfall
decreases especially during the wet season, will have adverse effects on rice yield. More importantly, the
adverse effects of global warming on rice production will have serious socio-economic consequences given
that rice is the most important food and commodity of the municipality. There are, however, alternative crops
that may be more resilient to climate impacts, specifically to the decrease in rainfall. Coconut and abaca
appear to be less vulnerable to the effects of the strong 1997-1998 El Nino and cassava is considered to be a
drought tolerant crop. Projected warming is higher inland where most of the forest lands are located. In
contrast, the decrease in rainfall is more severe along the coastal areas where majority of the rice paddies
located. Sea level rise will inundate the rice paddies along the coast and land loss can be as a high as 20% of
the total rice paddy areas with a 4 meter increase in sea level.
Coastal Sector Climate Impacts and Key Vulnerabilities
There are about 100 registered fisherfolks as of September 2009 in 12 coastal barangays in Silago and most of
the residents in the coastal communities are involved in fishing and aquaculture. Most of the barangays in
Silago are also located along the coast, implying a high dependence on the coastal resources by the populace
for food consumption, trade, and income. Potential changes in climate that will affect the various ecosystems

Patterns of Vulnerability in Silago, Southern Leyte xx
in the coastal sector, including coral reefs, seagrass and seaweed beds, mangroves, estuaries, and beaches, will
hence have corresponding socio-economic impacts on Silago. The projections for temperature in Silago
showed increases in temperature in the coastal areas for both 2020 and 2050. These can translate to changes
in the SSTs as land and sea temperatures interact. A small increase in SSTs will have big impacts on marine
life and processes. It will affect coral reef productivity and will alter the impact thresholds of coastal
organisms. The projected changes in rainfall, on the other hand, can affect changes in the fresh and salt water
balance thereby affecting salinity and pH of ocean waters, which is a critical part of primary productivity.
The compounding effects of temperature and rainfall increase will have impacts on the state of the coastal
resources and the sustainability of the coastal communities in the municipality.
Risk Implications of Future Climate Changes in Silago
The risk to the impacts of global warming is not solely dependent on the exposed sectors and the climate
hazards. It is also very much affected by social vulnerabilities and the capacity to adapt to the adverse impacts
of climate change change. A qualitative assessment of the overall risks to climate change that Silago may face
in the future was made based on available indicator data. The barangays of the municipality were categorized
according to climate change impact, sectoral impact due to climate change and vulnerability/exposure
indicators. The barangays that are found to be more at risk to the projected impacts of climate change are
Hingatungan, Salvacion, Lagoma, Poblacion District 2 (Pob Dist 2), Poblacion District 1 (Pob Dist 1), and
Katipunan. Hingatungan, which is a coastal barangay, is particularly at risk because of very high- and high
climate change impacts on rainfall decrease and sea level rise, respectively; very high climate impacts on rice
production, and high population density. The inland barangay of Katipunan on the other hand is more at risk
due to very high increase in temperature, very high impacts on rice (given the proportion of non-irrigated rice
and the combined impacts of warming and decrease in rainfall), high temperature impacts on forest, and high
percentage of malnourished children. The relatively high risk to climate change in Pob Dist 2 is mainly due to
exposure/vulnerability indicators. Pob Dist 2 has a very high population density and very high cases of
malnourished children and these combined with high rainfall impacts on rice, and high climate hazards in
terms of sea level rise and rainfall decrease puts the barangay at a relatively greater risk compared with the
other barangays. These assessments, though are qualitative and are very much reliant on 1) the projected
climate changes using a particular regional climate model and scenario and 2) on the available data obtained
for this study.

Patterns of Vulnerability in Silago, Southern Leyte
1
I. INTRODUCTION
A. THE PHILIPPINES AND CLIMATE IMPACTS
Climate change literature consistently emphasizes that countries located in tropical areas are among the most
susceptible to the impacts of climate change. Southeast Asia, in particular, with its fast-growing population
and increasing dependence on natural resources and agriculture, has already been experiencing climate
change-induced phenomena, aside from pre-existing climatic conditions and events (Lasco et al., 2011). The
Intergovernmental Panel on Climate Change (IPCC) noted in its Fourth Assessment Report (AR4) that
Southeast Asia has experienced an increase in average temperature by 0.1 to 0.3°C every decade between
1951 to 2000 (Cruz et al., 2007). Conversely, precipitation in the region has exhibited a generally decreasing
trend between 1961 and 1998, with a decline in the number of rainy days.
The Philippines is an archipelagic country in Southeast Asia (Figure I.1) made up of over 7,000 islands and
36,289 kilometers of coastline (CIA, 2009). It is located in the western Pacific Ocean and along the Pacific
Ring of Fire, making it highly vulnerable to both earthquakes and volcanic eruptions. Its location along the
west Pacific Typhoon Belt also places the Philippines in a collision course with an average of 20 tropical
cyclones each year, of which 8 or 9 make landfall (Cruz et al., 2007). The Philippine Atmospheric,
Geophysical and Astronomical Services Administration (PAGASA) has established that between 1951 and
2006, there have been an increasing number of hot days and warm nights, and a decreasing number of cold
days and cool nights (Hilario et al., 2009). In addition, between 1971 and 2000, there was an observed
increase in mean annual, maximum and minimum temperatures in the Philippines by 0.14°C every year (Cruz
et al., 2007).
Climate-related disasters in the Philippines are on the rise, with losses affecting the national economy
dependent on natural resources. Since 1990, the frequency of tropical cyclones entering the PAR has
increased by 4.2 (Cruz et al., 2007). The two largest calamities of 2009 combined – Tropical Storm Ketsana
(“Ondoy”) and Typhoon Parma (“Pepeng”) – resulted in agricultural losses worth PhP 10 billion (Go, 2009).
In October 2010, Super Typhoon Megi (“Juan”) devastated 19 provinces from four regions, claiming 36 lives
and resulting in agricultural losses amounting to over PhP 8 billion. Climate change impacts are foreseen to
worsen poverty, further increasing the vulnerabilities of about a third of the population still living below the
poverty line and heavily dependent on natural resources for subsistence. It will also derail the country’s efforts
to achieve its full development potential due to the economic impacts of climate-related disasters. B. THE CI:GRASP PROJECT
For developing countries that are highly vulnerable to climate change such as the Philippines, sound
information on climate and its potential impacts need to be made available in a timely manner to enable

Patterns of Vulnerability in Silago, Southern Leyte
2
decision- and policy-makers to formulate the appropriate mitigation and adaptation measures to climate risks.
However such information is available mainly for global trends and developed countries, is scattered across
many sources, and is often difficult or cumbersome to access. To address this problem, the Potsdam Institute
for Climate Impact Research, PIK, in cooperation with the German International Cooperation, GIZ, developed
an interactive web-based platform called ci:grasp (Climate Impact: Global and Regional Adaptation Support
Platform). The platform contains three main information layers that can be freely accessed and are mainly
visualized through maps:
1. Climate change stimuli parameter (like temperature, precipitation, wind, etc.),
2. Physical and socio-economic impacts (e.g. sea-level rise, changes in agricultural production, losses
due to extreme events, etc.)
3. Adaptation options and experiences.
Figure I.1. Map of Southeast Asia. Map generated by ICRAF. Through the latest Web 2.0 applications, adaptation experts and practitioners can provide feedback and add
information through pre-structured web forms and geo-tags that will undergo quality control mechanisms.
The objective of the project is to conduct a case study on patterns of vulnerability (archetypes) and impacts of
climate change on the forestry and water sectors of Silago, Southern Leyte, Philippines, as an input to CI-
GRASP. This report aims to answer the following specific tasks:
1. Identify and define a limited number (2-3) of typical patterns (archetypes) of vulnerability (to climate
change and climate change variability) and adverse impacts in the forestry and water sectors;
2. Describe the selected patterns of vulnerability (archetypes), including the impact of climate change,
and provide for each archetype influence diagrams of relevant variables.
3. Identify and describe a set of indicators, which is capable of serving as proxies to the variables to
quantify a given/defined archetype and its internal dynamics.
4. List possible data sources for the indicators and means of access to the data.

Patterns of Vulnerability in Silago, Southern Leyte
3
II. THE STUDY AREA: SILAGO, SOUTHERN LEYTE
A. BIOPHYSICAL PROFILE
The 4th class Municipality of Silago is one of the nineteen municipalities of Southern Leyte, located on the
eastern side of Region VIII (Eastern Visayas) at coordinates 10°31’56” N and 125°9’56” E (Figure II.1).
According to a recent perimeter survey conducted by the local government, Silago has a total land area of
21,995.13 hectares (ha)1 and is bounded by the municipalities of Abuyog, Libagon and Hinunangan in the
north, west and south, respectively (Figure II.2) (Draft CLUP, 2011). In the east, Silago is bounded by the
Gulf of Leyte and the islands of Homonhon and Dinagat.
Figure II.1. Map of Region 8 – Eastern Visayas, Philippines. Map generated by ICRAF.
1 As of March 28, 2011, draft CLUP (2011) released by the MENRO states that the total land area of Silago is 21,995.13 ha, with 14,653.22 hectares (66%) determined for forest purposes, based on an actual perimeter survey conducted by the Municipal Implementing Team (MIT). However, data on land use classification are still to be reconciled with DENR official estimates before they can be considered final and authoritative.

Patterns of Vulnerability in Silago, Southern Leyte
4
Figure II.2. Map of the Municipality of Silago, Southern Leyte. Map generated by ICRAF.
B. GEOLOGY, CLIMATE AND TOPOGRAPHY
The earth layers of Silago are made up of sedimentary and metamorphic rocks (Recent and Pliocene to
Pleistocene) and igneous rocks (Miocene and older). About 84%of the municipality’s total land area is made
up of Miocene and older rock systems. Meanwhile, Plio-Pleistocene series can be found in the south-west
portion of the municipality, occupying about 15% of the municipality’s total land area. Recent deposits
(Holocene series) cover the smallest amount of total land area (1%) concentrated in Poblacion Districts I and
II, and are made up of unconsolidated fine sand, silt, clay with minor gravel-rich tuffaceous sediments.
Climate in Silago is classified as Type II. This climate type does not have a distinct dry season and
experiences maximum rainfall in the period between November to February.
The topography of Silago is generally rolling to mountainous in the hinterlands and plain to slightly sloping
near the coasts. The largest proportion of land is described as rolling to moderately steep, comprising 33% of
Silago’s total land area (Table II.1).

Patterns of Vulnerability in Silago, Southern Leyte
5
Table II.1. Land area by slope classification in the Municipality of Silago2.
Percent Slope (%) Description Land Area (ha) Percent of total (%) 0-3 Level or nearly level to gently sloping 1,052 5% 3-8 Gently sloping to undulating 1,178 5% 9-18 Undulating to rolling 2,823 13%
18-30 Rolling to moderately steep 7,144 33% 30-50 Moderately steep to very steep 3,877 18% >50 Very steep to precipitous 5,436 25%
TOTAL 21,510 100% Source: Silago CLUP, 2000
Figure II.3. Relief map of Silago, Southern Leyte showing non-disputed and disputed land area. Map generated by ICRAF. Although anecdotal accounts reveal that the town rarely experiences climate extremes, its coastal barangays
directly face the Pacific Ocean and are thus, prone to storm surge, typhoons and tsunami, while barangays in
the mountains are prone to landslides and forest and bush fires.
2 Due to lack of updated estimates, land area by slope classification and total land area presented in the table were taken from the figures in the old CLUP (2000).

Patterns of Vulnerability in Silago, Southern Leyte
6
Figure II.4. Boundary map of Silago showing national highway. Map generated by ICRAF.
C. LAND USE
The Municipality of Silago is made up of 15 barangays, most of which are located along the coast. In terms of
land use, more than half of the municipality’s total land area is classified as forestland3 (12,482 hectares)
while another 8,363.11 hectares (38.88%) is used for agricultural production (Table II.2). Open grasslands
occupy 2.3% of the municipality’s land, with another 93 hectares (0.43%) housing the town’s built-up areas,
inclusive of residential, commercial and institutional areas, parks and open spaces, and transportation utilities.
Other existing general land uses within the area are open water spaces, road networks and cemetery/memorial
park. Table II.2. Land use classification in the Municipality of Silago4.
Classification 2009*(ha) Agricultural land 8,363.11 Forest land 12,482.00 Built-up areas 93.00 Dumpsite Grassland/shrubland/pasture land 494.15 Mangroves/NIPA/fish ponds Beach sand Open water spaces 71.63 Road network 3.12 Cemetery/memorial park 3.00
TOTAL 21,510.00 Source: *Municipal Ecological Profile, MPDO, 2009 3 According to Philippine law, “forestlands” are lands within the public domain with a slope of 18% or higher, including those covering the foothills to the forest zone line, plateaus with elevations greater than 600 meters, and lands with more than 50% slope, which are categorized as protected forest. This definition however, does not distinguish the actual vegetative cover of an area. 4 Due to lack of updated estimates, land area by land use classification and total land area presented in the table were taken from the figures in the old CLUP (2000) and the Municipal Ecological Profile (MPDO, 2009).

Patterns of Vulnerability in Silago, Southern Leyte
7
Silago’s land resources can be subdivided into three broad land capability classes. Municipal records reveal
that 12,197 hectares of land (57%) is classified as good land that is barely level and can be cultivated, but is
shallow, drought-prone and has low soil fertility and slight alkalinity (BS) (Table II.3). This type of land is
generally suited for legumes and tree crops. Another 5,436 hectares (25%) of land is moderately to very steep
and excessively eroded, shallow, rough and dry for cultivation, and is considered best suited for forests (N).
This type of land can also be used for grazing. The last 3,877 hectares is classified as very steep and severely
to excessively eroded, shallow for cultivation and also best suited for forests (M). Table II.3. Land capability classes in the Municipality of Silago, by topographical and soil characteristics5.
Land Capability Class Area (ha) Percent of total area (%) BS – Good land, barely level, can be cultivated, shallow, drought-prone and has low soil fertility and slight alkalinity, suited for legumes and tree crops
12,197 57%
N – Moderately to very steep land, excessively eroded, shallow, rough and dry for cultivation, best suited for forests, can also be used for grazing
5,436 25%
M – Very steep to precipitous land, severely to excessively eroded, shallow for cultivation, best suited for forests
3,877 18%
TOTAL 21,510 100% Source: Municipal Ecological Profile, MPDO, 2009 The 2000 CLUP describes two dominant soil types in Silago based on records of the Bureau of Soils and
Water Management: Guimbala-on clay and Laylay. Guimbala-on clay – composed of basaltic and andesite
rocks – makes up approximately 99.5% of the total land area, while Laylay makes up the remaining 0.5% and
can be found along shorelines bordering the coast of alluvial lands.
D. DEMOGRAPHIC PROFILE
Population
The urban portion of the Municipality of Silago is composed of three barangays: Poblacion Districts I and II,
and Poblacion District III (Barangay Tubod). The rest of the barangays are considered rural. As of 2010, the
urban population accounts for almost one-fourth of the total municipal population. Among the component
barangays of Silago, Hingatungan had the largest population at 2,049, while Catmon had the smallest at 134
(Table II.4). Average annual growth rates from 2007 to 2010 (based on computations for this report) are
considerably higher for populations in the barangays located in the mountainous interior.
5 Land area by land capability classes and total land area presented in the table were taken from the figures in the Municipal Ecological Profile (MPDO, 2009).

Patterns of Vulnerability in Silago, Southern Leyte
8
Table II.4. Population by barangay in the Municipality of Silago, 2010 vs 2007. 2010 2007 Barangay Urban/
Rural Population Percent of total
Population Percent of total
Average annual growth
rate (%)
Pob. District I Urban 1,071 8.50% 1,224 11.00% -4%
Pob. District II Urban 1,207 9.60% 1,007 9.00% 7%
Pob. District III (Tubod) Urban 791 6.30% 839 7.50% -2% Balagawan Rural 724 5.70% 727 6.50% 0%
Catmon Rural 241 1.90% 134 1.20% 27%
Hingatungan Rural 2,234 17.70% 2,049 18.40% 3%
Katipunan Rural 645 5.10% 480 4.30% 11%
Laguma Rural 781 6.20% 677 6.10% 5%
Mercedes Rural 2,133 16.90% 1,767 15.80% 7%
Puntana Rural 289 2.30% 171 1.50% 23%
Salvacion Rural 610 4.80% 608 5.40% 0%
Sap-ang Rural 681 5.40% 551 4.90% 8%
Sudmon Rural 466 3.70% 315 2.80% 16%
Tuba-on Rural 472 3.70% 438 3.90% 3%
Imelda Rural 265 2.10% 176 1.60% 17%
TOTAL 12,610 100.00% 11,163 100.00%
Sources: Silago Draft CLUP, 2011, NSO Census 2007
In 2010, Silago had a population of 12,610 and a land area of 215.10 square kilometers, resulting in an
average population density of about 59 per square kilometer. Among all the barangays, Poblacion District I
had the highest population density at 315 per square kilometer, followed by Mercedes with 188 per square
kilometer (Table II.5). Table II.5. Population, land area and population density by barangay in the Municipality of Silago as of 2010.
Land area Barangay Population ha km2
Population density (persons/km2)
Pob. Dist.I 1,071 340 3.4 315 Pob. Dist.II 1,207 710 7.1 170 Pob. Dist.III (Brgy. Tubod) 791 1,740 17.4 45 Balagawan 724 1,095 10.95 66 Catmon 241 8,475 84.75 3 Hingatungan 2,234 1,555 15.55 144 Katipunan 645 960 9.6 67 Laguma 781 580 5.8 135 Mercedes 2,133 1,135 11.35 188 Puntana 289 804 8.04 36 Salvacion 610 900 9 68 Sap-ang 681 740 7.4 92 Sudmon 466 885 8.85 53 Tubaon 472 575 5.75 82 Imelda 265 1,016 10.16 26
TOTAL 12,610 21,510 215.1 59 Sources: Silago Draft CLUP, 2011, MPDO, 2009
Patterns of Vulnerability in Silago, Southern Leyte
9
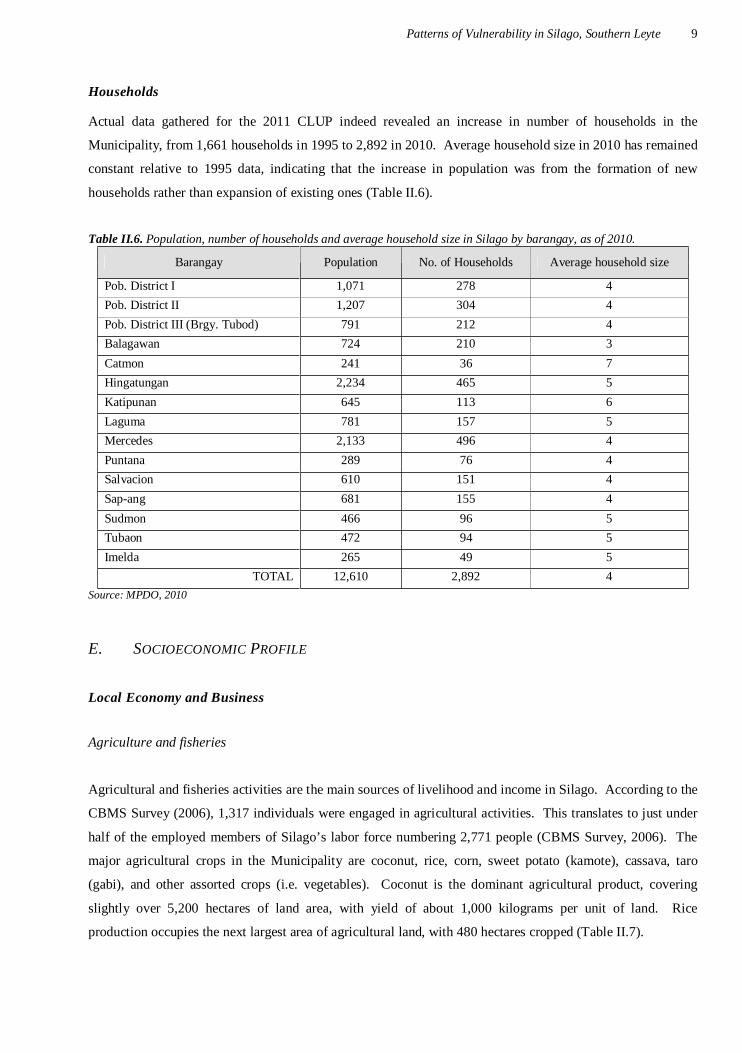
Households Actual data gathered for the 2011 CLUP indeed revealed an increase in number of households in the
Municipality, from 1,661 households in 1995 to 2,892 in 2010. Average household size in 2010 has remained
constant relative to 1995 data, indicating that the increase in population was from the formation of new
households rather than expansion of existing ones (Table II.6).
Table II.6. Population, number of households and average household size in Silago by barangay, as of 2010.
Barangay Population No. of Households Average household size
Pob. District I 1,071 278 4
Pob. District II 1,207 304 4
Pob. District III (Brgy. Tubod) 791 212 4
Balagawan 724 210 3
Catmon 241 36 7
Hingatungan 2,234 465 5
Katipunan 645 113 6
Laguma 781 157 5
Mercedes 2,133 496 4
Puntana 289 76 4
Salvacion 610 151 4
Sap-ang 681 155 4
Sudmon 466 96 5
Tubaon 472 94 5
Imelda 265 49 5
TOTAL 12,610 2,892 4
Source: MPDO, 2010
E. SOCIOECONOMIC PROFILE
Local Economy and Business
Agriculture and fisheries
Agricultural and fisheries activities are the main sources of livelihood and income in Silago. According to the
CBMS Survey (2006), 1,317 individuals were engaged in agricultural activities. This translates to just under
half of the employed members of Silago’s labor force numbering 2,771 people (CBMS Survey, 2006). The
major agricultural crops in the Municipality are coconut, rice, corn, sweet potato (kamote), cassava, taro
(gabi), and other assorted crops (i.e. vegetables). Coconut is the dominant agricultural product, covering
slightly over 5,200 hectares of land area, with yield of about 1,000 kilograms per unit of land. Rice
production occupies the next largest area of agricultural land, with 480 hectares cropped (Table II.7).

Patterns of Vulnerability in Silago, Southern Leyte
10
Table II.7. Comparative agriculture areas and production in Silago, 2008, 2009 and 2010.
Area (ha) Yield (tons/ha) 2008 2009 2010 2008 2009 2010
Rice 480.00 480.00 480.00
Irrigated 477.00 477.00 477.00 5.1 5.0 5.2
Hybrid 60.00 40.00 110.00 4.0 4.2 4.54
Good Seeds 379.50 421.00 367.00 3.8 3.9 4.0
Certified seeds 37.50 16.00 0.00 4.0 4.1 4.2
Non-Irrigated 3.00 3.00 3.00 3.6 3.8 3.9
Coconut 5,247.00 5,269.00 5,269.00 0.83 0.9 1.0
Cassava 27.00 27.00 27.00 10 11 12
Taro (kamote) 17.00 17.00 17.00 10 11 12
Banana 25.00 25.00 25.00 2.0 2.2 2.4
Pineapple 28.75 28.75 28.75 7.5 8.75 10
Vegetable 21.43 21.43 21.43 2.8 3.0 4.0
Abaca 9.75 9.75 9.75 1.30 1.35 1.37
TOTAL 5,855.93 5,877.93 5,877.93
Source: Municipal Data
The fisheries and aquaculture industry of Silago employs an estimated 117 people out of the 2,771 employed
members of Silago’s labor force (CBMS Survey, 2006). Over 1,100 hectares was reported under fisheries and
aquaculture activities, including marine fishing grounds and inland tilapia and bangus aquaculture ponds.
Latest available production data show that the local fisheries and aquaculture industry is valued at roughly
PhP 17 million per year, assuming an average selling price of PhP 100.00 per kilogram of fish (Table II.8).
Coastal resources
With the majority of its barangays lining the coast, Silago is rich in coastal resources. Coral reefs can be
found in the sea of barangays Balagawan, Mercedes, Sap-ang, Sudmon, Tubaon, Laguma, Salvacion,
Hingatungan and Poblacion Districts I & II. Sea grass communities are spread across all 10 of Silago’s
coastal barangays, while mangrove forests can be spotted in barangays Hingatungan, Laguma, Tubaon and
Sudmon. Marine protected areas have also been designated in barangays Hingatungan, Laguma and Sudmon.

Patterns of Vulnerability in Silago, Southern Leyte
11
Table II.8. Existing fishing grounds and aquaculture production. Production
Barangay Fishing Ground Area (ha) Volume (kg) Value (PhP) A. MARINE
Hingatungan 1st Mabaw (1st Reef) 121.76 18,263.25 1,826,325.00
Mabaw Tunga 55.27 8,290.16 829,015.50
Mabaw Dako 100.47 15,070.61 1,507,060.50
Mabaw Sa Lawaan 69.38 10,406.67 1,040,667.00
Salvacion Labohan 20.92 3,138.56 313,855.50
Laguma Mabaw sa batong Dako 363.66 54,548.82 5,454,882.00
Mabaw sa Bulhang 26.98 4,047.51 404,751.00
Tubaon Mabaw sa Matal –ay 87.34 13,100.78 1,310,077.50
Batong Diyoy 44.12 6,617.61 661,761.00
Lawis 13.88 2,081.67 208,167.00
Lagubo 29.45 4,417.35 441,735.00
Kapignis 0.71 106.92 10,692.00
Pob. Dist. II Bato sa Tabon Tabon 0.82 123.54 12,354.00
Pob. Dist. I Bato sa Simbahan 2.42 362.30 36,229.50
Kaimog 0.45 66.96 6,696.00
Balagawan Burawan 38.46 5,768.94 576,894.00
Balagawan Reef 150.62 22,593.47 2,259,346.50
Sub-total 1,126.70 169,005.12 16,900,509.00
B. INLAND (AQUACULTURE) Puntana Tilapia 0.09 60.00 6,000.00
Pob. Dist. II Tilapia 0.25 250.00 25,000.00
Mercedes Tilapia 0.18 120.00 12,000.00
Balagawan Tilapia 0.06 30.00 3,000.00 Hingatungan Bangus 0.25 550.00 66,000.00 Sub-total 0.83 1,010.00 112,000.00
TOTAL 1,127.53 170,015.12 17,012,509.00 Source: Agriculture and Fisheries, Economic Sector, Municipal Data
F. BASIC SOCIAL SERVICES
Education
Day care centers are present in all barangays except Catmon and Puntana. There are 14 public and 1 private
elementary schools in the Municipality, along with 4 high schools located in Poblacion District I,
Hingatungan, Mercedes and Katipunan. As for school year 2009-2010, enrolment in Silago’s primary schools
was 950 male and 893 female students, totalling 1,843 elementary school students.
Enrolment in secondary schools during school year 2009-2010 was 1,049, with almost equal participation
from male and female students. Based on Department of Education (DepEd) standards, Silago’s national high
Patterns of Vulnerability in Silago, Southern Leyte
12
schools have “manageable” conditions, with all 4 schools exhibiting ratios well below the ideal of 1 teacher
for every 46 students.
Health facilities and situation
Silago has 1 rural health unit (RHU) which serves as the main health office of the Municipality. There are
also 4 barangay health stations located in Hingatungan, Lagoma, Mercedes and Katipunan. Latest available
data revealed that the leading causes of morbidity in the Municipality were hypertension, bronchitis and
diarrhea (MPDO, 2010). Meanwhile, the leading causes of mortality were pneumonia, hypertension and
drowning.
Electric power supply
Electric power supply is provided by the Southern Leyte Electric Company (SOLECO). Based on municipal
data, 2,258 households in Silago have availed of electrical connections through SOLECO.
Water supply
According to consultations with local government officials and resource persons, the Municipality of Silago
has an abundant supply of water. However, this supply is largely underutilized due to lack of necessary
infrastructure and equipment, such as irrigation systems, filtering instruments and metering devices. Based on
climate projections for the Eastern Visayas region, mean seasonal rainfall is expected to increase during wet
months and decrease during summer (dry) months (Hilario et al., 2009).
Agricultural and support infrastructure
Communal irrigation systems (CIS) are installed in barangays Hingatungan, Sudmon, Salvacion and Lagoma.
Meanwhile, there were 3 communal irrigation projects (CIP): Poblacion District II CIP, Sap-ang CIP and
Mag-matal-ay CIP. Consultations revealed that the major development need for Silago’s agriculture sector is
the development/upgrade of irrigation facilities. Although this concern is commonly flagged as a pitfall of the
sector’s productivity, correspondence with local government officials and extension personnel established that
there is currently no endeavor to address this concern.
Transportation and communication
Provincial buses pass through the Municipality providing transportation service to Manila, Maasin and
Tacloban. Air transportation services can be availed in Tacloban City only. There are also no ports within
Silago, but there is a wharf for small boats in barangay Hingatungan.

Patterns of Vulnerability in Silago, Southern Leyte
13
Land transportation in Silago has improved significantly since the construction/paving of the Junction Pan
Philippine Highway (PPH) Himayangan-Silago-Abuyog Junction PPH Road commenced in 2004. The
project was funded through the Japan Bank for International Cooperation (JBIC) 23rd Yen Loan Package as a
subproject of the Arterial Road Link Development Project (ARLDP), Phase IV (Maris, 2006). The road is
classified as a national road spanning 113.4 kilometers. Aside from serving as a provincial link, it is also an
alternate route from the Pan Philippine Highway when roads in disaster prone areas are closed (Maris, 2006).
Travel time from Tacloban to Silago has been reduced from 6 to 2 hours with the paving of the national road
(Figure II.5).
The road traverses the coastal towns of St. Bernard, San Juan, Anahawan, Hinundayan, Hinunangan, and
Silago in Southern Leyte. After Silago, the road alignment shifts toward the interior of the island along the
provincial boundary (Maris, 2006).
Figure II.5. Route from Tacloban to Silago (A) before and (B) after the completion of the Junction PPH-Himayangan-Silago-Abuyog Junction PPH Road. Map generated by ICRAF. The two major telecommunications companies in the country – Globe Telecom and Smart Communications –
provide wireless signal for cellular/mobile phones in Silago. Landline connections are also available via
Globe Lines, a brand of Globe Telecom. The town’s Bureau of Post (Postal Office) handles the mail and
money order services of the community.
A B

Patterns of Vulnerability in Silago, Southern Leyte
14
Employment and Income
Table II.9. Labor force population by sex and employment status, as of 2010.
Population (15 yrs and over)
Employed % Unemployed %
Male 3,661 1,663 45 1,998 55 Female 3,380 1,108 33 2,272 67
TOTAL 7,041 2,771 39 4,270 61 Source: Municipal estimates as of 2010 based on 2006 CBMS Survey(2006)
The most recent data from the local government shows that about 7,000 people make up the local labor force,
with a larger percentage of employed males than females. According to a survey conducted in 2006, majority
of the labor force is occupied with activities under the agriculture and fisheries sectors (CBMS Survey, 2006).
Approximately 61% of the labor force is unemployed.
The 2011 draft of Silago’s Comprehensive Land Use Plan (CLUP) identified some priority issues and
problems regarding employment in the municipality. Lack of employment opportunities for workers was
attributed largely to seasonal nature of employment in agriculture, while the lack of technical trainings on
livelihood and specialty skills only added to the abundance of unskilled workers. As a result, members of the
local labor force have resorted to out-migration, while those with college degrees have explored employment
opportunities abroad.
Patterns of Vulnerability in Silago, Southern Leyte
15
III. OVERALL METHODOLOGY AND PROCESS
A. PROCESS FLOW
The research flow is shown in Figure III.3. The initial phase consists of the identification and definition of a
limited number (2-3) of typical patterns (archetypes) of vulnerability of the identified sectors (forestry,
agriculture, coastal and water resources) to climate variability and change and adverse impacts in each sector.
These patterns were presented in the form of Pre-Analysis Impact Chains for each sector which identify the
relevant climate stimuli, exposure units, direct and indirect impacts, and vulnerable groups in the society,
based on current literature.
These generic pre-analysis impact chains were next presented to the local government, non-government
organizations, people’s organizations, academic institutions and other stakeholders in Silago in a
scoping/consultation workshop held in June 2010. The consultation process enabled the research team to get
information on the local priorities and climate-related problems and needs of the stakeholders, and ascertain
the availability and quality of local data which can be used for climate impact and vulnerability assessments.
The pre-analysis impact chains were then revised to reflect the inputs from the stakeholders and the
availability of information which could allow the team to proceed with formal analyses.
The climate stimuli selected for the study (temperature and rainfall) were then generated through regional
climate modeling to give background and future climate profiles for Silago, Southern Leyte. Additional
information for each specific sector was generated to answer the inadequacy of basic data about the
municipality. In the case of the forestry and water sectors, land cover change analysis and hydrological
analysis were conducted, respectively, to augment the information provided by Silago’s local government
office (Draft CLUP, 2011).
With these additional information, influence diagrams were constructed, to show the interactions among
different biophysical and socioeconomic variables relevant to the study area which affect the archetypes of
vulnerability of the sectors to climate change and climate variability. Indicator data which could serve as
proxies to the variables to quantify the defined archetypes and their internal dynamics were also identified.
The next steps involved validation of the identified patterns of vulnerability by the stakeholders of Silago and
discussion on additional data needs and field studies to empirically validate the patterns identified in the
diagrams. The influence diagrams will be further adjusted through a feedback process, and serve as basis for
the formulation of appropriate adaptation options for each sector.

Patterns of Vulnerability in Silago, Southern Leyte
16
Figure III.1. Process Flow of the ci:grasp Project for Silago, Southern Leyte, Philippines. B. DEVELOPMENT OF IMPACT CHAINS AND INFLUENCE DIAGRAMS
The scope and context for analyzing the impacts of climate change and variability on the forestry and water
sectors of Silago were defined through the following processes:
Meetings and consultation between members of the research team Manila Observatory (MO) and the
World Agroforestry Centre (ICRAF) Philippines and GIZ were held between May and November
2010 to develop a common understanding of the ci:grasp approach, construct the pre-analysis impact
chains, clarify methodologies and assess data gaps.
Pre-Analysis Impact Chains
Revised Impact Chains
Scoping/Initial Consultation with Stakeholders of Silago Secondary Data Collection
Influence Diagrams (and indicator data)
Regional Climate Scenarios
Additional Data Generation: Land Cover Change Analysis
and Hydrological Analysis
Validation Workshop Synthesis
Climate Impact Assessment
Vulnerability Assessment
Adaptation Options

Patterns of Vulnerability in Silago, Southern Leyte
17
A consultation workshop was held with the local stakeholders of Silago in June 2010 to present and
validate the Pre-Analysis Impact Chains and assess the availability of local data for analysis.
Literature review was conducted to provide context to the analysis of the forestry and water sectors of
the study area. Baseline conditions of the forest and water sectors were described with data coming
mainly from the draft Comprehensive Land Use Plan (2011) of the municipality of Silago. In the
absence of specific information at the municipal level, the team made use of historical and
geographical analogues (Feenstra et al., 1998) from findings from related studies conducted in the
study area (Silago), its larger bounding provincial (Southern Leyte) and regional (Eastern Visayas)
administrative units, and nearby areas under similar biophysical and socio-economic conditions to fill
in data gaps and infer likely future change trajectories for each sector. Most of this information is
qualitative in nature.
A workshop was again held in March 2011 with the stakeholders of the municipality to present and
validate the initial findings from the study. Based on this validation and updated information on the
forest and water sectors of Silago, the influence diagrams and impact chains were revised accordingly.

Patterns of Vulnerability in Silago, Southern Leyte
18

Patterns of Vulnerability in Silago, Southern Leyte
19
IV. CLIMATE ANALYSIS AND PROJECTED CHANGE
A. CLIMATE PROFILE OF SILAGO, SOUTHERN LEYTE
The climate of Silago, a municipality of Southern Leyte (Figure IV.1) is classified as Type II as shown by the
modified Coronas Classification (Figure IV.2; Kintanar 1984). Under this classification, rainfall over this area
is most pronounced during the months of November to January without a distinct dry season.
Figure IV.1. Area of study – Silago, Southern Leyte (Source: Silago CLUP, 2011).
In this study, we aim to characterize the historical climate profile of Silago, using observed and modeled data.
This profile will be used as a climate baseline. We then use a climate model for future climate projections and
analyze the changes with respect to the climate baseline. B. REGIONAL CLIMATE MODELING SIMULATIONS
RegCM3 Model
Regional climate models are used to dynamically downscale large-scale meteorological fields generated from
global circulation models (GCM) to study the climate and seasonal predictability for a particular region. This
Silago

Patterns of Vulnerability in Silago, Southern Leyte
20
is necessary since some features of a regional climate are lost or weakly represented in the relative coarseness
in spatial resolution of a GCM. In this project, we use version 3 of the Abdus Salam International Centre for
Theoretical Physics (ICTP) Regional Climate Model (RegCM3), a three-dimensional hydrostatic model
developed in ICTP in Trieste, Italy (Pal et al., 2007). This model consists of mathematical equations dealing
with climate dynamics and includes parameterization schemes to represent radiative transfer, planetary
boundary layer, cloud and precipitation processes.
Figure IV.2. Climate Classification of the Philippines based on modified Coronas (from Kintanar, 1984). Description of experiments
We run RegCM3 at a 40 km spatial resolution over the Philippine domain (Figure IV.3) for the years 1961 to
1990. Initial and boundary conditions for the model are derived from the ~200 km resolution output of
ECHAM5/MPI-OM, which is a coupled atmosphere-ocean general circulation model of the Max Planck
Institute for Meteorology (Roeckner et al., 2003; Marsland et al., 2003). However, to characterize the climate
profile of Silago in finer detail, there is a need to further downscale this 40 km-resolution model output.
Hence, RegCM3 is run again at a 20 km spatial resolution over a smaller area centered at Panay island (Figure
IV.3) for the same 30-year period. The result of this simulation over Silago is used to establish its historical
climate profile that will be used as a baseline climate.
Type I: Two pronounced seasons: dry from November to April, wet during the rest of the year Type II: No dry season with a very pronounced rainfall from November to January Type III: Seasons are not very pronounced; relatively dry from November to April and wet during the rest of the year Type IV: Rainfall is more or less evenly distributed through the year

Patterns of Vulnerability in Silago, Southern Leyte
21
The baseline climate is validated with observed datasets, including surface temperature and rainfall
measurements. This is done to determine the model’s skill in capturing the observed climate. It is important
to establish the accuracy and reliability of the model since this will be used as a guide in analyzing the model
results for projections of the future climate.
Additional experiments following the same procedure above are conducted to determine the projected climate
of Silago. In this case, RegCM3 is run for two 30-year periods: 2010 to 2039 and 2040 to 2069. Simulations
from the ECHAM5/MPI-OM using the A1B scenario of the IPCC are used as initial and boundary conditions
for the model because the scenario represents a non-extreme case. The A1 family of the IPCC emission
scenarios describes a future world with rapid economic growth where the growing population reaches its peak
by 2050 and declines afterwards. In particular, the A1B scenario assumes a balanced use of fossil intensive
and non-fossil energy sources. These assumptions are expressed in terms of anthropogenic emissions of these
greenhouse gases: CO2, CH4, N2O and SO2 (IPCC, 2007). Model output is again downscaled to obtain a 20
km resolution output over Silago. Changes in the simulated projected climate are analyzed relative to the
baseline climate.
Figure IV.3. RegCM3 model domains. Domain covering the Philippines at 40 km spatial resolution and domain centered at Panay at 20 km spatial resolution (inside the box).

Patterns of Vulnerability in Silago, Southern Leyte
22
Observed Dataset
Surface observations in the area of study are needed to help establish its climate profile. Currently, there is no
meteorological station from Philippine Atmospheric Geophysical and Astronomical Services Administration
(PAGASA) in Silago. Thus, we intend to use temperature and rainfall data from two gridded reanalysis
datasets. Temperature data will be obtained from the Climatic Research Unit (CRU), which provides monthly
temperature data from 1901-2000 at 0.5 degree grid-point horizontal spacing (see Mitchell et al., 2003). On
the other hand, rainfall data will be taken from Asian Precipitation – Highly Resolved Observational Data
Integration Towards Evaluation (APHRODITE), a daily precipitation data from 1951-2004 obtained from
rain-gauge observations interpolated on a 0.25 degree grid resolution (Yatagai et al., 2009).
Figure IV.4. Topography map of Leyte island. Red marker indicates location of Silago. Blue marker indicates location of PAGASA meteorological observing stations. (Mapped with Google Earth). Data from CRU and APHRODITE need to be evaluated over areas where surface observations from
PAGASA are available. This is essential in establishing the validity in using these gridded datasets in the
absence of an observation station in Silago. The nearest PAGASA stations are found in Maasin City,
Southern Leyte (Maasin) and Tacloban City, Leyte (Tacloban) (Figure IV.4). The grid point from the CRU
and APHRODITE datasets closest to the location of these stations is selected for comparison. Differences are
anticipated since data at a point source will be compared with data averaged over an area. However, apart
from actual values, there should be an agreement in the seasonal trends in both datasets.

Patterns of Vulnerability in Silago, Southern Leyte
23
C. GRIDDED DATA AND MODEL RESULTS VALIDATION
Validation of CRU Temperature Data
The monthly mean temperature from 1961 to 1990 is derived over Maasin and Tacloban stations to validate
the CRU data with observed data from PAGASA (Figure IV.5 and Figure IV.6). In both locations, CRU
follows the seasonal trend in temperature of PAGASA. While the CRU data underestimates the temperature
in Maasin uniformly throughout the year, CRU is closer to PAGASA values in Tacloban.
Monthly Average Temp in Maasin
2 3 . 52 4
2 4 . 52 5
25 . 52 6
2 6 . 52 7
2 7 . 52 8
2 8 . 52 9
Jan F eb M ar A p r M ay Ju n Ju l A u g S ep O ct N ov D ec
Deg
Cel
sius P A G A S A
C R U
R egcm 3
Figure IV.5. Monthly mean temperature in Maasin from PAGASA, CRU and RegCM3.
Monthly Average Temp in Tacloban
2 3
2 4
2 5
2 6
2 7
2 8
2 9
Jan F eb M ar A p r M ay Ju n Ju l A u g S ep O ct N ov D ec
Deg
Cel
sius P A G A S A
C R U
R egcm 3
Figure IV.6. As in Figure IV.5, but in Tacloban. Validation of APHRODITE Rainfall Data
A comparison of the monthly mean rainfall from 1961 to 1990 from PAGASA and APHRODITE indicates
that both exhibit a similar seasonality in rainfall in Maasin (Figure IV.7) and in Tacloban (Figure IV.8).

Patterns of Vulnerability in Silago, Southern Leyte
24
While there is less rainfall in APHRODITE particularly in the wet months from July to January in Maasin,
APHRODITE underestimates rainfall in Tacloban throughout the year.
Monthly Mean Rainfall in Maasin
0123456789
1 0
Jan F eb M ar A p r M ay Ju n Ju l A u g S ep O ct N ov D ec
mm
/day P A G A S A
A p h ro
R egcm 3
Figure IV.7. Monthly mean rainfall in Maasin from PAGASA, APHRODITE and RegCM3.
Monthly Mean Rainfall in Tacloban
0
2
4
6
8
1 0
1 2
Jan F eb M ar A p r M ay Ju n Ju l A u g S ep O ct N ov D ec
mm
/day P A G A S A
A p h ro
R egcm 3
Figure IV.8. As in Figure IV.7, but in Tacloban. Modeling Results Validation for Maasin and Tacloban
In this section, the model output from RegCM3 will be validated with data from PAGASA, CRU and
APHRODITE. The monthly mean temperature in Maasin indicates that the model is able to generally follow
the seasonal trend observed from both PAGASA and CRU but tends to overestimate the temperature from
June to October (Figure IV.5). However, the model performs better in Tacloban (Figure IV.6).

Patterns of Vulnerability in Silago, Southern Leyte
25
In the case of rainfall, RegCM3 tends to simulate more rainfall in Maasin at the start of the year compared
with observations (Figure IV.7). On the other hand, the model underestimates rainfall in the latter half of the
year in both Maasin and Tacloban (Figure IV.7 and Figure IV.8).
Modeling Results Validation for Silago
In the previous section, we were able to show that the temperature from CRU and the rainfall from
APHRODITE closely follow the values from PAGASA in Maasin and Tacloban. Thus, this provides
additional confidence in the reliability of using data obtained from these gridded datasets over Silago, in the
absence of an observation station at this location.
Figure IV.9 shows that RegCM3 is able to follow the seasonal variation in temperature over Silago, although
the months of May to August tend to be warmer. In both observation and model output, pronounced wet
months are seen from November to January with slightly wet months for the other months except March to
May (Figure IV.10). However, the model tends to underestimate rainfall during the wet months.
While the model tends to have a warm and dry bias during the latter months of the year, it is able to capture
the observed temperature and rainfall in Silago at other months. This relative skill of the model should be
noted in the analysis of the simulated future projections in Silago.
Average Temp in Silago
2 32 3 . 5
2 42 4 . 5
2 52 5 . 5
2 62 6 . 5
2 72 7 . 5
2 8
Jan F eb M ar A p r M ay Ju n Ju l A u g S ep O ct N ov D ec
degr
ee C
elsi
us
ob s
m od el
Figure IV.9. Monthly average temperature in Silago from CRU (obs) and RegCM3 (model).

Patterns of Vulnerability in Silago, Southern Leyte
26
Figure IV.10. Monthly mean rainfall in Silago from APHRODITE (obs) and RegCM3 (model).
D. CLIMATE CHANGE PROJECTIONS FOR SILAGO
In this section, we characterize the changes in the projected future climate in Silago, relative to its baseline
climate as simulated from RegCM3. Mean changes in the variations in temperature and rainfall will be
examined in both time and space. In addition, the changes in selected indices of climate extremes will also be
presented since these tend to have a more significant impact compared with the differences in the means.
Seasonal variation
Figure IV.11 shows a comparison of the simulated monthly mean temperatures in Silago for the three 30-year
periods. The monthly variation is consistent across the periods, which indicates no change in the onset of the
warm and cool seasons in Silago. However, throughout the year, there is a distinct uniform increase of about
1°C in the projected temperature in the 2020s and 2050s, relative to the baseline.
There seems to be no change in the timing of the rainfall season in Silago since there is no change in the
monthly trend of the projected rainfall (Figure IV.12). In general, the projected rainfall is slightly lower than
the baseline, particularly at the start of the year.
Spatial changes
One of the advantages of using a regional climate model is that it allows us to examine the spatial variation of
the projected changes in regional climate, which is difficult to accomplish with few observation stations
existing in the area of interest. Spatial variability in the climate response is anticipated because of local

Patterns of Vulnerability in Silago, Southern Leyte
27
influences such as orography, land use, geographical location, such as distance from the coastline, in addition
to the changes in the climate forcing, including the enhanced greenhouse effect.
Average Temp in Silago during diff Periods
2 3
2 4
2 5
2 6
2 7
2 8
2 9
30
3 1
Jan F eb M ar A p r M ay Ju n Ju l A u g S ep O ct N ov D ec
deg
Cel
sius 1 96 1 to90
2020s
2050s
Figure IV.11. Simulated monthly mean temperature in Silago for the years 1961 to 1990 (baseline), 2010 to 2039 (2020s) and 2040 to 2069 (2050s).
Mean Rainfall during Different Periods
0
2
4
6
8
1 0
1 2
Jan F eb M a r A p r M ay Ju n Ju l A u g S ep O ct N ov D ec
mm
/day 1 96 1 to90
2020s
2050s
Figure IV.12. As in Figure IV.11, but for rainfall.
In the 2020s, there is an overall warming of up to 0.8°C in Leyte island during the cold, wet months from
November to February (Figure IV.13a). The warming inland intensifies from April to May, making the
temperature difference between the island and the surrounding ocean distinct (Figure IV.13b). A significant
increase in temperature reaching 2°C can be found in the 2050s, particularly inland (Figure IV.13c). The
warming inland becomes stronger and widespread over the island during the warm, dry months (Figure
IV.13d). The sea surface temperature east of Silago warms by up to 1.8°C, whereas the sea surface west of
Leyte island can reach the high temperatures shown over the island.

Patterns of Vulnerability in Silago, Southern Leyte
28
Changes in the area of Silago are highlighted in Figure IV.14. In the 2020s, there is a mean warming of 0.7°C
in the area during the cold, wet season. However, a look at the spatial distribution of the warming indicates
that the western section of Silago can be up to 0.1°C warmer, compared to the eastern section (Figure IV.14a).
This may be attributed to its location near the coastline since the sea breeze can modulate temperature
changes. In the warm, dry season, the mean temperature increase is 0.8°C, where the spatial gradient in the
temperature change is still evident but smaller in magnitude (Figure IV.14b). The projected warming in
Silago intensifies in the 2050s where the temperature increases by 1.9°C in the cold, wet season and by 2.2°C
in the warm, dry season, relative to the baseline climate (Figure IV.14c and Figure IV.14d). The spatial
temperature gradient between the inland and coastal areas of Silago also becomes more distinct.
Figure IV.13. Mean temperature difference (oC) over Leyte island from the baseline climate (1960 to 1990) averaged (a) over November to February and (b) April to May in the 2020s, and (c) over November to February and (d) April to May in the 2050s.
(a) (b)
(c) (d)

Patterns of Vulnerability in Silago, Southern Leyte
29
(c) (d)
(a) (b)
Figure IV.14. As in Figure IV.13, but over Silago. Temperature difference values over each grid point are also displayed. Changes in the rainfall are expressed as the percentage difference between the projected values and the
baseline. A distinct gradient in the rainfall change is observed over Leyte island during the dry season in the
2020s (a). There is roughly a 10% increase in rainfall northeast of the island but a 5% decrease in the
southwest. These drier areas extend to the northeast in the wet seasons (Figure IV.15b and Figure IV.15c). In
the 2050s, there is a shift in the rainfall change towards drier conditions in the dry season (Figure IV.15d).
While rainfall has further decreased during the wet seasons, there is minimal change in the spatial profile of
the rainfall difference compared with the 2020s (Figure IV.15e and Figure IV.15f).
0. 7 6
0. 6 6 0. 7 4
0. 6 6 0. 8 5
0. 7 7 0. 8 5
0. 7 8
2 . 4 4
1 . 8 9 2 . 4 3
1 . 9 0 2 .08
1 . 8 4 2 . 04
1 . 8 3
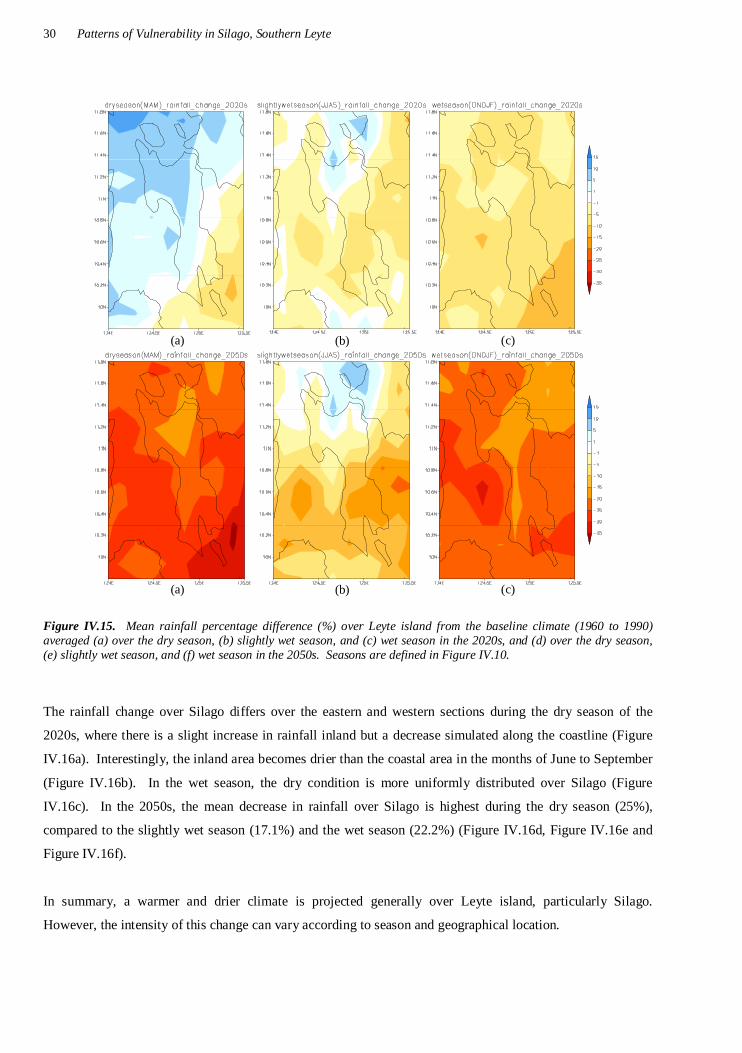
Patterns of Vulnerability in Silago, Southern Leyte
30
Figure IV.15. Mean rainfall percentage difference (%) over Leyte island from the baseline climate (1960 to 1990) averaged (a) over the dry season, (b) slightly wet season, and (c) wet season in the 2020s, and (d) over the dry season, (e) slightly wet season, and (f) wet season in the 2050s. Seasons are defined in Figure IV.10.
The rainfall change over Silago differs over the eastern and western sections during the dry season of the
2020s, where there is a slight increase in rainfall inland but a decrease simulated along the coastline (Figure
IV.16a). Interestingly, the inland area becomes drier than the coastal area in the months of June to September
(Figure IV.16b). In the wet season, the dry condition is more uniformly distributed over Silago (Figure
IV.16c). In the 2050s, the mean decrease in rainfall over Silago is highest during the dry season (25%),
compared to the slightly wet season (17.1%) and the wet season (22.2%) (Figure IV.16d, Figure IV.16e and
Figure IV.16f).
In summary, a warmer and drier climate is projected generally over Leyte island, particularly Silago.
However, the intensity of this change can vary according to season and geographical location.
(a) (b) (c)
(a) (b) (c)

Patterns of Vulnerability in Silago, Southern Leyte
31
Figure IV.16. As in Figure IV.15, but over Silago. Rainfall percentage difference values over each grid point are also displayed.
Changes in extremes
So far, we have only examined the projected changes in the mean values of temperature and rainfall. As
mentioned, changes in the climate extremes will also be analyzed since these tend to have a more significant
impact on the community and ecosystem. For example, increases in the frequency of extreme rainfall events
can lead to higher incidences of flooding.
The probability density functions (PDF) of the monthly means of the daily maximum temperature and daily
minimum temperature from the four grid points covering Silago (shown in Figure IV.14 and Figure IV.16) are
derived for the three 30-year periods as simulated from RegCM3. A clear shift towards higher maximum
temperatures is evident in the projected climate of the 2020s and 2050s relative to the baseline (Figure
(a) (b) (c)
(d) (e) (f)
0. 2 5
0.08
– 2 . 54
– 5 . 4 7 – 9 . 5 7
– 6 . 4 0 – 2 . 3 1
– 1 . 3 6 – 7 . 2 3 – 8 . 4 8
– 7 . 7 9 – 5 . 6 6
– 2 4 . 1 2 – 2 3 . 4 8
– 2 6 . 8 4 – 2 5 . 8 5
– 1 5 . 4 2 – 1 7 . 8 1
– 1 6 . 6 4 – 1 8 . 7 0 – 2 2 . 7 8
– 2 3 . 3 4 – 2 0. 4 8
– 2 2 .02

Patterns of Vulnerability in Silago, Southern Leyte
32
IV.17a). Apart from Silago experiencing more days with warmer daytime temperatures as indicated by the
change in the mean value or the peak of the PDF, there is also an increase in the minimum and maximum
values of daytime temperature indicated by the tails of the PDF. A similar trend can be observed in the PDF
of the minimum temperature which suggests the increase in the occurrence of warmer nights in the area
(Figure IV.17b).
Selected climate extreme indices are derived based on the temperature and rainfall-based indices
recommended by the CCl/CLIVAR Expert Team for Climate Change Detection Monitoring and Indices
(ETCCDMI) with user-defined thresholds (Peterson, 2005). A FORTRAN-based program called FClimDex,
was downloaded from http://cccma.seos.uvic.ca/ETCCDI/software.shtml, and used to perform data quality
control and to calculate the indices. A comparison of the changes in the indices will be conducted for Silago
across the three 30-year periods. Figure IV.18 shows the frequency distribution of the number of days in a
year within each of the 30-year period over the four points in Silago, where the maximum and minimum
temperatures exceeded thresholds we have defined. The thresholds have been selected from the 10th and 90th
percentiles of the maximum and minimum temperatures from the baseline climate in Silago.
In the 2020s, there are more years that have more than 120 days where the maximum temperature is greater
than 32.6 °C compared with the baseline (Figure IV.18a). This number increases in the 2050s where there are
years in this period with high daytime temperatures lasting almost throughout the year. This is consistent with
the trend in Figure IV.17a, where there are more hot days anticipated in Silago. On the other hand, all years in
the 2050s are simulated to have only up to 30 days where the daily maximum temperature is less than 26.0 °C
(Figure IV.18b).
(a) Tmax PDF at Silago (RegCM3)
0
0. 05
0. 1
0. 1 5
0. 2
0. 2 5
2 2 2 4 2 6 2 8 3 0 3 2 3 4 3 6 3 8 4 0
Prob
abili
ty
6 1 -90 1 0-3 9 4 0-6 9
Figure IV.17. Probability density functions of the monthly mean (a) daily maximum temperature, and (b) daily minimum temperature in Silago from the years 1961 to 1990, 2010 to 2039 and 2040 to 2069 from RegCM3.

Patterns of Vulnerability in Silago, Southern Leyte
33
(b) Tmin PDF at Silago (RegCM3)
0
0. 05
0. 1
0. 1 5
0. 2
0. 2 5
1 7 1 9 2 1 2 3 2 5 2 7 2 9 3 1 3 3
Prob
abili
ty
6 1 -90 1 0-3 9 4 0-6 9
Figure IV.17. Continued.
(a)
0
1 0
2 0
3 0
4 0
50
60
7 0
3 0 60 90 1 2 0 1 50 1 8 0 2 1 0 2 4 0 2 7 0
1 9 6 1 -1 9 9 02 01 0-2 03 92 04 0-2 06 9
(b)
0
20
40
60
80
1 00
1 2 0
1 4 0
30 60 90 1 2 0
1 96 1 -1 990201 0-2 0392040-2 069
Figure IV.18. Frequency distribution of days where the (a, b) daily maximum temperature and (c, d) daily minimum temperature exceeded defined thresholds in Silago from the years 1961 to 1990, 2010 to 2039 and 2040 to 2069 from RegCM3.

Patterns of Vulnerability in Silago, Southern Leyte
34
(c)
0
2 0
4 0
60
80
1 00
1 2 0
1 4 0
30 60 90 1 2 0 1 50
1 96 1 -1 9 902 01 0-2 03 92 04 0-2 069
(d)
0
1 0
2 0
30
4 0
50
60
7 0
30 60 90 1 2 0 1 50 1 8 0 2 1 0 2 4 0 2 7 0 300 330 360
1 96 1 -1 9 902 01 0-2 03 92 04 0-2 069
Figure IV.18. Continued.
Whereas in the baseline there are years with up to 150 days which have minimum temperatures lower than
22.6 °C, the projection for 2050s indicates most years to have a maximum of 60 days with cool night time
temperatures (Figure IV.18c). Interestingly, most of the 2050s is characterized by warmer nights (i.e. daily
minimum temperature greater than 25 °C) during half or the entire year (Figure IV.18d).
Changes in indices based on rainfall are also examined. Unlike the change in the temperature indices, there is
minimal difference in the distribution of years with periods where rainfall exceeds 10 mm across the three 30-
year periods (Figure IV.19). However, the trend is to have fewer years with long periods of wet days in the
future. The frequency distribution of the highest number of consecutive dry and wet days is shown in Figure
IV.20 and Figure IV.21. A notable difference among the three periods is that the occurrence of consecutive
dry days lasting more than 2 months is possible in the 2050s (Figure IV.20). On the other hand, there are
fewer instances of consecutive wet days that last for more than 1 month in the 2020s and 2050s (Figure
IV.21).
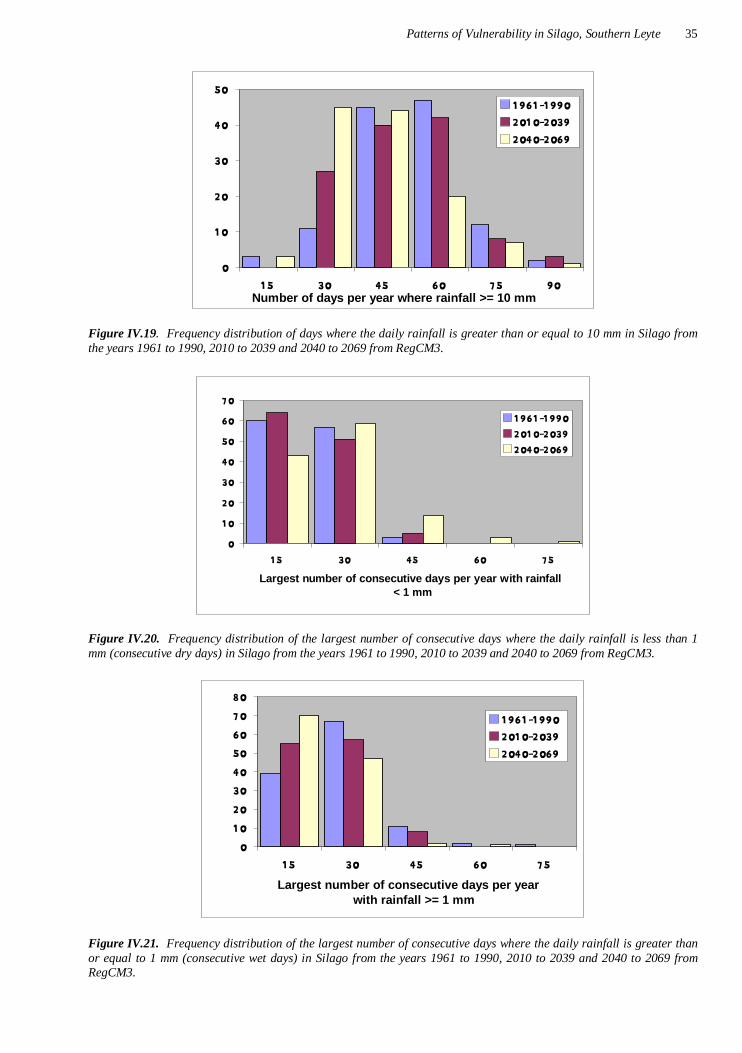
Patterns of Vulnerability in Silago, Southern Leyte
35
0
1 0
2 0
30
4 0
50
1 5 30 4 5 60 7 5 90Number of days per year where rainfall >= 10 mm
1 9 6 1 -1 9 902 01 0-2 03 92 04 0-2 069
Figure IV.19. Frequency distribution of days where the daily rainfall is greater than or equal to 10 mm in Silago from the years 1961 to 1990, 2010 to 2039 and 2040 to 2069 from RegCM3.
0
1 0
20
30
40
50
60
7 0
1 5 30 4 5 60 7 5
Largest number of consecutive days per year with rainfall < 1 mm
1 9 6 1 -1 9 9 02 01 0-2 03 92 04 0-2 06 9
Figure IV.20. Frequency distribution of the largest number of consecutive days where the daily rainfall is less than 1 mm (consecutive dry days) in Silago from the years 1961 to 1990, 2010 to 2039 and 2040 to 2069 from RegCM3.
0
1 0
2 0
30
4 0
50
60
7 0
8 0
1 5 30 4 5 60 7 5
Largest number of consecutive days per year with rainfall >= 1 mm
1 9 6 1 -1 9 902 01 0-2 03 92 04 0-2 069
Figure IV.21. Frequency distribution of the largest number of consecutive days where the daily rainfall is greater than or equal to 1 mm (consecutive wet days) in Silago from the years 1961 to 1990, 2010 to 2039 and 2040 to 2069 from RegCM3.

Patterns of Vulnerability in Silago, Southern Leyte
36

Patterns of Vulnerability in Silago, Southern Leyte
37
V. VULNERABILITY AND IMPACTS OF CLIMATE CHANGE ON THE FORESTRY SECTOR
A. THE FORESTRY SECTOR OF SILAGO
Leyte Island is part of the Eastern Visayas and was formed through geologic uplifting during the tertiary and
by a central, largely volcanic mountain ridge called the Leyte Cordillera, with its peak at Mt. Pangasugan
(1150 m asl) (Margraf and Milan, 1996; Scinicz, 2005). Leyte island and the neighboring islands of Samar,
Mindanao, and Bohol were most likely connected during the Pleistocene to form a single island called Greater
Mindanao. The faunal affinities of these islands to each other persist to this day (Heaney and Regalado,
1998).
There is little published literature on the biodiversity of forests in Leyte island. Margraf and Milan (1996) in
their reconstruction of the potential natural vegetation of the island, proposed the occurrence of 14 major
vegetation types, mainly forest formations, which include lowland dipterocarp forests, as well as swamp
forests that had been largely felled for timber and agricultural production. Deforestation in Leyte island in
recent years can be attributed to the clearing of forests for commercial and marginal upland agriculture, and
non-timber plantation establishment (mainly coconut)6. Settlement projects, agriculture and forestry
development projects and road construction were said to have also contributed to forest loss (Dargantes and
Koch, 1994). Forest clearing and repeated cultivation of root crops, abaca, banana, corn, coconut and use for
livestock production result in the formation of degraded lands dominated by grasses such as Chrysopogon
acicularis, Imperata cylindrica, Axonopus compressus or Saccharum spontaneum, (Quimio, 1996).
Dipterocarp forest remnants are now generally found in localities where large-scale logging was not profitable
and where access was hampered by the difficult terrain (Langerberger, 2006).
Agroforestry systems adopted by farmers in Leyte were broadly classified by Harrison et al. (2005b) as
coconuts and timber trees, coconuts and other products (e.g. fruit trees, livestock), timber trees and fruit trees,
and coconuts or timber trees and rice. Rice is widely grown on relatively flat coastal areas, while coconuts
and bananas are commonly planted in sloping land. Analysis done at the farm and parcel level by the same
authors showed the almost exclusive reliance on gmelina and mahogany for timber, and a resurgence in
coconut production, following the recovery of the copra price, with little recent planting of timber trees. Fruit
trees are typically a secondary crop on farms growing coconuts and timber trees and few farmers were
involved in abaca growing. On a farm and land parcel basis, there were indications that growing multiple
species provides income stability, increased self-sufficiency and some species complementarities, but the
6 There is information (www.forestry.denr.gov.ph) that a logging company once operated in Region 8, its Timber License Agreement (TLA) issued in 1972, with an annual allowable cut (AAC) of 80,000 m3, and an area of 26,000 has encompassing the towns of Hinunungan, St. Bernard, Silago and Sogod in Southern Leyte, and Baybay, Javier and Abuyog in Leyte; the TLA was cancelled in 1993 by the DENR due to the declaration of a logging moratorium.

Patterns of Vulnerability in Silago, Southern Leyte
38
economic and ecological benefits associated with agroforestry interactions is not taken full advantage of
(Harrison et al., 2005b).
At present, both natural forests and plantations are not able to fully provide local needs for wood in the region.
In the Eastern Visayas, log production for lumber had reached an annual average of 212,589.86 m3 per year,
but after the imposition of a logging moratorium in 1989, dropped to 4,391 m3 a year, causing a severe supply
shortage for all wood requirements (DENR, 1990). In Leyte province, timber from native species including
molave and narra has been decreasing, while the demand for high quality furniture and house construction is
increasing. Even the supply of exotic timbers from plantation forests would not be able to meet the shortage,
with wood-based industries procuring most of their timber from Cebu and Mindanao (Mangaoang et al.,
2005). The supply problem is further complicated by the strict implementation of the DENR policies against
illegal cutting of timber for forest preservation (Mangaoang et al., 2005).
Contemporary kaingin farming has a range of interpretations for upland communities in Leyte island, some of
them akin to ‘shifting cultivation’, (involving rotation of fields and a forest fallow period), but now usually
consistent with ‘slash and burn’ as a means to open new land, with most migrants actually practicing
sedentary agriculture, the end point being either perennial plantations or Imperata wastelands, the latter
“shifted” only in the sense of crop rotations and short-term fallow (Lawrence, 1997).
Forests are an important source of both subsistence and commercial goods. Lacuna-Richman (2003) reported
the heavy extraction of rattan (Calamus sp.) by households living in the forest margins of the town of Cienda
in Leyte province. Family members also take the opportunity to collect various non-wood forest products
(NWFP) for food, medicine and building materials for houses, while growing and harvesting abaca (Musa
textilis L.), in their kaingin plots in the forest margins. The same author reported the heavier use by poorer
families of various NWFP for food.
Within the production forests of Silago (estimated at 6,233.15 has based on latest perimeter survey) are two
Community-Based Forest Management (CBFM) projects, one managed by the Puntana Livelihood Project and
Environmental Development Association, Inc (PLPEDA) in Barangay Puntana, and the other by the
Katipunan Imelda Catmon Community Forestry Association (KICCFA) in Barangays Katipunan, Imelda and
Catmon. Based on 2003 records of the Department of Environment and Natural Resources, the KICCFA
CBFM area was measured at roughly 1,617 hectares with 110 households under its provisions. The KICCFA
currently manages 1,698 hectares of the common forest area of the three barangays (FLUP, March 2011).
The latest available data from the LGU shows that majority of the area is composed of growing forest trees,
while there are equal areas covered with matured and young forest trees (Table V.1). Meanwhile, the
PLPEDA CBFM area was 250 hectares, with 94 households under its jurisdiction
(http://forestry.denr.gov.ph/CBFMP.xls). These projects are monitored by the Municipal Environment and
Natural Resources Office (MENRO) and the Department of Environment and Natural Resources (DENR),

Patterns of Vulnerability in Silago, Southern Leyte
39
with funding sourced from non-government organizations (NGOs), particularly the German Technical
Cooperation (GTZ).
Table V.1. Types of forest trees in the KICCFA CBFM project site by estimated area and percent of total area.
Classification Percent of total area (%) Estimated area (ha) Young forest trees 20 339.60 Growing forest trees 60 1,018.80 Matured forest trees 20 339.60
TOTAL 100 1,698.00
The local government also launched an agroforestry program by distributing 3,000 assorted fruit bearing tree
seedlings, 10,000 coffee seedlings, 5,000 mangrove seedlings and 500 jackfruit seedlings. Forest-based
production activities include planting of indigenous and fruit bearing trees, weeding, cleaning, monitoring and
supervision of designated forest areas.
Langerberger (2006) reported that about 40% of the total land area of Leyte island was occupied by grasslands
and barren lands; 40% by coconut plantations and only 2% by primary forests. A land cover analysis done by
REIS (2009), on the other hand shows that, of the total surface area of 725, 810 ha, 31% of Leyte island is
covered with closed forest; 31% with perennial crop, 16% with annual crops, and the rest with pastures,
shrubland, and barren land (Table V.2). Table V.2. Percent land cover distribution of Leyte Island.
Land Cover Class Area (Ha) Percent Cover
Closed Forest 228,665.33 31.50 Mangrove Forest 6,567.31 0.90 Shrubs 53,957.19 7.43 Barren Land 5,133.39 0.71 Annual Crop 117,022.72 16.12 Perennial Crop 229,610.37 31.64 Pastures 71,979.91 9.92 Road, Settlement, Rivers 12,873.98 1.77
TOTAL 725,810.19 100.00 Source: REIS, 2009
Latest estimates for the area of classified forest land in Silago vary, from 12,939.98 hectares (according to the
mucipality’s draft Forest Land Use Plan (FLUP, March 2011)) to 14,653.22 hectares according to the
perimeter survey conducted by the Municipal Investigating Team (MIT) and used in the Draft CLUP (March
2011). While discrepancies are still yet to be reconciled, these values indicate that forestlands make up more
than half of the municipality`s total land area, showing the dominance of this ecosystem in the landscape.
However, as stated earlier in this report, declared forest lands may not be under actual forest cover.
An analysis of remotely sensed data by the GTZ (2009) shows that Silago has 9,677 has of closed forests,
which comprised almost half of the estimated total area of 19,610 has of the municipality, and 69% of the total
forest cover of the province of Southern Leyte (Table V.3).

Patterns of Vulnerability in Silago, Southern Leyte
40
Table V.3. Percent land cover distribution of Silago, Southern Leyte, GTZ (2009) data.
Land cover type* Area (ha) Percent Share of Silago (%) Grassland 70-coconut 30 1,004.16 5.12 Grassland 70-shrub 30 1,245.89 6.35 Shrubs 769.08 3.92 Shrubs 70-forest 30 1,710.00 8.72 Shrubs 70-coconut 30 370.73 1.89 Coconut 4,721.00 24.07 Settlements 111.91 0.57 Forest 9,677.59 49.35
TOTAL 19,610.36 100.00 * Based on percent canopy cover distribution of selected vegetation type Source: GTZ, 2009
The results of the land cover change analysis done for this study is shown in Table V.4. While our analysis
shows higher estimates of the area under forest compared with the GTZ study described earlier, what is
consistent is the predominance of this land cover in Silago, succeeded in decreasing order by scrubland (which
in this analysis, includes coconut plantations), paddy and urban. Forest cover loss based on this analysis is
estimated at a total of 1,340 ha, or a rate of about 148 ha per year over the last decade. In contrast, the other
land cover classes increased in area over time, with scrubland gaining the highest at about 123 ha/year,
followed by the other classes, at relative much lower rates of increase. The area for paddy fields may not be
reliable since the images were taken in different months. Paddies during the fallow season of wetland rice
could have been underreported in some images. Urban areas have expanded almost four-fold yet remain trifle
compared with the total area of Silago. If the classification holds true then it is evident that the forest area is
also becoming patchier, giving way to islands of scrubland and urban areas surrounded by forest (Figure V.1).
The impact of the newly-constructed Abuyog-Silago Road on land cover change may not yet be evident since
it has only been completed recently. But newer patches of non-forest has been observed in the 2009 image
that correspond to areas near farm to market roads (FMR) which became operational in the last 5 years (e.g.
Imelda FMR and Catmon FMR) (Figure V.2). Table V.4. Relative areas of cover classes resulting from supervised classification of LandSat 7 images and REIS (2009) data.
Cover class Hectares 2000 % 2003 % 2006 % 2009 %
Forest 17,437.278
79.00 17,698.193
80.00 15,200.725
69.00 16,097.128
73.00
Scrubland 4,087.722 18.00 5,219.246
24.00 5,828.931
26.00 5,197.281
24.00
Paddy 358.196 1.60 282.152
1.30 862.576
3.90 530.637
2.4
Urban 56.107 0.25 150.135
0.68 48.861
0.22 210.950
0.94
Others 177.538 0.81 130.841
0.59 - - - -

Patterns of Vulnerability in Silago, Southern Leyte
41
Recognizing the importance of conserving its forest resources, the town has been the site of reforestation
projects which were implemented through community-based forest management (CBFM). Such projects are
monitored by the Municipal Environment and Natural Resources Office (MENRO) and the Department of
Environment and Natural Resources (DENR), with funding sourced from non-government organizations
(NGOs), particularly the German Technical Cooperation (GTZ).
(a) 2000 (b) 2003
(c) 2004-2008 (d) 2009
Figure V.1. Land cover map of Silago, Southern Leyte. Legend: green: forest, brown: scrubland, yellow: paddy, red: urban, black: others.
In the absence of historical data, the analysis done serves as a preliminary investigation into the general
patterns of change among the chosen land cover types over the last decade. The accuracy of the estimates is
constrained by the availability of images with higher spatial resolution and low cloud cover, and validation
(ground-truthing) data which would greatly improve classification and change detection. The data from the
perimeter survey recently conducted by the MIT (Table V.5) indicate a lower forest cover (further classified
into types: primary forest, secondary forest and plantation forest) at around 58% of the total land area of the
municipality; still, this can be considered a good condition compared with background deforestation rates in
the Philippines. However, it is important to note that there are many insidious activities in forest lands such as
kaingin-making, timber poaching and fuelwood collection that occur in such a small scale that they escape
detection by remote-sensing techniques, and thus for Silago a better understanding of how these threats
operate at the local scale is needed.

Patterns of Vulnerability in Silago, Southern Leyte
42
(A) 2000 (B) 2009 Figure V.2.. Forest area in areas surrounding Abuyog-Silago Road in (A) 2000 and (B) 2009; forests became patchier near farm to market roads in Imelda and Catmon. Table V.5. General Land Use and Forest Cover Type by Land Classification, Silago, Southern Leyte, 2010.
Land Classification Total Area Percent FFL (Ha) A & D (Ha) Ha %
Natural Forest Closed (NFC) Primary Forest 5,929.41 33.12 5,962.53 27.10 Natural Forest Fragmented (NFF) Secondary Forest
6,196.82 365.86 6,565.54 29.84
Plantation /Production Forest 149.61 66.92 217.55 0.98 Grassland/ Brush land (GL/BL) 1,394.87 3,833.67 5,228.54 23.77 Cultivated Area (AC,CC) 380.03 5,338.28 5,718.31 25.99 Urban Use area 0.30 53.77 54.07 0.24 Road Network 3.45 85.45 88.90 0.40 Foot trail 0.44 7.80 8.24 0.03 Agro-Industrial 4.85 4.85 0.02 Water Use Area: Rivers Creeks
9.53 14.88
39.76 53.36
49.27 68.24
0.22 0.31
TOTAL 8,512.03 13,483.10 21,995.13 100.0 Source: Draft CLUP, 2011
LAND COVER CHANGE ANALYSIS
Recognizing the importance of land use as a dominant driver of change that encompasses the different sectors,
land cover change analysis using remote sensing and GIS was done to assess the extent of deforestation and
forest cover fragmentation in the landscape. Analysis was done for the period 2000-2009 using downloaded
satellite images (www.usgs.gov).
The succeeding section details the methods used to explore land cover change in the Municipality of Silago in
Southern Leyte Province from 2000 to 2009 using LandSat 7 images. For the period between 2003 and 2008,
the resulting land cover map from REIS’ Production of Enhanced Land Cover Map of Leyte Island Project
was used as proxy. Supervised Image classification was done using Envi 4.x. Gap-filling via vector editing
processes were done using ArcGIS 9.2. Results of unvalidated image classification and corresponding areas
are then presented.

Patterns of Vulnerability in Silago, Southern Leyte
43
Data acquisition
The best LandSat 7 images in WRS-2 Path/Row 113,53 with least cloud cover over the area of Silago where
selected and downloaded free from www.landsat.usgs.gov for the years 2000, 2003 and 2009. Specifically
scene ID # L71113053_05320001204 dated 4 December 2000, L71113053_05320030807 dated 7 August
2003 and L71113053_0532009072 dated 22 July 2009 (Figure V.3, Figure V.4 and Figure V.5). The
boundary delineation of the municipality used for this analysis was based on the area described in the
Cadastral Survey of the Municipality of Silago (Bureau of Lands), and was also compared (clipped) with the
shapefile data used in the municipality’s Land Use\ Barangay Development Plan (LU-BDP) to determine the
municipality`s official, undisputed boundary.
Figure V.3. L71113053_05320001204, 4 Dec. 2000, Bands 3, 2, 1.
Figure V.4. L71113053_05320030807, 7 Aug. 2003, Bands 3, 2, 1.
Figure V.5. L71113053_0532009072, 7 July 2009, Bands 3, 2, 1.

Patterns of Vulnerability in Silago, Southern Leyte
44
Pre-processing
Radiometric correction for Bands 1-5 and 7 of each image was done in ENVI by converting DN values to
radiance values. Spatial subsetting of each band to cover only the area of Silago (Figure V.6) was done for
more efficient processing. Stacks of RGB composites B145, B123, B753 and B321 were then prepared for
image classification.
Figure V.6. Subset of Landsat 7 image, RGB composite B753.
Image classification Training classes for classification were set for forests, scrubland, paddy fields and urban using the spectral
profiles (Figure V.7) of each class at specific band composites where these classes have highest contrast.
B145 was used for classifying forest and scrubland. B123 was used for classifying paddy while B753 was
used for classifying urban surfaces.
Figure V.7. Spectral plots of training classes with corresponding band composites.
Supervised classification was done using spectral angle mapper. Default values in Envi were used. Areas
eclipsed by cloud and shadow were assumed to be forest areas. Classes were then converted to vectors for
editing.

Patterns of Vulnerability in Silago, Southern Leyte
45
Post-classification
Vector editing was done in ArcGIS resulting to a harmonized land cover theme per satellite image acquired.
A gap-filled land cover theme for 2003 (b) was produced by intersecting its LandSat 7 gap masks with the
final land cover theme of year 2000 (a). As for the years between 2003 and 2008, the classification done by
REIS which used SPOT 5 image for Silago taken in 2004, 2006 and 2008 (REIS, 2009) was used as proxy.
The classes used by REIS where however simplified: ‘forest’ and ‘perennial crops’ were reclassified as forest,
‘pastures’ and ‘shrubs’ were reclassified to scrubland, ‘annual crops’ were reclassified to paddy and ‘barren
land’ was reclassified to urban (c). Gaps in the 2009 classified LandSat 7 image were gap-filled using the
reclassified REIS land cover map (d).
B. IMPACT CHAIN, INFLUENCE DIAGRAM, AND INDICATOR DATA FOR THE FORESTRY
SECTOR OF SILAGO
Impact Chain Figure V.8 shows the refinement of the Pre-Analysis Impact Chains for the Forestry sector. The scoping
process with the LGU and other stakeholder of Silago led to the identification of the exposure units and direct
and indirect climate impacts that are deemed most relevant for the municipality. Further data collection
efforts however showed that there was little substantive information on hand to support quantitative
assessments at the level of the municipality, especially with regards to measures of direct and indirect impacts. Influence diagram Climate variables (rainfall and temperature; the effects of increased atmospheric CO2 concentrations was not
considered here) affect ecophysiologal processes and ecosystem functions and properties which eventually
would influence the way forests deliver the different services derived by both local communities in Silago and
downstream users (Figure V.9). For Silago these important ecosystem services include the provision of goods
(food, fuelwood and non-timber forest products), regulation of the flow and quality of water (considering the
high dependence of the municipality on surface flows for its water and the absence of efficient storage and
distribution infrastructure), and influences on soil formation and nutrient recovery (agriculture being the major
source of livelihood), all of which have direct and indirect impacts on human well-being. However, the
vulnerability of forests and forest ecosystem services to future climate impacts would be largely affected by
current threats of deforestation and forest degradation. Silago’s forests remained intact probably due to the
area’s inaccessibility for (commercial) logging operations in the past. Based on the information gathered,
among the current important drivers of deforestation and degradation are the expansion of farming activities in
forest lands; the current scarcity of timber in the region in the face of increasing demands for wood for
construction and other uses, and road construction, particularly the Junction Abuyog-Silago junction road.

Patterns of Vulnerability in Silago, Southern Leyte
46
The potential direct and indirect damage of the construction of the new road to forests have been described
earlier; socioeconomic impacts, such as the greater integration of the municipality with the regional economy
would also likely further enhance the effects of land use change and links with demand for food and other
agricultural products, creating pressures to clear more forest land. The resulting changes in land use would
have consequences for the other priority sectors of the municipality.
Figure V.8. Impact chain for forestry sector of Silago, Southern Leyte.

Patterns of Vulnerability in Silago, Southern Leyte
47
Figure V.9. Influence diagram for the forestry sector of Silago. C. CLIMATE IMPACTS AND PATTERNS OF VULNERABILITY
One key vulnerability of Silago to climate change lies in its fresh water sector, the anthropogenic link between
these two being land cover change. More forest cover means more freshwater sources. However it should
also be noted that the significant threshold relating forest cover and springflow/streamflow production is still
poorly understood. Although the volume of rainfall infiltrating into Silago’s forest soils can be easily
modelled, how these infiltrated water is partitioned underground is still a subject of a baseline study which, at
least, requires measuring springflow rates, and ideally, mapping the aquifer structure. Only then can one fully
understand the relationship between forest and the fresh water sector in the municipality.
In the context of Silago which is a municipality highly dependent on springs for both domestic use and
irrigation needs, a continuing decrease in forest cover may result in the long-term to decreased aquifer
recharge, spring flow and base flow and instead lead to increased runoff production, erosion and siltation.
Conversion to urban, impermeable surfaces completely translates rainfall to runoff.
The absence of meters in the existing distribution system makes it difficult to ascertain the current demand for
water in the Municipality, as well as project the future demand. At present, rough estimates indicate that there
is a potentially large supply of water in Silago. However, climate-sensitive variables are also present,
particularly 1) the incidence of enteric waterborne diseases, and 2) water siltation. Incidence of enteric

Patterns of Vulnerability in Silago, Southern Leyte
48
waterborne diseases can be exacerbated by the presence of favorable climatic (i.e. temperature, moisture) and
other environmental conditions. Meanwhile, siltation – although also greatly affected by land use change – is
aggravated by climate stimuli such as increase in rainfall, strong winds and occurrence of extreme climate
events.
Although we cannot categorically state how much forest cover is actually needed to sustain ample water
supply for the needs of the Municipality’s current and future population, it is evident that the urgent need of
the hydro-forest sector is the establishment of an improved distribution network to maximize the use of the
currently underutilized water resources.
A note regarding forest cover and hazards. Although Silago lies along a major faultline traversing Southern
Leyte, there are no significant settlements near the faultzone. While landslides have been linked to
deforestation and land degradation processes, important information on geology and soil properties specific to
the municipality need to be obtained to clarify interactions between forest land use, climate and the occurrence
of these hazards.
Indicator Data Considering current inadequacies of basic data, local priorities for assessment, and resource limitations for
data collection, the following set of indicator data for analyzing climate impacts and vulnerability and possible
sources are identified (Table V.6). Table V.6. Possible indicators of vulnerability to climate variability and climate change of the forestry sector.
Component of Vulnerability Parameter Proxy/Auxiliary Parameter
Possible Data Source
Exposure Rainfall time series Measured rainfall or proxy from the nearest PAGASA station
Land use change (High resolution)
National mapping authority (NAMRIA)
Land cover fragmentation
National mapping authority (NAMRIA),
Timber and NFTP utilization
Production/ Harvest Data
Municipal Environment and Natural Resources Office (MENRO) (based on local monitoring records)
Sensitivity Biodiversity Floristic Inventory Expert assessment/
Biodiversity assessment Productivity Stand (Volume)
Inventory MENRO/ Local forest inventory
Stand Biomass Assessment
MENRO/ Local forest inventory
Soil properties In-situ saturated
hydraulic conductivity Field measurements, laboratory procedures
Geologic profile MENRO and Bureau of Mines

Patterns of Vulnerability in Silago, Southern Leyte
49
D. ADAPTATION AND MITIGATION OPTIONS FOR THE FOREST SECTOR OF SILAGO
Adaptation Options for the Forestry Sector of Silago: Some Considerations In implementing forest adaptation, it is important to account for local variations, i.e. differences in
geographical and population characteristics among barangays or sub-watersheds, when establishing adaptation
plans and policies. While it may be considered difficult, impractical and costly, peculiarities in different
localities need to be considered to allow successful implementation of adaptation measures. In order to do
this, local institutions and stakeholders need to become more involved in the adoption of adaptation strategies,
from planning and implementation to monitoring and evaluation; the involvement of local people especially
for the latter two activities (M & E) becoming all the more important given the scarcity of available
information and the limited resources that the local government may have for data collection efforts.
Strengthening local institutions and establishing a greater sense of ownership and access among stakeholders
are instrumental in adaptation implementation; in this aspect the municipality may have already some gains
with the implementation of CBFM projects; the critical part would be in involving those lasting
networks/institutions within this sector that would play a role in sustaining programs after external agencies
withdraw support, and in the face of changing policies on forest lands and forest resource utilization.
Adaptation options for the forestry sector are hinged on the priority development needs of Silago; poverty in
the municipality must be addressed to lend greater adaptive capacity to present- and future climate stresses.
The importance of forest ecosystems to the local economy and the environment should therefore be
realistically viewed within the context of the specific development goals of the different sectors of the
municipality; this means that certain trade-offs may occur between development priorities vs. adaptation
strategies for forests. An example given here are the results of the evaluation of the effects of selected
adaptation strategies for the forest and agriculture sector on other sectors of the Pantabangan- Carranglan
watershed (Table V.6) (Cruz et al., 2005).
It is also possible to come up with complementary strategies that would contribute to reducing the
vulnerability of forests and forest- dependent communities at the same time create new opportunities for
improved livelihoods. Agroforestry technologies, for instance could be tapped for their potential to address
multiple problems in forest lands such as soil erosion, land degradation, food security and provision of
additional/ alternative sources of incomes while contributing to the resilience of the system (see Box V.1
below).
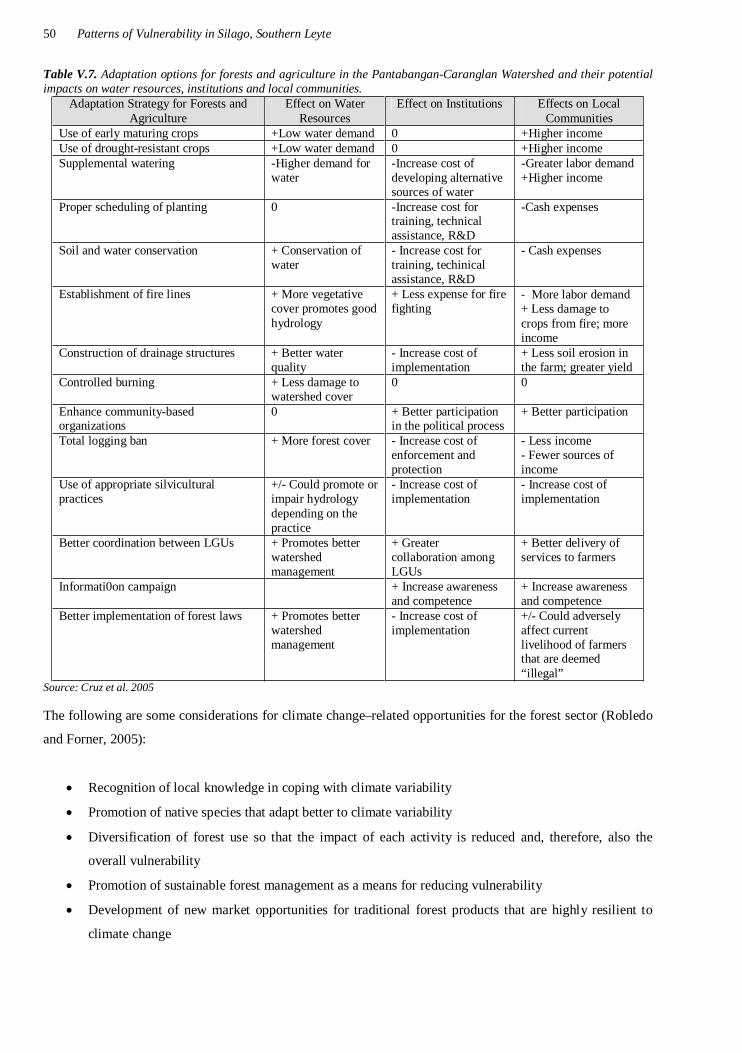
Patterns of Vulnerability in Silago, Southern Leyte
50
Table V.7. Adaptation options for forests and agriculture in the Pantabangan-Caranglan Watershed and their potential impacts on water resources, institutions and local communities.
Adaptation Strategy for Forests and Agriculture
Effect on Water Resources
Effect on Institutions Effects on Local Communities
Use of early maturing crops +Low water demand 0 +Higher income Use of drought-resistant crops +Low water demand 0 +Higher income Supplemental watering -Higher demand for
water -Increase cost of developing alternative sources of water
-Greater labor demand +Higher income
Proper scheduling of planting 0 -Increase cost for training, technical assistance, R&D
-Cash expenses
Soil and water conservation + Conservation of water
- Increase cost for training, techinical assistance, R&D
- Cash expenses
Establishment of fire lines + More vegetative cover promotes good hydrology
+ Less expense for fire fighting
- More labor demand + Less damage to crops from fire; more income
Construction of drainage structures + Better water quality
- Increase cost of implementation
+ Less soil erosion in the farm; greater yield
Controlled burning + Less damage to watershed cover
0 0
Enhance community-based organizations
0 + Better participation in the political process
+ Better participation
Total logging ban + More forest cover - Increase cost of enforcement and protection
- Less income - Fewer sources of income
Use of appropriate silvicultural practices
+/- Could promote or impair hydrology depending on the practice
- Increase cost of implementation
- Increase cost of implementation
Better coordination between LGUs + Promotes better watershed management
+ Greater collaboration among LGUs
+ Better delivery of services to farmers
Informati0on campaign + Increase awareness and competence
+ Increase awareness and competence
Better implementation of forest laws + Promotes better watershed management
- Increase cost of implementation
+/- Could adversely affect current livelihood of farmers that are deemed “illegal”
Source: Cruz et al. 2005 The following are some considerations for climate change–related opportunities for the forest sector (Robledo
and Forner, 2005):
Recognition of local knowledge in coping with climate variability
Promotion of native species that adapt better to climate variability
Diversification of forest use so that the impact of each activity is reduced and, therefore, also the
overall vulnerability
Promotion of sustainable forest management as a means for reducing vulnerability
Development of new market opportunities for traditional forest products that are highly resilient to
climate change

Patterns of Vulnerability in Silago, Southern Leyte
51
Sustainable forest management as a means for reducing GHG emissions and for enhancing carbon
sinks.
Box V.1. Agroforestry options for Silago Agroforestry is the practice of incorporating trees on farms. Trees on farms enhance the coping capacity of small
farmers to climate risks through crop and income diversification, soil and water conservation and efficient nutrient
cycling and conservation (Lasco and Pulhin, 2009). Agroforestry offers a means for diversifying production
systems and increasing smallholder farms` agility in respond to climate changes because tree-based systems have
the following characteristics and properties (Verchot et al., 2007):
deep root systems that are able to explore larger soil volume for water and nutrients (helpful during
droughts)
increased soil porosity, reduced runoff and increased soil cover lead to increased water infiltration and
retention in the soil profile that reduces moisture stress during low rainfall years
higher evapotanspiration rates than row crops or pastures can maintain aerated soil conditions by pumping
excess water out of the soil profile more rapidly than other production systems
often produce crops of higher value than (annual) row crops
Diversifying the production system to include a significant tree component may buffer against income risks
associated with climate variability. In addition to all these advantages, agroforestry management systems offer
opportunities for synergies between adaptation and mitigation strategies.
Silago has an abundance of coconut plantations, also producing a small yield of bananas. A study by Magat (2007)
discusses the suitable pairing of coconut and banana under an agroforestry system, since the two do not compete for
soil resources (except in dry areas). With over 5,000 hectares of land dedicated to coconut production, there is
potential to increase incomes through interplanting in areas previously mono-cropped. The additional income from
the sale of banana and its processed forms could help augment household income. In doing so, the farming family
becomes better equipped to avail of necessary goods and services in the face of climate –related stresses. Similarly,
rubber-based agroforestry systems (RAS) like those in Mindanao can also provide alternative income prospects for
smallholder farmers.
Correspondence with the LGU of Silago revealed intent to develop rubber plantations in the municipality. The
rubber tree (Heava brasiliensis) grows in all soil types with year-round rainfall. Although these plans have not yet
materialized, there is good demand for rubber latex both in local and export markets. In 2005, cup lump (naturally
coagulated) rubber latex sold for PhP 14.26 per kilogram (BAS, 2010). According to the Department of
Agriculture, typical yield is 1 to 1.8 tons of dry rubber per hectare per year (Young undated). The suitability of
these suggested technologies/production systems to anticipated changes in climate in the municipality should of
course need to be assessed.

Patterns of Vulnerability in Silago, Southern Leyte
52
Reducing Emissions from Deforestation and Forest Degradation (REDD)
Reducing Emissions from Deforestation and Forest Degradation (REDD) was conceptualized at the 11th
Conference of Parties (COP) in Montreal in December 2005. The aim of the agenda was to reduce carbon
dioxide emissions from land use and land use change by assigning financial value to carbon stored in forests.
Aside from encouraging mitigation of carbon emissions, the corresponding income from carbon storage also
doubles as an adaptation for the communities that stand to benefit from the monetary returns. With Silago’s
more than 12,000 hectares of forest land, including almost two thousand hectares under CBFM,
implementation of REDD initiatives in the municipality – once materialized – could present viable alternative
sources of income for locals involved in forest conservation and protection. REDD activities could be
beneficial for adaptation, but badly designed projects could deprive people of their main sources of
livelihoods (Guarigata et al., 2008) and leave out food security issues (DeFries and Rosenzweig, 2010).