Embed Size (px)
Citation preview

322ATTACHMENT B
I=UNDING IMPACT STATEMENT- RATES
Waihi Beach Coastal Protection The Waihi Beach Coa stal Protection rates are d ifferential targeted rates set under section 16 and 117 of t he Local Government (Rating) Act 2002. The Waihi Beach Coast al Protection targeted rate pa rt funds
coast al p rotection in Waihi Beach. The different categories of land are based on the p rovis ion services p rovided by Council. The t argeted rates are on all properties in t he Waihi Beach area or defined areas of
benefit. Lump sum contributions are invited in respect of Waihi Beach Rock revetment w ithin the defined areas of benefit in lieu of future payments of the capital 'Uniform Target ed Rat e' (UTR).
The different cat egories of land and rates are outlined in the table be low.
SOURCE DII=I=ERENTIAL CATEGORIES MATTERS !=ACTOR 2017/18 AMOUNT($) 2018/19 ANNUALPLAN ANNUALPLAN
Waihi Beach Coastal Protection
Total Waihi Beach Coastal Protection
Omokoroa Greenwaste
Rock revetment- O perational
Rock revetment - Capital
Rock reve tment capital lump sum
(optiona l)*
- Ward area
Dunes northern end
Dunes G len Isla Place
Loca ti on of land and provision or
availabili ty of service
Location of land and provision o r
ava ilability of service
Location of land and provision or
availabil it y of service
Location of land and provision or
availability of service
Locat ion of land and provision or
availability of service
~x tent of service p rovision
~xtent of serv ice provision
~xtent of serv ice provision
~xtent of service provision
~xtent of serv ice p rovision
REVENUE REVENUE
($) ($)
8,644 166.37
39.685 1,313.60
............................................................. ··········
17.489.00
4 2.4 26 14.10
13,740 2,236.77
4 .307 624.53
108,802
The O mokoroa greenwaste rates are d ifferent ia l targeted ra tes set under sect ion 16 of the Loca l Government (Rat ing) Act 2002.
The Omokoroa greenwast e targeted rate part fund s greenwaste facilities. The targeted rat es are on all properties in the O mokoroa com munity board defined area of benefit.
Omokoroa greenwaste Location Fixed amount pe r rating unit
8,818
34.154
42 .949
51.446
4.372
~UN DING IMPACT STATE~IENTS AND OH-lER RATING IN~ORMATION I FIN ANCIALS I CHAPTER FOUR I 316

323ATTACHMENT B
I=UNDING IMPACT STATI:MI:NT- RATI:S
Stormwater
Stormwater rates are differential ta rgeted ra tes set under sect ion 16 of the Loca l Government (Rat ing) Act 2002. Stormwater targeted rate part funds stormwater in defined areas of benefit. The d iffe rent
categor ies of land are based on the provision services provided by Counci l. The targeted rates are on al l properties in defined areas of benefit.
The different categories of land and rates are ou tlin ed in the tabl e below.
SOURCE DIFFERENTIAL CATEGORIES MATTERS FACTOR 2017/18 AMOUNT($) 2018/19 ANNUALPLAN ANNUALPLAN REVENUE REVENUE
($) ($)
Stormwater Kauri Point Location of land and provision or ~ixed amount per rating unit 13.441 165.94 13.441
availability of serv ice ................. . ................ ----·- - ·--· --· ·· ...................•••••.• .. ······ ············ ······· .............. ., ............. . . ...
Tanners Point Location of land and provision or ~ixed amount per rating unit 18,087 165.94 18,253
availability of service ·············•·············· ........... -·-- .. . ························· _ ..................................... . .. ... ····· ··············· ········· ..... . ..
Te Puna Locat ion of land and provision or ~ixed amount per rating unit 23,232 165.94 23,066
availability of service -· -···-·········--·-··· -- ·····
Pukehina Location of land and provision o r ~ixed amount per rating unit 105,870 165.94 106,202
availability of service ............ ··· ···-· ·-·· .•
Waihi Beach Location of land and provision or ~ixed amount per rating unit 1,154.782 389.34 1,175.417
availabi lity of service --···-·········· ·····-········-········-············· .. ... ....... ·················· ·-· ······ ···
Katikati Locat ion of land and provision or ~ixed amount per rating unit 795.032 389.34 787,245
availabi lity of service ··-···-·······-···········-····-·- ··············· . . .... ... ··························· ·· ·•··
Omokoroa Location of land and provision or ~ixed amount per rating unit 522,884 389.34 572.719
availability of service ......... . .. ... ---···- ...... ·-··-· .................. . . ...
Ongare Point Location of land and provision or ~ixed amount per rating unit 8,463 165.94 9,127
availability of service ..... ···-········---···· ········· .. ··· ······· .... .. .............. .... .............. ...........
Tuapiro Point Locat ion of land and provision or ~i xed amount per rating unit 4,149 165.94 4.149
ava ilability of serv ice ., ,. ,., ,,_,,_., . ., ••• --.. ··-•u"""" .. .. .....
Te Puke Location of land and provision or ~ixed amount per rating unit 1,ll1,955 389.34 1,118,963
availability of service
317 I CHAPTER FOUR I FINANCIALS I FUNDING IMPACT STATEM ENTS AND OTHER RATING INFORMATION

324ATTACHMENT B
I=UNDING IMPACT STATEMENT- RATES
SOURCE DIFFERENTIAL CATEGORIES MATTERS FACTOR 2017/18 AMOUNT($) 2018/19
Stormwater (Cont) Paengaroa
Maketu
Minden
Total Stormwater
Land Drainage
... ..... ......
Location of land and provision or
availabi lity of serv ice
Locati on of land and provision or
availability of service
Location of land and provision or
ava ilability of service
~ixed amount per rating unit
~i xed amount per rating unit
~i xed amount per rat ing unit
ANNUALPLAN ANNUALPLAN REVENUE REVENUE
($) ($)
49.782 165.94 50.778
80 ,647 165.94 80,647
3,888,324 3,960,007
Land Drainage rates are differential target ed rat es set under section 16 of the Loca l Governm ent (Rating) Act 2002. Land Drainage target ed rat e part fund land drainage in Little Wa ihi defined areas of benefit
The d ifferent categories of land are based on th e provision of services provided by Council. The targeted rates are on all properties in defined areas of benefi t
The different categories of land and rates are outlined in the tab le below.
SOURCE DIFFERENTIAL CATEGORIES MATTERS FACTOR 2017/18 AMOUNT($) 2018/19 ANNUALPLAN ANNUALPLAN REVENUE REVENUE
($) ($)
Land Drainage Land Drainage - drains c lass A Locati on of land and provision o r Per hectare of each rating unit 136.792 28.15 116,887
availabi li ty of service ................................. ....... ········ ..................................................... ....................................................... ........................................................ ................................. ........ ································································· .................................. ............
Land Dra inage - drains class B Location of land and provision or Per hectare of each rating unit 1,467 12.24 1,248
avail ability of serv ice ····························· ......................... ·················· ....................... ................ ............................................... ,., .............. ........... ............................. ........................................... ....... ......... ........ ....... .................... ..... .....................................
Land Drain age - pumps class A Locat ion of land and provision o r Per hectare of each ra t ing unit 188,398 89.96 173,091
availability of service ............... ················ .................................................. ... . .......... ........ . ................. ... .. .. ... ................ . ........................... ........ . ................................ .................. . .... ........................................................................................................................................
Land Drainage - pumps class B Location of land and provision or Per hecta re of each rating unit 6,877 67.47 6,275
avail ability of serv ice ..... .. ...................................... ...... .. . ................................. . ................. .. ..... .... ... .... .............. . ................................................................................ .............................................. . .............................. . ....................................................................................
Land Drainage - pumps class C Locat ion of land and provision o r Per hectare of each rati ng unit 6,645 47.13 6,079
availability of service --Total Land Drainage 340,179 303,581
~UNDING IMPACT STAH:MJ;NTS AND OTHJ;R RATING IN~ORMATION I ~ I NANC IALS I CHAPTJ;R ~OUR I 318

325ATTACHMENT B
J=UNDING IMPACT STATtMtNT- RATtS
Community l-lalls
Community f-iall rates are differential targeted ra tes set under sect ion 16 of the Loca l Government (Rating) Act 2002.
Community f.i all t argeted rate part fund Community f.i a ll s in defined areas of benefit. The different categories of land are based on the provision of serv ices provided by Council. The targeted rates are on
all properties in defined areas of benefit.
T he different ca tegories o f land and rates are outlined in the table below.
SOURCE DII=I=ERENTIAL CATEGORIES MATTERS !=ACTOR 2017/18 AMOUNT($) 2018/19 ANNUAL PLAN ANNUAL PLAN REVENUE REVENUE
($) ($)
Community l-lalls Katikati War M emorial f.i all Loca tion of land and provision or f=i xed amount per rating unit 30,611 ?.00 30,849
ava ilability of service .................. .. ....... . .. ...
Te Puna War Memorial f.i all Location of land an d provision or f=i xed amount per rating unit
availability of serv ice ....... . ....
Te Puna Community Centre Locat ion of land and p rov ision or f=ixed amount per rating unit 2,754 22.21 30,865
ava ilability of service ....... ....... ·· -- . ... ............ ············· ..... .•. ... ...............
Paengaroa f.i all Locat ion of land an d provision or f=ixed amount per rating unit 11,322 45.99 31,136
ava ilability of service ······ ... ··- ·· ················· . ··-····· ·····
Pukehina Beach Community Centre Location of land and provision or f=i xed amount per rat ing unit 2,550 5.62 4.590
ava ilability of service . ..................... .. ........................... . .... . ....
Pukehina f.i all Location of land and provision or f=i xed amount per rating unit
availability of service ........... ............
Oropi War M emorial f.i all Location of land and provision or f=i xed amount per rating unit 24,945 45.11 24,945
availability of service ........
Kaimai f.i a ll Location of land and provision or f= ixed amount per rating unit 2,122 13.03 5,304
ava ilability of serv ice .............................. .................. ......... ... ··· ··· ··········
Omanawa f.iall Locat ion of land and provision or f=ixed amount per ra ting unit 3,876 36.1 7 15,300
avai labil ity of service ..................... ............ . .............. . ...... .....................
Te Ranga f.i all Location of land and provision or f=i xed amount per rating unit 2,040 42.84 5,998
availability of service ... ···-·· ........ .. ···· ···· ·· --· .............
Te Puke War Memorial and Sett lers f-i al l Loca tion of land and provision or f=i xed amount per rating unit 106,834 26.17 103,478
ava ilability of serv ice
319 I Cl-lAPTER ~OUR I ~INANCIALS I ~UNO ING IMPACT STAT!;M~NTS AND OTH~R RATING IN~ORMATION
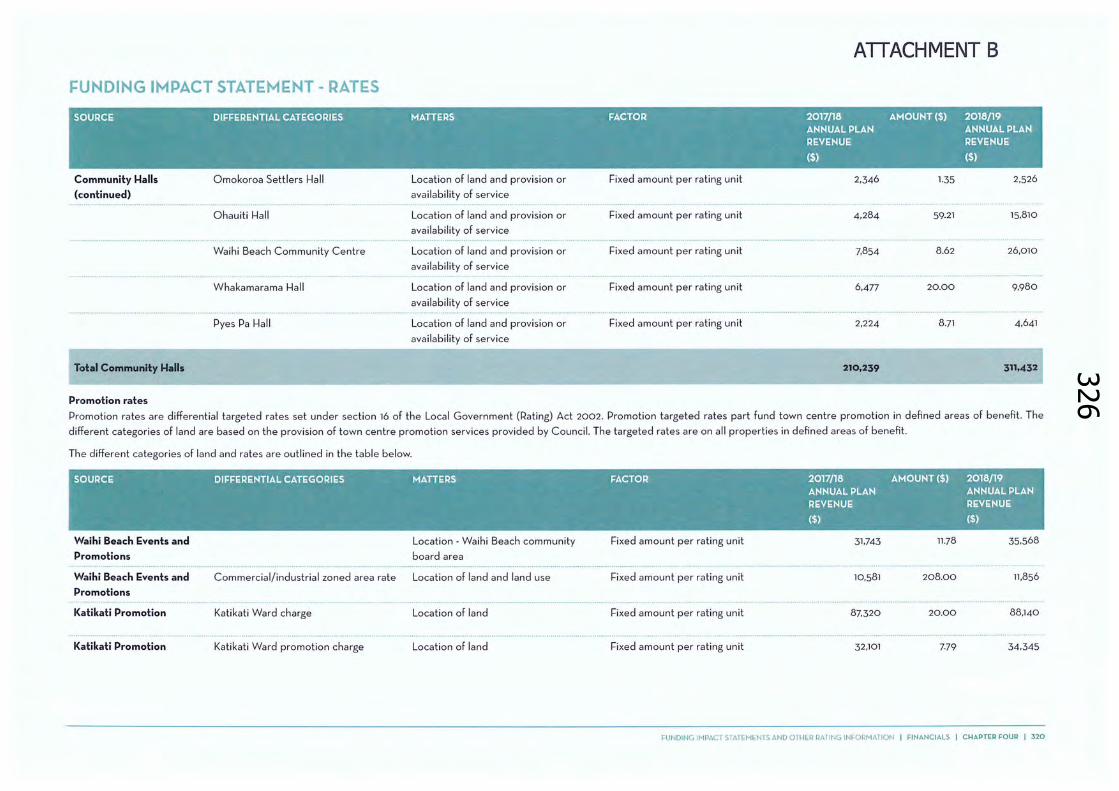
326ATTACHMENT B
I=UNDING IMPACT STATI:MI:NT- RATI:S
SOURCE DIFFERENTIAL CATEGORIES MATTERS FACTOR 2017/18 AMOUNT($) 2018/19
Community 1-lalls
(continued)
. ················••················ ······························
·················· ...... .
Total Community 1-lalls
Promotion rates
O mokoroa Settl ers f-lail Location of land and provision or
ava ilab ility of service
Ohaui t i f-l ail Locat ion of land and prov ision or
ava ilability of service ....
Waihi Beach Community Centre Location of land and prov ision or
ava ilabili ty of serv ice .. . .............................
W hakamarama f-l ail Location of land and prov ision or
ava ilability of service ... .... . .. . ..............
Pyes Pa f-l ail Location of land and provision or
ava ilab ility of service
ANNUAL PLAN ANNUAL PLAN REVENUE REVENUE
($) ($)
f=i xed amount per rating unit 2,346 1.35 2.526
······· ........... ···-·· .......... ·•················ ...... ............
f=i xed amount per rat ing unit 4,284 59.21 15,810
Fixed amount per ra ting unit 7,854 8 .62 26,010
....... .......
Fixed amount per ra ting unit 6.477 20.00 9.980
.. ....................................... . ........ .. ... . ... ...... ............
f=i xed amount per rating unit 2,224 8.]1 4.641
-210,239 311,4 32
Promotion rates are differential targeted rates set under sect ion 16 of the Loca l Government (Rating) Act 2002. Promotion targeted rat es part fund town centre promotion in defined areas of benefit. The
different cat egories of land are based on the p rovision of town centre promotion services provided by Counc il. The targeted rat es are on all properti es in defined areas of benefit.
Th e different ca tegories of land and rates are outlined in the table below.
SOURCE DIFFERENTIAL CATEGORIES MATTERS FACTOR 2017/18 AMOUNT($) 2018/19 ANNUAL PLAN ANNUAL PLAN REVENUE REVENUE
($) ($)
Waihi Beach Events and Location - Wa ihi Beach communi ty Fixed amount per rating unit 31,74 3 11 .78 35.568
Promotions board area ........ . .......... . ...... ····· ..........................
Waihi Beach Events and Commercial/ industrial zoned area rate Location of land and land use f=i xed amount per rat ing uni t 10,581 208.00 11 ,856
Promotions ··-·· ......... .... .. ... .. ... . ..................... . ............................. ..................... ......
Katikati Promotion Kat ikati Wa rd charge Location of land Fixed amount per rating un it 87.320 20.00 88,140
Katikati Promotion Kati kati Wa rd promotion charge Location of land Fi xed amount per ra ting unit 32,10 1 7.79 34.345
I'UNOING IMPACT STAH~MtNTS AND OTHtR RATING INI'OR~IATION I FINANCIALS I CHAPTER FOUR I 320

327ATTACHMENT B
~UNDING IMPACT STATI::MI::NT- RATI::S
SOURCE DIFFERENTIAL CATEGORIES MATTERS FACTOR 2017/18 AMOUNT($) 2018/19
Katikati Promotion
Omokoroa Promotion
Te Puke Promotion
Te Puke Promotion
Te Puke Promotion
Total Town Centre
~otion rates
Development Fund Rates
Commercia l/industrial zoned area ra te Location of land and land use
O mokoroa Town Cent re rat e
Te Puke promotion cha rge
Location of land
Locat ion of land -
Te Puke
Te Puke promotion cha rge Location of land - Maketu
Com mercial/ industrial zoned area rat e Locat ion of land and land use
i=ixed amount per rating unit
i=i xed amount pe r rati ng unit
i= ixed amount per ra ti ng unit
i=i xed amount per rat ing unit
i=i xed amount per rati ng unit
Development fund rates are uniform targeted rates set under section 16 of the Loca l Government (Rating) Act 2002.
ANNUAL PLAN ANNUAL PLAN REVENUE REVENUE
($) ($)
40 ,854 310.00 43.710
42.966 12-42 49.099
16,280 5.84 18 ,604
33,0 13 173.85 37.725
294,858 319,047
Promot ion t argeted ra tes pa rt fund Pukeh ina development in defi ned areas of benefit. The different ca tegories of land are based on land use and services p rovided by Council. The targeted ra tes are on all
p ropert ies in defined areas of benefit.
Th e different categories of land and rates are o utlined in t he table be low.
Pukehina development
rate Residential Land use
321 I CHAPT~R FOUR I FINANCIALS I FUNDING IMPACT STAT~M~NTS AND OTH~R RATING INFORMATION
•
i=ixed amount per rating unit 12,600 20.00 12,600

328ATIACHMENT B
I=UNDING IMPACT STATI::MI::NT- RATI::S Pukehina Beach Protection rate Pukehina Beach Protect ion rates are differential t argeted rates set under sect ion 16 of the Loca l Government (Rating) Act 2002.
Pukehina Beach Protection targeted ra tes pa rt fund Pukehina beach protect ion in defined areas of benefit. The different categor ies of land are based on locati on of land. The t argeted rat es are on all properties
in defin ed areas of benefit
The d ifferent categori es of land and rates are out lined in the tab le below.
SOURCE DII=I=ERENTIAL CATEGORIES MATTERS !=ACTOR 2017/18 AMOUNT($) 2018/19 ANNUAL PLAN ANNUAL PLAN REVENUE REVENUE
($) ($)
Pukehina beach Coastal Location !=ixed amount per rating unit 12,248 46.02 12,240
protection ''' ,,, .................................................................... ·························-··········· ......................... ............................... .. ......... . ........
Pukehina beach Inland Location !=ixed amount per rating unit 3 .060 8.23 3 .060
protection
Total Pukehina Beach 1r Protection
15,308
Community Development and grants Community Developm ent and grants rates are differential target ed rat es set under sect ion 16 of the Loca l Government (Rating) Act 20 02. Promoti on t argeted rates part fund t he communities act ivity The
different cat egor ies of land are based on locati on of land. The t argeted rates are on all p ropert ies in defin ed areas of benefit.
The different ca tegories of land and rates are outlined in the table below.
SOURCE DII=I=ERENTIAL CATEGORIES MATTERS I= ACTOR 2017/18 AMOUNT($) 2018/19
Katikati resource centre
Katikati resource centre
Heritage Museum
Heritage Museum
Total Community Development and
Katikati
Wa ihi Beach
Katikati
District-w ide
Location - Kat ikati community board
area
Locati on - Wa hi Beach community
boa rd area
Location - Katikati community boa rd
area
A ll rateable land within t he District
ANNUALPLAN ANNUALPLAN REVENUE REVENUE
($) ($)
!=ixed amount per rat ing unit 14.6 11 3 .32 14,611
.. ...... . ··············· ····· ...... . !=ixed amount per rat ing unit 4 .870 1.61 4.870
!=ixed amount per rat ing unit 8.10 35.700
!=i xed amount per rating unit 30.600 1.65 35.700
50,081 90,881
grant~s~--------------------------------------------------~----------------~------------------------------------------------------------------------~--------•
I'UNDING IMPACT STAT~M~NTS AND OTH@ RATING INI'ORM ATION I FINANCIALS I CHAPT£R FOUR I 322

329RATES EXAMPLES
To see what Council's rating approach could mean for you r rates we have put together a few examples
of t he effect on the rates of t yp ica l properties across the District.
Six different property t ypes were chosen and a range of low, med ium and high lan d and capital va lues
were assigned to each type. The three examples per property t ype should enable you to get a fair idea
of what your rates w ill be in 2018/19 depending on the t ype of property you own.
The six typical property types identified are:
0
0 ~ \;#
Urban Residential
Rural
Rural Orchard
e • e
Commercial /Industrial
Rural Dairy
Lifestyle Block
f=or each typi ca l property type total rates examples were calculated across fi ve areas of the District
within the three wards (Katikat i/Waihi Beach, Kaimai and tv1 aketu / Te Puke). There are a number of
different wa rd-based or area of benefit charges that apply, which affect the t ot al rates paid. Some properties are connected to services like reti culated water supp ly and wastewater, which also affect rates.
The results of these calculations are shown in the fo llowing graphs. Please note that these examples
do not include GST or Regional Counci l rates. We collect these on behalf of the Regional Council and
they are included in you r rates bill.
323 I CHAPT£R ~OUR I ~ I NANC IALS I I'UNDING IMPACT STAT~M~NTS AND OTH@ RATING INI'ORMATION
Waihi ACHMENT B
Ath
ikati Waihi Beach Ward
~ Haketu/
Om..,koro~
Maketu
Te Puke
Kaimai Ward __./!
WI-IAT RATES ARE USED !=OR THERE ARE THREE MAIN TYPES OF RATES:
GENERAL RATE
This cons ists of:
A rate in the dollar charged on capital va lue
A Uniform Annual General Charge (UAGC), which is a Aat amount levied on each rating
unit.
The General Rate is used to fund our day-to-day operations and act ivities that are considered to be
mainly for public benefit.
TARGETED RATES
Council uses targeted rates to co llect funds over areas that benefit from a particular serv ice. This rating
tool is chosen where serv ices are specifi c to a particular community or area within th e Dist rict and it is
not cons idered fair to charge all ratepayers. f=or example charges for water, wastewater and town centre
promotion.
ROADING RATE
This consist s of:
A rate in the dollar charged on land val ue
The roading charge, whi ch is a Aat amount levied on each rating unit
The rural works charge, which is a fi xed amount on every rural zoned property in the
District.
Th e Road ing Rate is used t o fund the bu ilding and maintenance of the road ing network within the
District.

330Proposed rate changes for 2018/19 The tables on the following pages set out the proposed rates changes, for a range of property types and different parts of the District. Note that these are based on an example representative property.
0 Urban Residential
0 Urban Residential
Maketu C urrent 2017/18
Proposed 20 15/19
Te Puke C urren t 2017/18
Proposed 20 18/19
Kaimai C urrent 2017/18
(Omokoroa) Proposed 2015/19
Katikati C urrenl 2017/18
Pr opose d 2018/19
Waihi C urre nt 2017/18
Beach Pro p osed 2018/19
0
• Wastewater • Wate r •
Example Property
· Land Value , $177,000
· Capita l Value, $376,000
• Water Connection
• Wastewater Connection
$2.546 $2,57:5
$2.692
$2,723 --$2.658
$2.699 - -$2,815
$2.734
--52.807
$2.744 ______L_
-0.26°/o Average Rate Increase Rates below based on the example property.
2000 4000 6000
• O the r Targeted Rates
8000
• General Rate
0 Urban Residential
Maketu Currant 2017/18
Proposed 2018/ 19
Te Puke Cu rrent 2017{18
Propose d 201&/19
Kaimai Currant 2017/18
(O mokoroa) Propose d 10111/19
Katikati Current 2017/18
Propose d 10 111/19
W aihi Current 2017/18
Beach Propose d 10111/ 19
0
• Was tewate r • Wate r
0 Urban Residential
Maketu C urrent 2017/18
Propose d 20111/19
Te Puke Current 2017/18
Proposed 1018/19
Kaima i C urre nt 2017/18
(Omokoroa) Proposed 10111/19
Katikati C urre nt 2017/18
Propose d 1018/19
W aihi C urrent 2017/18
Beach Propose d 20111/19
0
• Was tewate r • Water
ATIACHMENT B
Example Property
· Land Va lue, $235,000
• Ca pita l Value, $505,000 0.25°/o · Wa ter Connectio n Ave rage Ra te Inc rease
· Wastewater Connection Rates below bosecl on the example property.
$2.694 $2,735
$2.840
$2.885 --$2,806
$ 2,861
--$2.962
$2,896
--$2.954
$2.906
2000 4000 6000
• R' 1dir 0 R<1fe • Other Targete d Rates
8000
• General Rate
Example Property
· Land Value' $360,000
· Capita l Value, $685,000 0.79°/o • Wa ter Connection Average Rate Increase
• Wastewater Connection Rates below based on the example property
$2.938 $2,997
- -$3.084
$3.147
$3.050
$3,123
- -$3.20 6
$3,158
--$3,198
$3 ,168
2000 4000 6000
• R, clw R.1t • Other Targete d Rates
8000
• Gener <t l Rate
I=UNDING IMPACT STAT~M~NTS AND OHl~R RATING INI=ORMATION I I=INANCIALS I CHAPT~R FOUR I 324

331
Commercial /Industrial
Example Property
e Commercial /Industrial
·Land Value , $185,000
· Ca pital Va lue, $348,000
• Water Connection
• Wastewater Connection
Maketu C urra nl 2017/ 18 $2.691 Proposed '2018/19 $2,704
Te Puke C urrent 2017/18
Pr o l'osed 1018/19
$2.990
$3,028
- -Kaima i C urre nl 2017/18 $2.802 (Omokoroa) Proposed 1018/19 $2,830
Katikati Current 2017/18
Proposed 7018/19
$3,13./1
$3,175
W aihi Currant 2017/18 $3.040
Beach Proposed 1:018/19 53,083
--'-0 2000 4000
1.09°/o Average Rat e Increase
Rates below bosecl on the example property
6000
• Wastewater • Wate r • R( "'~dinJ Ro~t • Other Targeted Rates
8000
• Genera l Ra te
325 I CHAPTtR ~OUR I ~INANCIA LS I FUNDING IMPACT STATEM ENTS AND OTHER RATING INFORMATION
e Commercial /Industrial
Maketu C urrent 2017/18
P r oposed 2018{19
Te Puke Curre nt 2017/18
Propo sed 101&/19
Ka imai C urre nt 2017/18
(Omokoroa) Proposed 10111/19
Kat ikati C urre nt 2017/18
Proposed 201!1/19
Waihi C urre nt 2017/18
Beach Propo1od 2018/19
0
• Wastewater • Wate r •
e Commercial /Industrial
Maketu C urrent 2017/18
Proposed 2018/19
Te Puke Current 2017/18
Proposed 2018/19
Kaimai Currant 2017/18
(Omokoroa) Proposed 2018/19
Katikati C urre nt 2017/ 18
Proposed 2018/19
Waihi Curre nt 2017/ 18
Beach Propon d 2018(19
0
• Wastewater • Wate r •
ATTACHMENT B
Example Property
· Land Value, $300 ,000
· Capital Value, $563,000
• Wate r Conn ection
· Wastewater C onnection
2000
$3.051
Sl.081
$3.351
Sl,405
$3.163
Sl,207
$3.<194
Sl.552
$3.401
$3,4 60
4000
1.4 8°/o Average Rate Increase
Rotes below based on the example property.
Change
60 00 8000
Q;: lt&o • Other Targeted Rates • Genera l Rate
Example Property
· Land Value , $475,00 0
· Ca pital Va lue' $1,015,000
· Water Connection
· Wastewater Connection
$3.695 $3,767
$3.994
5 4 ,091
$3,80 7
53.89 3
$4,138
$ 4. 238
$4.0 44
54,146
2000 4000
2 .31°/o Average Ra te Increase Rates below based on the elfampfe property.
Change
6000 8000
Q,t • Other Targete d Ra tes • Gene ral Rate

332
•
• Rural
Maketu
Te Puke
Ka imai (Omolcoroa)
Ka tikati
Waihi Beach
• Water
C urrent 2017/18
P roposed 2018/19
C urrent 2017/18
Proposed :zoJS/19
Curre nt 2017/18
Proposed 2018/19
Current 2017/18
Proposed 2018/19
Current 2017/18
Proposed 2018/19
0
• Rc dir 5 P l
Rural
Example Property
· Land Value. $340,000
• Capita l Value, $ 585,000
• Water Connection
2000
$2.223
$2.248
$2,369
52.398
$2.335
52,374
$1.987
52,020
$2.387
52.417
4000
1.41°/o Average Ra te Increase
Rates below based on the example property.
6000 8000
• O ther Targeted Rates • General Rate
• Rural
Maketu
Te Puke
Ka imai (Omokoroa)
Katikati
Waihi Beach
• Wa ter
Current 2017/18
Proposed 1018/19
C urrent 20 17/18
Propoloed 2018/19
Current 2017/18
Proposed 1018/19
C urre nt 2017/18
Proposed 1015/19
Current 2017/18
Proposed 1015/19
0
• R· :li ol
• Rural
M aketu Curr ont 2017/18
Proposed 1018/19
T e Puke Current 2017/18
Proposed 1015/19
Kaimai C urrent 2017/18
(Omokoroa) Propose d 1018/19
Kat ikati C urre nt 2017/18
Proposed 1018/19
Waihi Curre nt 2017/18
Beach Propo sed 1015/19 .. 0
• Wa ter • R- lin R
ATIACHMENT B
Example Property
· Land Value, $465,000
· Capital Value' $ 830,000
· Wa ter Connection
2000
$2.SI6 $2,568
$2.662
52.718
$2.628 $2,694
$2.280
$2,339
$2.680 $2,737
•1000
2.28°/o Average Rate Increase
Qates below based on the eJiomp/e property.
6000 8000
• O ther Targeted Rates • General Rate
Example Property
· Land Value, $ 710,000
· Capita l Value' $1,300,000 3-47°/o · Water Connection Average Rate Increase
Rates below ba~ on the example property
Change
2000 4000 6000 8000
• O ther Targeted Rates • General R.1te
!'UN DING IMPACT STATEMENTS AND OTHER RATING INI'ORMATION I I'INANCIALS I CHAPTER !'OUR I 326

333
• Rural Dairy
Example Property
• Rural Dairy
• Land Value, $1,245,000
· Capita l Value, $1,460,000
Maketu
Te Puke
Kaimai (Omokoroa)
Katikati
Waihi Beach
Current 2017/18
Pro posed 2015/19
Current 2017/18
Pro posed 201&/19
Current 2017/18
Pro posed 1015/19
Current 2017/18
Proposed 2018/ 19
Current 2017/18
Pro pose d '1018/19 0:
0 2000
• Other Targeted Ra tes
$2,977 $3,069
$3.038
$3,151
$2.909
53,014
$3.046
$3,148
$3.046
$3,148 _____j_
<1000
• Genera l Rale
3.56°/o Average Rate Increase lrote.s below based on the (!J(Omple property.
6000 8000
327 I CJ.lAPTER ~OUR I ~INANC IALS I ~UNDING IMPACT STAT~M~NTS AND OTJ.l~R RATING I N~ORMATION
ATTACHMENT B
• Rural Dairy
Maketu C urre nl 2017/18
Propose d 20115 / 19
Te Puke Current 2017/18
Propoud 2018/19
Ka imai C urrent 2017/18
(Omokoroa) Pro poud 7.018/19
Katikati Current 2017/18
Pro p ose d 2018/19
Waihi C urrent 2017/18
Beach Prop osed 1018/19 0:
0
Example Property
· Land Value' $2,040,000
· Capita l Value, $2,625,000
2000 AOOO
• Roado~g R.ot • Other Targeted Ra tes • Gene ral Ra te
Example Property
• Rural Dairy
· Land Va lue ' $3,485,000
· C apita l Value ' $4,371,000
Maketu Current 2017/18
Pro po1ed 2018/19
Te Puke Current 2017/18
Pro po1ed 2018/19
Ka imai Current 2017/18
(Omokoroa) Pro po1ed 20 18/19
Katikati C urronl 2017/18
Pro poud 1018/19
Waihi Current 2017/18
Beach Pro p01ed 2018/19 L
0
• RoJdongRd
2000
• O ther Targete d Ra tes
4000
• Genera l Rate
4.84°/o Average Rate Increase
Rates below based on the example property.
$4 .54 4
$4,770
$4.605
$4,832
$4.476
$ 4,696
$4,613
S4,8 :SO
$4,6JO
$4,847
6000
5.31°/o
8000
Average Rate Increase
Qates below based 011 the example property
6000 8000

334
~ \iii
~ 'iii
Rural Orchard
Maketu Currenl 2017/18
Pro posed 1015/ 19
Te Puke C llrro nl 2017/18
Propose d 1018/19
Kaimai Current 2017/18
(O mokoroa) Pro posed 1018/19
Katikat i Curronl 2017/18
Pro p ot.e d 20 18/19
Waihi Current 2017/18
Beach Pro posed 2018/19 1:
Rural Orchard
Example Property
• Land Value, $635 ,000
· Capital Value, $1,330,000
$2.358 $2,472
$2.416
$2,528
$2.295
$2,402
$2.423
$2,541 -~
$2.415
S2.57b
• Roacling Rat
0 2000
• O ther Targeted Rates
4000
• Genera l Rate
5.13o/o Ave rage Ra te Inc rease
Rates below based on the example property.
6000 8000
ATTACHMENT B
~ 'iii
Rural Orchard
Maketu C urren t 2017/18
Pro p c;ne d lOHI/19
Te Puke Curreni 2017/J8
P r o p o sed 2018/19
Ka imai C urrenl 2017/18
(Omokoroa) Pr oposed 10 18/19
Kat ikat i C urront 2017/18
Pro posed 1018/19
W aihi Current 2017/18
Beach Proposed 2018/19 L
0
Example Property
• Land Va lueo $ 8 10,000
· Capital Valueo $1,830,000
$2.888 $:5,059
-~
$2.946
$3,116
$2.825
$2,969
$2.953
$3,129
$2.944
$3,164
2000 4000
• Roading Rate • Other Targeted Rates • General Rate
~ 'iii
Rural Orchard
Maketu Current 2017/18
P r o pose d 2018/19
Te Puke Current 2017/18
Proposed 2:018/19
Kaim ai Current 2017/18
(Omokoroa) Proposed 20 18/19
Katikati C urrent 2017/18
Proposed 2018/19
Waihi Current 2017/18
Beach P r o posed 20 18/19 L
0
Example Property
• Land Va lue, $1,040,000
· Capit al Valueo $2,512,500
2000
$3.603 $3,654
$3.661
$3,911
$3.540
$3,765
$3.669
$3 ,924
$3.660
$3,959
4000
• Other Targeted Rates • General Rate
6.19°/o Average Rate Increase
Qotes below based on the e~Comple property.
Change
-6000 8000
7.16°/o Average Rate Increase ~ates below based on tile eKample property.
Change
6000 8000
~UNDING IMPACT STAT·M-NTS AND OTHm RATING IN~ORMATION I ~I NANC IALS I CHAPTER ~OUR I 328

335
e
e Lifestyle Block
Maketu C urrent 2017/18
Proposed 2018/19
Te Puke Current 2017/18
Proposed 2018/19
Kaimai C urrent 2017/18
(Omokoroa) Proposed 2018/19
Katikati C urrent 2017/18
Proposed 2018/19
W aihi Current 2017/18
Beach Propos ed 2018/19
0
• Water • R- lH ,,
Lifestyle Block
Example Property
o Land Va lue, $325oOOO
o Capital Value, $550oOOO
• Water Connection
$1.879 $1,917
$10809
$1 .~32
$1.8 11
$1,842
$1.9A7
$1,976
$1.879 $1,917
2000 4000
1.71o/o Average Rate Increase
Rates below based on the example property
Change
6000 8000
• Other Targeted Rates • General Rate
329 I CHAPT[R ~OUR I ~INANC IALS I ~UNDING IMPACT STAH~M-NTS AND OTI-I"R RATING INFORMATION
e Lifestyle Block
Maket u
Te Puke
Ka imai (Omokoroa)
Kat ikati
W aihi Beach
• Water
C urrent 2017/18
Proposed 2015/19
C urre nt 2017/18
Proposed 2018/19
C urren t 2017/18
Proposed 2018/19
Current 2017/18
Proposed 2015/19
C urrent 2017/18
Proposed 2018/19
0
• ll< l;n~Rot
e Lifestyle Block
Maketu
Te Puke
Kaimai (Omokoroa)
Kat ikat i
W aihi Beach
• Water
C urrant 2017/ 18
Propose d 1018/19
C urrent 2017/18
Proposed 1018/19
C urrenl 2017/18
Proposed 2013/19
C urrent 2017/18
Propose d 1018/19
Current 2017/18
Propose d 1018/19
0
• Rc ·lin• Rat
ATIACHMENT B
Example Property
o Land Value, $4100000
o Capital Value, $730,000
· Water Connection
2000
$20088 $2,146
$2.019
$2,061
$2,020 $2,072
$2.157
$2,206
$2.088 $2,146
ll OOO
2.48°/o Average Rate Increase
Rates below based on the exa mple property
Change
6000 8000
• O ther Targeted Rates • General Ra te
Example Property
o Land Value' $525,000
o Capital Value' $946,000
• Water Connection
2000
$2.351 $2,4 ::52
$2,282
$2.::547
$2.283 $2,::557
$2.420
$2,491
$2,351 $2,4::52
4000
3.19°/o Average Ra te Increase
Rates be/ow based on the eKample property.
6000 8000
• Other Targeted Rates • General Rate

336ATTACHMENT B
PROSPECTIVE FINANCIAL STATEMENTS
CAUTIONARY NOTE
The information in the prospective financial statements is uncertain and its preparation
requires the exercise of judgement. Actual financial results achieved are likely to vary from
the information presented and the variations may be material. t:vents and circumstances
may not occur as expected and may or may not have been predicted or the Council may
subsequently take actions that differ from the proposed course of action on which the
prospective financial statements are based.
ASSUMPTIONS UNDERLYING PROSPECTIVE FINANCIAL INFORMATION
The financial information contained within these policies and statements is prospective
information in terms of J=RS 42: Prospective !=inancial Information. The purpose for which it
has been prepared is to enable the public to participate in the decision-making processes
as to the services to be provided by Western Bay of Plenty District Council over the
financial years from 2018/19 to 2027/28 and to provide a broad accountability mechanism
of the Council to the community. Refer to Chapter Two page 23 for details of underlying
assumptions.
PROSP~CTIV~ i=INANCIAL STAT~M~NTS I i= INANCIALS I CHAPT~R !=O UR I 330

337ATTACHMENT B
WESTERN BAY 01= PLENTY DISTRICT COUNCIL PROSPECTIVE STATEMENT 01= FINANCIAL POSITION
FOR TI-lE YEARS ENDED 30 JUNE ANNUAL FORECAST PLAN $'000
Current assets
.. C::a.~.~--~.n. .cJ .. ~a.~.h. .. ~.CJ~. i-~_al_~n.~~-Trade and other recei vables ... ...
.!2!!!..current assets
Non-current assets
pr()p~_rty:p l ~n.~ a.r.><:J ~quipment
l~ t~_nf?. ib.I E! a_s.se.~~lnvestments
Tot';.J non-current assets
Total assets
Current liabilities ......................................
Trade ancj_ other_payables ....................................... .
Employee accruals
Other cu rrent liabilities .. ..... ... .. . ....................... ........ ···················. . ...............• Provisions
Borrowings
Total current liabilities
Non-current liabilities
Borrowings
~.Jl1.P. IoY.~e I:>E!n".~.t _lia _bdi~i".~ . Provisions
Total non-current liabilities
Total liabilities
~sset.s._ ____ ~~~-----------------------Represented by
Reta ined earning;~ ................. . Restricted reserves
$'000
2018 2019 2020 2021 2022 2023 2024 2025 2026 2027 2028
3,782 8,708 7.629 7,514 9.488 25,890 6,665
10,912 ........... . .... 11,206
12,201
23,407
17,062
12,563
32.611
13,144
32,267
13.410
45,677
10,666 11,299 11,576 11,820 11,967 12,710
38,600 ... ... - . .. .... .... 17,577 14,448 2~ 19,206 19,333 21,455 29,625 45.755
1,296,228
2,899
21,969
1,321,906
1,338,674
13,614
2,725
9,655
1,345.444 1,398.592
2,377 2,172
10.559 ... ~ .. 1,411,323
22.416
1,370,236
1,384,684 1,431,330
1<1!?49. 2,575
9.65~ ...... .
14,137
2.575
9,655
1.448.414
2,098 ......................... 10,559
1,461,070
1,480,276
14,248
1.501,139
2,198
10,527
1,513,863
1,533,197
14.374
2,575 2,575 ................................................ 9.655 9.655
1,552.527 1,609.783 1,677.978 1,743.509 1,812,266 - -----2,118 2,214 2,131 2,224 2,139 .... .. ...... . ............... ········-··········· ............ .
10.447 10,367 10,447 10.447 10,319 u ~ ·~ """ lololftoll'
1,565,091 1,622,364 1,690,555 1,756,181 1,824,724
1,586,546 1,645.771 1,720,180 1,794.780 1,870,479
14,538 14,793 15,047 15,131 15,270 ........... .. .. . ..... . ············· ............... .
2.575 2.575 2.575 2.575 . ............................ .. 9.655 9.655 9.655 9.655 . ..... -·· . . .. . ........................... ..
1,901,828
2,231
10,319
1,914,378
1,960,055
312 312 312 312 .3.~~ :)12 ... 31? ....... . ........ 3.1.~·-· ......... ......... 3.12
2.575
9.655
312
15,823
2,575
9.655
312
25,000 10,000 35,000 10,000 10,000 33,000 --· p -· - --51,306 _ ___;2;.;:;.6,679 36,790 61,916 37,080 - 37.335 27,590 60,673 - 27,813
90,000 120,000 120,000 110,000 83,000
150 150 150 150 150 ...... ........................ ..... .. ........ ..
208 350 342 334 326 - --90,358 120,500 120,492 110,484 83,476
141,664 147,091 147,171 147,274 145.392
1!.2Zt010 1,237.593 1,284,159 1,;533,002 1,387,804
803,817 . /3.1_3._9<1? .... . .. ~-~6.936 .... ~.-:~~ ~~~1 ..... . ... ~5-~:.1 ~-~ 266 266 266 266 266 ... .. ... . .. . ... .... .. . .. ...
103,000
150
318
103,468
140,548
1,4.4S.991!,
98,000 113,000 80,000 105,000 70,000
150 150 150 150 150 ............... ........... . 310 302 294 286 278
98,460 113,452 80,444 105,436 70,428
135.795 141,041 141,117 133,249 133.793
1,509,976 1,579,139 1,653,663 1,737,230 1,826,26..,!
910,538
266
931,229
266
9_5.~/>.?6 266 ..... .. . . ......... ..
C() ~_n.C. il_~ ~ r~~-t~d. r_es_e!V.."::' . ...................... ...................................... 26,7!?5. . ....... --~-~·~./3.? ............ 26,946_ ......... .. ?!~?.?.~ . ............. ~~~~31
874.146
266
30.769
540,817
890.744
266
33.664 .................. ... 34:.~94 . . .. 3..5 .. ~.13.~ . 38._??1
978.911
266
36,071
811,014 Asset revaluation reserve 366,172 396.491 430,011 463,512 500,552 585,302 633.841 686,584 745.698 --- - ----!Total public equity 1,197,010 112371593 1,2.§,4,~59. __ 1,333,Q_Q_2 __ 1,3~7.~J:!4 1,445.99.8 1,S09,916 1,579,139 1,653,663 1,737,230
331 I C~APTER FOUR I FINANCIALS I DROSD~CTIV~ FINANC IAL STAT~M~NTS

338ATTACHMENT B
WESTERN BAY 01= PLENTY DISTRICT COUNCIL PROSPECTIVE STATEMENT 01= COMPRE~ENSIVE REVENUE AND EXPENSE 2018-2028 FOR TI-lE YEARS ENDED 30 JUNE ANNUAL FORECAST
PLAN $'000
Revel'lu!. ~r.ol1111 ".11 :exc;~Cin~e tr.~ns_action~ . ..
~.e<O! ~ a_~ d. C.~ ':l r!s.<O! ~fr_?l11 a_~tiv iti es
~~-t "' i ~-~-() 111: .. <0! X..c. l .u..cJ il1~ t a. r~:t vva..t:~ su.p p ly~a..t.<O!.S. .. . !=ines
Veste d assets
!=inancia l contributions . ... .. .................... . ... .
~ U..?.~ _i cJ i (O!S .a.11<:J !5.~~-nts .. O the r reve nue
Gain s
Total revenue from non-exchange transactions
Rever\':~~ ~r.()l11 e.xc~an~!d transactions. ... l= inance income .......................... Divide nd s
Re nta l Income
O the r exchange revenue
Total OP._f!!_ati!:!g revenue
Expenditure
. .?~~ -"'~ :~.P.:I1~<0!.S. .. Personne l costs .......................... ............................. .. ...
Dep_~:c i~_t_ i _o~··· · ·· ......... ...... ... ·· ·············-·········-···· Amorti sa tion
1.111.P..a..i_r.l11<0!11.t .. : X.:P.:I1.s.IO! ... !=inance costs
Total operating expenditure
Share of assoc iates retained surp lus
Net surplus/ (deficit)
Ga in s/(losses) on asset reva luatio ns
O the r assets at fa ir va lue through othe r compre he nsive income
Total other comprehensive income for the year
Total comprehensive income for the year
$'000
2018
5.439
64,670
245
2,240
10,020
12,818
617
96,049
1,280
100
1,0 53
700
99,182
2019 2020
5.817 5.974
67,632 70.736
261 267
2,240
8.449
8.444
360
93,203
779
858
933
95.773
2,292
9.433
8,269
368
!Li37
809
885
950
99.981
34.987 37.100 37.577
20,470
20,762
426
19,390
19.926
248
20,0 47
19.931
432
2021 2022
5.475 5.583 ... ----- ·············
74.351 76,859
272 278
2.342
9.997
2.397
9,999
8 ,275 9.415
375 383
101,087 104,914
430 439
904
961
!2hl83
892
984
!2Z:.ll!
38.906 39.40 7
20,896
21,136
401
21,357
21,702
401
2023
5.781
78,392
284
2.453
10,267
9.030
392
106,598
449
911
1,007
~5
40.361
21,823
22,172
380
2024
5.912
81,850
291
2,515
10,298
2025
6,021
85,005
297
2,577
10,551
8 ,835 9.028
40 1 410
110,100
459
903
1,033
112,4.95
41,897
113,891
470
959
1,058
116,378
43.1 0 9
22,325 22,850
22,396 23.427
384 368
2026
6,157
86,696
304
2,645
10,826
9.234
420
116,282
481
982
2027
6,306
89.788
312
2,718
11 ,117
10,102
430
120,773
493
2028
6.458
93.205
320
2.793
11 .421
9.729
441
124,366
505
1,005 1,031
1,101 1,123 1,153
~ 123,394 127,055
43.731
23,397
24,161
374
45,195 48,353 ...........................................
23.967 24,577
25,100
359
25.722
367
7,800 8,000 7.700 6,700 6,600 6,300 6,000 6,000 5.400 4.320 4 .320
82,351 85,510 86,934 88,040 89,468 91,036 93,002 95,753 97,064 98,941 103,339
16,831 10,264 13,047 15,343 17,761
24 ,893 30.319 33.520 33.500 37,041
24,893
41,725
················· ... .............. . ........................................... .
30,319
40,583
33.520
~6.567
33.500 37,041
48,843 5~
17,929 19,493 20,625 21,781 24,453 23,716
40,265 44 .485 48.538 52.743 59.11 4 65.316
40,265
58,194
44.485
63,978
48,538
69,163
52,743 59,114
74.524 83,567 - .. -
339
WESTERN BAY OF PLENTY DISTRICT COUNCIL PROSPECTIVE STATEMENT OF CASI-I FLOWS 2018- 2028
ATTACHMENT B
J:OR TI-lE YEARS ENDED 30 JUNE ANNUAL J:ORECAST PLAN $'000 $'000
C::as.h_ flo¥( fro_'!' OP.erating adivitif!s .
. (;ash wil! be pr()yided from:
_B_a_t~s.a n_d_ ser.:'_ices charges
O ther revenue
f= inancial cont ribu t ions
.S.l!ndrr.r.e.venue
User fees
S.ubsid ies a nd _grants
Int erest revenue · ext ernal ·····················
Regiona l Council rates
Total Of'erating cash provided Cash was applied to:
§uppli~r~ <lr19. e.mployees
ln t.e._restoi1.P.LI.b. lic debt
Regional Council rates
Total operating cash applied
2018 2019 2020
_59,4:3:?. .... 63.74 6 65.9(,()
2.,2.14. __ 1_,99.8 __ 2,12.? ..
1_0,020_,.. 8 ,44.9. .. 9.4.:3:3
_;?0 0.... . ..... ;360 368
9.392. 10,()7.4 1,0.}49 .....
.. 1 _2. ,~~8 .. 8,_444 8,2~9
....... .4\~.. .. 413 42~ 6,293 6,538 ~
101,083 __ 1~9.022 103,624
. !?.~_,311 _ ;>_6_.712 .?7.959
(..8()_()_ ...... _/3.,0 <:)() . 7_,7()() 6,293 6 ,538 6 ,70 8
69,404 71,251 72,367 Net cashflows from Of'eratjng adivities _ .,.,_,, A.,., ... ~.... ... n J- _ 31,257.
.C: il~.~ ~o:--: .~r_()'!' i1111.e~.t.i~g a.c:tivi_ti~~-C:a.s~ '_'fil_l~e.p~()vid.ed fro111: ....
... P..rgce'C~s f.ro.":' sa l_e of property,pl!'l1t.and <cq<J ip_me.n..t ... . ....... a.~ . . _85 8z. Proceeds from sa le of investments 35.000 11,857
Total investing cash f)rovided ~.,, - p 085 85_ 11.944
.C:.a.s.h will ~E! .SJ>I!nt on: ..... .
2021 2022 2023 2024 2025
69.4 !?.?. . .nm. .. . . .7.3 .;;oo .. ?.6.4.~.9. ........ ?.9.394
... ?.077 ......... . 2/??? ........ 2.19.9 . 2.,2.16_ . . ....... 2,2.73
. 9.,997 .. . 9,9.9.9 .. . . ... !!? ... ~_(>? . . 10 ,2913. ............ 1o,551_
.. 375 ....... :38.:3 ..... :392.. . ...... 40.1 4_10 . 1(l,12.,<? ... . 1()·.4413 .. . 1_<?,?2..<?
.... 8.?.??. ...... .... 9 .415. .. . ...... 9.();30 .
.. .4:3.<? .......... 4:39. ...... 44.9. 6,890 7.096 7.323
11,0.2..<?
__ 8.13:35. ..
11 ,;3_?0
9,(l28
.4.5.9. .............. 47() 7.572 7,860
2026 2027 2028
81,091 13.:3,13.6.2. 8p31
. 2. ,:3:3?. .............. ~.,:?.13.?. ... .~ .. A:?./3. .. ___ 1() . /3.2~
420
11 .588
9,2;34
48~
. 11,11?. .. 11 ,4~ 1
4 30 .. ..44.1 __ ,
... 1\/3.n . 1,<?,1.<?? ..
49.:3 ..
1 ~ ,1 6?.
9·7..2.9 ... ;?()!?.
- 8,174 -·~~-107,619 111,5n _ 113,679 117,230 • .._. '9A.L !6!·~-... 124,151 128,795 ,.,Apvv., J
5.9, 6.9.~ .. ... 6().~;38 ~2.()20.
6,7_00 6,600 .... 6..;300
. ~;?. ,968. . 6,00() .
.. 65,704
~.()<:)0
67,045.
5.400
6,890 7.096 7.323 7.572 7,860 7.._, fp..J.._..J 1 1 -.11 .._ /P .._, ._,._ 8,174
73,282 74.334 75,643 34.337 __ 37.242 __ 38,036
... 13.9 ..........
89
.. 91 32
123
.. 92 ... 8 0
17.2
77.540 39,(191
95 80
175
79.564 41,742
········ ............ 97
-9
80,619
.43,532
99
... ~9.·.0..2? .. A·.:?.?.<?.
8,534
81,876
AM19
72.;37~ . 4,320_
8,935
85,634 4 7,231
_104 ...
_pu rchas"' of p roperty, p lant and_ E!9[J_i pm_en.~ . ;?.9,,711:\ .. ;36 ,66_<? _;;8,27<! .. .:35. ... !?.0?.. ;3;>,481 . .:? 1 ,~34 ;3;3,147. .......... 4.(),9_();3 34 .8_03 . ... :3.2..42.7.. 47.·~?9.. . Purchase of investments 160 80
Total investing cash applied 39,878 36,740 Net cashRows frQm investing,..'!a~c.:t::.;iv;.:izti""e"'s ________ ~------~4.793) (36,655)
.G~~h .fl<lw..fr.9.m. fin.i!nc,ng a,c;#yiJi1:1.~ .
... Ga~h. "!.!1.! i;!.I:1.P.r.!'v.!Qed fr9n1; . Loans raised
. ................
••········· .....................
Totalftnancingcashp~r~o~v~id~e~d~----~~----------------.. C: .a.s.~ >Yil_l~e. .. s.P.ent_on: Reoayment of public debt
Total ftnancing cash applied Net ~ashRows from ftnancing,_:a~c:!~!:iv:,:.it!]i::"e~s _________ _
. ~.e.t. i':'~.r~<IS.I!((~e..<:re.a ~_e) ill .c:<Jsh. ~.e.l~ .
333 I CHAPT~R FOUR I FINANCIALS I PROSP~CTIV~ ~INANC IAL STATEMENTS
10 ,00 0 30 ,000
10,000~000
....... .......... §.000 25,000
45,000 25,000 (35,000) 5,000
.. ..<&..~114.) .. .<.~.8_84,) 14.779 6,665
6.~~5 ____ 3.781
38,274 (26.,339)
.4.~?.27. 3.781
8,79 8_
35,505 (35,41~)
··········
~1 ~_()7.?> ... 8,708
35,481 ,(35.358)
~00
8,Q_OO
10 ,000
10,000 (2,000)
J116) 7,629
31,234 (3M!f!1)
30 ,0 00
33,147 ,(32,973)
. ............... 5,000
80
40,983 (49.~8_6.)
. ..... . ...... 15,000
34,803 (34.Z.Q4)
32,427 (32.~)
25,0 0 0
~Q~0 ___ 5.ooo ___ ,s .. ooo - 25,000
..... ... . ........ ·········· ............... - ..... 35,000 10,000 10,000
35,000 10,000 10,000 (5,000) (5,000) 5,000
........ 1,CJ!4. ... 1 ~7..18 _ J; ~~s.~ ........ 8,82ji ............ ~~!.~1 .. 7.513 9.4 88 11 ,206 17,061 25,889
7.6~9 ___ 7,513 ___ 9.48_8 ___ 1~,2()6~~ ,1.7,061~_25,88.9_ 3~.~
47,679
{4ZrS75l
~~4.4.) ..
~ 3~.~(l7.

340ATTACHMENT B
WI:STI:RN BAY OJ= PLI:NTY DISTRICT COUNCIL PROSPI:CTIVI: STATI:MI:NT OJ= CHANGI:S IN NI:T ASSI:TS/I:QUITY 2018- 2028
FOR TI-lE YEARS ENDED 30 JUNE ANNUAL FORECAST PLAN $'000 $'000
2018 2019 2020 2021 2022 2023 2024 2025 2026 2027 2028 ...... .............. ··········•·••···· ........ ..................... . ................. . ······· ..................
A~cumu lat~d flj_n ~sat th_E! star.~ . ?.~ ~~~ye.a r ............................ ... ...... .?~4,1 8.? 79~.~14 808,344... ... . /3.~ 1_, ;333 ..... ~:3.?!2?13. .... ~.5.:2. !??? .. __ 868.,543 .. .. B.85,140 ..... 904,935 ?..2.?/>.2.6 ......... 9:"7. .. <??.:3. . Net surplus for t he year 14,0 29 10,130 12,989 14,595 16,624 15,991 16,598 19,795 20 ,691 21,467 ~ Accumulated funds at the end of the year ~8,214 808,344 821,333 835.928 852.552 868,543 885,140 904,935 925,626 947,093 973~~
~~s E!t .r.E!vi'l l_lji'l ti ?.ll . ~'C~.e.r.V.E!~ .. at . t .~ E! .~t.a. rt () f t.~ e .Y.E!i'lL ... .. ........ ... .... . .. .. . ..... . .... :3..4\2.?'? .... }66_.1?2 3'?6·4?.1 .......... .4:3.() .. .()!1 ...... .4?.:3. .. 5..1? ?.()<:J!S.S.:3. ........... !?.40 ,81?. 585.,3()~ . . .. 9.:3.:,3,(341 _ ......... ?.~.9. ·. 5.13.4 ... ?4:?.,9.?.13 Reva luati on of infrastructural assets 24,893 30,319 33.520 33,500 37,041 40,265 44.485 48,538 52,743 59,114 65,316 - ---- ---Asset revaluation reserves at the end of the year 366,172 39~ 430,01'!_ 463,512 500,553 540,817 585,302 633.841 686,584 745,698
Counci l rE!se.r:'.e.s .i'l.t t he st~ rt _of t~E! .X~a r .. ..... ... ................................ ... 2.9/322 ... 3~,624 .. 32,75.? ....... .. :32,8.1.5. .......... :3.:3.,:?.9.:3. ... :3.4,?<?9.. ;;6_,(>;;8 39.533 .. 4().,3.6:3 4.1.,:45.4 . .44!.4.4.0. ... Movements d uring t he yea r 2,80 2 ~ 58 748 1,137 1,938 2,895 830 1,090 2,986 2.499
Council reserves at the end of the year 32,624 32,757 32,815 33.563 34.700 36,638 39.533 40,363 • ' o o o lito o:ti'L' ' '1111'11'!7l'=IIIII~JII"J!AI!Ill111 ~ n "'"' IOill "~"= :IIIII> "'1111' Ill olilllr - dllli'o Ill' iii; 0
Eauitv at the end of the y_ear 1,197,010 1,237.593 1,284,159 1,333,002 1,387,805 1,445.998 1,509,976 1,579,139
PROSP~CTIV~ FINANCIAL STAT~M~NTS I FINANCIALS I CHAPT~R FO UR I 334

341ATTACHMENT B
WESTERN BAY 0~ PLENTY DISTRICT COUNCIL RI;:CONCILIATION BI;:TWI;:I;:N SUI--11--1ARY I=INANCIAL I=ORI;:CASTS AND PROSPI;:CTIVI;: STATI;:I--11;:NT OJ= COI--1PRHII;:NSIVI;: RI;:VI;:NUI;: AND I;:XPI;:NSI;:
FOR THE YEARS ENDED 30 JUNE ANNUAL FORECAST PLAN $'000 $'000 2018 2019 2020 2021 2022 2023 2024 2025 2026 2027 2028
Tl>.t iii .. I>P.f>r.il~in.g . r."."E!I11J". ... ............. . Acti,.i.tr .•.IJrti.'Y.'ii! .Y. fi.n..a.n~i~.l fo.~f>.C: ~~~ . ~~a.~".'Y.'". I1t.~ ... . .................................... ................. . Repcese.~.t a.t_ig~ .. ... ... . .. ............ .... .. . ............ . Planning fo.r t~.e. f<Jt~.r.e .
Com l)'lunit ies .................. ... ......... ......................... ........... ........ .. ..... ........... . .......• .. . ............. . Recreation and leisure .. .. ... .. •· ............. . R.egu.latory. servi~.e~ ........ . Transportati()n ..
Wa ter su.pp ly
Stormwat.er . Natu ra l environment . . . ... . .................... . . Wast.E>w:at<Oc . So lid waste . .... .. ..... ~co.n_c;>f"!'l i ~ .. SUf!f!Ort services Tht':il operating revenue Total operating revenue par prospective statement of comprehensive revenue and expanse Variance
Ger:><lra.l ra te. a. ll ()ca.t<l~ .. ~() .ac;~ivi.t.i.e~
.............................. .4.19. ... c\.29 . .. 1:?. 1:?. ...
3.c:Jl:?. ... 2 ,549. .. .. 2,312... . 2,881 ..
.............. .... ... .... 5.306 . .5:451. _27,:?50 ... .. 2M?9.7 .. . .12,13() 11 ,/39.1 .. . .. 5,55.2 . . ..5,6.8.1
533 .......... 59..3 .
!?.15 . .... 13.
.. 2 .. 57..!?.
.448. .. 1~
~·.48.8 ... .Y:l~3 ........ 3 P!? .. .
..?.·5.66. .. 5,Q90 ,2,5.6.11 26,427
. ..1.2.,F l .......... 1 ~, .2(ll ..
.. 6,()76. . . .... 6..~.46. .... .5.4.2. ............. 55?. .
. 16 .. 1 ~.:?. .......... 1.~ , .:?. 1.:?. ............. 1 3_.1 ~4 ............ 13.751
. ~59 .13
... 2.617 2.742
5.202 . 27.473. 1 3,8~0
. 6_.627
.55.1
14 2,702 3.0~2 . 5.31~ .
.A81 .. 14
2,.805 .. Ylt>.,
... !?.A~.'L
492 .. 1.4 ..
. 2,'~56. .. ~.931
5.~66
2?,8.89 .. 2.1l,.6~3. . .. ~9.~~.9.. ..14,244.. . .. 1.4..4~<? 1;4 ,89~
6,.827 ........ M9.2... 7.2.0.3 . ~~5 ~4~ . . 3~.2 .. . ... :?.61
1~.393 1.4.8?~ . . .. l~ ... 3U ... 1.5.816. .
. 59..!?. .. ..51?. .. .. 1.!?. ............ 15
.. 2_.962 . . . ... ~·c:l9.2 . ~ ·.9."!?... } .. 659. ..
... 5:6.96. . . . 5,8.~5 . .~9.,9.7.5 ........ 3C:W9.5 ..
5~1
15 3.216 3.13~ .. 5·981 .
.31,720 1~~.2.~.5
7,.42.1 .. 1.5,6.24 .......... 16..()00
. . ~'Jl .. 1.6. .. 2.1/:l ...
. ... a..o1 ~ 7.8(6 . ...... 3~.1 . . ... 3'?.2 .
. .. ,.Mil3 17 .. 1 ~6. ... 1,3.16. . . .1.4().? ... . .\c\.19..... . . l,.?.~c:> ........... ~,611 . ..1,878. . 1.729 1,801 .. . .. l,ll.ll9. ......... ,1,';>69.. . . .2 .?.5~ . .2.9?.. ..319 ........... 3~6. ..... . .. 3~5 . . 343 :?.52 .. 36.2. . . .:m ................ 3.1l.:?. ... . ....... 394 406
4.367 4,161 4,043 4,194 4,063 4.069 4.352 4.934 4,809 4.624 6,031 7'8.731 72,695 75.365 77.236 80,708 82,101 83,837 86,691 88,597 91,712 94.509
99.182 95.773 99.981 103,383 107,229 108,965 112,495 116,378 118,845 123,394 127,055
(20,451)_(23,079)_(24.~16) (26,146) (26,521) (26,864) (28,658) (29,687) (30,248) (31,682) (32,54Z) (19.362) (21,921) (23.389) (24,847) (25,137) (25.431) (27,161) (28,141) (28,624) (29,982) (30.784) · <1:0a9i ·· · · ·<; .,57> (1.227) <,.299) ···· · (,.384) (1.433) · "(1.497i · ··· ··· (;·:546) · ··· .... 6:625i. · · ii:;;c;;i · ···· · · <, :?62) ·
-----------~----- (2o,451) (23,079). (24.616) (26,146) (26,5:n) (26,864) (28,658) (29,687) (30,248) (31,682) (~547) Total operating expenditure A~ti.,. i.ty ·~~.~~ .. ·~Y .. ff~·~~~i~.l .• f~recast s.ta~ ... ~~n.t~ ... ................................................................................... . .
Repr.<=.se~.t a t i.o.~ .. Planning f()rJhe..fu.~~re .
~~r:n~~- ~.i. ~.i ~-~---· Recrea tion and leisure
R~gul~t~r·y s~;;;~~~ ••. .... .. .. . ... ... . ..... ................................................•...•................... ...
:?.·Cl~.l ......... :?.??.5 ....... 3:4.~4 .......... :?.,~~13. .. 4,036
~..06.1 ................. 2N.3 .. . ... 2,19.() ............. ~!.21 8. ... 2,125. .t>,.54.() ....... ...?,.2.~.?... 7.,31l.?. ............. ..7:35.2. .. . .7:5?.() .~.~~.() . . .. .J._ll.l . ?:6.6.1 ............... ~ .. ?.1.2.. ... 8,329 .7 . .4"\9. ........ ll·:?7.1 8.:5.~ .6. ... 8.737 ............ 9,0()1 ..
.. .2.(),794 .. . 19.,11.1... . ..... 19,7.()9. ...... J(),.l8.?. ..... 2o,.2t>S .. ].1,1.58.... . 1 1,~.~9. ......... 1.1,~.4.:?. .......... l~_.l(l3 1_2.73() .
:p8s ........... ~.9.18 . ..A,:?.li:J. .4...c:J.c:J?. .... 1 ... 11.? ............. A.?J.l .2,29.1. Nt>.s. 8,.?.~4 '(.17.6 .
. ... 2. ,31.6. .... ... . _2,;m . ........ .2 ,4~4 . . ..... ~ ... ?.~.?. ... ~·:455 ..
.. 8.,c:>4.?. . ll, ~9.9. .. ..... ll,.5~1:l .. ll,!l~2. . .. 9 .. 11l4 .... '?':0.~.5 ....... ... 9:9.913 ........... 1 0. ,3~? ... .11,.0.54.. . .... n,.66s
9.531 .. 9,7.1.?. .. . ........ 9.982. ........ 1() ... ~():?. .......... ..1.0 ... 6~.9. .. J0,91?. ......... 2l.c:J~6 ~.1 :~1.?.. ..... p,c:J0.8.... _22,:?1.6 .. . . 1:?.70.9 . 1:?.85.5 . 1 4 ,~.413. ... . ... 1.4,.594 ...... .. ..14,~7.6 ..
Transpo.r ta tio~ ..... Water ~u p p ly ..
St()_rm;:va.ter. . .......... ................................................................. .................. _:?,9.63 ............ 3·9l.c:J ............ :4P5.?. .... ... . A,l.<J.c:J. 4.352
20,t>89. 13,196 4.367
.8.12. 1~.4.89 .
2,188. l:l25.
3.730
... 4 .. 57.9.. .. . . 4.•.79.?. .4.,?.1.5 ............ .A..?.82. . . ~ ,650 . Natu.ral . ... ~v i ro.n m.e.flt . ... . . .. ... .... . . .... ............... ...... .. ... ... .. . .. . . .7.9.1 ?.5.3 . . . .7.5?. ............ ] 83... 79.5 84.2. ...... ~56. ....... .. . .. 8.5.5 ............. 8.9.0. 906 Wastewater
So lid waste
335 I CHAPTER FOUR I FINANCIALS I DROSD~CTIV~ FINANCIAL STAT~M~NTS
. 13.33.?. ..... J3.14.() 1.3·356. ...... ..... 1~ ,6.24 .13,619 .1 2,9~() 12,8'?.<:>. . 2,241
.. 9~.5 ..
g6.16.. . ..... 12 .. 27.8.... 1~,281 .. 2,.c:J42
648
...... 1.(>,,11~1
.. 1:9.:?..8. 2.,c:Jl.2. ............ 2...0.~4 . 7.4c:J ................ ...?.59
3.771 88,040
88,040
... 10, :2.l>4. . 13,047 .1? •. ~4.~
~.1~1 .
. .?.83 3.731
89,468
89,468
17.,J:6~
91,036
91,036
.. 2,2~.2 .. .8.1l.3 .
. 1.7,'~2?. ... . 19,493...... .. 2<>,,6:2?. ..
.. 2.!.2.9.9. .. .2:346 .. . 2.~57
. .. 9.1l4
21,781 . ....... .. :2.4,.4.?~ ... .......... 2.~.1.1~ .. .
J 07 -.hJoJL~ J~ oJ~~ 37.041 40,265 44,485 48,538 52,743 J 7o"~ -JoJ•-
37,041 40,265 44.485 48,538 52,743 -. 54 .119-L- 58,l94 __ ,63.97A __ ,_t>9,i6 3 _, _ 74.524

342
RESERVE FUNDS
Hunter ~ state
I' Anson Park Trust
Hastie Bequest
C~ Miller ~state
Restrlctecl reserves ....,_ been esbbllshecl from public bequests and are only able to be the donor
~stab li s hed from bequest made in the late 1980s. The funds can on ly be spent on cap ital Recreation
. ~X.~~!I:'~ i~~~e i n. _ Ka.ti_k,at i a~ cJ~~a. ii _E>cJ i~ ?.ur ~_eserv: "::a~a~~.rn:~.t ~l.a.n_~: . .... .. . .. . ................. a..~. cJ Leisure
The accumulated interest is avai lab le for both operationa l and capital expenditure undertaken in the Te Puna area.
Recreation and Leisure
The principle sett lement amount o f $100,000 is mainta ined and the interest can be used forTe Communit ies Puke area library purchases.
The interest on the capita l of $9.763 is availab le for the beautification of Katikati . Recreat ion and Leisure
Total Restricted Reserves
Asset Replacement Reserves -general approach
Asset Replacement -computers
Coasta l Marine
Dist rict Reserves
Huharua Sub Regional Park
T~CT All Terrai n Park
Asset Replacement -office buildings .. . .•.............. ......
Asset Replacement -vehicles
Asset Replacement civil defence
Depreciation cha rged is transferred to the specified reserves detai led below and accumulated so that the interest ea rned on the reserves cap ita l is ava ilab le for asset replacement/ renewals. The replacement/renewals progra mme is based on the renewals planned in ou r asset management p lansJh.<=. _r_f!_serv-=.s are not held as cash reservf!.s:.
....................................................................• ,. .............................•.....
Support Services
Recreation and Leisure
Support Services
Recreation and Leisu re
Recreation and Leisu re
Recreat ion and Leisure
Support Services
Communi t ies
Yes 35.275
Yes 8.972
Yes 206.451
Yes 15,102
265,800
Yes 686,696
27,060
2,509,843
155.662
661,707 .................. ............
Yes 1,386,860
Yes {6,018)
Yes 156.507 . ..........
ATIACHMENT B
26,352 61,627
6,702 15,674
173.701 (132.480) 247.672
13,676 28,778
220,431 (132,480) 353.751
12,489.573 (9,838,266)
3,618,268 {6,129.985)
11 ,561,312 (5.764,897) 8,306,258
287.874 443.536
864,218 (46,500) 1.479.425 ....
8,584.575 (4.508,845) 5.462,590 ....... ,,
4 ,684.317 {6,287,393) {1 ,609,094) ......
10,103 166,610
R(;S@V(; FUNDS I F' IN ANCIALS I CHAPT.R FOUR I 336

343
Asset Replacement -telemetry
........................... ............. ....................... .. ............ .................. .................................................. ..... ...................................... . Asset Replacement-s':'_imming po?.l . ........ .............. ... .. ..... . ... . ... · ·· ····· ················- ...... Asset Replacement -
l_i?.rary boo_k~- ........... ....... ...................................................................................................... .... .. ....... H • • • ••• • • •• • •• • •••• • • H •••••• ••• • H •• •••• ••• • •
Asset Replacement · Cemetery
Community Boards·
general approach
w~ii,iEi~~ch C::orr11Tl!:Jn ity Bo~r.~ Katikati
.C::~rr1.rl1!:JI)ity Boar<:J Omokoroa
We have fi ve community boards but not all of our District is covered by these boards.
The Community Board rate is a l=i xed amount for their community board area of benefit. The level of rating is determined based on the expected expenditure of the
Board and may vary between Boards. Any unspent money at year end is transferred to
t he respective community board reserve account. Reserve funds can only be used for
~apit_~ l._ ()'.'"' :<_:>ff, _or. non-recurring expen.d i~Lir.e items()r gr~11t~
.......................... •··· ...
_C::g_fl1rl1!:Jnity..l?.s>.a.r.<:l ....... ................................ . Te Puke
.. c .o.rl1.rl1unity_[:loar.d ... M aketu Community Board
Total Community Board Reserves
337 I CHAPTER FOUR I FINANCIALS I RtSt RVt ~UNDS
Communities Yes ... ... .. .................... ..... ... .
Recreation Yes
and Leisure . .............. •
Communities Yes . .... ........ ................... ....
Communities Yes
Communities Yes
Communities Yes
Communities Yes . ................ ..
Communities Yes ,.,, .......
Communities Yes
ATTACHMENT B
77.044 77.044 ····· ........................ . ...... ........ ....................................
176.972 323.921 (46,830) 454,063
2,321,014 3.410,798 (3.827.975) 1.903,837 . ................................ ..................................... -· .. -·
200.472 351,740 552,212
276,225 276,225
117.329 (188,700) (71,371)
297.964 297.964
124,192 124,192 . ....... . .....
149.410 149.410 ~ -
965,120 (188,700) 776,420

344
Other community reserves - general
___ a.ppr()a ~_h _
Katikati Development i=und
These reserves have been established to accumulate sufficient fund s to allow for planned expenditure (per the Long Term Plan) in particular areas, often for town centre _d.evelopment. The funding is provided by way of targ_E;>_t_e>_d. __ rates _ ...
Set up several years ago in anticipation of the Katikati By-pass impacts on the town and to provide funding for main street improvements as well as encourage business development in Katika_t_i __
Wa ihi Beach Town Centre Development !=or town centre development
............................................. Katikati Town Centre i=or town centre development scheduled to begin in as and when opportunities
Development arise
Omokoroa Town
_Ce~_tr.<:> De~_E;> I_().P'T_'<:!nt
Te Puke Town Centre Development
Pukehina
Development
!=or town centre development sched uled to begin in as and when opportunities
arise
!=or town centre deve lopment
Pukehina ratepayers are paying an annual rate of $20 as a contribution towards a future sewerage scheme for the area
Total Other Community Reserves
Planning for the Yes
fu tu re ......... . ...... ...... .. ...
~conomic Yes
Economic Yes
~conomic Yes
~conomic Yes ..... . .................
Planning for the Yes
future
ATIACHMENT B
13,295 3.693 16,988
. ......... . ..........
(13,150) (723,900) (737.050) . ...... . ........ ..........
317,691 824,151 (890,800) 251,042 ........
33.993 33.993 ................ - - ........
672,228 672,228
······· ........... .....
601,108 630,126 1,231,234
-- - --1,625,164 1,457.970 (1,614,700) 1,468,434
RESERVE ~UNDS I FINANCIALS I CH APTER FOUR I 338

345
f= inancial contributions
.. r. e~.erv.es - .ge..n.e.r.~.l .
~co log i ca l fin ancial
contr ibu t ions - cap ital
~co log ica l fi nancial contr ibut ions
operational
These are specific reserves that must be applied for a part icular purpose and under
specific criteri a or qua lifying cond itions. These reserves are not cash reserves .
f=in ancial contributio ns split into cap ita l and operatio nal components t hat are to be
spent based on Council's annually approved ecologica l education programme. Capital
expenditure must be by Council resolu t ion and satisfy cri te ria for privately owned land.
Opera tio~.~.l .. exP..~.nd. i ~~. C.~ .. i ~ .. ~~.S.:<J. . ?n. .t ~~ P.C. i ?.'...Y.:~r:s c l ?.~ i.~f: ?P.~ r~t i.?n.s. [:, a l a n ce avail abl e.
As above
Pa rks and Community . . . . financial contribut ions To prov ide for teachmg and publ1c education/awareness ra1smg purposes.
Pa rk ing space financial Provided from fi nancial contributions f rom developers in the urban areas where they
contri but ions cannot provide public car parks themselves. ·······························································································································
Lynley Park ~stab li s hed from money received from Durham Propert ies Limited, to be used t o fun d
wastewater remed ial any infrastructure fail ures in the Lynley Park Development.
Total Financial Contribution Reserves
Community
Discretiona ry
Genera l Rate
~nv ironment a l
Protection Rate
Traffic and pa rking genera l
Total General Reserves
f=or any under spent expendit ure at yea r end.
f=or t he accumulation o f any net surp lus ari sing from accou nts that are general rate
f.u.n9 . .,9 .. E?.~~~ . Y..E?~C.: .. [)"~.<:.it.s. . a.r.., .. n.?..t .p_er rr1 itt.E?.cl .. i.n. .. t.h. i.S. . C."~.E?.r.V." .................... .... . ..
f=or the accumulat ion of any net surplus arising from the ~nvi ronmenta l Protect ion Rate
account Deficits are not permitted in thi s reserve. ........................................................................................................... fi o lds t he percentage balance of Co uncil-i ssued infringement not ice fin es t hat were not paya bl e to the Government as par t of t he legis lation d uring the 1980s. Correspondence
has not resolved whether the balance is still payable to the Government. No cash is held.
339 I CHAPT~R FOUR I FINANCIALS I RESERVE FUNDS
Natural
~nv ironmen t
Natural ~nv ironment
Recreat ion and Leisure
Regulatory
Wastewater
Communi t ies
All
No 321,239
No 79,286
No (342,222)
No 50,10 5
No 348,467
456,876
No 14,386
.......
No 5,1 55,984 . ................... .. ............... ······· .....
All No 2,191.442 . ..........
Regulatory No 175,561
-7,537,373
ATTACHMENT B
(?8,151) 243,0 88
825,821 (2,226,129) (1,321,022)
20,882,267 (21,358,711) (818,666)
50,105
348,467
21,708,088 (23,662,991) (1,498,027)
14,386
2,300,811 (2,942,907) 4,513,888
1,944,794 (7,282,879) (3,146.643)
175,561
4.245.605 (10,225,786) 1,557,192
346
Disaster Contingency
Matakana Island Trust
Council's infrastructure se lf-insurance fund provided from the sa le of power company
shares in the 1990s. Council's policy is to self insure based on the premise that
commerc ial infrastructure insurance is not avai lable. Major infrastructure, apar t
from d istrict reading is geographica ll y dispersed t hroughout our District (primarily
sta nd-alone sewerage and water schemes) and the like lihood of failure of this entire
infrastructure at once is assessed as very low.
Reserves accumulated several yea rs ago from the appeal aga inst the Katikati
Reserve extension across to Matakana Is land. The fun ds are availab le to be used for
improvements to the Matakana Is land community. ..... ... ... ----·- ...... ...... .
Corporate Property and Assets !=or any surp lus aris ing from the corporate property/land purchase account.
C ivil Defence
Contingency
Weathertight 1-iomes
Pa nepa ne Point
Total Special Reserves
.. .. ... ··························· We expect this ba lance to be mainta ined at $20,000 being our costs for a specific civi l
defence emergency.
Total All Council Created Reserves
Communities
Planning for the
i=uture
Support
Services
Regulatory
Reserves
Yes
No
No
No
ATIACHMENT B
8,281,964 7.338,061 15,620,024
258,803 258,803
1.455.945 1,195,183 (3.391,679) (740.550)
200,000 200,000
421,418 (301,200) 120,218
10,618,130 8,533.244 15,458,495
29,822,282 82,352,037
(3,692,879)
(75.968,227) 36,206,092
RESERVE FUNDS I FINANCIAL$ I C~APT£R FOUR I 340

347
341 I CHAPTER ~OUR I FINANCIALS I DRAn SCHWULE OF FEES AND CHARGES 2018/2019 AN D INDICATIVE FINANCIAL CONTRIBUTIONS
ATTACHMENT B
DRAFT ·sci-IEDULE OF
ES AND CI-IARGES
2018/2019 AND INDICATIVE
FINANCIAL
CONTRIBUTIONS

348ATTACHMENT B
DRAFT SCI-IEDULE OF FEES AND CI-IARGES 2018/2019 CONTENTS
GENERAL
Di&it.~ l P r()p~r.tx ~~ ~~ Pri.l1t ~n<:J <;opych~ rges
. ?.c.~. I1 .. C. h~.~&~.~ ...
.GI.? Se.r ~ i <:.~f~~ ~ nd p ri n. t <: h~ r&e.s ......... . Official informa~i?..f1 .. ~~quests ......
~.LJ.~.Ii.C.~~ i ()l1.~ .a.r1.<J .. ~.LJ b.~<:.r. ip~i<:J.Il s New services
CUSTOMER SERVICES
Libraries
Fees
.. C)ver<JIJe. <:har&e.s . Discount policy
P~ li~y. pl~~~ i~g; ~~g~l ~ to.;y & i·~ frast~u~t~~~ ser~.i ~~; chare:e out rate
General
Land Information Memoranda (LIM)
ANIMAL CONTROL SERVICES
Registration fees
Dog adoption fee
Dog pound fees
Stock pound fees
Repeated impounding
Sustenance
Driving charges
Advertising
Other fees
BUILDING SERVICES
. ?. P.E!.C..i.~.l. i ~.t .. ~.E! r.~.i <:.e.~ .. O ther fees
.~.LJ.i. l <:J.i l1~ . <:.<:> f1 s E!I1.~ .~ppr()~a. l i ll.f()r '!'a ti.?.ll ...
~lji i <:J i l1& <:<:> f1 ~E!I1~ ~e~il1& f~.E! .. ~.LJ.ii .<:J.i l1& <:<:> r1 SE!I1 ~.f~~~ ~11 <:J <: ~a.r.g~s . . ............. . Rural numbers
343
343 ..... ·····-··········
343 ·························· 343
343
344
344
344
345
345
345
345
346
347
347
347
347
348
348
348
348
349
349
350
350
351
351
HEALTH Premises registered - Food Hygiene Regu lati ons 1974 {<;!x i.~~ ing 9.P.e.La.~<J.LS . P.rig rJ9 .. LM a.rc.b. .. 2.9.J.9 ................ . Food premises operati ng under Voluntary Implementati on programme (V IP) prior to 1 March
2Q.l6. ........ ········ ········· ........... . Food premises Food Act 2014 (new operator and
. ~r.i3. f.ls.iJ i <J.n. e. cJ . P.re. rn i.s.e~Jr.c:>'T.l . 1 Mar ch :?9.1.6..
Bylaw licences ....... ..................... .
... ~irE!.":'.?.~k..~ .. PE!~I11.i ~~ .................... .
... ~.~.lJ ~~ . <?..n./<?..~ .. C::.I LJ~ .. ~i<:~I1<:.E! . food .i.ll~P..E!.<:.t.i.()l1 .... ~i.<J.lJ.<:>r. .. ~i <:E!I1<:~.~ ....................... . On/Off Club Licence
RESOURCE CONSENTS
?lJ~.c!.i~i~.i <:>l1 .. <:.?.1l.~~.f1~~.JI1.()11~11<:>~ i.~.E! c!.L ................ . Notified resource consent applications, designations,
b.~r.iJ<Jg~ 9.r.~~r..s ... a.n.~ .r.l.a..n. .. <:h <J rlg~~ ..... . Land use (non-notified) consent applications except subdivisions
.. ?.1~.1l. ll.i l1& .. a.<:J~ i.<:.E!. Requests for information or other service not
... ~.LJ ~J.~<:~ .. t <>. ~PE!<:.i~cJe.~ .... .... ... .... . .. .... . ...... . Miscellaneous ........ ......................................... .................. --···-···········
... '::1<:>11 i.t.<>.~il1& .. ~11.d. .. <:.()!11Pii.~.f1 .C.~ . '::IY.cl.r.~. I1.~ .~.<>.":' .. ~E!~.t.i.ll.g. ······ ····· .....
... § f1&i.I1.E!E!r.i.f1& .. cl.E!~ igll .. ~.PP..r.<>.~~ ~ ..
... ~~11 <:J .. ~LJ ?.cJ. i ". i ~.i <:>.f1 .. a..f1.cl .. <:J.E!~~.I.()pmell.~ . !~~.s .... . ~11<:.?.'!'P1 ~~~ <:J .. "'.<:>r..k.~ .. ~<:>.f1<:J.~ .. Maintenance bonds
. ·······-·-·---····················· Non-compliance
INFRASTRUCTURE ENGINNERING
.. P!<>P~r.~.i.E!.S. ./ .8.~~ E! r.".~ .s .. ~ . P..re>.<:.E!S.~.i llB . f~.E! ... ... ?.i.t.E! .. i .ll .~P.E!cti or1.~ ... .... ~erit.a..&.E! .. New .~E!a l a nd ................. .
..... l..E!i3.~.e./ li.<:.E!.r1.C. .E! .. a.P.P. I.i.cati <:>n a.ll.d <:.0 11 ser1.t.~ ... .P.e.ll.~ i <J il.E!~ .. h.olJ.~ i.ll&. Cemeteries
353
353
353
354
354
354
354
355
358
358
359
360
360
360
360
360
361
361
361
361
. .. 3.6.:2.. 362
362
362
362
363
RESERVES
Sports fields and courts c;;~~·~d ~;;~t~.j~. f~~ ;j;~;i ·~·~d r;;~~~·~t i.~n · d~b · ..
J:>yild.ings.9.n <:::9lJ.rl.<: iJ .I <J!l~
.~.i ~.~.E!.1. 1 ~11~<:l.LJ.~ . ::. r.~~.E!E~.E! .. LJ~.E! . C.~~r&e.~ .. TI::CT All Terrain Park Arrival Centre ......... ......... .............. . ................. . Rental of Council buildings & facilities not listed
\'.~ h.i.<: I E! cr.<:>~~ illg. a ppl ic.a..ti ()nS Road services - .. _ --
364
365
365
366
366
~C>~d. . ~ t C>c.k. .. ~~()~~.i. n.~ .. <:.<:>~.t .. ~ec.<:>~.E! rx .. 366
~()ad ()p.en.irlll .llotic.e~J~<:>rri.cJ<:> r .~c.<:~~s Requests 366
Other 366
Rentals for encroachments on Council land 367
. C:::<:Jr!lr:':l ~.nity i.~.f() rn:'~~ i ()ll .bo~rd s . .. . 367 As-built data - l::ngineering records 367 - .. li ,%L.¥..£AM._ I "Jbi£ ... J¥.A&M. M .t __ AkA... J.SIAA--t. tJIJ_Q.$£0.$ . . ,.;~ .. 4#F-o .....
Water connect ion .....................
Fin ~ l.v~:~ ~E! r .. '!'~ter r~ad i f1& . Stormwater connection
... ?.~>V e<r.~~~ .. C: <:l lln.~ct i.?.n .....
.. !.r.~ .d ewa.~t~ .. ~Y.I. a.w . <: ~. ~ r.&.E!s ... .. :C...11nu~ l .. tr.?..d..e."'.~.st~ c~.~ r&e. s .. Trade waste ret icu lation and t rea tm ent charges
··c;;e~~~~~t~ d~op~;ff ~·h·~·~ge ; (~.i ~ i ~~·~ ~·h a~g·~
.. <Jpp li e.~) ..
. ~~<;.yc lingf.E!E!~ (~~ . r.E!.C.X<: Iin& .<:entr.e.~ ()nly)
. Q the.r .r.E!<:YC:ICib.le.s.
Je.nts/e.g ljipf!~en.t f<:>r. solid was~e./re.C.Y<:. I in& Waste licensing fee i ~·d·i ~a t·i ~;; fj ·~ ·~~~ i~(~~~t~ i b~t i~~ ; (fo.r. ir~fo rrn <J~ ign o11 ly). .
.~.6. .~. 368
368
368 .. ······•·······
368
.~.6.?
.~.6.?. 369
370
. ..... Yo 370
371
371
DRAn SCHmUL~ 0~ ~~~SAND CHARG~S 2018/2019 AND INDICATIV~ ~INANCIAL CONTRIBUTIONS I ~INANCI ALS I CHAPTER FOUR I 342

349All figures include GST
GENERAL
VFILES · '·
Digital Property f=ile request- digital copy of property fil e records supplied as a downloadable fil e from the
Council website.
..... --~-
An additional fee to p rovide the Digital Property f=i le on a portable d igital media (USB) fo r pick-up from any of
Counci ls service cent res.
An add itiona l delivery charge of $5.00 sha ll apply to any d igital property file stored on USB and delivery via post/
C()IJ'.i<?ris r<?q':'e~~ed.
DRAFT FEES& CI-IARGES
018/19 ($)
30.00 Download fil e onl y.
ATTACHMENT B NOTES
_,.- " '. -~::., , <' .. r
5.00 Add itiona l charge per media device.
5.00 Add it iona l charge for delivery. ····--··-······· ... ............................... ······ ·······
A property file request is not a Land Information Memorandum (LIM) and as such is not covered by any statutory requirement.
PRINT AND COPY CI-IARGES
Black and white A4
A3
A2
A1 .. ······················································-··· ··· ··································· ••. ............................•..•••......... .. ...•......•...... ........... ..........••••. Colour A4
A3
SCAN CI-IARGES
Scan per page
GIS SERVICE FEE AND PRINT CI-IARGES Map creation, map data manipulation and printing- a quote will be supplied
f=or furt her information please refer to Western Ba y_Qf Plenty District Counci l's Geospatial Data Policx Statement
Map prints
OFFICIAL INFORMATION REQUESTS - SUBJECT TO LEGISLATIVE CI-IANGE Sta ff time - first hour
Staff time - after first hour per hour
Work undertaken by external contractors and consultants charged at t heir normal hourly rate ..... .......... .. ·········· .. ........ .
~ri ~.t.ing
343 I CHAPT£R ~OUR I ~INANCIALS I DRAn SCH£DUL£ Oe ettS AND CI-JARGtS 2018/2019 AND INDICATIVt eiNANCIAL CONTRIBUTIONS
A2
A1
Ao
0.20
0.40
1.50
2.50 . .............. .. ,. .. 2.00
3.50
0.20
125:<:Jo per ho~.r ... t--1in.ir1'1. ~r1'1 ~.~.~.r~<? .. ~.s.o.oo plus GST
30.00
40.00
50.00
No charge
76.00
Costs recovered f rom applicant ..................... . ··············· ········----·---·
.. <::os.ts reco~<?'.<?~ fr':'rr1 .<lP.P..Ii can~ il.t. ~~il.~.~.ar~ .. C()IJ.n ~ i. l p rint cha.r.&.,s ..

350All figures include GST
Asset Management Plans (AMP)
Transportation AMP
Water Supply AMP*
Wastewater AMP*
Stormwater AMP*
Solid Waste AMP*
Commun ity Assets AMP*
· ~ xcludes app(!n.~ ice~. - Pr._ic~ .. ()~ ~ppli cation .......... . District Plan operat ive
~ i strict P. la.':' rT1~.f?~ . 2009 Development Code
... ~':' .n .u.~ l . ~fi! .P..O:ts ···
Text
A4
Printed copy
Disc
Updates
500.00
82.00
82.00
82.00
82.00
82.00
ATTACHMENT B
120.00 . f=utC~~ - ~pd~tes a·~e ind~d~d in .the costs for the te;t and ,:;~ps
160.00
350.00 ~ Th~·2oo9· D~v~ l ~p;;;;~~t c:·;d~ (o~ s~bs~q~~~t upd~t~s) ~~-~ ~ l~ob~ ~ie;_.;~d .
30_00
and downloaded via Counci l's website
www.westernbay.govt.nz Nocost --
15.00
20.00
No
Counci l may implement new or add iti onal services anytime through the financial year. Where new services are introduced that are not already included in fees and charges, a principle of 'actua l an d reasonable
charges' will app ly i.e. Council wi ll only charge what is actual and reasonable to recover the costs of providing the service ... ....... .. . .. .. . . . . ........... ... . ...................... .
CUSTOMER SERVICES
LIBRARIES- FEES Reserve fee (adult)
........ ······················ Replacement card
f-Joliday membership ........................ .............................................................. .....................
lnterloan request fee
Top Shelf (2 weeks) .. .. . ....... . DVD and video (1 week)
1.00
3.00
55.00 $45.00 refundable upon return of all items ······ · ..................... .............................................................................. .
per book
.. P..~. r. . ~r.~i.c l ~. ... .... .. . .. . ...
8'00
Plus lending library's fee, if any ..?:?<:>. 3.00
....•.... ·············· ...... . .. ........ . ~in~ I.E?. 3.00
DR AI'T SCHEDULE OF FEES AND CHARGES 2018/2019 AND INDICATI VE FINANCIAL CONTRIBUTIONS I FINANCIALS I CH APTER FOUR I 344

351All figures include GST
Adult items
Junior ite~~.......... ......... ...... .. .......... ..... ............. .. . . ... ... . . ........ . D'y'D~ video~ ... :f.C>P .. ?~~If Administration fee L~~t~~ ~~~~t·~~~~d items
Replacement cost, administration fee, debt co llection recovery Unpaid ~h~~g~~ ~f $50.00 ~~.:j ov~~ .. ... .... . .. .. ... . . .... .
Amount owed, debt co llection recovery
DISCOUNT POLICY In addition to the regular ' free to borrow' co llections, our libraries offer access to some 'pay to borrow' co ll ection s. These include a best seller co llect ion named Top Shelf' , aud io books, d igital compact discs and music compact discs.
O ur pay co ll ect ions are promoted using eye catch ing display units for storage, in-house topical d isp lays and offering custom ers loya lty card s. Our loya lty ca rd system rewards customers by offering one free pay item foll owing th e rental of four ' Top Shelf' items
. per .. 9.!3Y .... per9.:3.Y
perd:3.y .
POLICY, PLANNING, REGULATORY AND INFRASTRUCTURE SERVICES C~ARGE OUT RATES Fees payable for aAf iAspectioA as a result of AOA eoFApliaAee .. itt-1 a Notiee, OnJer or Re(juisitioA
.... .. ....... ..... . ...... . piUS aflflitiOAal
F=Ces ~aya!ile ~; ··t~e .~ersofi · vi~o . iofiiiC:s · a ·eoffi·~·ia·i· rit · ~;· i t~ cot.ifidi .. i~·at:afi:er . iii~:e:;;tigatiofi . rs iolififi . to······················· · ..... ~~ .. tJ .A:iU~i~.E":.cJ.. w • . • PW w
~L<:ltJP ~.ar1:3.S~~ .. ... ... ... . ..... . .... .. ....... .. . .. . ..
0.30 To a maximum of $10.00 per item
···c;.~~i:.:! ~·a. ~a~i0~~··;r~5§c:) p~~ i t:~.~ ... 1.00
10.0 0 -5;00
-15&.00 -15&.00 AeeitioAal fee per t"lour -15&00 ·········· ..... .... . ..... .
25 0 .0 0 ~
200.00
ATTACHMENT B
~nvironmenta l C onsents Manager, Bui lding Services Manager, Compliance and Monitoring .~i3.n.i3.&f0!r . . ~.~n. i?..r. .~.i3.T1.<Jg<c r.s .~~. n.gi n.'2.<cr.i.ng .. P..r?.P'2.r~Y • .r.'2.~.E!.r.ve.sl .... . .•. ····- ............... .. .............................. .
T.~.<l.T .. ~.E!.il .d..E!.r. . 1 . r1.~P.E!.C:~ i.(). r1.~ •.. T.E!.il.T ... ~~:'l d. ~r. . P.r<:>.c:~s.~ in.g··· .1.9.():0..() ..
180.00
. ......................... ............................................ ................... ..... . Senior Consents Planner, Senior Bui lding Control Officer, Senior Land Development ~ngineer,
profE!ssion.a l ~r)gill e.e.r. SE).f1 it:)_r ~n.gi n.~.e.r..~ Bu.il.d..in.g .C::o.r1 ~r.c:> I . .<::J.ffi <:~r, C::t:>r1~~ T1 ~~..P..I a. r1 r1~r, ~.r1 :V. i r.?..r1T~r1~:3. 1 ~.~a..l ~h.9ffiC:.E!E. Building Wa rrant of i=itness Officer, Land Development ~nginee r, Compliance and Monitoring O fficer
Bui ld ing Administrators, Consents Officers, Compliance Administrator O fficers, Legal Property
.9f'fi.C:~r.~ P.r.<:JP.El.rty ()ffi <:~~ ~!:!~.El_r~~~ . .Q f'fi c:~r.~:. ~f1gif1 ~~rin.g (?.ffi.cE?r.S.
. 170.0()
150.00
100.00
Vehicles .. .... .... .. ........ ....................... .. . ..P~r.~~.. .. ... ... . ... . . .9.:7:5.~~ .......... ······ ....... ... ········· ................ . LAND INFORMATION MEMORANDA (LIM) ... ... . .. .... .. .. . ............ ........ . .. . Standard 10 day service (electronic) 240.00 4 d~y ~e~v i ~·~~ ·{~ ~ ~~t~~~j~) ·· .......... ... ... . .. . . ... .. ... ...... . . ... ........ ...... ... .. .. ...... ... .. ..... ...... .. .. . ... .... ...... .......... 370.00
L iM~ in~~ ~ ~i~g· ~~it.i p i ~ titi~; .. ...... .. . ... ....... . ... ................ .............. ......... ....... ................. ........ ... ...... ...... . ... .. ........ ..... . ....... P~ic~ ~~~pp li cation
*LiM p~o~ id~d~~ ~ ;;·~·i~t~d: h ~rd~·~pyf~~;;,·~ t ··· ··· ··················································· .................. · ·· ...... · · ··· ·· ···· .. ·· · ·· ..... · · · .. ··· · ·· 1s:oo Add itional fee
.~~(fj P.r.?.~id·~1 ~~ .. ~: p:():~~~~i~: ciii.i~~ j ~~d:;~:::.:. ::: ... :::.::· ... .. . .......... :·:·:····· ..... . ..... ....... ..... 5.00 Additio~al f~e ...
~An. ad.~ itig.n. a. l . d.~ li:v.~ r.Y.<: ~i3. r.gf0!. c:>f.t?.·C?O..sbi3 11 <Jpp ly .t() a r1f L1.~ .. :-'.hE!r.E!P.();Sta. l / c.c:>~ ri.fO! r .c:J fO! Ii ~.~.ry i.s .. r.e.qlJ .El~ t~.9. . ..... ..... .. ..... .. ..... ..... ... . . . .. . .... . . ... . . . .. . . . . .. . . . ...... . .. . ........... . #The statutory target is 10 working days. Council does not accept liability for any losses arising from a failure to meet the 4 day service; however, a 100% money-back guarantee applies met.
34S I CHAPT~R FOUR I FINANCIALS I DRAn SCHWULE OF FEES AND CHARGES 2018/2019 AND INDICATIVE FINANCIAL CONTRIBUTIONS