Embed Size (px)
Citation preview

Format of Data
All data should be submitted in a .csv (comma-delimited) format. The sheets in the workbook provide a template for how the tables should be designed.The required format for the entries in each column/field is indicated in the instructions for each sheet. All entries in Text fields must be in quotation marks (e.g. "T-Mobile", "Sprint").Column entries in bold red indicate that the party shall enter only one of the possible entries listed for that column. No other entries shall be entered.Data for all of the tables shall be submitted on a periodic basis as specified in the instructions in individual tables.In a separate written response, explain in detail the applicable methodology and assumptions used to derive all projections in response to this data request.
Attachment A

"Site Data" Table
For each year beginning December 2015 and extending through December 2024, provide, at the level of site ID, the following site and projected site data.Projected data shall include as separate entries plans for the standalone Applicants and those for New T-Mobile.The site IDs in this table shall correspond to the site IDs entered in the other requested tables.
Column A: DateDescription: The month for which the data is being collected as of the second week of the month.Format of Field: Text - YYYY_MMPossible Entries: 2015_12
2016_122017_122018_122019_122020_122021_122022_122023_122024_12
Column B: OperatorDescription: The operator of the site to which this data record applies. In cases where a Sprint site
and T-Mobile site share the same tower or other supporting structure, each site shall be entered separately.Format of Field: TextPossible Entries: "Sprint"
"T-Mobile""New T-Mobile"
Column C: Site IDDescription: A unique site ID for the site to which this data record applies.Format of Field: TextExample Entries: "AL0001", "VA0128", etc.
Column D: Number of SectorsDescription: This field provides an integer representing the number of sectors this site utilizes.Format of Field: Number - IntegerExample Entries: 1, 2, 3, etc.
Column E: LatitudeDescription: This field is the latitude of the site in decimal form to at least seven significant digits. Coordinates must be in the WGS84 geographic coordinate system. Format of Field: Number - At least 6 decimal placesExample Entries: 40.7127837, etc.
Column F: LongitudeDescription: This field is the longitude of the site in decimal form to at least seven significant digits. Coordinates must be in the WGS84 geographic coordinate system. Format of Field: Number - At least 6 decimal placesExample Entries: -74.0059413, etc.

"Site Data" Table
For each year beginning December 2015 and extending through December 2024, provide, at the level of site ID, the following site and projected site data.Projected data shall include as separate entries plans for the standalone Applicants and those for New T-Mobile.The site IDs in this table shall correspond to the site IDs entered in the other requested tables.
Column G: County FIPSDescription: This field is the 2010 five-digit FIPS code of the county in which the site is located.
Please provide data for counties and county-equivalents in the United States and Commonwealth of Puerto Rico.Format of Field: TextExample Entries: "01001", "51059", etc.
Column H: CMADescription: This field represents the standard market number of the CMA in which the site is located.
Please provide data for CMAs in the United States and Commonwealth of Puerto Rico.Format of Field: Number - IntegerPossible Entries: Integers 1 - 729
Column I: Site TypeDescription: This field indicates the type of site to which the record applies using one of the possible entries listed below.Format of Field: TextPossible Entries: "Macro_Tower" An outdoor macrocell mounted on a monopole, guyed tower, or free standing tower
"Macro_Building" An outdoor macrocell mounted on a building"Macro_Other" An outdoor macrocell that does not fit the previous categories (silo, water tower, etc.)"Microcell" An outdoor cell classified by the vendor as a microcell (much smaller coverage footprint than a macrocell)"Picocell" A cell classified by the vendor as a picocell (smaller coverage footprint than a microcell)"Outdoor DAS" An outdoor Distributed Antenna System"Indoor DAS" An indoor Distributed Antenna System"Repeater" A cell that repeats/boosts the signal of another cell"Other" A cell that does not meet any of the above descriptions
Column J:Site Clutter
ClassificationDescription: This field indicates the morphology of the area that the site serves using one of the possible entries listed below.
Please provide a description of the methodology used to determine these classifications in a separate attachment.Format of Field: TextPossible Entries: "Urban"
"Suburban""Rural"

"Site Data" Table
For each year beginning December 2015 and extending through December 2024, provide, at the level of site ID, the following site and projected site data.Projected data shall include as separate entries plans for the standalone Applicants and those for New T-Mobile.The site IDs in this table shall correspond to the site IDs entered in the other requested tables.
Column K:Antenna Height -
(Feet - AGL)Description: This field indicates the antenna height above ground level in feet. Enter 9999 if not applicable.Format of Field: NumberExample Entries: 100
Column L:Site Height (Feet -
ASL)Description: This field indicates the antenna height above sea level in feet.Format of Field: NumberExample Entries: 467
Column M: Backhaul MediumDescription: The type of technology used for backhaul at this site using one of the possible entries listed below.Format of Field: TextExample Entries: "Fiber"
"Copper""Hybrid Fiber Coax (HFC)""Fixed Wireless""Satellite"
Column N: Backhaul Capacity - Incoming (Gbps)
Description: Provisioned Capacity: One-way provisioned capacity of backhaul link in Gbps given capabilities of existing HW - incoming to the base stationFormat of Field: Number
Column O: Backhaul Capacity - Outgoing (Gbps)
Description: Provisioned Capacity: One-way provisioned capacity of backhaul link in Gbps given capabilities of exisiting HW - outgoing from the base stationFormat of Field: Number
Column P: Latency (ms.)Description: Service Level Agreement Latency in miliseconds (round-trip)Format of Field: NumberExample Entries: 10 ms.

"Site Data" Table
For each year beginning December 2015 and extending through December 2024, provide, at the level of site ID, the following site and projected site data.Projected data shall include as separate entries plans for the standalone Applicants and those for New T-Mobile.The site IDs in this table shall correspond to the site IDs entered in the other requested tables.
Column Q:Max. Upgradable
Backhaul Capacity - Incoming (Gbps)
Description: Max. Upgradable Capacity: One-way maximum capacity of backhaul link in Gbps given capabilities of upgradable HW - incoming to the base stationFormat of Field: Number
Column R:Max. Upgradable
Backhaul Capacity - Outgoing (Gbps)
Description: Max. Upgradable Capacity: One-way maximum capacity of backhaul link in Gbps given capabilities of upgradable HW - outgoing from the base stationFormat of Field: Number
Column S:BBH DL Speed
(Mbps)Description: Average user dowload speed (Mbps) during the bouncing busy hour (BBH) for the site
The BBH traffic should be the five-day (weekday) average.Format of Field: NumberExample Entries: 10 Mbps
Column T:BBH UL Speed
(Mbps)Description: Average user upload speed (Mbps) during the bouncing busy hour (BBH) for the site
The BBH traffic should be the five-day (weekday) average.Format of Field: NumberExample Entries: 2 Mbps

"Site Data" Table
For each year beginning December 2015 and extending through December 2024, provide, at the level of site ID, the following site and projected site data.Projected data shall include as separate entries plans for the standalone Applicants and those for New T-Mobile.The site IDs in this table shall correspond to the site IDs entered in the other requested tables.
Column U:Retained Site for
New T-MobileDescription: Will this site be retained for the New T-Mobile network?Format of Field: TextPossible Entries: "Y"
"N"
Column V:Remaining Lease
Time (months)Description: How many remaining months before this site current lease expires
If this site is owned by the applicants, enter 9999Format of Field: NumberExample Entries: 60 Months
Column W:Applicants Colocated
Description: Are applicants colocated on the same site?Format of Field: TextPossible Entries: "Y"
"N"
Column X:600 MHz Available (MHz)Description: The total amount of spectrum (MHz) available for this band (Downlink + Uplink)Format of Field: NumberExample Entries: 10
Column Y:700 MHz Available (MHz)Description: The total amount of spectrum (MHz) available for this band (Downlink + Uplink)Format of Field: NumberExample Entries: 10
Column Z:800 MHz Available (MHz)Description: The total amount of spectrum (MHz) available for this band (Downlink + Uplink)Format of Field: NumberExample Entries: 10
Column AAPCS Available (MHz)Description: The total amount of spectrum (MHz) available for this band (Downlink + Uplink)Format of Field: NumberExample Entries: 10
"Site Data" Table
For each year beginning December 2015 and extending through December 2024, provide, at the level of site ID, the following site and projected site data.Projected data shall include as separate entries plans for the standalone Applicants and those for New T-Mobile.The site IDs in this table shall correspond to the site IDs entered in the other requested tables.
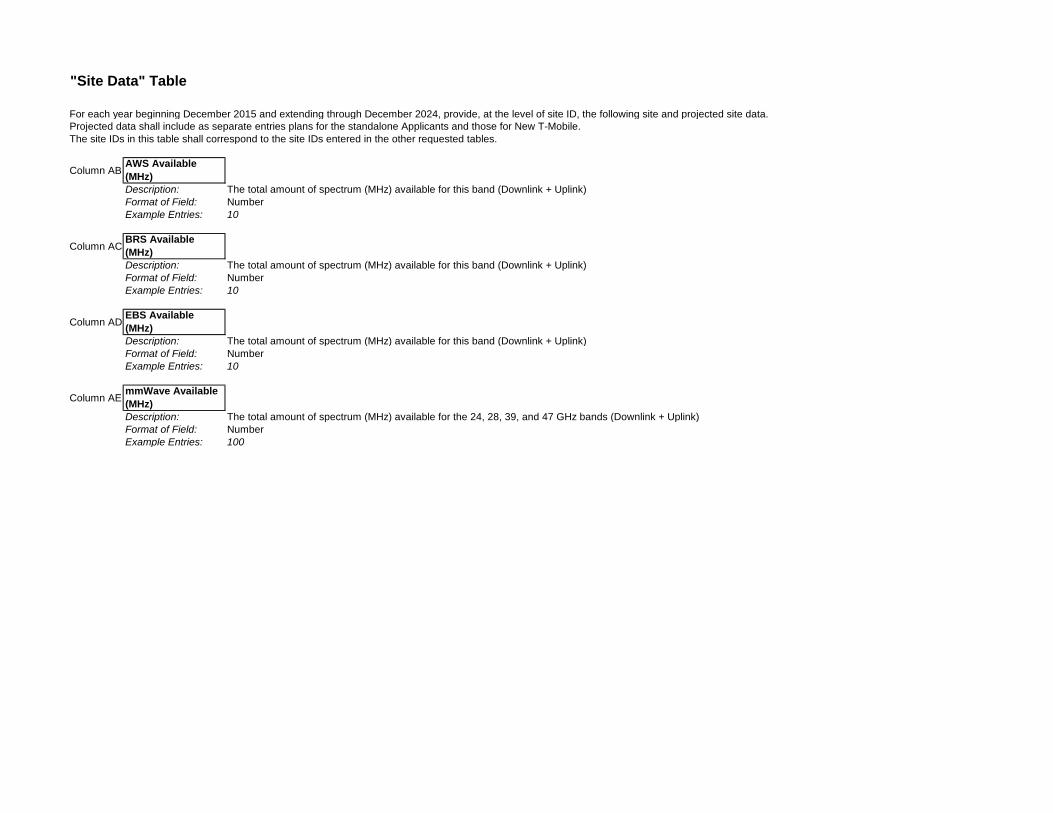
Column ABAWS Available (MHz)Description: The total amount of spectrum (MHz) available for this band (Downlink + Uplink)Format of Field: NumberExample Entries: 10
Column ACBRS Available (MHz)Description: The total amount of spectrum (MHz) available for this band (Downlink + Uplink)Format of Field: NumberExample Entries: 10
Column ADEBS Available (MHz)Description: The total amount of spectrum (MHz) available for this band (Downlink + Uplink)Format of Field: NumberExample Entries: 10
Column AEmmWave Available (MHz)Description: The total amount of spectrum (MHz) available for the 24, 28, 39, and 47 GHz bands (Downlink + Uplink)Format of Field: NumberExample Entries: 100

Date Operator Site IDNumber of
Sectors Latitude Longitude County FIPS CMA Site TypeSite Clutter
ClassificationAntenna Height -
(Feet - AGL)

Site Height (Feet - ASL)
Backhaul Medium
Backhaul Capacity - Incoming
(Gbps)
Backhaul Capacity - Outgoing
(Gbps)Latency
(ms.)
Max. Upgradable Backhaul Capacity - Incoming
(Gbps)
Max. Upgradable Backhaul Capacity - Outgoing
(Gbps)BBH DL Speed
(Mbps)BBH UL Speed
(Mbps)
Retained Site for New T-Mobile
Remaining Lease Time
(months)

Applicants Colocated
600 MHz Available (MHz)
700 MHz Available (MHz)
800 MHz Available (MHz)
PCS Available (MHz)
AWS Available (MHz)
BRS Available (MHz)
EBS Available (MHz)
mmWave Available (MHz)

"Deployed Carriers" Table
For each year beginning December 2015 and extending through December 2024, provide at the level of carrier the following deployed or projected carriers daProjected data shall include as separate entries plans for the standalone Applicants and those for New T-Mobile.The term "carrier" refers to channels or portions of spectrum used in the network rather than operators or service providers.In general, this table should contain one row for each carrier/channel deployed or projected at each sector. Because sites and sectors can include multiple carriers/channels, the same site/sector ID may appear in multiple rows.The site IDs in this table shall correspond to the site IDs entered in the other requested tables.
Column A: DateDescription: The month for which the data is being collected as of the second week of the month.Format of Field: Text - YYYY_MMPossible Entries: 2015_12
2016_122017_122018_122019_122020_122021_122022_122023_122024_12
Column B: OperatorDescription: The operator of the site to which this data record applies. In cases where a Sprint site
and T-Mobile site share the same tower or other supporting structure, each site shall be entered separately.Format of Field: TextPossible Entries: "Sprint"
"T-Mobile""New T-Mobile"

"Deployed Carriers" Table
For each year beginning December 2015 and extending through December 2024, provide at the level of carrier the following deployed or projected carriers daProjected data shall include as separate entries plans for the standalone Applicants and those for New T-Mobile.The term "carrier" refers to channels or portions of spectrum used in the network rather than operators or service providers.In general, this table should contain one row for each carrier/channel deployed or projected at each sector. Because sites and sectors can include multiple carriers/channels, the same site/sector ID may appear in multiple rows.The site IDs in this table shall correspond to the site IDs entered in the other requested tables.
Column C: Site IDDescription: The unique site ID from the "Site Data" table for the site to which this data record applies.Format of Field: TextExample Entries: "AL0001", "VA0128", etc.
Column D: Sector IDDescription: A unique sector ID for the sector to which this data record applies, created by adding a suffix to the site ID.Format of Field: TextExample Entries: Suffix examples include "A","B","C" or "1","2","3"
Column E:Deployed
TechnologyDescription: This field indicates the technology standard used by the channel/carrier described in this record.Format of Field: TextPossible Entries: "1X" A carrier/channel that supports 1X CDMA
"EVDO" A carrier/channel that supports EVDO"GSM" A carrier/channel that supports GSM"HSPA" A carrier/channel that supports HSPA or HSPA+"LTE-R8" A LTE carrier conforming to 3GPP Release 8"LTE-R10" A LTE carrier conforming to 3GPP Release 10"LTE-R12" A LTE carrier conforming to 3GPP Release 12"LTE-R13" A LTE carrier conforming to 3GPP Release 13"LTE-LAA" A LTE Licensed Assisted Access supplemental downlink carrier"5G-R15" A 5G-NR carrier conforming to 3GPP Release 15"5G-R16" A 5G-NR carrier conforming to 3GPP Release 16"5G-R17" A 5G-NR carrier conforming to 3GPP Release 17"Fixed-Wireless" A carrier used for fixed wireless deployment"NB-IoT" Narrowband IoT"List Other" Specify a technology that does not conform to one of the technologies listed above

"Deployed Carriers" Table
For each year beginning December 2015 and extending through December 2024, provide at the level of carrier the following deployed or projected carriers daProjected data shall include as separate entries plans for the standalone Applicants and those for New T-Mobile.The term "carrier" refers to channels or portions of spectrum used in the network rather than operators or service providers.In general, this table should contain one row for each carrier/channel deployed or projected at each sector. Because sites and sectors can include multiple carriers/channels, the same site/sector ID may appear in multiple rows.The site IDs in this table shall correspond to the site IDs entered in the other requested tables.
Column F:Deployed Spectrum
BandDescription: The frequency band in which the channel/carrier in this data record operates.Format of Field: TextPossible Entries: "600 MHz" The 600 MHz band
"700 MHz" The 700 MHz band "800 MHz" The 800 MHz band"PCS" The PCS band"AWS" The AWS band"BRS" The BRS band"EBS" The EBS band"mmWave" The 24, 28, 39, and 47 GHz mmWave bands
Column G:DL RF Carrier Center
Freq. (MHz)Description: This field contains the unrounded center frequency in MHz of the downlink carrier described in this record.
If the carrier is TDD, then enter the center frequency of the TDD carrierFormat of Field: NumberExample Entries: 1937.5, 2142.625, etc.
Column H:DL RF Carrier
Bandwidth (MHz)Description: This field contains the bandwidth in MHz of the downlink RF carrier described in this record
If carrier aggregation is used, each component carrier is an entry with the traffic distributed accordinglyIf the carrier is TDD, then enter the entire bandwidth of the TDD carrier
Format of Field: NumberExample Entries: 1.25 Carrier = 1X
1.25 Carrier = EVDO0.2 Carrier = GSM
5 Carrier = HSPA5 Carrier = LTE
10 Carrier = LTE15 Carrier = LTE20 Carrier = LTE60 Carrier = 5G
Carrier = Other

"Deployed Carriers" Table
For each year beginning December 2015 and extending through December 2024, provide at the level of carrier the following deployed or projected carriers daProjected data shall include as separate entries plans for the standalone Applicants and those for New T-Mobile.The term "carrier" refers to channels or portions of spectrum used in the network rather than operators or service providers.In general, this table should contain one row for each carrier/channel deployed or projected at each sector. Because sites and sectors can include multiple carriers/channels, the same site/sector ID may appear in multiple rows.The site IDs in this table shall correspond to the site IDs entered in the other requested tables.
Column I: Sector AzDescription: Azimuth of the antenna sector orientation in degreesFormat of Field: NumberExample Entries: 0
120
Column J: Carrier ActiveDescription: This field is used to indicate whether a carrier is actively carrying customer traffic. Format of Field: TextPossible Entries: "Y" Indicates that the carrier is carrying commercial traffic generated by paying customers
"N" Indicates that the carrier is not yet deployed, used for test or trial purposes, or turned off
Column K:BBH DL Carried
Traffic (Gbytes/Hr)Description: Base to mobile carried traffic (data+voice) in Gbytes during the bouncing busy hour (BBH) for the deployed RF carrier
The BBH traffic should be the five-day (weekday) average.For predominantly voice technologies such as GSM and 1X CDMA, the traffic unit shall be in Erlangs
Format of Field: NumberExample Entries: 75 Gbytes/Hr
Column L:BBH UL Carried
Traffic (Gbytes/Hr)Description: Mobile to Base carried traffic (data+voice) in Gbytes during the bouncing busy hour (BBH) for the deployed RF carrier
The BBH traffic should be the five-day (weekday) average.For predominantly voice technologies such as GSM and 1X CDMA, the traffic unit shall be in Erlangs
Format of Field: NumberExample Entries: 20 Gbytes/Hr
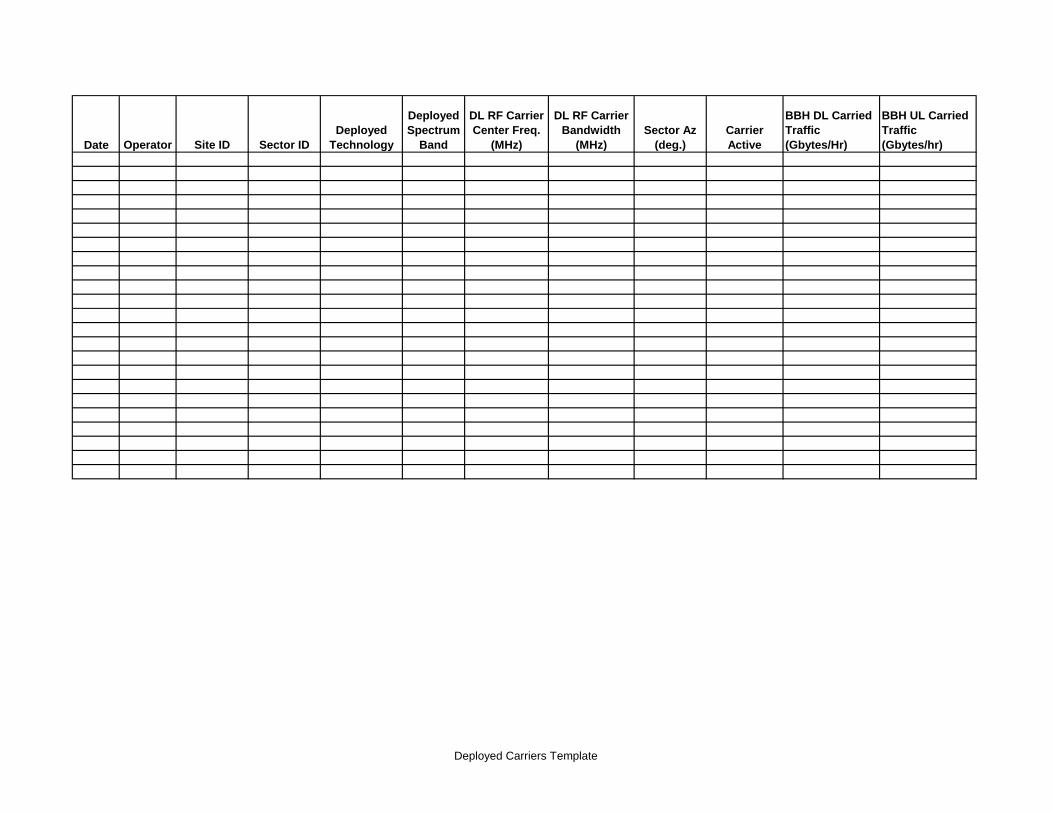
Date Operator Site ID Sector IDDeployed
Technology
Deployed Spectrum
Band
DL RF Carrier Center Freq.
(MHz)
DL RF Carrier Bandwidth
(MHz)Sector Az
(deg.)Carrier Active
BBH DL Carried Traffic (Gbytes/Hr)
BBH UL Carried Traffic (Gbytes/hr)
Deployed Carriers Template

"Offered Capacity" Table
For each quarter beginning 2015_Q1 and extending through 2018_Q2, and for each year thereafter extending to 2024, please provide at the level oftechnology/spectrum band the following offered capacity data at the county level, and for the United States, including the Commonwealth of Puerto Rico.Projected data shall include as separate entries capacity projections for the standalone Applicants and those for New T-Mobile.
Column A: DateDescription: The month for which the offered capacity data is being collected or projected.
as of the second week of the month.Format of Field: Text - YYYY_MMPossible Entries: 2015_03 2018_12
2015_06 2019_122015_09 2020_122015_12 2021_122016_03 2022_122016_06 2023_122016_09 2024_122016_12 2021_122017_03 2022_122017_06 2023_122017_09 2024_122017_122018_032018_06
Column B: OperatorDescription: The operator of the site to which this data record applies. In cases where a Sprint site
and a T-Mobile site share the same tower or other supporting structure, each site shall be entered separately.Format of Field: TextPossible Entries: "Sprint"
"T-Mobile""New T-Mobile"
Column C: County FIPSDescription: This field is the 2010 five-digit FIPS code of the county in which the site is located.
Please provide data for counties and county-equivalents in the United States and Commonwealth of Puerto Rico.Format of Field: TextExample Entries: "01001", "51059", etc.
Column D: CMADescription: This field represents the standard market number of the CMA in which the site is located.
Please provide data for CMAs in the United States and Commonwealth of Puerto Rico.Format of Field: Number - IntegerPossible Entries: Integers 1 - 729

"Offered Capacity" Table
For each quarter beginning 2015_Q1 and extending through 2018_Q2, and for each year thereafter extending to 2024, please provide at the level oftechnology/spectrum band the following offered capacity data at the county level, and for the United States, including the Commonwealth of Puerto Rico.Projected data shall include as separate entries capacity projections for the standalone Applicants and those for New T-Mobile.
Column E: TechnologyDescription: This field indicates the technology standard used by the channel/carrier described in this record.Format of Field: TextPossible Entries: "1X" A carrier/channel that supports 1X CDMA
"EVDO" A carrier/channel that supports EVDO"GSM" A carrier/channel that supports GSM"HSPA" A carrier/channel that supports HSPA or HSPA+"LTE-R8" A LTE carrier conforming to 3GPP Release 8"LTE-R10" A LTE carrier conforming to 3GPP Release 10"LTE-R12" A LTE carrier conforming to 3GPP Release 12"LTE-R13" A LTE carrier conforming to 3GPP Release 13"LTE-LAA" A LTE Licensed Assisted Access supplemental downlink carrier"5G-R15" A 5G-NR carrier conforming to 3GPP Release 15"5G-R16" A 5G-NR carrier conforming to 3GPP Release 16"5G-R17" A 5G-NR carrier conforming to 3GPP Release 17"Fixed-Wireless" A carrier used for fixed wireless deployment"NB-IoT" Narrowband IoT"List Other" Specify a technology that does not conform to one of the technologies listed above
Column F: Spectrum BandDescription: The frequency band in which the channel/carrier in this data record operates.Format of Field: TextPossible Entries: "600 MHz" The 600 MHz band
"700 MHz" The 700 MHz band "800 MHz" The 800 MHz band"PCS" The PCS band"AWS" The AWS band"BRS" The BRS band"EBS" The EBS band"mmWave" The 24, 28, 39, and 47 GHz mmWave bands

"Offered Capacity" Table
For each quarter beginning 2015_Q1 and extending through 2018_Q2, and for each year thereafter extending to 2024, please provide at the level oftechnology/spectrum band the following offered capacity data at the county level, and for the United States, including the Commonwealth of Puerto Rico.Projected data shall include as separate entries capacity projections for the standalone Applicants and those for New T-Mobile.
Column G:DL+UL Bandwidth
(MHz)Description: This field contains the downlink and uplink combined bandwidth (MHz) in operation for the spectrum bandFormat of Field: NumberExample Entries: 10 Carrier = LTE
20 Carrier = LTE
Column H:BBH DL Offered
Capacity (Gbytes/Hr)
Description: Collected or projected base station to mobile offered traffic (data+voice) in Gbytes during the bouncing busy hour (BBH) for the combine The BBH traffic should be the five-day (weekday) average.For predominantly voice technologies such as GSM and 1X CDMA, the traffic unit shall be in Erlangs
Format of Field: NumberExample Entries: 75 Gbytes/Hr
Column I:BBH UL Offered
Capacity (Gbytes/Hr)
Description: Collected or projected mobile to base station offered traffic (data+voice) in Gbytes during the bouncing busy hour (BBH) for the combine The BBH traffic should be the five-day (weekday) average.For predominantly voice technologies such as GSM and 1X CDMA, the traffic unit shall be in Erlangs
Format of Field: NumberExample Entries: 20 Gbytes/Hr
Column J: Latency (ms.)Description: Collected or projected network latency (round-trip) in milisecondsFormat of Field: NumberExample Entries: 70 ms.

Date Operator County CMA Technology Spectrum BandDL+UL Bandwidth (MHz)
BBH DL Offered Capacity (Gbytes/Hr)
BBH UL Offered Capacity (Gbytes/Hr) Latency (ms.)
Page 19 Offered Capacity Template
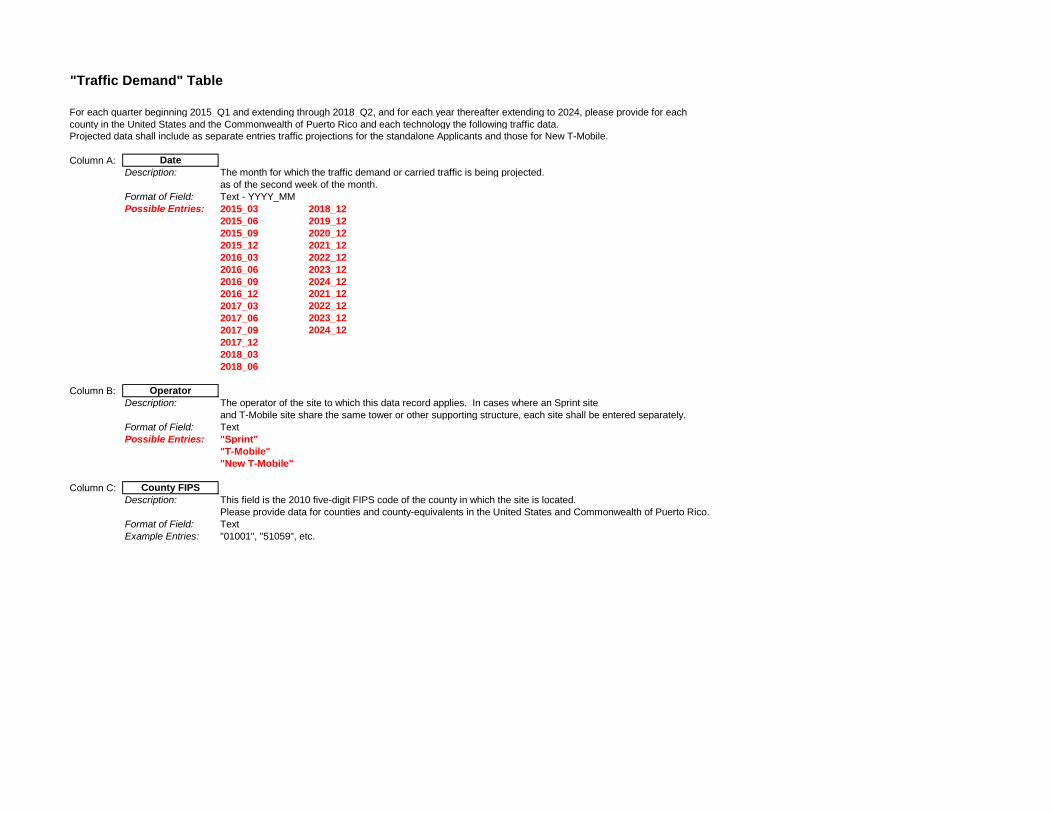
"Traffic Demand" Table
For each quarter beginning 2015_Q1 and extending through 2018_Q2, and for each year thereafter extending to 2024, please provide for each county in the United States and the Commonwealth of Puerto Rico and each technology the following traffic data.Projected data shall include as separate entries traffic projections for the standalone Applicants and those for New T-Mobile.
Column A: DateDescription: The month for which the traffic demand or carried traffic is being projected.
as of the second week of the month.Format of Field: Text - YYYY_MMPossible Entries: 2015_03 2018_12
2015_06 2019_122015_09 2020_122015_12 2021_122016_03 2022_122016_06 2023_122016_09 2024_122016_12 2021_122017_03 2022_122017_06 2023_122017_09 2024_122017_122018_032018_06
Column B: OperatorDescription: The operator of the site to which this data record applies. In cases where an Sprint site
and T-Mobile site share the same tower or other supporting structure, each site shall be entered separately.Format of Field: TextPossible Entries: "Sprint"
"T-Mobile""New T-Mobile"
Column C: County FIPSDescription: This field is the 2010 five-digit FIPS code of the county in which the site is located.
Please provide data for counties and county-equivalents in the United States and Commonwealth of Puerto Rico.Format of Field: TextExample Entries: "01001", "51059", etc.

"Traffic Demand" Table
For each quarter beginning 2015_Q1 and extending through 2018_Q2, and for each year thereafter extending to 2024, please provide for each county in the United States and the Commonwealth of Puerto Rico and each technology the following traffic data.Projected data shall include as separate entries traffic projections for the standalone Applicants and those for New T-Mobile.
Column D: CMADescription: This field represents the standard market number of the CMA in which the site is located.
Please provide data for CMAs in the United States and Commonwealth of Puerto Rico.Format of Field: Number - IntegerPossible Entries: Integers 1 - 729
Column E: TechnologyDescription: This field indicates the technology standard of this record.Format of Field: TextPossible Entries: "1X" A carrier/channel that supports 1X CDMA
"EVDO" A carrier/channel that supports EVDO"GSM" A carrier/channel that supports GSM"HSPA" A carrier/channel that supports HSPA or HSPA+"LTE-R8" A LTE carrier conforming to 3GPP Release 8"LTE-R10" A LTE carrier conforming to 3GPP Release 10"LTE-R12" A LTE carrier conforming to 3GPP Release 12"LTE-R13" A LTE carrier conforming to 3GPP Release 13"LTE-LAA" A LTE Licensed Assisted Access supplemental downlink carrier"5G-R15" A 5G-NR carrier conforming to 3GPP Release 15"5G-R16" A 5G-NR carrier conforming to 3GPP Release 16"5G-R17" A 5G-NR carrier conforming to 3GPP Release 17"Fixed-Wireless" A carrier used for fixed wireless deployment"NB-IoT" Narrowband IoT"List Other" Specify a technology that does not conform to one of the technologies listed above
Column F: SubscribersDescription: The number of subscribers with the technology standard in the countyFormat of Field: NumberExample Entries: 22,000
Column G:BBH DL Traffic
Demand (Gbytes/Hr)
Description: Collected or projected base station to mobile traffic (data+voice) demand in Gbytes/Hr during the bouncing busy hour (BBH) for the county and techThe BBH traffic should be the five-day (weekday) average.For predominantly voice technologies such as GSM and 1X CDMA, the traffic unit shall be in Erlangs
Format of Field: NumberExample Entries: 15,000 Gbytes/Hr
Column H:BBH UL Traffic
Demand (Gbytes/Hr)
Description: Collected or projected mobile to base station traffic (data+voice) demand in Gbytes/Hr during the bouncing busy hour (BBH) for the county and technThe BBH traffic should be the five-day (weekday) average.For predominantly voice technologies such as GSM and 1X CDMA, the traffic unit shall be in Erlangs
Format of Field: NumberExample Entries: 3,000 Gbytes/Hr

"Traffic Demand" Table
For each quarter beginning 2015_Q1 and extending through 2018_Q2, and for each year thereafter extending to 2024, please provide for each county in the United States and the Commonwealth of Puerto Rico and each technology the following traffic data.Projected data shall include as separate entries traffic projections for the standalone Applicants and those for New T-Mobile.
Column I:BBH DL Speed
(Mbps)Description: Average user dowload speed (Mbps) during the bouncing busy hour (BBH) for the county and technology
The BBH traffic should be the five-day (weekday) average.Format of Field: NumberExample Entries: 5 Mbps
Column J:BBH UL Speed
(Mbps)Description: Average user upload speed (Mbps) during the bouncing busy hour (BBH) for the county and technology
The BBH traffic should be the five-day (weekday) average.Format of Field: NumberExample Entries: 1 Mbps
Column K: BBH Latency (Ms)Description: Average latency (round-trip) in milliseconds during the bouncing busy hour (BBH) for the county and technology
The BBH traffic should be the five-day (weekday) average.Format of Field: NumberExample Entries: 80 ms.
Column L:Avg DL Traffic
Demand (Gbytes/Hr)
Description: Collected or projected average base station to mobile traffic (data+voice) demand in Gbytes/Hr over the course of a 24-hour day, as a montly average, including weekends, for the county and technologyFor predominantly voice technologies such as GSM and 1X CDMA, the traffic unit shall be in Erlangs
Format of Field: NumberExample Entries: 5,000 Gbytes/Hr
Column M:Avg UL Traffic
Demand (Gbytes/Hr)
Description: Collected or projected average mobile to base station traffic (data+voice) demand in Gbytes/Hr over the course of a 24-hour day, as a montly average, including weekends, for the county and technologyFor predominantly voice technologies such as GSM and 1X CDMA, the traffic unit shall be in Erlangs
Format of Field: NumberExample Entries: 1,000 Gbytes/Hr

"Traffic Demand" Table
For each quarter beginning 2015_Q1 and extending through 2018_Q2, and for each year thereafter extending to 2024, please provide for each county in the United States and the Commonwealth of Puerto Rico and each technology the following traffic data.Projected data shall include as separate entries traffic projections for the standalone Applicants and those for New T-Mobile.
Column N:Avg DL Speed
(Mbps)Description: Average user dowload speed (Mbps) over the course of a 24-hour day as a montly average, including weekends,
for the county and technologyFormat of Field: NumberExample Entries: 22 Mbps
Column O:Avg UL Speed
(Mbps)Description: Average user upload speed (Mbps) over the course of a 24-hour day as a montly average, including weekends,
for the county and technologyFormat of Field: NumberExample Entries: 6 Mbps
Column P: Avg Latency (Ms)Description: Average user latency (round-trip) in milliseconds over the course of a 24-hour day as a montly average, including weekends, for the county and technFormat of Field: NumberExample Entries: 70 ms.
Column Q:Data Blocking
Rate (%)Description: The percentage of data requests that were blocked or failed to connect as a montly average, including weekends, for the county and technologyFormat of Field: Number - at least 4 decimal pointsExample Entries: 0.0179
Column R:Dropped Calls Rate
(%)Description: The percentage of calls that were dropped as a montly average, including weekends, for the county and technologyFormat of Field: Number - at least 4 decimal pointsExample Entries: 0.0024
Column S:Blocked Call Rate
(%)Description: The percentage of call requests that were blocked or failed to connect as a montly average, including weekends, for the county and technologyFormat of Field: Number - at least 4 decimal pointsExample Entries: 0.0024

Date Operator County CMA Technology SubscribersBBH DL Traffic Demand (Gbytes/Hr)
BBH UL Traffic Demand (Gbytes/Hr)
BBH DL Speed (Mbps)

BBH UL Speed (Mbps)
BBH Latency
(Ms)
Avg DL Traffic
Demand (Gbytes/Hr)
Avg UL Traffic
Demand (Gbytes/Hr)
Avg DL Speed (Mbps)
Avg UL Speed (Mbps)
Avg Latency
(Ms)
Data Blocking Rate (%)
Dropped Calls
Rate (%)
Blocked Call Rate
(%)