Embed Size (px)
Citation preview

Attachment 7 Gas Conditioning Facility Regulatory Review
and Best Available Control Technology Analysis
ALASKA STAND ALONE PIPELINE/ASAP
PROJECT
Gas Conditioning Facility Regulatory Review and Best Available Control
Technology Analysis
008-14-910-009 October 2014

NOTICE
THIS DOCUMENT CONTAINS CONFIDENTIAL AND PROPRIETARY INFORMATION AND SHALL NOT BE DUPLICATED, DISTRIBUTED, DISCLOSED, SHARED OR USED FOR ANY PURPOSE EXCEPT AS MAY BE AUTHORIZED BY AGDC IN WRITING.

Alaska Gasline Development Corporation I 3201 C Street, Suite 200 I Anchorage, AK 99503
P 907.330.6300 I F 907.330.6309 I Toll-Free 855.277.4491 I www.agdc.us
October 9, 2014
John Kuterbach Alaska Dept. of Environmental Conservation Air Permits Program Manager 410 Willoughby Ave, Ste 303 P.O. 111800 Juneau, Alaska 99811-1800 Subject: Submittal of ASAP GCF Regulatory Review and BACT Analysis
Dear Mr. Kuterbach,
The Alaska Gasline Development Corporation (AGDC) is proposing the Alaska Stand Alone Pipeline (ASAP) project, a 737-mile 36-inch-diameter pipeline system with a North Slope Gas Conditioning Facility(GCF). The purpose of the GCF is to process the feed gas as received from the Prudhoe Bay producers into consumer grade gas for distribution through the pipeline. The facility will compress and chill the gas, and remove excessive amounts of Carbon Dioxide (CO2), Hydrogen Sulfide (H2S) and water from the feed gas prior to its entering the pipeline.
The proposed facility is located in an attainment area under the National Ambient Air Quality Standards (NAAQS), and the Prevention of Significant Deterioration (PSD) program requirements will apply to the project. According to both the federal and Alaska Department of Environmental Conservation (ADEC) regulations, the proposed GCF will be a major stationary source for PSD if it has the potential to emit more than 250 tons per year (tpy) of any regulated PSD pollutant. This project will be subject to PSD review because potential facility Nitrogen Oxides (NOx) and Carbon Monoxide (CO) emissions will be greater than the 250 tpy PSD threshold.
While ADEC will ultimately decide which regulations apply and which control technology must be used on the equipment to meet Best Available Control Technology (BACT), it is the responsibility of AGDC to provide the information needed for ADEC to make these determinations through the attached report document, ASAP Gas Conditioning Facility Regulatory Review and Best Available Control Technology Analysis. This report presents the required BACT analysis for emissions of NOx, CO, Volatile Organic Compound (VOC), PM10/PM2.5, and Greenhouse Gas (GHG) from the GCF.

Alaska Stand Alone Pipeline/ASAP October 9, 2014 Page 2 of 2
Alaska Gasline Development Corporation I 3201 C Street, Suite 200 I Anchorage, AK 99503
P 907.330.6300 I F 907.330.6309 I Toll-Free 855.277.4491 I www.agdc.us
Final equipment cannot be identified until competitive procurement, which will occur after receipt of the permit; therefore, this GHG BACT analysis is based on equipment known to be of the size and efficiency required (thus, similar to) of the various options to be bid.
Reasonable operating profiles based on assumed use of the indicative equipment will be used to develop long averaging period, output-based limits, as suggested in USEPA guidance (2011). AGDC commits to meeting the limits proposed herein regardless of final equipment selection.
AGDC at this time requests a review of this preliminary document to determine if it meets ADEC’s criteria for completeness. In addition, AGDC would appreciate ADEC’s comments regarding any concerns or omissions in the attached document. AGDC plans on submitting a complete permit application before the end of January 2015. Receipt of ADEC’s comments by November 14 would accommodate the current schedule.
Please let me know if you have any questions, I can be reached at (907) 330-6364 or by email at [email protected] . Again, AGDC greatly appreciates the support from you and your staff and we look forward to proceeding with the permitting of the ASAP Gas Conditioning Facility. Best regards,
Alyssa Looney ASAP/ Environmental, Regulatory, and Land Operations Lead
cc: Mike Thompson, ASAP Environmental, Regulatory, and Lands Manager
Carrie MacDougall, CH2M HILL Air Permitting Program Manager Patrick Dunn, ADEC Alan Schuler, ADEC
Attachment: ASAP Final Gas Conditioning Facility Regulatory Review and Best Available Control Technology Analysis, Doc No. 008-C-22-RTA-D-0004
Final Regulatory Review and BACT Analysis of the GCF
Deliverable No: 008-14-910-005 Date: October 8, 2014 Page iii NOTICE – THIS DOCUMENT CONTAINS CONFIDENTIAL AND PROPRIETARY INFORMATION AND SHALL NOT BE DUPLICATED, DISTRIBUTED, DISCLOSED, SHARED OR USED FOR ANY PURPOSE EXCEPT AS MAY BE AUTHORIZED BY AGDC IN WRITING. THIS DOCUMENT IS UNCONTROLLED WHEN PRINTED. THIS COPY VALID ONLY AT THE TIME OF PRINTING
REVISION HISTORY
Revision Date Comment Approval
Company Preparing Report AGDC
1 10/5/2014 Approved Alyssa Looney

Final Regulatory Review and BACT Analysis of the GCF
Deliverable No: 008-14-910-005 Date: October 8, 2014 Page iv NOTICE – THIS DOCUMENT CONTAINS CONFIDENTIAL AND PROPRIETARY INFORMATION AND SHALL NOT BE DUPLICATED, DISTRIBUTED, DISCLOSED, SHARED OR USED FOR ANY PURPOSE EXCEPT AS MAY BE AUTHORIZED BY AGDC IN WRITING. THIS DOCUMENT IS UNCONTROLLED WHEN PRINTED. THIS COPY VALID ONLY AT THE TIME OF PRINTING
ACRONYMS AND ABBREVIATIONS
µ micron
$/mt dollar per metric ton
$/t dollar per short ton
°F degree Fahrenheit
2012 WESTCARB Atlas The 2012 United States Carbon Utilization and Storage Atlas
AAC Alaska Administrative Code
ACT Alternative Control Techniques
ADEC Alaska Department of Environmental Conservation
AEP American Electric Power
AGDC Alaska Gasline Development Corporation
AP-42 AP-42: Compilation of Air Pollutant Emission Factors
Arctic Solutions Fluor WorleyParsons Arctic Solutions joint venture
ASAP Alaska Stand Alone Pipeline
AST Aboveground Storage Tank
BACT Best Available Control Technology
BEST Bellona Environmental CCS Team
BTU/hp-hr British thermal unit per horsepower hour
BTU/kWh British thermal unit per kilowatt-hour
CaCO3 Calcium Carbonate

Final Regulatory Review and BACT Analysis of the GCF
Deliverable No: 008-14-910-005 Date: October 8, 2014 Page v NOTICE – THIS DOCUMENT CONTAINS CONFIDENTIAL AND PROPRIETARY INFORMATION AND SHALL NOT BE DUPLICATED, DISTRIBUTED, DISCLOSED, SHARED OR USED FOR ANY PURPOSE EXCEPT AS MAY BE AUTHORIZED BY AGDC IN WRITING. THIS DOCUMENT IS UNCONTROLLED WHEN PRINTED. THIS COPY VALID ONLY AT THE TIME OF PRINTING
CatOx Catalytic Oxidation
CCS Carbon Capture and Storage
CCUS Carbon Capture, Use, and Storage
CDM Clean Development Mechanism
CFR Code of Federal Regulations
CGF Central Gas Facility
CH4 Methane
CMS Continuous Monitoring System
CO Carbon Monoxide
CO2 Carbon Dioxide
CO2e Carbon Dioxide Equivalent
CPM Continuous Parameter Monitor
CRF Capital Recovery Factor
CTG Combustion Turbine Generator
DLE Dry Low Emissions
DLN Dry Low NOx Combustor
EOR Enhanced Oil Recovery
FGR Flue-gas Recirculation
Fluor Fluor Corporation
FOM Fixed O&M Costs
FSNL Full Speed No Load
g gram
Final Regulatory Review and BACT Analysis of the GCF
Deliverable No: 008-14-910-005 Date: October 8, 2014 Page vi NOTICE – THIS DOCUMENT CONTAINS CONFIDENTIAL AND PROPRIETARY INFORMATION AND SHALL NOT BE DUPLICATED, DISTRIBUTED, DISCLOSED, SHARED OR USED FOR ANY PURPOSE EXCEPT AS MAY BE AUTHORIZED BY AGDC IN WRITING. THIS DOCUMENT IS UNCONTROLLED WHEN PRINTED. THIS COPY VALID ONLY AT THE TIME OF PRINTING
G&A General and Administrative
GCF Gas Conditioning Facility
GDF Gasoline Dispensing Facility
GE General Electrical
GHG Tailoring Rule Prevention of Significant Deterioration and Title V Greenhouse Gas Tailoring Rule
GHG Greenhouse Gas
H20 Water
H2S Hydrogen Sulfide
HAP Hazardous Air Pollutant
HFC Hydrofluorocarbon
hp horsepower
HRSG Heat Recovery Steam Generator
Hz hertz
IC Internal Combustion
ICO2N Integrated CO2 Network
iHAP Individual HAP
IPCC Intergovernmental Panel on Climate Change
ISO International Organization for Standardization
kPa kiloPascal
kW kilowatt
LAER Lowest Achievable Emissions Rate
lb pound
Final Regulatory Review and BACT Analysis of the GCF
Deliverable No: 008-14-910-005 Date: October 8, 2014 Page vii NOTICE – THIS DOCUMENT CONTAINS CONFIDENTIAL AND PROPRIETARY INFORMATION AND SHALL NOT BE DUPLICATED, DISTRIBUTED, DISCLOSED, SHARED OR USED FOR ANY PURPOSE EXCEPT AS MAY BE AUTHORIZED BY AGDC IN WRITING. THIS DOCUMENT IS UNCONTROLLED WHEN PRINTED. THIS COPY VALID ONLY AT THE TIME OF PRINTING
lb/hp-h pound per horsepower hour
lb/hr pound per hour
lb/MMBTU pound per million British thermal units
lb/MWh pound per megawatt-hour
lb/SCF pound per standard cubic foot
LDAR Leak Detection and Repair
LNB Low NOx Burner
Lower 48 Lower Continental 48 U.S. States
LPG Liquefied Petroleum Gas
MAC Marginal Abatement Cost
MACT Maximum Available Control Technology
MCF million cubic feet
MI Miscible Injectant
MMBTU million British thermal units
MMBTU/hr million British thermal units per hour
MMSCFD million standard cubic feet per day
mtpd metric ton per day
MW megawatt
N Nitrogen
N2 Gaseous Nitrogen
N2O Nitrous Oxide
NAAQS National Ambient Air Quality Standards
Final Regulatory Review and BACT Analysis of the GCF
Deliverable No: 008-14-910-005 Date: October 8, 2014 Page viii NOTICE – THIS DOCUMENT CONTAINS CONFIDENTIAL AND PROPRIETARY INFORMATION AND SHALL NOT BE DUPLICATED, DISTRIBUTED, DISCLOSED, SHARED OR USED FOR ANY PURPOSE EXCEPT AS MAY BE AUTHORIZED BY AGDC IN WRITING. THIS DOCUMENT IS UNCONTROLLED WHEN PRINTED. THIS COPY VALID ONLY AT THE TIME OF PRINTING
NACAP North American Carbon Atlas Partnership
NATCARB/ATLAS National Carbon Sequestration Database and Geographic Information System NESHAP National Emission Standards for Hazardous Air Pollutants
NETL National Energy Technology Laboratory
NGL Natural Gas Liquid
NH3 Ammonia
NO Nitric Oxide
NO2 Nitrogen Dioxide
NOx Nitrogen Oxides
NSPS New Source Performance Standard
NSR New Source Review
O&G Oil and Gas
O&M Operations and Maintenance
O2 Oxygen
OAQPS Office of Air Quality Planning and Studies
ODS Ozone-depleting Substance
PBU Prudhoe Bay Unit
PFC Perfluorocarbon
PM Particulate Matter
PM10 Particulate Matter of 10 µ in diameter or smaller
PM2.5 Particulate Matter of 2.5 µ in diameter or smaller
ppm part per million

Final Regulatory Review and BACT Analysis of the GCF
Deliverable No: 008-14-910-005 Date: October 8, 2014 Page ix NOTICE – THIS DOCUMENT CONTAINS CONFIDENTIAL AND PROPRIETARY INFORMATION AND SHALL NOT BE DUPLICATED, DISTRIBUTED, DISCLOSED, SHARED OR USED FOR ANY PURPOSE EXCEPT AS MAY BE AUTHORIZED BY AGDC IN WRITING. THIS DOCUMENT IS UNCONTROLLED WHEN PRINTED. THIS COPY VALID ONLY AT THE TIME OF PRINTING
ppmv part per million by volume
PSD Prevention of Significant Deterioration
psia pound per square inch absolute
PTE Potential to Emit
QA Quality Assurance
QC Quality Control
RACT Reasonably Available Control Technology
RBLC RACT/BACT/LAER Clearinghouse
RCRA Resource Conservation and Recovery Act
RMP Risk Management Plan
ROM Rough Order of Magnitude
SCR Selective Catalytic Reduction
SER Significant Emission Rate
SF6 Sulfur Hexafluoride
SNCR Selective Non-catalytic Reduction
SO2 Sulfur Dioxide
SO3 Sulfur Trioxide
Solar Solar Turbines Corporation
STG Steam Turbine Generator
stpd short ton per day
stpy short ton per year
TCI Total Capital Investment
Final Regulatory Review and BACT Analysis of the GCF
Deliverable No: 008-14-910-005 Date: October 8, 2014 Page x NOTICE – THIS DOCUMENT CONTAINS CONFIDENTIAL AND PROPRIETARY INFORMATION AND SHALL NOT BE DUPLICATED, DISTRIBUTED, DISCLOSED, SHARED OR USED FOR ANY PURPOSE EXCEPT AS MAY BE AUTHORIZED BY AGDC IN WRITING. THIS DOCUMENT IS UNCONTROLLED WHEN PRINTED. THIS COPY VALID ONLY AT THE TIME OF PRINTING
TDC Total Direct Cost
TDIC Total Direct and Indirect Costs
TEG Triethylene Glycol
tHAP All HAPs Combined
TIAC Total Indirect Cost
TICC Total Installed Capital Cost
U.S. United States
ULSD Ultra-low-sulfur Diesel
USDOE U.S. Department of Energy
USEPA U.S. Environmental Protection Agency
UST Underground Storage Tank
VOC Volatile Organic Compound
VOM Variable O&M Cost
VRU Vapor Recovery Unit
WESTCARB West Coast Regional Carbon Sequestration Partnership

Final Regulatory Review and BACT Analysis of the GCF
Deliverable No: 008-14-910-005 Date: October 8, 2014 Page xi NOTICE – THIS DOCUMENT CONTAINS CONFIDENTIAL AND PROPRIETARY INFORMATION AND SHALL NOT BE DUPLICATED, DISTRIBUTED, DISCLOSED, SHARED OR USED FOR ANY PURPOSE EXCEPT AS MAY BE AUTHORIZED BY AGDC IN WRITING. THIS DOCUMENT IS UNCONTROLLED WHEN PRINTED. THIS COPY VALID ONLY AT THE TIME OF PRINTING
REFERENCE DOCUMENTS
AGDC Acronyms and Glossary of Terms
Alaska Gasline Development Corporation (AGDC). 2014. Alaska Stand Alone Pipeline Plan of Development. June.
Arctic Solutions Inc. (Arctic Solutions). 2013. Response to Requests for Emissions Information. Document No: 035-C-24-R-P-0008. December 30.
Arctic Solutions Inc. (Arctic Solutions). 2014a. ROM Study Estimate(s) CO2 Capture, BACT Emis-sions Control, SCR/CO Catalyst Installations. 035-C-20-P-S-0003. June 27.
Arctic Solutions Inc. (Arctic Solutions). 2014b. ROM Study Estimate(s) Supporting Document for BACT Analysis. 035-C-24-R-P-0013. July 14.

Final Regulatory Review and BACT Analysis of the GCF
Deliverable No: 008-14-910-005 Date: October 8, 2014 Page xii NOTICE – THIS DOCUMENT CONTAINS CONFIDENTIAL AND PROPRIETARY INFORMATION AND SHALL NOT BE DUPLICATED, DISTRIBUTED, DISCLOSED, SHARED OR USED FOR ANY PURPOSE EXCEPT AS MAY BE AUTHORIZED BY AGDC IN WRITING. THIS DOCUMENT IS UNCONTROLLED WHEN PRINTED. THIS COPY VALID ONLY AT THE TIME OF PRINTING
TABLE OF CONTENTS
1. Introduction .......................................................................................................................... 16
2. Regulatory Review ............................................................................................................... 17 2.1 New Source Review ...................................................................................................... 17 2.2 New Source Performance Standards .............................................................................. 18
2.3 National Emission Standards for Hazardous Air Pollutants .......................................... 22
2.4 40 CFR 72, Acid Rain Program ..................................................................................... 23 2.5 40 CFR 68, Chemical Accident Prevention Provisions ................................................. 23 2.6 40 CFR 82, Protection of Stratospheric Ozone .............................................................. 24 2.7 40 CFR 98, Mandatory Greenhouse Gas Reporting ...................................................... 24
2.8 Alaska Air Quality Management ................................................................................... 25

Final Regulatory Review and BACT Analysis of the GCF
Deliverable No: 008-14-910-005 Date: October 8, 2014 Page xiii NOTICE – THIS DOCUMENT CONTAINS CONFIDENTIAL AND PROPRIETARY INFORMATION AND SHALL NOT BE DUPLICATED, DISTRIBUTED, DISCLOSED, SHARED OR USED FOR ANY PURPOSE EXCEPT AS MAY BE AUTHORIZED BY AGDC IN WRITING. THIS DOCUMENT IS UNCONTROLLED WHEN PRINTED. THIS COPY VALID ONLY AT THE TIME OF PRINTING
3. Criteria Pollutant Best Available Control Technology ..................................................... 27 3.1 Best Available Control Technology Overview .............................................................. 27 3.2 Best Available Control Technology Determination ...................................................... 28
3.3 Combustion Turbines ..................................................................................................... 30
3.4 Emergency Diesel Generators ....................................................................................... 39
3.5 Heaters ........................................................................................................................... 44
3.6 Flares.............................................................................................................................. 49
3.7 Diesel Storage tanks ...................................................................................................... 53
3.8 Gasoline Storage Tank ................................................................................................... 55
3.9 Diesel Dispensing Facility ............................................................................................. 58
3.10 Gasoline Dispensing Facility ......................................................................................... 59
3.11 Burn Pit .......................................................................................................................... 61
Final Regulatory Review and BACT Analysis of the GCF
Deliverable No: 008-14-910-005 Date: October 8, 2014 Page xiv NOTICE – THIS DOCUMENT CONTAINS CONFIDENTIAL AND PROPRIETARY INFORMATION AND SHALL NOT BE DUPLICATED, DISTRIBUTED, DISCLOSED, SHARED OR USED FOR ANY PURPOSE EXCEPT AS MAY BE AUTHORIZED BY AGDC IN WRITING. THIS DOCUMENT IS UNCONTROLLED WHEN PRINTED. THIS COPY VALID ONLY AT THE TIME OF PRINTING
4. Greenhouse Gas Best Available Control Technology ....................................................... 62 4.1 Overview ........................................................................................................................ 62 4.2 Regulatory Basis ............................................................................................................ 63 4.3 Combustion Sources ...................................................................................................... 64
4.4 Fugitives ........................................................................................................................ 90 4.5 Flares and Vents ............................................................................................................ 90
5. References ............................................................................................................................. 92
Appendix
A RBLC Tables

Final Regulatory Review and BACT Analysis of the GCF
Deliverable No: 008-14-910-005 Date: October 8, 2014 Page xv NOTICE – THIS DOCUMENT CONTAINS CONFIDENTIAL AND PROPRIETARY INFORMATION AND SHALL NOT BE DUPLICATED, DISTRIBUTED, DISCLOSED, SHARED OR USED FOR ANY PURPOSE EXCEPT AS MAY BE AUTHORIZED BY AGDC IN WRITING. THIS DOCUMENT IS UNCONTROLLED WHEN PRINTED. THIS COPY VALID ONLY AT THE TIME OF PRINTING
TABLES
Table 1. Potential Emissions Compared to Permitting Thresholds .......................................... 18
Table 2. Summary of Criteria Pollutant Best Available Control Technology Analysis .......... 27
Table 3. Cost-effectiveness of Selective Catalytic Reduction Installed for the Power Generation Turbines .................................................................................................. 33
Table 4. Cost-effectiveness of Selective Catalytic Reduction Installed for the Feed-gas Turbines ..................................................................................................................... 33
Table 5. Cost-effectiveness of Selective Catalytic Reduction Installed for the Carbon Dioxide Compressor Turbines ................................................................................................. 34
Table 6. Cost-effectiveness of Catalytic Oxidation Installed for the Power Generation Turbines ..................................................................................................................... 36
Table 7. Cost-effectiveness of Catalytic Oxidation Installed for the Feed-gas Compressor Turbines ..................................................................................................................... 36
Table 8. Cost-effectiveness of Catalytic Oxidation Installed for the Carbon Dioxide Compressor Turbines ................................................................................................. 37
Table 9. Control Cost for Selective Catalytic Reduction on Compression Ignition Engines (2.5-Megawatt Emergency Generator) ...................................................................... 42
Table 10. Cost-effectiveness of Selective Catalytic Reduction Installed for the Heaters .......... 46
Table 11. Cost-effectiveness of Catalytic Oxidation Installed for the Heaters .......................... 48
Table 12. Summary of Gasoline Dispensing Facility Vapor Recovery Cost Analysis .............. 61
Table 13. Combustion Turbine Comparison .............................................................................. 75
Table 14. Feed-gas Compressor Turbine Comparison ............................................................... 77
Table 15. Carbon Dioxide Compressor Turbine Comparison ................................................... 78
Table 16. Cost-effectiveness of Carbon Capture and Storage: Combusted Carbon Dioxide..... 83
Final Regulatory Review and BACT Analysis of the GCF
Deliverable No: 008-14-910-005 Date: October 8, 2014 Page 16 NOTICE – THIS DOCUMENT CONTAINS CONFIDENTIAL AND PROPRIETARY INFORMATION AND SHALL NOT BE DUPLICATED, DISTRIBUTED, DISCLOSED, SHARED OR USED FOR ANY PURPOSE EXCEPT AS MAY BE AUTHORIZED BY AGDC IN WRITING. THIS DOCUMENT IS UNCONTROLLED WHEN PRINTED. THIS COPY VALID ONLY AT THE TIME OF PRINTING
1. INTRODUCTION
A regulatory review and a Best Available Control Technology (BACT) analysis will be required sections of the Alaska Stand Alone Pipeline (ASAP) Gas Conditioning Facility (GCF) air permit application. While the Alaska Department of Environmental Conservation (ADEC) will ultimately decide which regulations apply and which control technology must be used on the equipment to satisfy BACT requirements, it is the responsibility of the Alaska Gasline Development Corporation (AGDC) as the permit applicant, to provide the information needed for ADEC to make these de-terminations.
This document was prepared to provide AGDC with a draft of the permit application sections. Comments about this document will be incorporated into the permit application.
Final Regulatory Review and BACT Analysis of the GCF
Deliverable No: 008-14-910-005 Date: October 8, 2014 Page 17 NOTICE – THIS DOCUMENT CONTAINS CONFIDENTIAL AND PROPRIETARY INFORMATION AND SHALL NOT BE DUPLICATED, DISTRIBUTED, DISCLOSED, SHARED OR USED FOR ANY PURPOSE EXCEPT AS MAY BE AUTHORIZED BY AGDC IN WRITING. THIS DOCUMENT IS UNCONTROLLED WHEN PRINTED. THIS COPY VALID ONLY AT THE TIME OF PRINTING
2. REGULATORY REVIEW
This section discusses permitting regulations for the proposed GCF project as a whole, and federal and state regulatory applicability for individual emission units.
2.1 NEW SOURCE REVIEW
ADEC is the lead air permitting authority for the project. ADEC’s air permitting requirements are codified in the Alaska Administrative Code (AAC) 18, Environmental Quality. The AAC incorpo-rates the federal program requirements listed in Section 40 Code of Federal Regulations (CFR) Parts 50-99 and establishes permit review procedures.
For areas that meet the National Ambient Air Quality Standards (NAAQS), the U.S. Environmental Protection Agency (USEPA) established the Prevention of Significant Deterioration (PSD) pro-gram in 40 CFR 52.21 for major new air emissions sources and major modifications to existing major sources of air pollution. The ADEC adopted the PSD requirements in 18 AAC 50.035 and 18 AAC 50.306. The proposed facility is located in an attainment area under the NAAQS, and the PSD program requirements will apply to the project.
According to both the federal and ADEC regulations, the proposed GCF will be a major stationary source for PSD if it has the potential to emit more than 250 short tons per year (stpy) of any regu-lated New Source Review (NSR) pollutant. This project will be subject to PSD review because potential facility Nitrogen Oxides (NOx) and Carbon Monoxide (CO) emissions will be greater than the 250-stpy PSD threshold.
A June 2014 U.S. Supreme Court ruling changes how the USEPA can regulate Greenhouse Gas (GHG) emissions for sources seeking to obtain an air permit. USEPA will no longer be able to treat GHG emissions as an air pollutant for the purpose of determining whether a PSD or Title V air permit is required. As this ruling is new, USEPA will be providing guidance and information at a later time; however, based on the ruling, the GHG PSD threshold of 75,000 stpy will likely not apply when determining GCF permitting responsibilities.
For facilities qualifying for PSD review, a further comparison is required between potential emis-sions and the PSD significance level for each NSR pollutant. For any pollutant where annual po-tential emissions are expected to exceed the significance level, a PSD analysis must be performed. As presented in Table 1, it is expected that GCF emissions will exceed the PSD significance level for all regulated NSR pollutants except Sulfur Dioxide (SO2). For those NSR pollutants not in-cluded in Table 1, emissions of these pollutants are either not associated with the proposed project or will be well less than the significant emission rate presented in 40 CFR 52.21.

Final Regulatory Review and BACT Analysis of the GCF
Deliverable No: 008-14-910-005 Date: October 8, 2014 Page 18 NOTICE – THIS DOCUMENT CONTAINS CONFIDENTIAL AND PROPRIETARY INFORMATION AND SHALL NOT BE DUPLICATED, DISTRIBUTED, DISCLOSED, SHARED OR USED FOR ANY PURPOSE EXCEPT AS MAY BE AUTHORIZED BY AGDC IN WRITING. THIS DOCUMENT IS UNCONTROLLED WHEN PRINTED. THIS COPY VALID ONLY AT THE TIME OF PRINTING
Table 1. Potential Emissions Compared to Permitting Thresholds
POLLUTANT TOTAL PTE
(stpy)
TITLE V MAJOR SOURCE THRESHOLD
(stpy) PSD SIGNIFICANCE
LEVELa (stpy)
NOx 789 100 40
CO 588 100 100
PM/PM10/PM2.5 52 100 25/15/10
SO2 5.2 100 40
VOC 172 100 40
HAP 11 25 total/10 individual --
CO2e 1,030,000 100,000b -
aHAPs are not a regulated NSR pollutant under the Alaska PSD program. b – Only applies if source already major for another pollutant.
µ - micron
CO2e - Carbon Dioxide Equivalent
HAP - Hazardous Air Pollutant
PM - Particulate Matter
PM10 - Particulate Matter of 10 µ in diameter or smaller
PM2.5 - Particulate Matter of 2.5 µ in diameter or smaller
PTE - Potential to Emit
VOC - Volatile Organic Compound
In addition to a BACT analysis, PSD permitting will also require both impact analyses and public participation prior to issuance of a permit. The impact analyses will need to assess the project’s impact on the NAAQS and on air, ground, and water pollution on soils, vegetation, and visibility. Public participation is required prior to finalization of the permit. The public comment period is usually 30 days, and may be longer if there is significant public interest.
Also applicable to the GCF is 18 AAC 50.306, which requires that a PSD construction permit be obtained prior to beginning actual construction. Because the potential facility emissions exceed the major source threshold, in addition to a construction permit, a Title V operating permit will be required. Table 1 shows potential emissions from normal operations compared to the Title V, or major source, threshold. Facilities with emissions exceeding the major source threshold are re-quired to apply for a Title V air operating permit within 12 months of commencing operations.
2.2 NEW SOURCE PERFORMANCE STANDARDS
The USEPA adopted standards for new air pollution sources in 40 CFR 60. The standards relevant to the proposed GCF are discussed in detail in this section.

Final Regulatory Review and BACT Analysis of the GCF
Deliverable No: 008-14-910-005 Date: October 8, 2014 Page 19 NOTICE – THIS DOCUMENT CONTAINS CONFIDENTIAL AND PROPRIETARY INFORMATION AND SHALL NOT BE DUPLICATED, DISTRIBUTED, DISCLOSED, SHARED OR USED FOR ANY PURPOSE EXCEPT AS MAY BE AUTHORIZED BY AGDC IN WRITING. THIS DOCUMENT IS UNCONTROLLED WHEN PRINTED. THIS COPY VALID ONLY AT THE TIME OF PRINTING
2.2.1 40 CFR 60, Subpart A – General Provisions
Certain provisions of 40 CFR 60, Subpart A apply to the owner or operator of any stationary source subject to a New Source Performance Standard (NSPS). Since the proposed project will be subject to several NSPSs, the GCF will be required to comply with the provisions of Subpart A, including notification and record keeping, testing, and monitoring requirements.
2.2.2 40 CFR 60, Subpart Kb – Standards of Performance for Volatile Organic Liquid Storage Vessels for Which Construction, Reconstruction, or Modification Commenced After July 23, 1984
The GCF will engage vessels for storage of Ultra-low-sulfur Diesel (ULSD) fuel for powering emergency equipment. The GCF will also include a fuel storage and dispensing facility for fueling vehicles and equipment used at the GCF. The fuel dispensing facility will include one 9,980-gallon, vertical, fixed-roof, gasoline storage tank and three 9,980-gallon, vertical, fixed–roof, diesel stor-age tanks.
Subpart Kb applicability specifically excludes in Section 60.110b(b) any storage vessel that stores a liquid with a true vapor pressure less than 3.5 kilopascals (kPa). Diesel fuel vapor pressure is approximately 0.0031 pound per square inch absolute (psia) (0.02 kPa) at 40 degrees Fahrenheit (°F). As the true vapor pressure of diesel fuel is less than the Subpart Kb threshold, the diesel storage vessels at the GCF are not subject to Subpart Kb requirements to install additional control equipment.
Subpart Kb applicability also specifically excludes storage vessels located at gasoline service sta-tions, which are defined as: “any site where gasoline is dispensed to motor vehicle fuel tanks from stationary storage tanks.” Therefore, based on 40 CFR 60.110b(d)(6), the requirements of Subpart Kb are not applicable to the gasoline storage tank proposed at the GCF.
2.2.3 40 CFR 60, Subpart GG – Stationary Gas Turbines
The USEPA established emission standards, monitoring requirements, and testing procedures for stationary gas turbines under Subpart GG. Although the GCF will engage several gas turbines in facility operations, 40 CFR 60, Subpart KKKK exempts facilities from Subpart GG requirements if Subpart KKKK is applicable. According to Subpart KKKK, Section 60.4305(a), owners of sta-tionary combustion turbines constructed after February 18, 2005 with heat input of greater than 10 million British thermal units per hour (MMBTU/hr) are subject to that subpart. All of the pro-posed combustion turbines at the GCF will be new construction with a heat input of greater than 10 MMBTU/hr; therefore, Subpart KKKK will apply, and Subpart GG will not apply.

Final Regulatory Review and BACT Analysis of the GCF
Deliverable No: 008-14-910-005 Date: October 8, 2014 Page 20 NOTICE – THIS DOCUMENT CONTAINS CONFIDENTIAL AND PROPRIETARY INFORMATION AND SHALL NOT BE DUPLICATED, DISTRIBUTED, DISCLOSED, SHARED OR USED FOR ANY PURPOSE EXCEPT AS MAY BE AUTHORIZED BY AGDC IN WRITING. THIS DOCUMENT IS UNCONTROLLED WHEN PRINTED. THIS COPY VALID ONLY AT THE TIME OF PRINTING
2.2.4 40 CFR 60, Subpart KKK – Equipment Leaks of VOC from Onshore Natural Gas Processing Plants
The USEPA established equipment leak standards for onshore natural gas processing plants con-structed after January 20, 1984, and on or before August 23, 2011. The GCF will be constructed after August 23, 2011; therefore, Subpart KKK does not apply.
2.2.5 40 CFR 60, Subpart IIII – Standards of Performance for Internal Combustion Engines
The proposed emergency generators will be subject to 40 CFR 60, Subpart IIII. This subpart re-quires compliance with 40 CFR 60.4200, which establishes standards for non-road compression ignition engines, including the use of ULSD. All of the proposed generators are diesel-powered Tier 4 USEPA-certified engines that meet the requirements in 40 CFR Part 1039. These engines will meet or exceed the emission standards required under Subpart IIII.
2.2.6 40 CFR 60, Subpart LLL –Onshore Natural Gas Processing: SO2 Emissions
The USEPA established SO2 emission limitations under Subpart LLL for Onshore Natural Gas Processing facilities that use sweetening units and sweetening units followed by sulfur recovery units if they were constructed or modified after January 20, 1984, and on or before August 23, 2011. The GCF will be newly constructed, and as such, Subpart LLL will not apply.
2.2.7 40 CFR 60, Subpart KKKK – Stationary Combustion Turbines
As discussed in Section 5.2.1.2, Subpart KKKK applies to newer stationary combustion turbines manufactured after February 18, 2005, with greater than 10-MMBTU/hr heat input. The proposed stationary combustion turbines for the GCF exceed this threshold and are subject to the emission limits, and the compliance, monitoring, testing, and reporting requirements of Subpart KKKK.
Subpart KKKK provides specific emission limits for those turbines located north of the Arctic Cir-cle. The location of the GCF will qualify under this distinction, since it will be located at above latitude 66.5°north. The applicable NOx emission limit for each of the combustion turbines will be 96 parts per million (ppm) at 15 percent Oxygen (O2).
Emissions of SO2 are also regulated under the subpart. SO2 emissions must be limited to 90 pounds (lb) per megawatt-hour gross output, or the turbines must burn fuel that contains a maximum of 0.60 lb SO2/MMBTU heat input. Compliance with the subpart’s SO2 limit will be met through use of fuel containing less than the required sulfur content.
Subpart KKKK requires compliance with NOx emissions either with or without the use of Water (H2O) or steam injection. Initial feasibility indicates that injection of H2O or steam is not a feasible method for NOx reduction for the GCF. If further examination determines that this is a feasible option, then compliance may be demonstrated by installing, calibrating, and operating a Continuous

Final Regulatory Review and BACT Analysis of the GCF
Deliverable No: 008-14-910-005 Date: October 8, 2014 Page 21 NOTICE – THIS DOCUMENT CONTAINS CONFIDENTIAL AND PROPRIETARY INFORMATION AND SHALL NOT BE DUPLICATED, DISTRIBUTED, DISCLOSED, SHARED OR USED FOR ANY PURPOSE EXCEPT AS MAY BE AUTHORIZED BY AGDC IN WRITING. THIS DOCUMENT IS UNCONTROLLED WHEN PRINTED. THIS COPY VALID ONLY AT THE TIME OF PRINTING
Monitoring System (CMS). The CMS may be engaged to record fuel consumption and the ratio of H2O or steam to fuel, or it can be a continuous emission monitoring system.
For those facilities not complying with the NOx emission limit through H2O or steam injection, compliance with the emission limit may be demonstrated through annual performance tests. Alter-natively, a CMS or a Continuous Parameter Monitor (CPM) may be installed to continuously mon-itor NOx and a diluent gas (O2 or Carbon Dioxide [CO2]) to determine the hourly NOx emission rate. The parameters to be continuously monitored if opting for the CPM are those parameters representative of NOx emissions, which is dependent on the type of turbine and NOx control being used.
The GCF may opt to determine the sulfur content of the turbines’ combustion fuel by monitoring the sulfur content of the fuel or by engaging a fuel with a maximum rating of 0.60 lb SO2/MMBTU. If compliance is to be demonstrated through use of a fuel meeting the maximum rating, then reten-tion of fuel quality characteristic records or representative fuel sampling data may be used to demonstrate compliance.
Under consideration by USEPA at present is an amendment to the current Subpart KKKK require-ments to include emission limitations, monitoring, general compliance requirements, and reporting for CO2 emissions from stationary combustion turbines with a heat input of 250 MMBTU/hr or more. The proposed GCF combustion turbines are less than 250 MMBTU/hr; therefore, the pro-posed changes will not apply.
2.2.8 40 CFR 60, Subpart OOOO – Crude Oil and Natural Gas Production, Transmission, and Distribution
The USEPA established VOC and SO2 emission standards, monitoring, testing, and reporting pro-visions under Subpart OOOO for facilities engaged in crude oil and natural gas production, trans-mission, and distribution. The proposed project is a natural gas processing facility that will engage the Fluor Corporation (Fluor) Solvent Process. This process is proprietary, and assurances have been provided by the manufacturer and process design team that the equipment and configuration will not be subject to Subpart OOOO.
CH2M HILL does not have adequate details regarding the Fluor Solvent Process to determine whether 40 CFR 60, Subpart OOOO is applicable. Without detailed information, ADEC also cannot determine whether 40 CFR 60, Subpart OOOO is applicable. CH2M HILL will continue to assume this regulation may be applicable to the GCF until adequate information is available to provide ADEC with an alternate determination.
2.2.9 40 CFR 60.18, General Control Device Requirements
USEPA established operational and design requirements for all new flares used for compliance with 40 CFR Part 60. Specifically, it requires that such flares operate without visible emissions, have a pilot flame, and meet specific fuel quality standards. The proposed project will have four
Final Regulatory Review and BACT Analysis of the GCF
Deliverable No: 008-14-910-005 Date: October 8, 2014 Page 22 NOTICE – THIS DOCUMENT CONTAINS CONFIDENTIAL AND PROPRIETARY INFORMATION AND SHALL NOT BE DUPLICATED, DISTRIBUTED, DISCLOSED, SHARED OR USED FOR ANY PURPOSE EXCEPT AS MAY BE AUTHORIZED BY AGDC IN WRITING. THIS DOCUMENT IS UNCONTROLLED WHEN PRINTED. THIS COPY VALID ONLY AT THE TIME OF PRINTING
flares, and compliance with 40 CFR Part 60.18 will be required if it is determined that Subpart OOOO is applicable.
2.3 NATIONAL EMISSION STANDARDS FOR HAZARDOUS AIR POLLUTANTS
The USEPA has established National Emission Standards for Hazardous Air Pollutants (NESHAP) for several existing, new, or reconstructed sources in 40 CFR Part 63. The applicability of these rules is discussed in this section.
Subpart 63 defines a major source for HAPs as a stationary source that has the potential to emit 10 stpy or more of any one HAP or 25 stpy or more of a combination of HAPs. As discussed previously and shown in Table 1, ASAP will not have the potential to emit 10 stpy of any Individual HAP (iHAP) or a total of 25 stpy of all HAPs combined (tHAP). Hence, the GCF will not be considered a major HAP source; instead, for NESHAP applicability, it is considered an area source of HAP emissions.
2.3.1 40 CFR 63, Subpart HH – Oil and Natural Gas Production Facilities
USEPA adopted an NESHAP for oil and natural gas production facilities that are major or area sources of HAP emissions. For area sources of HAP emissions, the sources affected by Subpart HH include each Triethylene Glycol (TEG) dehydration unit located at a facility. The GCF will use a Fluor Solvent Process in lieu of glycol dehydration; therefore, Subpart HH will not apply.
2.3.2 40 CFR 63, Subpart HHH – Natural Gas Transmission and Storage Facilities
USEPA adopted an NESHAP for natural gas transmission and storage facilities that are major sources of HAP emissions and that use glycol dehydration as part of the facility processes. The subpart will not apply to the GCF because the facility will not be a major source of HAP emissions, and raw gas will be treated using a Fluor Solvent Process.
2.3.3 40 CFR 63, Subpart EEEE – Organic Liquids Distribution (Non-Gasoline)
USEPA adopted an NESHAP for non-gasoline organic liquids distribution located at major sources of HAP emissions. The GCF will not be subject to this subpart because the facility will not be a major source of HAP emissions.
2.3.4 40 CFR 63, Subpart YYYY – Stationary Combustion Turbines
USEPA adopted an NESHAP for stationary combustion turbines located at major sources of HAP emissions. The GCF will not be subject to this subpart because the facility will not be a major source of HAP emissions.

Final Regulatory Review and BACT Analysis of the GCF
Deliverable No: 008-14-910-005 Date: October 8, 2014 Page 23 NOTICE – THIS DOCUMENT CONTAINS CONFIDENTIAL AND PROPRIETARY INFORMATION AND SHALL NOT BE DUPLICATED, DISTRIBUTED, DISCLOSED, SHARED OR USED FOR ANY PURPOSE EXCEPT AS MAY BE AUTHORIZED BY AGDC IN WRITING. THIS DOCUMENT IS UNCONTROLLED WHEN PRINTED. THIS COPY VALID ONLY AT THE TIME OF PRINTING
2.3.5 40 CFR 63, Subpart ZZZZ – Internal Combustion Engines
USEPA adopted an NESHAP for internal combustion engines at major and area sources. The GCF generators will be newly manufactured and meet the Subpart ZZZZ criteria for new engines, mean-ing they will be constructed after June 12, 2006. For new diesel-powered engines, requirements of Subpart ZZZZ are met by compliance with 40 CFR Part 60, Subpart IIII.
2.3.6 40 CFR 63, Subpart DDDDD – Major Sources: Boilers and Process Heaters
USEPA adopted an NESHAP for boilers and process heaters (Maximum Available Control Tech-nology [MACT] for boilers, Boiler MACT). The GCF will not be a major HAP source; therefore, Subpart DDDDD will not apply.
2.3.7 40 CFR 63, Subpart CCCCCC – Area Sources: Gasoline Dispensing Facilities
The requirements established by USEPA under NESHAP Subpart CCCCC are applicable to Gas-oline Dispensing Facilities (GDFs) at area sources of HAP emissions. The subpart establishes work practice standards and requirements for testing, monitoring, notifications, records, and reporting.
The GDF to be installed at the permanent camp will have a throughput of less than 10,000 gallons per month, and as such, the requirements under Subpart CCCCCC are minimal and include work practice standards and record keeping. There are no requirements for testing, notifications, or re-porting for GDFs with a monthly throughput less than 10,000 gallons per month.
2.3.8 40 CFR 63, Subpart JJJJJJ – Area Sources: Boilers
USEPA adopted an NESHAP for boilers at area sources. Subpart JJJJJJ applies to industrial, com-mercial, or institutional boilers. The subpart specifically excludes process heaters from the defini-tion of boiler; therefore, Subpart JJJJJJ will not apply.
2.4 40 CFR 72, ACID RAIN PROGRAM
The GCF will produce electricity for powering the facility using three gas turbine power generators. The electricity will be used solely for onsite power and will not be sold commercially. The USEPA Acid Rain Program, promulgated in 40 CFR 72, does not apply to non-utility units; therefore, the provisions of the Acid Rain Program will not be applicable to the GCF.
2.5 40 CFR 68, CHEMICAL ACCIDENT PREVENTION PROVISIONS
40 CFR Part 68 is a federal regulation designed to prevent the release of flammable materials in the event of an accident and minimize impacts when releases do occur. The regulation contains a list of substances and threshold quantities for determining applicability of the rule to a facility.
Final Regulatory Review and BACT Analysis of the GCF
Deliverable No: 008-14-910-005 Date: October 8, 2014 Page 24 NOTICE – THIS DOCUMENT CONTAINS CONFIDENTIAL AND PROPRIETARY INFORMATION AND SHALL NOT BE DUPLICATED, DISTRIBUTED, DISCLOSED, SHARED OR USED FOR ANY PURPOSE EXCEPT AS MAY BE AUTHORIZED BY AGDC IN WRITING. THIS DOCUMENT IS UNCONTROLLED WHEN PRINTED. THIS COPY VALID ONLY AT THE TIME OF PRINTING
If a facility stores, handles, or processes one or more substances in this list and at a quantity equal to or greater than specified in the regulation, the facility must prepare and submit a Risk Manage-ment Plan (RMP). If a facility does not have a listed substance onsite, or the quantity of a listed substance is less than the applicability threshold, the facility does not have to prepare an RMP. However, it must still comply with requirements of the general duty provisions in Section 112(r)(1) of the 1990 Clean Air Act Amendments if it has any regulated substance or other extremely haz-ardous substance onsite.
Assessment of the chemicals and quantities to be stored, handled, and processed indicate that RMP requirements will not apply to the GCF; however, further analysis and confirmation are recom-mended as the design becomes more finalized.
2.6 40 CFR 82, PROTECTION OF STRATOSPHERIC OZONE
The Ozone-depleting Substance (ODS) requirements of 40 CFR 82 will apply to any ODS-containing equipment at the GCF, including maintenance of that equipment. Requirements will likely include restrictions on types of ODSs that can be used, record keeping, and repair practices.
2.7 40 CFR 98, MANDATORY GREENHOUSE GAS REPORTING
The USEPA established mandatory GHG reporting for facilities meeting the criteria outlined in 40 CFR 98, Subpart A. The applicability of the 40 CFR 98 subparts is discussed further in this section.
2.7.1 40 CFR 98, Subpart A – General Provisions
Subpart A established mandatory GHG reporting requirements for various facilities, including fa-cilities that emit 25,000 metric tons or more per year of CO2e emissions. As shown in Table 1, the GCF has the potential to emit greater than 25,000 metric tons of CO2e per year and will be subject to the annual reporting provisions of Subpart A. Subpart A details requirements for emission cal-culations and record keeping, including the requirement for a written GHG Monitoring Plan.
2.7.2 40 CFR 98, Subpart C – General Stationary Fuel Combustion Sources
The USEPA established criteria for calculating GHG emissions for general stationary fuel combus-tion sources. The GCF has several stationary combustion sources that will be subject to the calcu-lation procedures, monitoring, and Quality Assurance (QA)/Quality Control (QC) requirements, reporting, and record keeping requirements of Subpart C. The GCF sources that will be subject to the Subpart C provisions include combustion turbines and heaters. The emergency generators, emergency burn pit, and flares are specifically excluded from this subpart under 40 CFR 98.30(b).
Final Regulatory Review and BACT Analysis of the GCF
Deliverable No: 008-14-910-005 Date: October 8, 2014 Page 25 NOTICE – THIS DOCUMENT CONTAINS CONFIDENTIAL AND PROPRIETARY INFORMATION AND SHALL NOT BE DUPLICATED, DISTRIBUTED, DISCLOSED, SHARED OR USED FOR ANY PURPOSE EXCEPT AS MAY BE AUTHORIZED BY AGDC IN WRITING. THIS DOCUMENT IS UNCONTROLLED WHEN PRINTED. THIS COPY VALID ONLY AT THE TIME OF PRINTING
2.7.3 40 CFR 98, Subpart D – Electricity Generation
The USEPA established Subpart D for electricity-generating units that are subject to the Acid Rain Program and any units that must monitor and report to USEPA CO2 mass emissions according to 40 CFR 75.
The GCF power generation turbines will produce electricity only for the GCF. Under the definitions of 40 CFR 72, the power generation turbines do not qualify as a utility unit, since no electricity will be sold. Non-utility units are exempt from the Acid Rain Program, and they are also exempt from the requirements of 40 CFR 75, so Subpart D does not apply to the GCF.
2.7.4 40 CFR 98, Subpart W – Petroleum and Natural Gas Systems
Subpart W established GHG calculating and reporting criteria for various natural gas, liquefied natural gas, and petroleum production, process, transmission, and storage facilities. The GCF is subject to the provisions of this subpart that apply to onshore natural gas processing facilities, which includes calculation, monitoring, and reporting of GHG emissions associated with the GCF flare stacks and equipment leaks.
2.7.5 40 CFR 98, Subpart NN – Suppliers of Natural Gas and Natural Gas Liquids
The USEPA established GHG reporting criteria for suppliers of Natural Gas Liquid (NGL) frac-tionators and local natural gas distribution companies. The GCF will not be physically delivering gas to end-users, nor will NGLs be fractionated for supply to downstream facilities. Subpart NN will not apply to the GCF.
2.8 ALASKA AIR QUALITY MANAGEMENT
2.8.1 18 AAC 50.055, Industrial Processes and Fuel-Burning Equipment
ADEC has adopted emission opacity, particulate, and sulfur compound standards for fuel-burning equipment in 18 AAC 50.055. Under this regulation, opacity is limited to no more than 20 percent averaged over any 6 consecutive minutes. PM is limited to 0.05 grain per cubic foot of exhaust gas corrected to standard conditions and averaged over 3 hours. Sulfur compounds are limited to 500 ppm averaged over a 3-hour period.
2.8.2 AAC 50.080, Ice Fog Standards
ADEC reserves the right to require any person who builds or operates an industrial process or fuel-burning equipment in an area of potential ice fog to obtain a permit and to reduce H2O vapor emis-sions.
Final Regulatory Review and BACT Analysis of the GCF
Deliverable No: 008-14-910-005 Date: October 8, 2014 Page 26 NOTICE – THIS DOCUMENT CONTAINS CONFIDENTIAL AND PROPRIETARY INFORMATION AND SHALL NOT BE DUPLICATED, DISTRIBUTED, DISCLOSED, SHARED OR USED FOR ANY PURPOSE EXCEPT AS MAY BE AUTHORIZED BY AGDC IN WRITING. THIS DOCUMENT IS UNCONTROLLED WHEN PRINTED. THIS COPY VALID ONLY AT THE TIME OF PRINTING
The GCF is to be an industrial facility with fuel-burning equipment, and the area proposed for the facility does have potential for ice fog; therefore, the ADEC may impose permit restrictions based on this standard.
Final Regulatory Review and BACT Analysis of the GCF
Deliverable No: 008-14-910-005 Date: October 8, 2014 Page 27 NOTICE – THIS DOCUMENT CONTAINS CONFIDENTIAL AND PROPRIETARY INFORMATION AND SHALL NOT BE DUPLICATED, DISTRIBUTED, DISCLOSED, SHARED OR USED FOR ANY PURPOSE EXCEPT AS MAY BE AUTHORIZED BY AGDC IN WRITING. THIS DOCUMENT IS UNCONTROLLED WHEN PRINTED. THIS COPY VALID ONLY AT THE TIME OF PRINTING
3. CRITERIA POLLUTANT BEST AVAILABLE CONTROL TECHNOLOGY
3.1 BEST AVAILABLE CONTROL TECHNOLOGY OVERVIEW
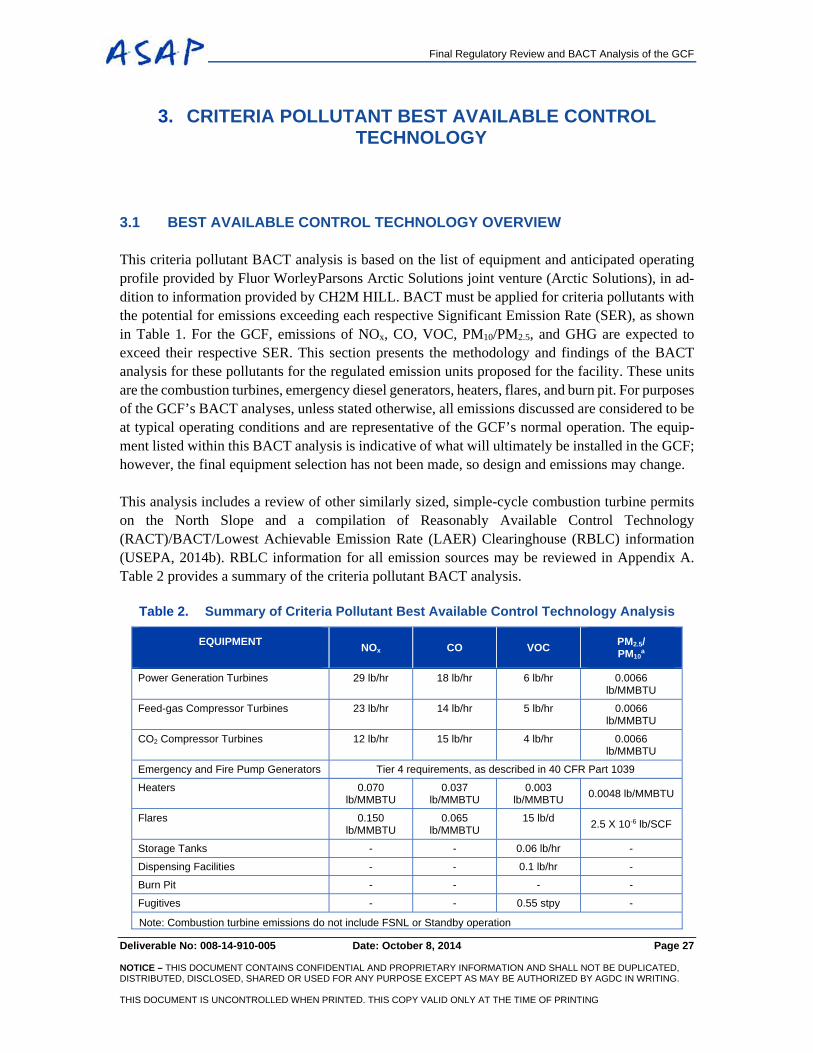
This criteria pollutant BACT analysis is based on the list of equipment and anticipated operating profile provided by Fluor WorleyParsons Arctic Solutions joint venture (Arctic Solutions), in ad-dition to information provided by CH2M HILL. BACT must be applied for criteria pollutants with the potential for emissions exceeding each respective Significant Emission Rate (SER), as shown in Table 1. For the GCF, emissions of NOx, CO, VOC, PM10/PM2.5, and GHG are expected to exceed their respective SER. This section presents the methodology and findings of the BACT analysis for these pollutants for the regulated emission units proposed for the facility. These units are the combustion turbines, emergency diesel generators, heaters, flares, and burn pit. For purposes of the GCF’s BACT analyses, unless stated otherwise, all emissions discussed are considered to be at typical operating conditions and are representative of the GCF’s normal operation. The equip-ment listed within this BACT analysis is indicative of what will ultimately be installed in the GCF; however, the final equipment selection has not been made, so design and emissions may change.
This analysis includes a review of other similarly sized, simple-cycle combustion turbine permits on the North Slope and a compilation of Reasonably Available Control Technology (RACT)/BACT/Lowest Achievable Emission Rate (LAER) Clearinghouse (RBLC) information (USEPA, 2014b). RBLC information for all emission sources may be reviewed in Appendix A. Table 2 provides a summary of the criteria pollutant BACT analysis.
Table 2. Summary of Criteria Pollutant Best Available Control Technology Analysis
EQUIPMENT NOx CO VOC PM2.5/
PM10a
Power Generation Turbines 29 lb/hr 18 lb/hr 6 lb/hr 0.0066 lb/MMBTU
Feed-gas Compressor Turbines 23 lb/hr 14 lb/hr 5 lb/hr 0.0066 lb/MMBTU
CO2 Compressor Turbines 12 lb/hr 15 lb/hr 4 lb/hr 0.0066 lb/MMBTU
Emergency and Fire Pump Generators Tier 4 requirements, as described in 40 CFR Part 1039
Heaters 0.070 lb/MMBTU
0.037 lb/MMBTU
0.003 lb/MMBTU
0.0048 lb/MMBTU
Flares 0.150 lb/MMBTU
0.065 lb/MMBTU
15 lb/d 2.5 X 10⁻⁶ lb/SCF
Storage Tanks - - 0.06 lb/hr -
Dispensing Facilities - - 0.1 lb/hr -
Burn Pit - - - -
Fugitives - - 0.55 stpy -
Note: Combustion turbine emissions do not include FSNL or Standby operation
Final Regulatory Review and BACT Analysis of the GCF
Deliverable No: 008-14-910-005 Date: October 8, 2014 Page 28 NOTICE – THIS DOCUMENT CONTAINS CONFIDENTIAL AND PROPRIETARY INFORMATION AND SHALL NOT BE DUPLICATED, DISTRIBUTED, DISCLOSED, SHARED OR USED FOR ANY PURPOSE EXCEPT AS MAY BE AUTHORIZED BY AGDC IN WRITING. THIS DOCUMENT IS UNCONTROLLED WHEN PRINTED. THIS COPY VALID ONLY AT THE TIME OF PRINTING
EQUIPMENT NOx CO VOC PM2.5/
PM10a
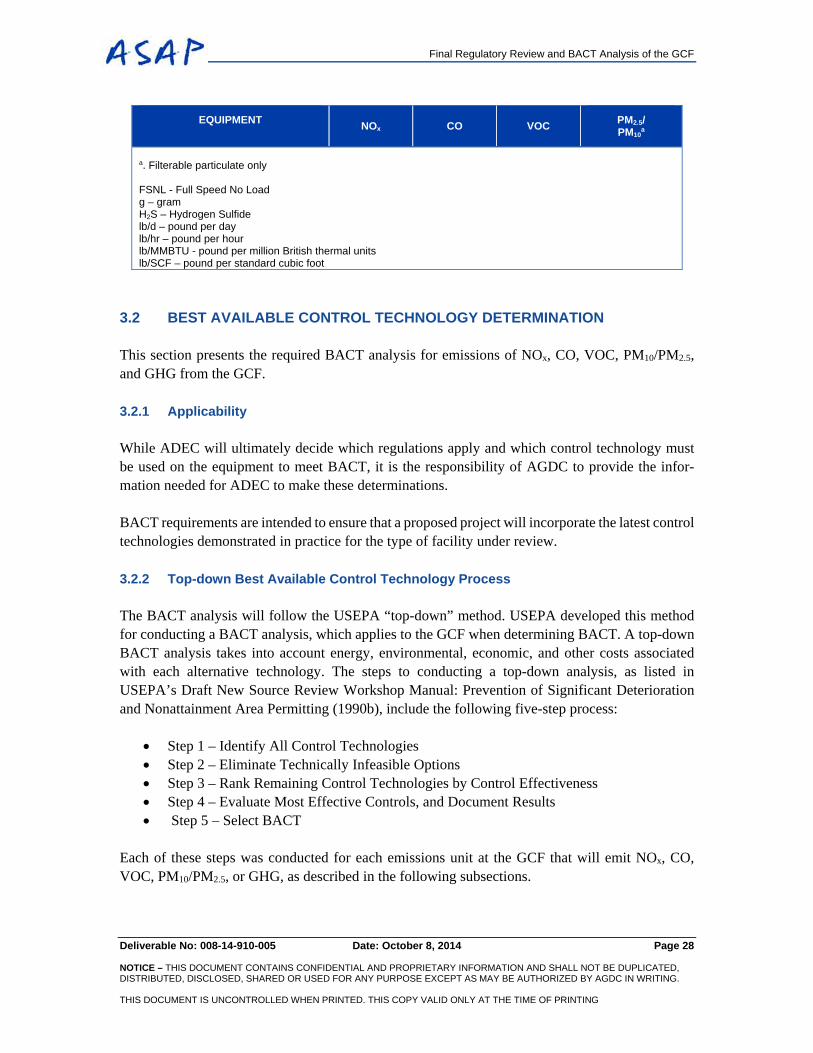
a. Filterable particulate only FSNL - Full Speed No Load g – gram H2S – Hydrogen Sulfide lb/d – pound per day lb/hr – pound per hour lb/MMBTU - pound per million British thermal units lb/SCF – pound per standard cubic foot
3.2 BEST AVAILABLE CONTROL TECHNOLOGY DETERMINATION
This section presents the required BACT analysis for emissions of NOx, CO, VOC, PM10/PM2.5, and GHG from the GCF.
3.2.1 Applicability
While ADEC will ultimately decide which regulations apply and which control technology must be used on the equipment to meet BACT, it is the responsibility of AGDC to provide the infor-mation needed for ADEC to make these determinations.
BACT requirements are intended to ensure that a proposed project will incorporate the latest control technologies demonstrated in practice for the type of facility under review.
3.2.2 Top-down Best Available Control Technology Process
The BACT analysis will follow the USEPA “top-down” method. USEPA developed this method for conducting a BACT analysis, which applies to the GCF when determining BACT. A top-down BACT analysis takes into account energy, environmental, economic, and other costs associated with each alternative technology. The steps to conducting a top-down analysis, as listed in USEPA’s Draft New Source Review Workshop Manual: Prevention of Significant Deterioration and Nonattainment Area Permitting (1990b), include the following five-step process:
Step 1 – Identify All Control Technologies Step 2 – Eliminate Technically Infeasible Options Step 3 – Rank Remaining Control Technologies by Control Effectiveness Step 4 – Evaluate Most Effective Controls, and Document Results Step 5 – Select BACT
Each of these steps was conducted for each emissions unit at the GCF that will emit NOx, CO, VOC, PM10/PM2.5, or GHG, as described in the following subsections.

Final Regulatory Review and BACT Analysis of the GCF
Deliverable No: 008-14-910-005 Date: October 8, 2014 Page 29 NOTICE – THIS DOCUMENT CONTAINS CONFIDENTIAL AND PROPRIETARY INFORMATION AND SHALL NOT BE DUPLICATED, DISTRIBUTED, DISCLOSED, SHARED OR USED FOR ANY PURPOSE EXCEPT AS MAY BE AUTHORIZED BY AGDC IN WRITING. THIS DOCUMENT IS UNCONTROLLED WHEN PRINTED. THIS COPY VALID ONLY AT THE TIME OF PRINTING
3.2.3 Economic Analysis Methodology
The cost estimation methodology used in this BACT analysis is consistent with the latest USEPA guidance, EPA Air Polution Control Cost Manual (2002). Vendor quotes and engineering estimates are the basis for calculating the total capital and operating costs, or cost differentials, for the control options considered, and are documented accordingly. Standard engineering economic analysis is used to convert all costs to equivalent annual costs so that the pollution control cost-effectiveness (in current dollars per short ton of pollutant removed) of a control option may be calculated for comparison with other control options.
The cost estimates include capital costs and annual Operations and Maintenance (O&M) costs. Capital costs and annual costs include both direct and indirect costs. The following variables, equa-tions, and assumptions were used to evaluate the cost-effectiveness of alternative control strategies for the pollutants in question:
CRF = i*(1 +i)n/((1 + i)n-1)
where:
CRF = Capital Recovery Factor i = interest rate (assumed at 7 percent)
n = equipment life (assumed 10 years for the GCF equipment and 3 years for catalysts)
The 10-year equipment life is based upon comparable equipment life spans on the North Slope and recent North Slope BACT determinations. The CRF for the 10-year equipment life is 0.14238, and the CRF for the 3-year catalyst life is 0.38105.
Cost-effectiveness is calculated by dividing the total annualized costs of the technology by the potential reduction in emissions from the application of the technology.
3.2.4 Energy Impact Analysis
Two forms of energy impacts that may be associated with a control option for an electric power-generating unit include:
1) An increase in energy consumption resulting from increased heat rate (reduced efficiency) may be shown as a reduction of electrical generation resulting from the application of the control technology due to increased parasitic load or backpressure.
2) A reduction in the unit’s availability for power generation, which may be due to additional maintenance requirements for the applied control technology.

Final Regulatory Review and BACT Analysis of the GCF
Deliverable No: 008-14-910-005 Date: October 8, 2014 Page 30 NOTICE – THIS DOCUMENT CONTAINS CONFIDENTIAL AND PROPRIETARY INFORMATION AND SHALL NOT BE DUPLICATED, DISTRIBUTED, DISCLOSED, SHARED OR USED FOR ANY PURPOSE EXCEPT AS MAY BE AUTHORIZED BY AGDC IN WRITING. THIS DOCUMENT IS UNCONTROLLED WHEN PRINTED. THIS COPY VALID ONLY AT THE TIME OF PRINTING
3.2.5 Environmental Impact Analysis
The focus of the environmental impact analysis is on impacts other than impacts on air quality standards due to emissions of the regulated pollutant in question. Increases and decreases in other criteria or non-criteria pollutants may occur with some technologies and should also be identified. Environmental impacts, such as waste generation and disposal, and increased water consumption, may also present an issue and, if so, should be considered, as well.
3.3 COMBUSTION TURBINES
All combustion turbines were assumed to burn fuel gas, with an H2S content of less than 4 parts per million by volume (ppmv) because this represents normal operations of the facility. Feed gas will be burned only during the initial startup period for the GCF and in emergency situations.
Final turbine selection has not been made for the facility. Therefore, CH2M HILL and Arctic So-lutions have reviewed the emission profiles of representative turbines of the classification and size that meet the preliminary facility design criteria. Any turbine model information in this analysis is for general information only so that analysis of indicative emissions could be completed for this application. When actual turbines are selected, the models and manufacturer guarantees of emis-sions within the permitted emission limits and rates will be provided to ADEC.
In order to obtain combustion turbine performance and emissions information, CH2M HILL com-pleted performance cases for the power generation turbines using a General Electric (GE) online estimating program (GE, 2014), and also contacted GE for additional information, including startup and shutdown data. The feed-gas and CO2 compressor turbine manufacturers (GE and Solar Tur-bines Incorporated [Solar], respectively) were contacted to provide operating and emissions infor-mation, including startup and shutdown information. Although final equipment selection has not been determined, the aforementioned equipment, including performance and emissions infor-mation, were used for this draft BACT analysis.
3.3.1 Nitrogen Oxides
Control Technology Identification and Technical Feasibility (Steps 1 and 2)
The tables in Appendix A provide a summary of NOx, CO, VOC, and PM10/PM2.5 emissions for combustion turbines that were identified using USEPA’s RBLC (2014b)as having similar power output to the combustion turbines and having been recently permitted. Permit information for each combustion turbine considered was reviewed to determine permitted emission levels and control technologies for the unit.
Identified NOx control technologies for natural gas-fired turbines include:
Dry Low NOx Combustors (DLNs) Selective Catalytic Reduction (SCR)

Final Regulatory Review and BACT Analysis of the GCF
Deliverable No: 008-14-910-005 Date: October 8, 2014 Page 31 NOTICE – THIS DOCUMENT CONTAINS CONFIDENTIAL AND PROPRIETARY INFORMATION AND SHALL NOT BE DUPLICATED, DISTRIBUTED, DISCLOSED, SHARED OR USED FOR ANY PURPOSE EXCEPT AS MAY BE AUTHORIZED BY AGDC IN WRITING. THIS DOCUMENT IS UNCONTROLLED WHEN PRINTED. THIS COPY VALID ONLY AT THE TIME OF PRINTING
Water injection
The performance and technical feasibility of these NOx control technologies are discussed in more detail in the following paragraphs.
For DLN, combustion modifications that reduce NOx emissions without wet injection include lean combustion, reduced combustor residence time, lean premixed combustion, and two-stage rich/lean combustion. Lean combustion uses excess air in the combustor primary combustion zone to cool the flame, thereby reducing the rate of thermal NOx formation. Reduced combustor residence times are achieved by introducing dilution air between the combustor and the turbine sooner than with standard combustors. The combustion gases are at high temperatures for a shorter time, which also has the effect of reducing the rate of thermal NOx formation.
The most advanced dry-combustion control for NOx formation is referred to as Dry Low Emissions (DLE) combustors. DLE technology uses lean, premixed combustion to keep peak combustion temperatures low, thus reducing the formation of thermal NOx.
The combustion turbines will have DLE technology incorporated into their design for firing natural gas; therefore, DLE technology is available and technically feasible for use.
SCR is a post-combustion technique that controls both thermal and fuel NOx emissions by reducing NOx with a reagent (generally, Ammonia [NH3] or urea) in the presence of a catalyst to form H2O and Nitrogen (N). NOx conversion is sensitive to exhaust gas temperature, and performance can be limited by contaminants in the exhaust gas that may mask the catalyst (sulfur compounds, PM, heavy metals, and silica). SCR is used in numerous gas turbine installations throughout the contig-uous United States (U.S.), almost exclusively in conjunction with other wet or dry NOx combustion controls. SCR requires the consumption of a reagent (NH3 or urea) and requires periodic catalyst replacement. As NOx emission rates have dropped, the level of sophistication has increased in terms of the NH3 injection system and process controls.
The temperature range required for SCR is typically between approximately 600 and 800°F. If the SCR catalyst bed is not located in the proper temperature zone, either the reaction efficiency will be reduced if the temperature is too low, resulting in increased NH3 slip, or the catalyst may be damaged if the temperature is too high.
During startup, the SCR is not fully operational until the inlet flue gas temperature to the NH3 injection grid exceeds approximately 600°F. The control effectiveness of the SCR is limited during the startup sequence due to decreased catalyst activity at lower temperatures and regulatory limita-tions on the amount of NH3 that can be emitted.
SCR is capable of over 90 percent NOx removal, though reductions this high have not been demon-strated on the North Slope. Emissions of 5 ppmv have been demonstrated on the North Slope. However, the use of SCR can result in secondary PM10 formation (ammonium nitrate or ammonium
Final Regulatory Review and BACT Analysis of the GCF
Deliverable No: 008-14-910-005 Date: October 8, 2014 Page 32 NOTICE – THIS DOCUMENT CONTAINS CONFIDENTIAL AND PROPRIETARY INFORMATION AND SHALL NOT BE DUPLICATED, DISTRIBUTED, DISCLOSED, SHARED OR USED FOR ANY PURPOSE EXCEPT AS MAY BE AUTHORIZED BY AGDC IN WRITING. THIS DOCUMENT IS UNCONTROLLED WHEN PRINTED. THIS COPY VALID ONLY AT THE TIME OF PRINTING
sulfate). This technology is considered technically feasible for the GCF’s simple-cycle combustion turbines.
The following operational, environmental, and safety concerns associated with an SCR system in-stallation on the North Slope must also be considered:
Potential for significant flue-gas temperature swings due to dramatic changes in ambient temperature resulting in heat loss from exhaust ductwork.
Transportation and handling of NH3, which is a hazardous chemical, creates a potential safety concern.
NH3 slip from the SCR system and stack may result in atmospheric particulate formation. Additional pressure drop across the SCR will result in increased GCF operating costs.
Water injection is an available and proven technology; however, the combustion turbines have DLN incorporated into the design, so water injection is eliminated from further consideration.
Based on these discussions, the following NOx control technologies are available and potentially applicable (that is, technologically feasible) for the combustion turbines at the GCF:
DLN combustor design (incorporated into the GCF designs for the three different turbines) SCR
Rank Remaining Control Technologies by Effectiveness (Step 3)
The combustion turbines currently have DLN technology incorporated in their design. Therefore, SCR is the only technology for simple-cycle combustion turbines that has been demonstrated to be technically feasible to provide additional NOx control. In addition, SCR provides the potential for the greatest NOx reduction. SCR is; thus, is the top level of control for the GCF’s turbines.
Evaluation of Available and Technically Feasible Control Options (Step 4)
This section evaluates the use of SCR as a NOx emission control option by turbine type. As indi-cated, an SCR system currently offers the potential for the highest level of NOx emissions reduction for the GCF’s simple-cycle turbine. From review of the RBLC information (USEPA, 2014b), SCR and DLN are the installed technology to achieve current BACT emissions levels for similar units.
Economic Impacts
Power Generation Turbines
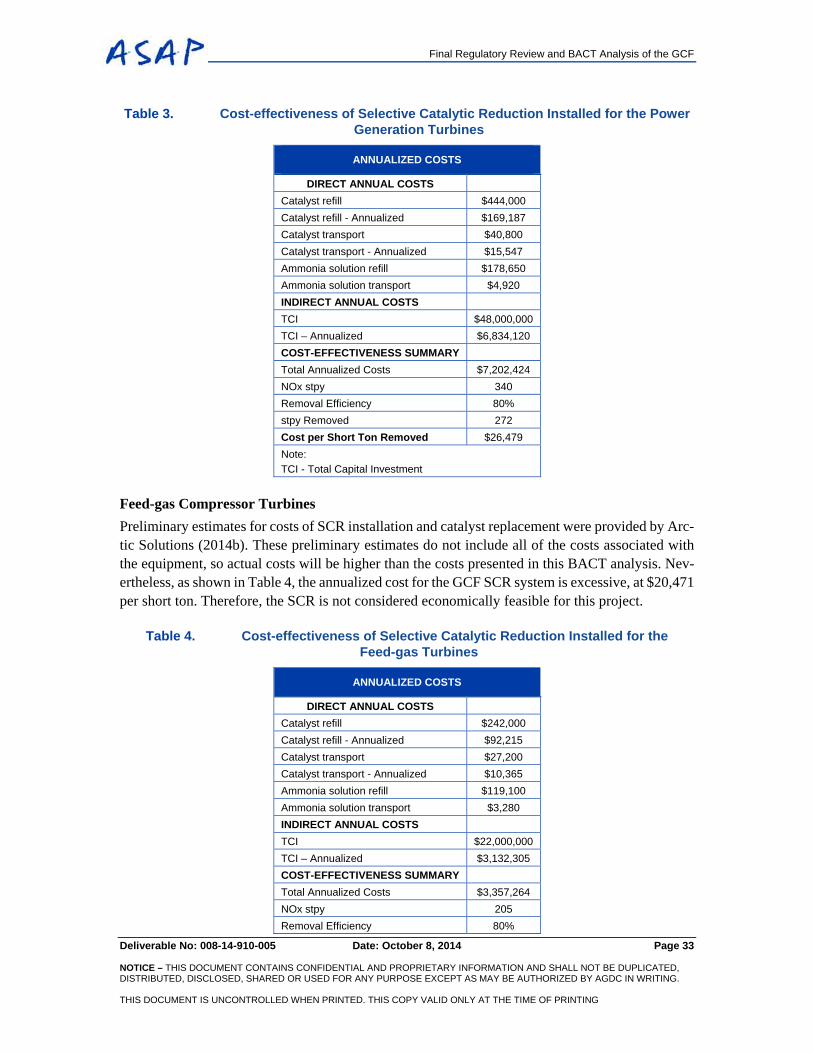
Preliminary estimates for costs of SCR installation and maintenance were provided by Arctic So-lutions (2014b). These preliminary estimates do not include all of the costs associated with the equipment, so actual costs will be higher than the costs presented in this BACT analysis. Never-theless, as shown in Table 3, the annualized cost for the GCF SCR system is excessive, at $26,479 per short ton. Therefore, the SCR is not considered feasible for this project.
Final Regulatory Review and BACT Analysis of the GCF
Deliverable No: 008-14-910-005 Date: October 8, 2014 Page 33 NOTICE – THIS DOCUMENT CONTAINS CONFIDENTIAL AND PROPRIETARY INFORMATION AND SHALL NOT BE DUPLICATED, DISTRIBUTED, DISCLOSED, SHARED OR USED FOR ANY PURPOSE EXCEPT AS MAY BE AUTHORIZED BY AGDC IN WRITING. THIS DOCUMENT IS UNCONTROLLED WHEN PRINTED. THIS COPY VALID ONLY AT THE TIME OF PRINTING
Table 3. Cost-effectiveness of Selective Catalytic Reduction Installed for the Power Generation Turbines
ANNUALIZED COSTS
DIRECT ANNUAL COSTS
Catalyst refill $444,000
Catalyst refill - Annualized $169,187
Catalyst transport $40,800
Catalyst transport - Annualized $15,547
Ammonia solution refill $178,650
Ammonia solution transport $4,920
INDIRECT ANNUAL COSTS
TCI $48,000,000
TCI – Annualized $6,834,120
COST-EFFECTIVENESS SUMMARY
Total Annualized Costs $7,202,424
NOx stpy 340
Removal Efficiency 80%
stpy Removed 272
Cost per Short Ton Removed $26,479
Note:
TCI - Total Capital Investment
Feed-gas Compressor Turbines
Preliminary estimates for costs of SCR installation and catalyst replacement were provided by Arc-tic Solutions (2014b). These preliminary estimates do not include all of the costs associated with the equipment, so actual costs will be higher than the costs presented in this BACT analysis. Nev-ertheless, as shown in Table 4, the annualized cost for the GCF SCR system is excessive, at $20,471 per short ton. Therefore, the SCR is not considered economically feasible for this project.
Table 4. Cost-effectiveness of Selective Catalytic Reduction Installed for the Feed-gas Turbines
ANNUALIZED COSTS
DIRECT ANNUAL COSTS
Catalyst refill $242,000
Catalyst refill - Annualized $92,215
Catalyst transport $27,200
Catalyst transport - Annualized $10,365
Ammonia solution refill $119,100
Ammonia solution transport $3,280
INDIRECT ANNUAL COSTS
TCI $22,000,000
TCI – Annualized $3,132,305
COST-EFFECTIVENESS SUMMARY
Total Annualized Costs $3,357,264
NOx stpy 205
Removal Efficiency 80%
Final Regulatory Review and BACT Analysis of the GCF
Deliverable No: 008-14-910-005 Date: October 8, 2014 Page 34 NOTICE – THIS DOCUMENT CONTAINS CONFIDENTIAL AND PROPRIETARY INFORMATION AND SHALL NOT BE DUPLICATED, DISTRIBUTED, DISCLOSED, SHARED OR USED FOR ANY PURPOSE EXCEPT AS MAY BE AUTHORIZED BY AGDC IN WRITING. THIS DOCUMENT IS UNCONTROLLED WHEN PRINTED. THIS COPY VALID ONLY AT THE TIME OF PRINTING
ANNUALIZED COSTS
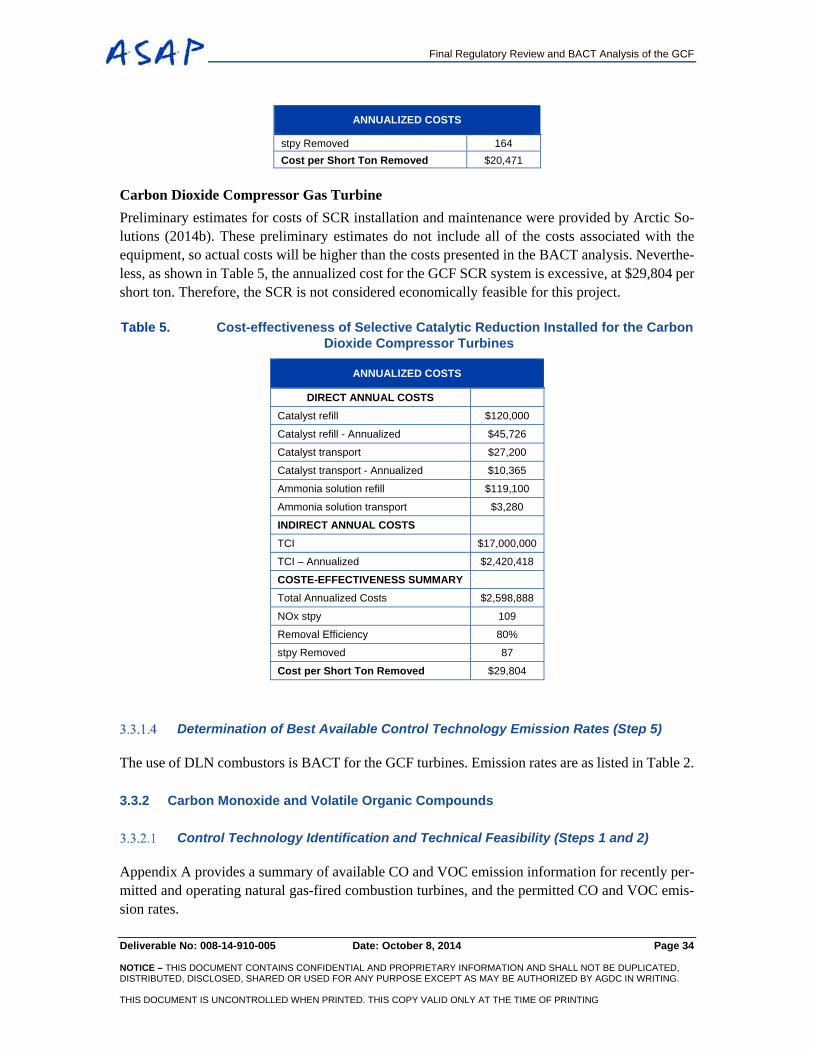
stpy Removed 164
Cost per Short Ton Removed $20,471
Carbon Dioxide Compressor Gas Turbine
Preliminary estimates for costs of SCR installation and maintenance were provided by Arctic So-lutions (2014b). These preliminary estimates do not include all of the costs associated with the equipment, so actual costs will be higher than the costs presented in the BACT analysis. Neverthe-less, as shown in Table 5, the annualized cost for the GCF SCR system is excessive, at $29,804 per short ton. Therefore, the SCR is not considered economically feasible for this project.
Table 5. Cost-effectiveness of Selective Catalytic Reduction Installed for the Carbon Dioxide Compressor Turbines
ANNUALIZED COSTS
DIRECT ANNUAL COSTS
Catalyst refill $120,000
Catalyst refill - Annualized $45,726
Catalyst transport $27,200
Catalyst transport - Annualized $10,365
Ammonia solution refill $119,100
Ammonia solution transport $3,280
INDIRECT ANNUAL COSTS
TCI $17,000,000
TCI – Annualized $2,420,418
COSTE-EFFECTIVENESS SUMMARY
Total Annualized Costs $2,598,888
NOx stpy 109
Removal Efficiency 80%
stpy Removed 87
Cost per Short Ton Removed $29,804
Determination of Best Available Control Technology Emission Rates (Step 5)
The use of DLN combustors is BACT for the GCF turbines. Emission rates are as listed in Table 2.
3.3.2 Carbon Monoxide and Volatile Organic Compounds
Control Technology Identification and Technical Feasibility (Steps 1 and 2)
Appendix A provides a summary of available CO and VOC emission information for recently per-mitted and operating natural gas-fired combustion turbines, and the permitted CO and VOC emis-sion rates.

Final Regulatory Review and BACT Analysis of the GCF
Deliverable No: 008-14-910-005 Date: October 8, 2014 Page 35 NOTICE – THIS DOCUMENT CONTAINS CONFIDENTIAL AND PROPRIETARY INFORMATION AND SHALL NOT BE DUPLICATED, DISTRIBUTED, DISCLOSED, SHARED OR USED FOR ANY PURPOSE EXCEPT AS MAY BE AUTHORIZED BY AGDC IN WRITING. THIS DOCUMENT IS UNCONTROLLED WHEN PRINTED. THIS COPY VALID ONLY AT THE TIME OF PRINTING
The following technologies were identified as options to control CO and VOC from the simple-cycle combustion turbines and are considered in the technical feasibility analysis herein:
Catalytic Oxidation (CatOx) DLE Burners
CatOx systems have a proven track record at locations where BACT was required. Oxidation cat-alysts are considered to be technologically feasible.
DLE Burners. The GCF’s power generation turbines are designed to have DLE burners installed. Therefore, given the turbines’ design, DLE burners are available and technically feasible for con-trolling CO and VOC emissions.
Rank of Control Technologies by Effectiveness (Step 3)
With the exception of DLE, which the combustion turbines already have, CatOx is the only tech-nology for simple cycle that has been demonstrated in the RBLC (USEPA, 2014b) to be technically feasible. Therefore, DLE is accepted for use, and only CatOx will be evaluated further.
Evaluation of Available and Technically Feasible Control Options (Step 4)
3.3.2.3.1 Economic Analysis
Power Generation Turbines
Preliminary estimates for costs of CatOx installation and catalyst replacement were provided by Arctic Solutions (2014b). These preliminary estimates do not include all of the costs associated with the equipment. For example, use of the CatOx system creates additional pressure drop in the turbine exhaust system to the stack. As described, this can result in (1) an increase in energy con-sumption that will cause a reduction of electrical generation resulting due to increased parasitic load or backpressure, and (2) reduced unit availability due to additional maintenance requirements for the applied control technology. These energy impacts, however, do not justify the elimination of the CatOx system as BACT.
Nevertheless, as shown in Table 6, the annualized cost for the GCF CatOx system is excessive, at $11,239 per short ton. Therefore, CatOx is not considered economically feasible for this project.

Final Regulatory Review and BACT Analysis of the GCF
Deliverable No: 008-14-910-005 Date: October 8, 2014 Page 36 NOTICE – THIS DOCUMENT CONTAINS CONFIDENTIAL AND PROPRIETARY INFORMATION AND SHALL NOT BE DUPLICATED, DISTRIBUTED, DISCLOSED, SHARED OR USED FOR ANY PURPOSE EXCEPT AS MAY BE AUTHORIZED BY AGDC IN WRITING. THIS DOCUMENT IS UNCONTROLLED WHEN PRINTED. THIS COPY VALID ONLY AT THE TIME OF PRINTING
Table 6. Cost-effectiveness of Catalytic Oxidation Installed for the Power Generation Turbines
ANNUALIZED COSTS
DIRECT ANNUAL COSTS
Catalyst refill 222,000
Catalyst refill - Annualized $84,593
Catalyst transport $40,800
Catalyst transport - Annualized $15,547
INDIRECT ANNUAL COSTS
TCI $13,000,000
TCI – Annualized $1,850,908
COST-EFFECTIVENESS SUMMARY
Total Annualized Costs $1,951,048
CO stpy 217
Removal Efficiency 80%
stpy Removed 174
Cost per Short Ton Removed $11,239
Feed-gas Compressor Turbines
Preliminary estimates for costs of CatOx installation and maintenance were provided by Arctic Solutions (2014b). These preliminary estimates do not include all of the costs associated with the equipment, so actual costs will be higher than those presented. For example, use of the CatOx system creates additional pressure drop in the turbine exhaust system to the stack. As described, this can result in (1) an increase in energy consumption that will cause a reduction of electrical gener-ation resulting due to increased parasitic load or backpressure, and (2) reduced unit availability due to additional maintenance requirements for the applied control technology. These energy impacts, however, do not justify the elimination of the CatOx system as BACT.
Nevertheless, as shown in Table 7, the annualized cost for the GCF CatOx system is excessive, at $9,111 per short ton. Therefore, the CatOx is not considered economically feasible for this project.
Table 7. Cost-effectiveness of Catalytic Oxidation Installed for the Feed-gas Compressor Turbines
ANNUALIZED COSTS
DIRECT ANNUAL COSTS
Catalyst refill $122,000
Catalyst refill - Annualized $46,488
Catalyst transport $27,200
Catalyst transport - Annualized $10,365
INDIRECT ANNUAL COSTS
TCI $6,000,000
TCI – Annualized $854,265
COST-EFFECTIVENESS SUMMARY
Total Annualized Costs $911,118
CO stpy 125

Final Regulatory Review and BACT Analysis of the GCF
Deliverable No: 008-14-910-005 Date: October 8, 2014 Page 37 NOTICE – THIS DOCUMENT CONTAINS CONFIDENTIAL AND PROPRIETARY INFORMATION AND SHALL NOT BE DUPLICATED, DISTRIBUTED, DISCLOSED, SHARED OR USED FOR ANY PURPOSE EXCEPT AS MAY BE AUTHORIZED BY AGDC IN WRITING. THIS DOCUMENT IS UNCONTROLLED WHEN PRINTED. THIS COPY VALID ONLY AT THE TIME OF PRINTING
ANNUALIZED COSTS
Removal Efficiency 80%
stpy Removed 100
Cost per Short Ton Removed $9,111
Carbon Dioxide Compressor Turbines
Preliminary estimates for costs of CatOx installation and maintenance were provided by Arctic Solutions (2014b). These preliminary estimates do not include all of the costs associated with the equipment, so actual costs will be higher. For example, use of the CatOx system creates additional pressure drop in the turbine exhaust system to the stack. As described, this can result in (1) an in-crease in energy consumption that will cause a reduction of electrical generation resulting due to in-creased parasitic load or backpressure, and (2) reduced unit availability due to additional maintenance requirements for the applied control technology. These energy impacts, however, do not justify the elimination of the CatOx system as BACT.
Nevertheless, as shown in Table 8, the annualized cost for the GCF CatOx system is excessive, at $8,341 per short ton. Therefore, the CatOx is not considered feasible for this project.
Table 8. Cost-effectiveness of Catalytic Oxidation Installed for the Carbon Dioxide Compressor Turbines
ANNUALIZED COSTS
DIRECT ANNUAL COSTS
Catalyst refill $60,000
Catalyst refill - Annualized $22,863
Catalyst transport $27,200
Catalyst transport - Annualized $10,365
INDIRECT ANNUAL COSTS
TCI $6,000,000
TCI – Annualized $854,265
COST-EFFECTIVENESS SUMMARY
Total Annualized Costs $887,493
CO stpy 133
Removal Efficiency 80%
stpy Removed 106
Cost per Short Ton Removed $8,341
3.3.2.3.2 Energy Impact Analysis
Use of the CatOx system creates additional pressure drop in the turbine exhaust system to the stack, and as previously described, will cause a reduction of electrical generation resulting due to increased parasitic load or backpressure. However, energy impacts do not justify the elimination of the CatOx system as BACT.
Final Regulatory Review and BACT Analysis of the GCF
Deliverable No: 008-14-910-005 Date: October 8, 2014 Page 38 NOTICE – THIS DOCUMENT CONTAINS CONFIDENTIAL AND PROPRIETARY INFORMATION AND SHALL NOT BE DUPLICATED, DISTRIBUTED, DISCLOSED, SHARED OR USED FOR ANY PURPOSE EXCEPT AS MAY BE AUTHORIZED BY AGDC IN WRITING. THIS DOCUMENT IS UNCONTROLLED WHEN PRINTED. THIS COPY VALID ONLY AT THE TIME OF PRINTING
Environmental Impact Analysis
The primary environmental impact associated with the use of the CatOx system is an increase in PM10/PM2.5 emissions due to the additional oxidation of sulfur present in the combustion turbine exhaust gas. The combustion turbine oxidizes any sulfur compounds in the natural gas (naturally occurring) to SO2. The SO2 is further oxidized to Sulfur Trioxide (SO3) across the oxidation catalyst and is emitted as a sulfate, which can form sulfate PM. These potential environmental impacts do not justify the elimination of CatOx in this analysis.
Determination of Best Available Control Technology Emission Rates (Step 5)
BACT for the combustion turbine CO and VOC emissions will be accomplished through using a DLE burner, good combustion practice, and burning treated natural gas when available. Emission rates are as listed in Table 2.
3.3.3 Particulate Matter of both 2.5 and 10 Microns in Diameter or Smaller
Emissions of PM from natural gas combustion can result from noncombustible trace particles pre-sent in the natural gas. Particulate emissions can also result from dust particles present in inlet combustion air. Both the fuel and the combustion air are filtered to remove PM to protect the turbine components from erosion. Therefore, the amounts of PM passed through the filters to the turbine are small and are dependent on the efficiency of the filtration devices that clean the fuel and inlet air. Particulate emissions of hydrocarbons resulting from incomplete combustion can result from combustion of liquid or solid fuels, but are not a significant result of natural gas combustion.
Control Technology Identification and Technical Feasibility (Steps 1 and 2)
USEPA has not proposed or promulgated performance standards for particulate control from sta-tionary combustion gas turbines. In addition, no add-on control technologies are listed in the RBCL as BACT for particulate control from simple-cycle combustion turbines. This review of available resources indicates that add-on particulate control equipment is neither available nor technically feasible for the combustion turbines.
Determination of Best Available Control Technology (Step 5)
Since there are no demonstrated control technologies for PM10/PM2.5 emissions from a combustion turbine on the North Slope, BACT is burning pipeline natural gas, when available, and implement-ing good combustion practices.
Therefore, the PM10/PM2.5 BACT emissions rate is 0.0066 lb/MMBTU, consistent with the Point Thomson permit (ExxonMobil, 2011).

Final Regulatory Review and BACT Analysis of the GCF
Deliverable No: 008-14-910-005 Date: October 8, 2014 Page 39 NOTICE – THIS DOCUMENT CONTAINS CONFIDENTIAL AND PROPRIETARY INFORMATION AND SHALL NOT BE DUPLICATED, DISTRIBUTED, DISCLOSED, SHARED OR USED FOR ANY PURPOSE EXCEPT AS MAY BE AUTHORIZED BY AGDC IN WRITING. THIS DOCUMENT IS UNCONTROLLED WHEN PRINTED. THIS COPY VALID ONLY AT THE TIME OF PRINTING
3.4 EMERGENCY DIESEL GENERATORS
3.4.1 Nitrogen Oxides
An Internal Combustion (IC) diesel engine forms NOx by two mechanisms, as follows:
1) Oxidation of atmospheric N found in the combustion air (thermal NOx) 2) Conversion of N chemically bound in the fuel (fuel NOx or organic NOx)
Thermal NOx is formed during combustion when Gaseous Nitrogen (N2) and O2 molecules disas-sociate into uncombined atoms at the elevated temperatures and pressures, and then recombine to form Nitric Oxide (NO). As the temperature during combustion rises, the NO formation increases exponentially. The NO further oxidizes to Nitrogen Dioxide (NO2) and other NOx compounds downstream of the combustion chamber.
Fuel NOx is formed when fuels containing N are burned. Light distillate oil (diesel #2) contains little or no fuel-bound N. As a result, fuel-bound NOx will not be a major contributor to the overall N emissions from these IC engines.
Control Technology Identification and Technical Feasibility (Steps 1 and 2)
A database search of USEPA’s RBLC (USEPA, 2014b) for large IC diesel engines is summarized in Appendix A for recent permits. Engine design, use of ULSD, and good combustion practices are the control technologies primarily listed in the RBLC. These controls and others are explained in this section.
Injection Timing Retardation – The operating pressures and temperatures in the combustion chamber can be affected by adjusting the ignition timing. If the timing is advanced so that ignition occurs early during the cycle when the piston is near the top of the cylinder and the combustion chamber volume is at a minimum, then peak combustion is achieved. This adjustment results in maximum pressure and temperature but has the potential to increase NOx emissions. Conversely, if the timing is retarded and ignition occurs later in the cycle when the piston is in its downward motion and the combustion chamber volume is increasing, then the operating temperature, pressure, and residence time are reduced.
Ignition timing retardation may result in an NOx reduction of 25 percent on average, but the exact reduction is engine-specific. The technical limitation of retarding ignition timing is the optimal degree of retardation specific to the engine for the maximum reduction of NOx while avoiding performance impacts, such as misfiring, increased exhaust temperatures, decreased power output, and elevated exhaust opacity during startup. After review of the RBLC database (USEPA, 2014b) and industry standards, it was determined that injection timing retardation has been used and demonstrated effectively on similar-sized engines. For this analysis, injection timing retardation is considered to be technically feasible.
Final Regulatory Review and BACT Analysis of the GCF
Deliverable No: 008-14-910-005 Date: October 8, 2014 Page 40 NOTICE – THIS DOCUMENT CONTAINS CONFIDENTIAL AND PROPRIETARY INFORMATION AND SHALL NOT BE DUPLICATED, DISTRIBUTED, DISCLOSED, SHARED OR USED FOR ANY PURPOSE EXCEPT AS MAY BE AUTHORIZED BY AGDC IN WRITING. THIS DOCUMENT IS UNCONTROLLED WHEN PRINTED. THIS COPY VALID ONLY AT THE TIME OF PRINTING
Lean-burn Combustion – A lean-burn engine has an air-to-fuel ratio that is fuel lean of stoichio-metric, thus producing exhaust gas that is rich in O2. Rich-burn engines have an air-to-fuel operat-ing range at or near stoichiometric and produce exhaust gas with little or no O2 (that is, a higher percentage of O2 in the combustion reaction is converted to NO2 or NO).
Lean-burn combustion engines may emit as much as 20 percent lower NOx than rich-burn or other uncontrolled engines. The only technical limitations or considerations associated with lean-burn combustion are related to the optimal degree of lean combustion specific to the engines in order to achieve the greatest NOx reduction. After review of the RBLC database (USEPA, 2014b) and in-dustry standards, it was determined that lean-burn combustion has been used and demonstrated effectively on the same size engines. For this analysis, lean-burn combustion is considered to be technically feasible.
SCR – Selective catalytic NOx is an add-on NOx control that is placed in the exhaust stream. The SCR reduces NOx emissions by injecting NH3 into the exhaust stream. The NH3 in the presence of the catalyst reacts with NOx to form H2O and N. In the catalyst unit, the NH3 reacts with NOx primarily by the following equations:
4 NH3 + 6 NO = 5 N2 + 6 H2O; and 8 NH3 + 6 NO2 = 7 N2 + 12 H2O
SCR has been shown to achieve NOx reductions from 80 to 95 percent. A search of the USEPA RBLC database (USEPA, 2014b) shows that SCR has been installed on a very limited number of IC engines. It was determined that SCR has been used and demonstrated effectively, so this tech-nology is considered to be technically feasible for the BACT analysis.
Engine exhaust temperature may be a problem for an SCR because approximately 700 to 800°F is required for best SCR performance. While the diesel engine exhaust may reach over 1,000°F at full power, during short test runs, the engine exhaust temperature may only reach 400 to 500°F. For an emergency generator application, an SCR is technically feasible for longer operating times and will be further evaluated in the BACT process.
Turbocharging and Aftercooling – Turbochargers and aftercoolers reduce NOx emissions by in-creasing airflow to the combustion chamber. Turbochargers use the pressure of the exhaust gas to drive a turbine/compressor in the combustion air intake system. This forces additional air into the combustion chamber for more power production. Aftercoolers employ heat exchangers in the com-bustion air system to reduce air temperature, thereby making the air denser and providing more O2 for combustion. When used together, turbochargers and aftercoolers have been shown to achieve NOx reductions of up to 20 percent.
Because turbocharging and aftercooling will be implemented on the emergency generators, no fur-ther evaluation of this technology was conducted.
Final Regulatory Review and BACT Analysis of the GCF
Deliverable No: 008-14-910-005 Date: October 8, 2014 Page 41 NOTICE – THIS DOCUMENT CONTAINS CONFIDENTIAL AND PROPRIETARY INFORMATION AND SHALL NOT BE DUPLICATED, DISTRIBUTED, DISCLOSED, SHARED OR USED FOR ANY PURPOSE EXCEPT AS MAY BE AUTHORIZED BY AGDC IN WRITING. THIS DOCUMENT IS UNCONTROLLED WHEN PRINTED. THIS COPY VALID ONLY AT THE TIME OF PRINTING
Rank of Remaining Technically Feasible Control Technologies by Control Effectiveness (Step 3)
Remaining control alternatives not eliminated by technical feasibility are ranked in order of most effective (that is, lowest emission rate) as follows:
1) SCR (80 to 95 percent reduction) 2) Injection Timing Retardation 3) Turbocharging and Aftercooling 4) Lean-burn Combustion
The economic, environmental, and energy impacts associated with each technology are evaluated in the following section.
Evaluation of Available and Technically Feasible Control Options (Step 4)
The analysis begins with the top-ranked technology and continues until the technology under con-sideration cannot be eliminated by any environmental, economic, and energy impacts that justify the alternative as inappropriate as BACT because these technologies are being implemented, and no further analysis for these control options is required. The remaining technologies that need to be analyzed are SCR, injection timing retardation, and lean-burn combustion.
3.4.1.3.1 Economic Analysis
SCR capital installation and annual operating costs were estimated based on standard algorithms developed in the USEPA document, Alternative Control Techniques (ACT) Document – Internal Combustion NOx Part 1 and 2 (1993). Although this document was published more than 20 years ago, no adjustment for inflation was made for this BACT analysis because the control technology costs are comparative to other control technologies.
The diesel emergency generators must meet 40 CFR 60, Subpart IIII emission limits, and the BACT analysis was completed assuming that these limits apply. The emergency diesel engines will be turbocharged with aftercoolers, and is assumed to operate a maximum of 100 hours per year for maintenance and testing. Timing retardation and lean-burn combustion as recommended by the engine manufacturers will also be used.
An economic analysis was conducted for a 2.5-megawatt (MW) emergency generator and summa-rized in Table 9.
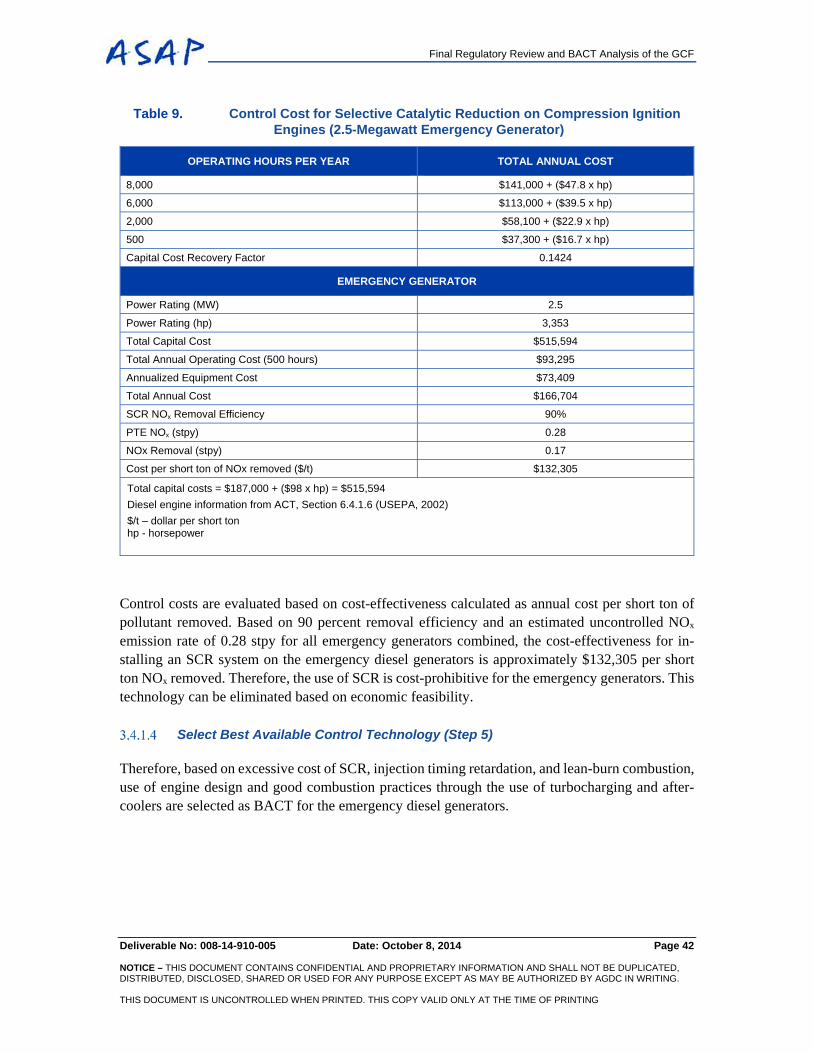
Final Regulatory Review and BACT Analysis of the GCF
Deliverable No: 008-14-910-005 Date: October 8, 2014 Page 42 NOTICE – THIS DOCUMENT CONTAINS CONFIDENTIAL AND PROPRIETARY INFORMATION AND SHALL NOT BE DUPLICATED, DISTRIBUTED, DISCLOSED, SHARED OR USED FOR ANY PURPOSE EXCEPT AS MAY BE AUTHORIZED BY AGDC IN WRITING. THIS DOCUMENT IS UNCONTROLLED WHEN PRINTED. THIS COPY VALID ONLY AT THE TIME OF PRINTING
Table 9. Control Cost for Selective Catalytic Reduction on Compression Ignition Engines (2.5-Megawatt Emergency Generator)
OPERATING HOURS PER YEAR TOTAL ANNUAL COST
8,000 $141,000 + ($47.8 x hp)
6,000 $113,000 + ($39.5 x hp)
2,000 $58,100 + ($22.9 x hp)
500 $37,300 + ($16.7 x hp)
Capital Cost Recovery Factor 0.1424
EMERGENCY GENERATOR
Power Rating (MW) 2.5
Power Rating (hp) 3,353
Total Capital Cost $515,594
Total Annual Operating Cost (500 hours) $93,295
Annualized Equipment Cost $73,409
Total Annual Cost $166,704
SCR NOx Removal Efficiency 90%
PTE NOx (stpy) 0.28
NOx Removal (stpy) 0.17
Cost per short ton of NOx removed ($/t) $132,305
Total capital costs = $187,000 + ($98 x hp) = $515,594
Diesel engine information from ACT, Section 6.4.1.6 (USEPA, 2002)
$/t – dollar per short ton hp - horsepower
Control costs are evaluated based on cost-effectiveness calculated as annual cost per short ton of pollutant removed. Based on 90 percent removal efficiency and an estimated uncontrolled NOx emission rate of 0.28 stpy for all emergency generators combined, the cost-effectiveness for in-stalling an SCR system on the emergency diesel generators is approximately $132,305 per short ton NOx removed. Therefore, the use of SCR is cost-prohibitive for the emergency generators. This technology can be eliminated based on economic feasibility.
Select Best Available Control Technology (Step 5)
Therefore, based on excessive cost of SCR, injection timing retardation, and lean-burn combustion, use of engine design and good combustion practices through the use of turbocharging and after-coolers are selected as BACT for the emergency diesel generators.

Final Regulatory Review and BACT Analysis of the GCF
Deliverable No: 008-14-910-005 Date: October 8, 2014 Page 43 NOTICE – THIS DOCUMENT CONTAINS CONFIDENTIAL AND PROPRIETARY INFORMATION AND SHALL NOT BE DUPLICATED, DISTRIBUTED, DISCLOSED, SHARED OR USED FOR ANY PURPOSE EXCEPT AS MAY BE AUTHORIZED BY AGDC IN WRITING. THIS DOCUMENT IS UNCONTROLLED WHEN PRINTED. THIS COPY VALID ONLY AT THE TIME OF PRINTING
3.4.2 Carbon Monoxide
CO is the result of incomplete oxidation of CO to CO2 caused from the lack of available O2. The lack of O2 is created from a low combustion temperature or not enough residence time in the cyl-inder. A top-down analysis to determine the best available CO control technology is provided in the following subsections.
Control Technology Identification and Technical Feasibility (Steps 1 and 2)
After review of the USEPA RBLC database (USEPA, 2014b), it was determined that the only con-trol methods identified were CatOx and good combustion practices. CatOx uses a catalyst to con-vert CO to CO2. Good combustion practices reduce CO and VOC emissions by mitigating or eliminating the causes of incomplete combustion, and using turbocharging and aftercoolers.
Rank Remaining Technically Feasible Control Technologies by Control
Effectiveness (Step 3)
After review of the USEPA RBLC database (USEPA, 2014b), ASAP has identified combustion design and CatOx as the potentially viable control alternatives. CatOx is the most stringent control technology for CO emissions. Other acceptable control techniques include engine design and good combustion practices.
Evaluation of Available and Technically Feasible Control Options (Step 4)
The next step in the top-down analysis is an evaluation of the technical feasibility of each of these control options. Each of the potential control technologies considered is described in this section, along with a discussion of the technical feasibility of each with respect to ASAP.
Catalytic Oxidation
Oxidation catalysts (typically, a precious metal deposited onto a solid honeycomb substrate) con-vert CO to CO2 in the presence of O2. A review of the USEPA RBLC database (USEPA, 2014b) in Appendix A shows that CatOx has not been applied to similar size emergency generators. Ac-cording to the USEPA document, Draft New Source Review Workshop Manual: Prevention of Significant Deterioration and Nonattainment Area Permitting (1990b), “technically feasible” is limited to a control technology that has been installed and operated successfully on a source that is similar to the one under review. Therefore, ASAP does not consider this technology a technically feasible option for the CO emissions control.
Good Combustion Practices
Good combustion practice is operation of the engines in a manner to reduce incomplete combus-tion. Through the reduction of incomplete combustion, CO emissions can be reduced. ASAP pro-poses to operate the engines using currently accepted engineering practices. Good combustion practices are technically feasible to control CO emissions from the emergency generator.
Final Regulatory Review and BACT Analysis of the GCF
Deliverable No: 008-14-910-005 Date: October 8, 2014 Page 44 NOTICE – THIS DOCUMENT CONTAINS CONFIDENTIAL AND PROPRIETARY INFORMATION AND SHALL NOT BE DUPLICATED, DISTRIBUTED, DISCLOSED, SHARED OR USED FOR ANY PURPOSE EXCEPT AS MAY BE AUTHORIZED BY AGDC IN WRITING. THIS DOCUMENT IS UNCONTROLLED WHEN PRINTED. THIS COPY VALID ONLY AT THE TIME OF PRINTING
Select Carbon Monoxide and Volatile Organic Compounds Best Available Control Technology for the Emergency Generator (Step 5)
ASAP will implement the remaining technically feasible control technology; thus, further review of economic, environmental, and energy impacts is unnecessary. Based on the evaluations herein, ASAP proposes good combustion practices as BACT for CO and VOC emissions. The emergency generators will be turbocharged and aftercooled, with operation limited to 100 hours per year.
3.4.3 Particulate Matter of both 2.5 and 10 Microns in Diameter or Smaller
The RBLC database (USEPA, 2014b) was reviewed for recent diesel-fired engine installations. Appendix A summarizes representative recent installations for which complete information was available for PM10 emission limits.
From a review of the RBLC information (USEPA, 2014b), it was concluded that BACT for PM10/PM2.5 for the emergency generators is good combustion practices and ULSD fuel.
Since Tier 4 emission rates currently represent the strictest requirements, BACT for the emergency fire pumps and generators is burning ULSD and adherence to Tier 4 requirements described in 40 CFR Part 1039 (see Table 4).
3.5 HEATERS
3.5.1 Nitrogen Oxides
Control Technology Identification and Technical Feasibility (Steps 1 and 2)
A summary of the RBLC information identifying control technologies for similarly sized heaters is provided in Appendix A (USEPA, 2014b). A broad range of other information sources were also reviewed in an effort to identify all potentially applicable emission control technologies.
Potential NOx control technology options are:
SCR Selective Non-catalytic Reduction (SNCR) Low NOx Burners (LNBs) LNB technology with Flue-gas Recirculation (FGR) Good combustion practices
SCR is a control technique that uses NH3 to react with the NOx in the flue gas at the appropriate temperature in the presence of a catalyst to form H2O and N. SCR has two well-documented envi-ronmental impacts associated with it: NH3 emissions (NH3 slip) and disposal of spent catalyst. Some NH3 emissions from an SCR system are unavoidable because of imperfect distribution of the react-ing gases and NH3 injection control limitations, as well as a partially degraded catalyst that results

Final Regulatory Review and BACT Analysis of the GCF
Deliverable No: 008-14-910-005 Date: October 8, 2014 Page 45 NOTICE – THIS DOCUMENT CONTAINS CONFIDENTIAL AND PROPRIETARY INFORMATION AND SHALL NOT BE DUPLICATED, DISTRIBUTED, DISCLOSED, SHARED OR USED FOR ANY PURPOSE EXCEPT AS MAY BE AUTHORIZED BY AGDC IN WRITING. THIS DOCUMENT IS UNCONTROLLED WHEN PRINTED. THIS COPY VALID ONLY AT THE TIME OF PRINTING
in an incomplete reaction of the available NH3 with NOx. The NOx removal efficiency of an SCR system depends on the ratio of NH3 to NOx. Therefore, increasing the amount of NH3 injected in-creases the control efficiency but also increases the amount of unreacted NH3 that is emitted to the atmosphere. In the case of the heaters, the reduced NOx emissions as an environmental benefit could be traded for increased NH3 emissions as an environmental cost.
The other environmental impact associated with SCR is disposal of the spent catalyst. Some of the catalyst used in SCR systems must be replaced periodically. These catalysts contain heavy metals, including vanadium pentoxide. Vanadium pentoxide is listed as an acute hazardous waste under the Resource Conservation and Recovery Act (RCRA) and must, therefore, be properly handled and disposed in accordance with applicable requirements.
SNCR is similar to SCR in that a reagent reacts with NOx to form N and H2O. The difference is that SNCR uses no catalyst. The SNCR reagent could be urea, aqueous NH3, or anhydrous NH3, and is typically vaporized and mixed with the hot flue gases from the combustion device.
After review of the RBLC database (USEPA, 2014b), it was determined that SNCR has not been installed or operated on any process heaters. According to the Draft New Source Review Workshop Manual: Prevention of Significant Deterioration and Nonattainment Area Permitting (USEPA, 1990b), “technically feasible” is limited to control technology that has been installed and operated successfully on a source that is similar to the one under review. Because SNCR has not been used on natural gas process heaters, this technology is not considered technically feasible for this anal-ysis.
LNB limits NOx formation by controlling both the stoichiometric and temperature profiles of the combustion flame in each burner flame envelope. This control is achieved with design features that regulate the aerodynamic distribution and mixing of the fuel and air, yielding reduced O2 in the primary combustion zone, reduced flame temperature, and reduced residence time at peak combus-tion temperatures. The combination of these techniques produces lower NOx emissions during the combustion process.
Combustion modifications designed to decrease NOx formation (lower temperature and less O2
availability) also tend to increase the formation and emission of CO and VOCs. Therefore, the combustion controls must be designed to reduce the formation of NOx while maintaining CO and VOC formation at an acceptable level. Other than the NOx/CO-VOC trade-off, there are no envi-ronmental impacts associated with using combustion controls to reduce NOx emissions.
FGR controls NOx by recycling a portion of the flue gas back into the primary combustion zone. The recycled air lowers NOx emissions by two mechanisms: (1) the recycled gas is made up of combustion products that are inert during combustion, thereby lowering combustion temperatures, and (2) by lowering the O2 content in the primary flame zone. The amount of recirculation is based on flame stability. However, FGR is not considered feasible due to the need for complicated tem-perature controls required for the North Slope weather conditions.

Final Regulatory Review and BACT Analysis of the GCF
Deliverable No: 008-14-910-005 Date: October 8, 2014 Page 46 NOTICE – THIS DOCUMENT CONTAINS CONFIDENTIAL AND PROPRIETARY INFORMATION AND SHALL NOT BE DUPLICATED, DISTRIBUTED, DISCLOSED, SHARED OR USED FOR ANY PURPOSE EXCEPT AS MAY BE AUTHORIZED BY AGDC IN WRITING. THIS DOCUMENT IS UNCONTROLLED WHEN PRINTED. THIS COPY VALID ONLY AT THE TIME OF PRINTING
Good Combustion Practice - The next control technology in the hierarchy is good combustion practice. No environmental or energy impacts are associated with good combustion practice for a natural gas-fired heater.
Rank of Remaining Technically Feasible Control Technologies by Control
Effectiveness (Step 3)
The remaining control technologies are ranked in order of most effective (that is, lowest to highest emission rates) as follows:
1) SCR 2) LNB 3) LNB with SCR 4) Good combustion practices
The economic, environmental, and energy impacts associated with each technology are evaluated in the following section.
Evaluation of Available and Technically Feasible Control Options (Step 4)
Preliminary estimates for costs of SCR installation and maintenance were provided by Arctic So-lutions (2014b). These preliminary estimates do not include all of the costs associated with the equipment. Nevertheless, as shown in Table 10, the annualized cost for the GCF heater SCR system is excessive, at $91,427 per short ton. Therefore, SCR is not considered economically feasible for this project.
Table 10. Cost-effectiveness of Selective Catalytic Reduction Installed for the Heaters
ANNUALIZED COSTS
DIRECT ANNUAL COSTS
Catalyst refill $100,000
Catalyst refill - Annualized $38,105
Catalyst transport $54,400
Catalyst transport - Annualized $20,729
Ammonia solution refill $238,200
Ammonia solution transport $6,560
INDIRECT ANNUAL COSTS
TCI $59,000,000
TCI – Annualized $8,400,273
COST-EFFECTIVENESS SUMMARY
Total Annualized Costs $8,703,867
NOx stpy 119
Removal Efficiency 80%
stpy Removed 95
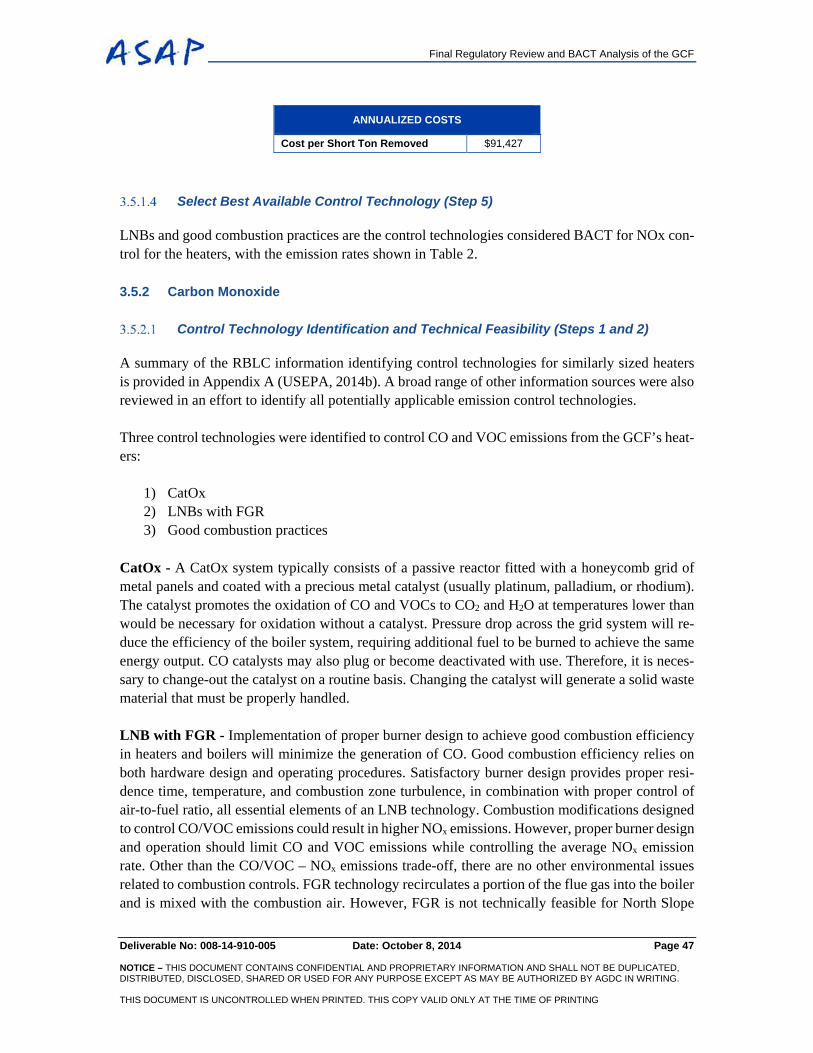
Final Regulatory Review and BACT Analysis of the GCF
Deliverable No: 008-14-910-005 Date: October 8, 2014 Page 47 NOTICE – THIS DOCUMENT CONTAINS CONFIDENTIAL AND PROPRIETARY INFORMATION AND SHALL NOT BE DUPLICATED, DISTRIBUTED, DISCLOSED, SHARED OR USED FOR ANY PURPOSE EXCEPT AS MAY BE AUTHORIZED BY AGDC IN WRITING. THIS DOCUMENT IS UNCONTROLLED WHEN PRINTED. THIS COPY VALID ONLY AT THE TIME OF PRINTING
ANNUALIZED COSTS
Cost per Short Ton Removed $91,427
Select Best Available Control Technology (Step 5)
LNBs and good combustion practices are the control technologies considered BACT for NOx con-trol for the heaters, with the emission rates shown in Table 2.
3.5.2 Carbon Monoxide
Control Technology Identification and Technical Feasibility (Steps 1 and 2)
A summary of the RBLC information identifying control technologies for similarly sized heaters is provided in Appendix A (USEPA, 2014b). A broad range of other information sources were also reviewed in an effort to identify all potentially applicable emission control technologies.
Three control technologies were identified to control CO and VOC emissions from the GCF’s heat-ers:
1) CatOx 2) LNBs with FGR 3) Good combustion practices
CatOx - A CatOx system typically consists of a passive reactor fitted with a honeycomb grid of metal panels and coated with a precious metal catalyst (usually platinum, palladium, or rhodium). The catalyst promotes the oxidation of CO and VOCs to CO2 and H2O at temperatures lower than would be necessary for oxidation without a catalyst. Pressure drop across the grid system will re-duce the efficiency of the boiler system, requiring additional fuel to be burned to achieve the same energy output. CO catalysts may also plug or become deactivated with use. Therefore, it is neces-sary to change-out the catalyst on a routine basis. Changing the catalyst will generate a solid waste material that must be properly handled.
LNB with FGR - Implementation of proper burner design to achieve good combustion efficiency in heaters and boilers will minimize the generation of CO. Good combustion efficiency relies on both hardware design and operating procedures. Satisfactory burner design provides proper resi-dence time, temperature, and combustion zone turbulence, in combination with proper control of air-to-fuel ratio, all essential elements of an LNB technology. Combustion modifications designed to control CO/VOC emissions could result in higher NOx emissions. However, proper burner design and operation should limit CO and VOC emissions while controlling the average NOx emission rate. Other than the CO/VOC – NOx emissions trade-off, there are no other environmental issues related to combustion controls. FGR technology recirculates a portion of the flue gas into the boiler and is mixed with the combustion air. However, FGR is not technically feasible for North Slope

Final Regulatory Review and BACT Analysis of the GCF
Deliverable No: 008-14-910-005 Date: October 8, 2014 Page 48 NOTICE – THIS DOCUMENT CONTAINS CONFIDENTIAL AND PROPRIETARY INFORMATION AND SHALL NOT BE DUPLICATED, DISTRIBUTED, DISCLOSED, SHARED OR USED FOR ANY PURPOSE EXCEPT AS MAY BE AUTHORIZED BY AGDC IN WRITING. THIS DOCUMENT IS UNCONTROLLED WHEN PRINTED. THIS COPY VALID ONLY AT THE TIME OF PRINTING
installations due to the need for complicated temperature controls required for the North Slope weather conditions.
Good Combustion Practices - The next control technology in the hierarchy is good combustion practices. No environmental or energy costs are associated with good combustion practices for an auxiliary boiler.
Rank of Remaining Technically Feasible Control Technologies by Control
Effectiveness (Step 3)
Emission rates for each of the technically feasible CO/VOC control technologies are summarized in the information included in the RBLC database provided in Appendix A (USEPA, 2014b). Emis-sion rates for each of the technology combinations are required to rank them in order of effective-ness. Control alternatives are ranked in order of most effective (that is, lowest emission rate) as follows:
1) CatOx (estimated CO control effectiveness of 80 to 95 percent) 2) LNB 3) Good combustion practices
Evaluation of Available and Technically Feasible Control Options (Step 4)
Preliminary estimates for costs of CatOx installation and maintenance were provided by Arctic Solutions (2014b). These preliminary estimates do not include all of the costs associated with the equipment; therefore, actual costs will be higher. Nevertheless, as shown in Table 11, the annual-ized cost for the GCF CatOx system is excessive, at $133,547 per short ton. Therefore, the CatOx is not considered feasible for this project.
Table 11. Cost-effectiveness of Catalytic Oxidation Installed for the Heaters
ANNUALIZED COSTS
DIRECT ANNUAL COSTS
Catalyst refill $48,000
Catalyst refill - Annualized $18,290
Catalyst transport $54,400
Catalyst transport - Annualized $20,729
INDIRECT ANNUAL COSTS
TCI $47,000,000
TCI – Annualized $6,691,743
COST-EFFECTIVENESS SUMMARY
Total Annualized Costs $6,730,762
NOx stpy 63
Removal Efficiency 80%
stpy Removed 50
Cost per Short Ton Removed $133,547
Final Regulatory Review and BACT Analysis of the GCF
Deliverable No: 008-14-910-005 Date: October 8, 2014 Page 49 NOTICE – THIS DOCUMENT CONTAINS CONFIDENTIAL AND PROPRIETARY INFORMATION AND SHALL NOT BE DUPLICATED, DISTRIBUTED, DISCLOSED, SHARED OR USED FOR ANY PURPOSE EXCEPT AS MAY BE AUTHORIZED BY AGDC IN WRITING. THIS DOCUMENT IS UNCONTROLLED WHEN PRINTED. THIS COPY VALID ONLY AT THE TIME OF PRINTING
Select Best Available Control Technology (Step 5)
Good combustion practices with good burner design (LNBs) is preliminary CO BACT for the GCF heaters, and the heaters will have the emission rate shown in Table 2.
3.5.3 Particulate Matter of Both 2.5 and 10 Microns in Diameter or Smaller
Control Technology Identification and Technical Feasibility (Steps 1 and 2)
Two control technologies for the heaters have been identified for PM10/PM2.5 control:
1) Use of clean-burning low-sulfur fuel (that is, natural gas) 2) Good combustion practices
Both of these options are technically feasible for use in limiting PM10/PM2.5 emissions from the GCF’s heaters.
Rank of Remaining Technically Feasible Control Technologies by Control Effectiveness (Step 3)
Based on the Step 2 analysis, good combustion practices and use of natural gas fuel are the only technologies for reducing PM10/PM2.5 emissions from the heaters.
Evaluation of Available and Technically Feasible Control Options (Step 4)
No environmental or energy costs are associated with good combustion practices and use of natural gas fuel in heaters.
Select Best Available Control Technology (Step 5)
Based on this analysis and review of the USEPA RBLC database (USEPA, 2014b), good combus-tion practices and burning fuel gas (when available) is considered BACT for PM10/PM2.5.
3.6 FLARES
3.6.1 Nitrogen Oxides
This section presents information on the feasibility, effectiveness, and costs of NOx emission con-trols for a pilot burner for the flares. Control techniques include low combustion controls and op-erating practices.

Final Regulatory Review and BACT Analysis of the GCF
Deliverable No: 008-14-910-005 Date: October 8, 2014 Page 50 NOTICE – THIS DOCUMENT CONTAINS CONFIDENTIAL AND PROPRIETARY INFORMATION AND SHALL NOT BE DUPLICATED, DISTRIBUTED, DISCLOSED, SHARED OR USED FOR ANY PURPOSE EXCEPT AS MAY BE AUTHORIZED BY AGDC IN WRITING. THIS DOCUMENT IS UNCONTROLLED WHEN PRINTED. THIS COPY VALID ONLY AT THE TIME OF PRINTING
Control Technology Identification and Technical Feasibility (Steps 1 and 2)
The following potential control technologies were identified for the control of NOx emissions from a flare:
1) Low NOx flare design 2) Flare design and operation
Low NOx flare design can be an engineered flare with air‐ or steam‐assisted combustion, staged combustion, or agency‐approved equivalent controls. After review of the RBLC database (USEPA, 2014b) and industry standards, it has been determined that low NOx flare design has been used and demonstrated effective on flares. However, an LNB on a flare is not appropriate for an Oil and Gas (O&G) production facility.
Flare design and operation will include a new flare unit designed and operated to meet the re-quirements in 40 CFR 63, Subpart A, Section 63.11, Control Device and Work Practice Require-ments. Since flares are currently designed to meet these requirements, this option is technically feasible.
Rank of Remaining Technically Feasible Control Technologies by Control Effectiveness (Step 3)
Because ASAP will implement all of the remaining technically feasible control technologies, rank-ing their control effectiveness is unnecessary.
Evaluation of Available and Technically Feasible Control Options (Step 4)
Because ASAP will implement all of the remaining technically feasible control technologies, fur-ther review of economic, environmental, and energy impacts is unnecessary.
Select Best Available Control Technology (Step 5)
A database search of USEPA’s RBLC (USEPA, 2014b) for flares is summarized in Appendix A for recent permits. Proper flare design and operation is the BACT for the pilot burner for the flares and is the technically feasible control method for NOx emissions.
3.6.2 Carbon Monoxide and Volatile Organic Compounds
Completeness of combustion in a flare is governed by flame temperature, residence time in the combustion zone, turbulent mixing of the components to complete the oxidation reaction, and avail-able O2 for free-radical formation. Control technologies that are intended to assure complete com-bustion aid in the reduction of CO emissions.

Final Regulatory Review and BACT Analysis of the GCF
Deliverable No: 008-14-910-005 Date: October 8, 2014 Page 51 NOTICE – THIS DOCUMENT CONTAINS CONFIDENTIAL AND PROPRIETARY INFORMATION AND SHALL NOT BE DUPLICATED, DISTRIBUTED, DISCLOSED, SHARED OR USED FOR ANY PURPOSE EXCEPT AS MAY BE AUTHORIZED BY AGDC IN WRITING. THIS DOCUMENT IS UNCONTROLLED WHEN PRINTED. THIS COPY VALID ONLY AT THE TIME OF PRINTING
Control Technology Identification and Feasibility (Steps 1 and 2)
Review of the RBLC database (USEPA, 2014b) and industry standards identified the following potential control technologies for CO from flares:
1) Smokeless flare 2) Flare design and operation 3) Proper plant operations 4) Selection of pilot and purge gas
Smokeless flares - Smokeless flares are commonly used and are a feasible technology.
Flare design and operation - The flare will be a new unit designed and operated to meet the requirements in 40 CFR 63, Subpart A, and in particular, Section 63.11, Control Device and Work Practice Requirements. Since flares are currently designed to meet these requirements, this option is technically feasible.
Proper Plant Operation - Because the flare is designed to operate during an emergency condition, proper operation of the GCF will lessen the likelihood of an emergency occurring and, therefore, reduce emissions.
Selection of Pilot and Purge Gas - The use of fuels such as natural gas, treated refinery gas, or Liquefied Petroleum Gas (LPG) has the potential to reduce emissions because when used in a flare, they can achieve higher destruction efficiencies than other fuels. Natural gas is available as pilot light fuel for the flare.
Rank of Remaining Technically Feasible Control Technologies by Control
Effectiveness (Step 3)
All of the control technologies identified were determined to be technically feasible. Because ASAP will implement all of the remaining technically feasible control technologies, ranking their control effectiveness is unnecessary.
Evaluation of Available and Technically Feasible Control Options (Step 4)
All of the control technologies identified were determined to be technically feasible. ASAP will implement all of the technically feasible control technologies, so further review of economic, en-vironmental, and energy impacts is unnecessary.
Select Best Available Control Technology (Step 5)
Review of BACT databases and industry standards identified the technically feasible control method for CO and VOC emissions from the flare as the use of a smokeless flare. In addition, the GCF will use proper flare design and operation, proper plant operation, and natural gas for the pilot and purge gas.
Final Regulatory Review and BACT Analysis of the GCF
Deliverable No: 008-14-910-005 Date: October 8, 2014 Page 52 NOTICE – THIS DOCUMENT CONTAINS CONFIDENTIAL AND PROPRIETARY INFORMATION AND SHALL NOT BE DUPLICATED, DISTRIBUTED, DISCLOSED, SHARED OR USED FOR ANY PURPOSE EXCEPT AS MAY BE AUTHORIZED BY AGDC IN WRITING. THIS DOCUMENT IS UNCONTROLLED WHEN PRINTED. THIS COPY VALID ONLY AT THE TIME OF PRINTING
3.6.3 Particulate Matter of Both 10 and 2.5 Microns in Diameter or Smaller
Oxygen deficiency and the cooling of carbon particles below their ignition temperature can cause a flare to generate smoke. In large diffusion flames, combustion product vortices can form around burning portions of the gas and shut off the supply of O2. This localized instability causes flame flickering, which can be accompanied by soot formation. As in all combustion processes, an ade-quate air supply and good mixing are required to complete combustion and minimize smoke.
Various smokeless flare designs are available for flares, including steam‐assisted, air‐assisted, and staged combustion flares. These designs differ primarily in the method used to provide an adequate supply of air for combustion and good mixing. However, often, these technologies are not required to achieve smokeless operation or high-destruction efficiencies from flares.
Control Technology Identification and Technical Feasibility (Steps 1 and 2)
Review of the RBLC database (USEPA, 2014b) and industry standards identified the following potential control technologies for PM from ground flares:
1) Smokeless flare 2) Flare design and operation 3) Proper plant operations 4) Selection of pilot and purge gas
Smokeless Flare - Smokeless flares are commonly used at refineries and are a feasible technology.
Flare Design and Operation - The flares will be new units designed and operated to meet the requirements in 40 CFR 63, Subpart A, Section 63.11, Control Device and Work Practice Require-ments. Since flares are currently designed to meet these requirements, this option is technically feasible.
Proper Plant Operation - Because the flares are designed to operate during an emergency condi-tion, proper operation of the facility will lessen the likelihood of an emergency occurring and, therefore, reduce emissions.
Selection of Pilot and Purge Gas - The use of clean, low‐sulfur fuels, such as natural gas, treated refinery gas, or LPG, has the potential to reduce emissions by reducing the formation of SO2, which contributes to condensable PM. Natural gas is available as pilot light fuel for the flares.
Rank of Remaining Technically Feasible Control Technologies by Control
Effectiveness (Step 3)
All of the control technologies identified were determined to be technically feasible. Because all of these technically feasible control options will be implemented, ranking their control effectiveness is unnecessary.
Final Regulatory Review and BACT Analysis of the GCF
Deliverable No: 008-14-910-005 Date: October 8, 2014 Page 53 NOTICE – THIS DOCUMENT CONTAINS CONFIDENTIAL AND PROPRIETARY INFORMATION AND SHALL NOT BE DUPLICATED, DISTRIBUTED, DISCLOSED, SHARED OR USED FOR ANY PURPOSE EXCEPT AS MAY BE AUTHORIZED BY AGDC IN WRITING. THIS DOCUMENT IS UNCONTROLLED WHEN PRINTED. THIS COPY VALID ONLY AT THE TIME OF PRINTING
Evaluation of Available and Technically Feasible Control Options (Step 4)
All of the control technologies identified were determined to be technically feasible. Because all of these technically feasible control options will be implemented, further review of economic, envi-ronmental, and energy impacts is unnecessary.
Select Best Available Control Technology (Step 5)
A database search of USEPA’s RBLC (USEPA, 2014b) for flares is summarized in Appendix A for recent permits. BACT for PM emissions from the pilot burner of the flares are the technically feasible control smokeless flare design, proper flare design and operation, proper plant operation, and use of natural gas as pilot light fuel.
3.7 DIESEL STORAGE TANKS
GCF will have five 9,980-gallon Aboveground Storage Tanks (ASTs) installed to contain the ULSD. The storage tanks will have vertical, fixed-roof design, with VOCs being the only potential criteria pollutant emission exceeding the BACT evaluation threshold. Maximum VOC emissions were estimated at 0.01 stpy. The number of fuel turnovers was estimated at six per year.
3.7.1 Control Technology Identification and Technical Feasibility (Steps 1 and 2)
From review of Chapter 7, “Liquid Storage Tanks,” of USEPA’s AP-42: Compilation of Air Pol-lutant Emission Factors (2006) (AP-42), there are six major tank designs that could potentially be used, each with a variety of specific design features. Given that the GCF will use a vertical, fixed-roof design, this tank VOC analysis will focus on BACT for that design.
A summary of the RBLC information (USEPA, 2014b) identifying control technologies for simi-larly sized, fixed, vertical tanks is provided in Appendix A. A broad range of other information sources were also reviewed in an effort to identify all potentially applicable emission control tech-nologies.
For the vertical, fixed-roof design, AP-42 notes the following VOC control technology options, with estimated control efficiency range:
Internal floating roof and seals (60 to 99 percent) Vapor balancing (90 to 98 percent) Vapor recovery system (90 to 98 percent) Thermal oxidation system (96 to 99 percent)
In addition to the AP-42 information, two additional control technologies were identified:
1. Submerged fill line (approximately50 to 58 percent more efficient than splash fill) 2. Flares (90 to 98 percent)

Final Regulatory Review and BACT Analysis of the GCF
Deliverable No: 008-14-910-005 Date: October 8, 2014 Page 54 NOTICE – THIS DOCUMENT CONTAINS CONFIDENTIAL AND PROPRIETARY INFORMATION AND SHALL NOT BE DUPLICATED, DISTRIBUTED, DISCLOSED, SHARED OR USED FOR ANY PURPOSE EXCEPT AS MAY BE AUTHORIZED BY AGDC IN WRITING. THIS DOCUMENT IS UNCONTROLLED WHEN PRINTED. THIS COPY VALID ONLY AT THE TIME OF PRINTING
All of these technologies have been used to reduce VOC emissions from vertical, fixed-roof, fuel-oil storage tanks. Based on engineering judgment, all of the technologies listed are technically feasible.
3.7.2 Rank of Remaining Technically Feasible Control Technologies by Control Effectiveness (Step 3)
Emission rates for each of the technology combinations are required to rank them in order of effec-tiveness. Control alternatives are ranked in order of most effective (that is, lowest to highest emis-sion rates) as follows:
1. Thermal oxidation 2. Vapor recovery system 3. Flares 4. Vapor balancing 5. Internal floating roof and seals 6. Submerged fill line
3.7.3 Evaluation of Available and Technically Feasible Control Options (Step 4)
Thermal Oxidation
A thermal oxidizer consists of a tower, which contains a ceramic heat exchanger. The VOCs are oxidized at high temperatures, typically 1,450 to 1,550°F for a period of 1 to 2 seconds, when the VOCs are bonded together with O2molecules prior to discharge to atmosphere. There are economic, energy, and environmental impacts associated with the installation of a thermal oxidizer. Those impacts make it an unreasonable alternative to consider as BACT in light of the low potential VOC emissions from the tanks.
Vapor Recovery System
This process consists of a closed venting system from the storage tank space to a Vapor Recovery Unit (VRU) that will recover the vapors for return to the process or destroy them, usually by oxi-dation. Economic, energy, and environmental impacts are associated with the installation of a VRU. Those impacts make it an unreasonable alternative to consider as BACT in light of the low potential VOC emissions from the tanks.
Flares
The emissions are sent to a tower where they are destroyed by a high-temperature flame. There are economic, energy, and environmental impacts associated with the installation of a flare. Those im-pacts make it an unreasonable alternative to consider as BACT in light of the low potential VOC emissions from the tanks.

Final Regulatory Review and BACT Analysis of the GCF
Deliverable No: 008-14-910-005 Date: October 8, 2014 Page 55 NOTICE – THIS DOCUMENT CONTAINS CONFIDENTIAL AND PROPRIETARY INFORMATION AND SHALL NOT BE DUPLICATED, DISTRIBUTED, DISCLOSED, SHARED OR USED FOR ANY PURPOSE EXCEPT AS MAY BE AUTHORIZED BY AGDC IN WRITING. THIS DOCUMENT IS UNCONTROLLED WHEN PRINTED. THIS COPY VALID ONLY AT THE TIME OF PRINTING
Vapor Balancing
As the storage tank is filled, the vapors expelled from the storage tank are directed to the emptying ULSD tanker truck. The truck then transports the vapors to a centralized station where a vapor recovery or control system is used to control emissions. If the truck vents the vapor to the atmos-phere instead of to a recovery or control system, no control is achieved. No economic, energy, or environmental impacts are associated with vapor balancing.
Internal Floating Roof Tank and Seals
An internal floating roof-tank moves up or down, based on the liquid level in the tank; therefore, reducing the amount of vapor space within the tank. By having less vapor space, the amount of emissions that can build up due to temperature and pressure changes is reduced. Floating roofs are typically used on large, bulk storage fuel tanks and an available supplier of floating roofs tanks this size could not be located. Floating roofs are not typically used for tanks of this size. A custom-built floating roof tank of this size would be very costly to design and build. Therefore, the lack of availability of floating roof tanks and cost impacts of a custom tank make floating roofs an unrea-sonable alternative to consider as BACT in light of the low potential VOC emissions from the tanks.
Submerged Fill Line
The process of submerged fill means any fill pipe with a discharge opening that is entirely sub-merged in liquid that is at least 6 inches from the bottom of the tank. Liquid turbulence is controlled significantly during submerged loading, resulting in much lower vapor generation than encountered during splash loading. No economic, energy, or environmental impacts are associated with this loading method.
3.7.4 Select Best Available Control Technology (Step 5)
The final step in the top-down BACT analysis process is to select BACT, and USEPA’s RBLC database was consulted (USEPA, 2014b) to assist in selecting BACT for the ULSD storage tank VOC emissions. The most common emissions control for similarly sized, fixed-roof tanks is good design and operating practices, submerged fill, and fuel specification.
Therefore, based on the discussion herein, and due to the low, uncontrolled VOC emissions from the fixed ULSD storage tanks, good design and operating practices and a submerged fill line with vapor balancing are considered BACT to control emissions of VOCs from the ULSD storage tanks.
3.8 GASOLINE STORAGE TANK
GCF will have one 9,980-gallon AST installed to contain the gasoline. The AST will have vertical, fixed-roof design, with VOCs being the only potential criteria pollutant emission exceeding the BACT evaluation threshold. VOC emissions were estimated at 0.25 stpy. The number of fuel turn-overs was estimated at seven per year.

Final Regulatory Review and BACT Analysis of the GCF
Deliverable No: 008-14-910-005 Date: October 8, 2014 Page 56 NOTICE – THIS DOCUMENT CONTAINS CONFIDENTIAL AND PROPRIETARY INFORMATION AND SHALL NOT BE DUPLICATED, DISTRIBUTED, DISCLOSED, SHARED OR USED FOR ANY PURPOSE EXCEPT AS MAY BE AUTHORIZED BY AGDC IN WRITING. THIS DOCUMENT IS UNCONTROLLED WHEN PRINTED. THIS COPY VALID ONLY AT THE TIME OF PRINTING
3.8.1 Control Technology Identification and Technical Feasibility (Steps 1 and 2)
From review of Chapter 7, “Liquid Storage Tanks,” of AP-42 (USEPA, 2006), there are six major tank designs that could potentially be used, each with a variety of specific design features. Given that GCF will use a vertical, fixed-roof design, this tank VOC analysis will focus on BACT for that design.
A summary of the RBLC information (USEPA, 2014b) identifying control technologies for simi-larly sized, fixed-roof, vertical tanks is shown in Appendix A. A broad range of other information sources were also reviewed in an effort to identify all potentially applicable emission control tech-nologies.
For the vertical, fixed-roof design, AP-42 (USEPA, 2006) notes the following VOC control tech-nology options, with estimated control efficiency range:
Internal floating roof and seals (60 to 99 percent) Vapor balancing (90 to 98 percent) Vapor recovery system (90 to 98 percent) Thermal oxidation system (96 to 99 percent)
In addition to the AP-42 information, two additional control technologies were identified:
1. Submerged fill line (approximately 50 to 58 percent more efficient than splash fill) 2. Flares (90 to 98 percent)
All of these technologies have been used to reduce VOC emissions from vertical, fixed-roof gaso-line storage tanks. Based on engineering judgment, all of the technologies listed herein are techni-cally feasible.
3.8.2 Rank of Remaining Technically Feasible Control Technologies by Control Effectiveness (Step 3)
Emission rates for each of the technology combinations are required to rank them in order of effec-tiveness. Control alternatives are ranked in order of most effective (that is, lowest to highest emis-sion rates) as follows:
1. Thermal oxidation 2. Vapor recovery system 3. Flares 4. Vapor balancing 5. Internal floating roof and seals 6. Submerged fill line

Final Regulatory Review and BACT Analysis of the GCF
Deliverable No: 008-14-910-005 Date: October 8, 2014 Page 57 NOTICE – THIS DOCUMENT CONTAINS CONFIDENTIAL AND PROPRIETARY INFORMATION AND SHALL NOT BE DUPLICATED, DISTRIBUTED, DISCLOSED, SHARED OR USED FOR ANY PURPOSE EXCEPT AS MAY BE AUTHORIZED BY AGDC IN WRITING. THIS DOCUMENT IS UNCONTROLLED WHEN PRINTED. THIS COPY VALID ONLY AT THE TIME OF PRINTING
3.8.3 Evaluation of Available and Technically Feasible Control Options (Step 4)
Thermal Oxidation
A thermal oxidizer consists of a tower, which contains a ceramic heat exchanger. The VOCs are oxidized at high temperatures, typically 1,450 to 1,550°F for a period of 1 to 2 seconds, when the VOCs are bonded together with O2 molecules prior to discharge to atmosphere. There are eco-nomic, energy, and environmental impacts associated with the installation of a thermal oxidizer. Those impacts make it an unreasonable alternative to consider as BACT in light of the low potential VOC emissions from the tank.
Vapor Recovery System
This process consists of a closed venting system from the storage tank space to a VRU that will recover the vapors for return to the process or destroy them. Several vapor recovery procedures may be used, including vapor/liquid absorption, vapor compression, vapor cooling, vapor/solid ad-sorption, or a combination of these. Economic, energy, and environmental impacts are associated with the installation of a VRU. Those impacts make it an unreasonable alternative to consider as BACT in light of the low potential VOC emissions from the tank.
Flares
The emissions are sent to a tower where they are destroyed by a high-temperature flame. There are economic, energy, and environmental impacts associated with the installation of a flare. Those im-pacts make it an unreasonable alternative to consider as BACT in light of the low potential VOC emissions from the tank.
Vapor Balancing
As the storage tank is filled, the vapors expelled from the storage tank are directed to the emptying gasoline tanker truck. The truck then transports the vapors to a centralized station where a vapor recovery or control system is used to control emissions. If the truck vents the vapor to the atmos-phere instead of to a recovery or control system, no control is achieved. No economic, energy, or environmental impacts are associated with vapor balancing.
Internal Floating Roof Tank and Seals
An internal, floating, roof tank moves up or down, based on the liquid level in the tank; therefore, reducing the amount of vapor space within the tank. By having less vapor space, the amount of emissions that can build up due to temperature and pressure changes is reduced. There are economic impacts associated with the installation of an internal, floating, roof tank. Actual incremental costs for a floating roof tank vary based upon the tank size though manufacturers contacted did not offer a floating roof tank this small. Installing a floating roof tank of these size would require a custom design and fabrication at a cost far exceeding commercially available tanks. Because floating roof tanks of this size are not commercially available and because cost impacts of a custom tank (if available) are significant, floating roof tanks are an unreasonable alternative to consider as BACT in light of the low potential VOC emissions from the tank.

Final Regulatory Review and BACT Analysis of the GCF
Deliverable No: 008-14-910-005 Date: October 8, 2014 Page 58 NOTICE – THIS DOCUMENT CONTAINS CONFIDENTIAL AND PROPRIETARY INFORMATION AND SHALL NOT BE DUPLICATED, DISTRIBUTED, DISCLOSED, SHARED OR USED FOR ANY PURPOSE EXCEPT AS MAY BE AUTHORIZED BY AGDC IN WRITING. THIS DOCUMENT IS UNCONTROLLED WHEN PRINTED. THIS COPY VALID ONLY AT THE TIME OF PRINTING
Submerged Fill Line
The process of submerged fill means any fill pipe with a discharge opening that is entirely sub-merged in liquid that is at least 6 inches from the bottom of the tank. Liquid turbulence is controlled significantly during submerged loading, resulting in much lower vapor generation than encountered during splash loading. No economic, energy, or environmental impacts are associated with this loading method.
3.8.4 Select Best Available Control Technology (Step 5)
The final step in the top-down BACT analysis process is to select BACT, and USEPA’s RBLC database was consulted (USEPA, 2014b) to assist in selecting BACT for gasoline storage tank VOC emissions. The most common emissions control for fixed-roof tanks is submerged fill pipes and Stage I vapor recovery.
Therefore, based on the discussion herein, and due to the low, uncontrolled VOC emissions from the fixed gasoline storage tank, good design and operating practices and a submerged fill line with Stage I vapor recovery are considered BACT to control emissions of VOCs from the gasoline stor-age tank.
3.9 DIESEL DISPENSING FACILITY
GCF will have one ULSD dispensing facility. The annual ULSD throughput was estimated at 56,892 gallons per year per tank. VOCs are the only potential criteria pollutant emission for the ULSD dispensing operation exceeding the BACT evaluation threshold. VOC emissions were es-timated to be 0.01 stpy for ULSD dispensing.
3.9.1 Control Technology Identification and Technical Feasibility (Steps 1 and 2)
Fuel-dispensing facilities have the potential to be a large source of evaporative non-point or ‘fugi-tive’ pollutant emissions. Displaced fuel vapor emissions are generated as fuels are loaded into vehicles, equipment, or cargo tanks (tank trucks). The amount of fugitive emissions released to the ambient atmosphere is directly tied to the amount of fuel that is pumped through the system.
Based on a search of the RBLC database (USEPA, 2014b) and review of Chapter 5, “Transportation and Marketing of Petroleum Liquids,” of AP-42 (USEPA, 2006), control methods for vehicle re-fueling emissions are based on conveying the vapors displaced from the vehicle fuel tank to the storage tank vapor space through the use of a special hose and nozzle. The following potential control technology was identified:
Good fueling practices
No RBLC information identifying control technologies for ULSD dispensing facilities could be found (USEPA, 2014b).
Final Regulatory Review and BACT Analysis of the GCF
Deliverable No: 008-14-910-005 Date: October 8, 2014 Page 59 NOTICE – THIS DOCUMENT CONTAINS CONFIDENTIAL AND PROPRIETARY INFORMATION AND SHALL NOT BE DUPLICATED, DISTRIBUTED, DISCLOSED, SHARED OR USED FOR ANY PURPOSE EXCEPT AS MAY BE AUTHORIZED BY AGDC IN WRITING. THIS DOCUMENT IS UNCONTROLLED WHEN PRINTED. THIS COPY VALID ONLY AT THE TIME OF PRINTING
Good fueling practices have been used to reduce VOC emissions from ULSD dispensing opera-tions. Therefore, the technology is considered technically feasible.
3.9.2 Rank of Remaining Technically Feasible Control Technologies by Control Effectiveness (Step 3)
Control alternatives are ranked in order of most effective (that is, lowest to highest emission rates). There is only one identified technically feasible VOC control technology for ULSD dispensing operations:
1. Good fueling practices
3.9.3 Evaluation of Available and Technically Feasible Control Options (Step 4)
Good Fueling Practices
Good fueling practice is limiting the amount of fuel that is exposed to the ambient air. Good fueling practices include not overfilling the vehicle or equipment tank and limiting spillage, not capping off the vehicle or equipment tanks after refilling, and returning nozzles to the dispenser. No eco-nomic, energy, or environmental impacts are associated with good fueling practices.
3.9.4 Select Best Available Control Technology (Step 5)
The final step in the top-down BACT analysis process is to select BACT, and USEPA’s RBLC database was consulted (USEPA, 2014b) to assist in selecting BACT for ULSD dispensing opera-tion VOC emissions. No emission controls were identified for ULSD dispensing operations.
Therefore, based on the discussion herein, good design and operating practices and good fueling practices are considered BACT to control emissions of VOCs from the ULSD dispensing opera-tions.
3.10 GASOLINE DISPENSING FACILITY
GCF will have one GDF. The annual gasoline throughput was estimated at 65,700 gallons per year. VOCs are the only potential criteria pollutant emission for the gasoline dispensing operation ex-ceeding the BACT evaluation threshold. Maximum VOC emissions were estimated at 0.62 stpy for gasoline dispensing.
3.10.1 Control Technology Identification and Technical Feasibility (Steps 1 and 2)
Fuel dispensing facilities have the potential to be a large source of evaporative non-point or fugitive pollutant emissions. Displaced fuel vapor emissions are generated as fuels are loaded into vehicles, equipment, or cargo tanks (tank trucks). The amount of fugitive emissions released to the ambient atmosphere is directly tied to the amount of fuel that is pumped through the system.
Final Regulatory Review and BACT Analysis of the GCF
Deliverable No: 008-14-910-005 Date: October 8, 2014 Page 60 NOTICE – THIS DOCUMENT CONTAINS CONFIDENTIAL AND PROPRIETARY INFORMATION AND SHALL NOT BE DUPLICATED, DISTRIBUTED, DISCLOSED, SHARED OR USED FOR ANY PURPOSE EXCEPT AS MAY BE AUTHORIZED BY AGDC IN WRITING. THIS DOCUMENT IS UNCONTROLLED WHEN PRINTED. THIS COPY VALID ONLY AT THE TIME OF PRINTING
Based on a search of the RBLC database (USEPA, 2014b) and review of Chapter 5, “Transportation and Marketing of Petroleum Liquids,” of AP-42 (USEPA, 2006), control methods for vehicle refu-eling emissions are based on conveying the vapors displaced from the vehicle fuel tank to the UST vapor space through the use of a special hose and nozzle. The following potential control technol-ogies were identified:
Stage I vapor control Stage II vapor control Good fueling practices
A summary of the RBLC information (USEPA, 2014b) identifying control technologies for simi-larly sized GDFs is provided in Appendix A. All of these technologies have been used to reduce VOC emissions from gasoline dispensing oper-ations. Based on engineering judgment, all of the technologies listed herein are technically feasible.
3.10.2 Rank of Remaining Technically Feasible Control Technologies by Control Effectiveness (Step 3)
Emission rates for each of the technology combinations are required to rank them in order of effec-tiveness. Control alternatives are ranked in order of most effective (that is, lowest to highest emis-sion rates) as follows:
1. Stage I vapor control 2. Stage II vapor control 3. Good fueling practices
3.10.3 Evaluation of Available and Technically Feasible Control Options (Step 4)
Stage I and Stage II Vapor Control
Stage I and II control technologies reduce VOC emissions by capturing the fugitive fuel vapors released during filling of the storage tank and filling of vehicles. Stage I captures the fugitive fuel vapors generated during filling of the tank and returns them back into the tanker truck filling the storage tank. Stage II captures the fugitive fuel emissions released during the filling of vehicles and returns them back into the storage tank. Stage I and II control technologies have demonstrated a control efficiency in the range of 88 to 92 percent (USEPA, 2006).
There are economic, energy, and environmental impacts associated with the installation of Stage I and Stage II controls. A search of the RBLC database (USEPA, 2014b) shows that Stage II vapor control has been demonstrated on gasoline dispensing operations with dispensing limits of 26,000 gallons per month. Cost analysis for gasoline dispensing operations are available from the California Air Resources Board (CARB) Enhanced Vapor Recovery Program. Using costs pro-vided in the CARB initial statement of requirements as revised October 26, 2002 (CARB, 2002) for gasoline dispensing operation with dispensing limits of 13,233 gallons per month (the smallest
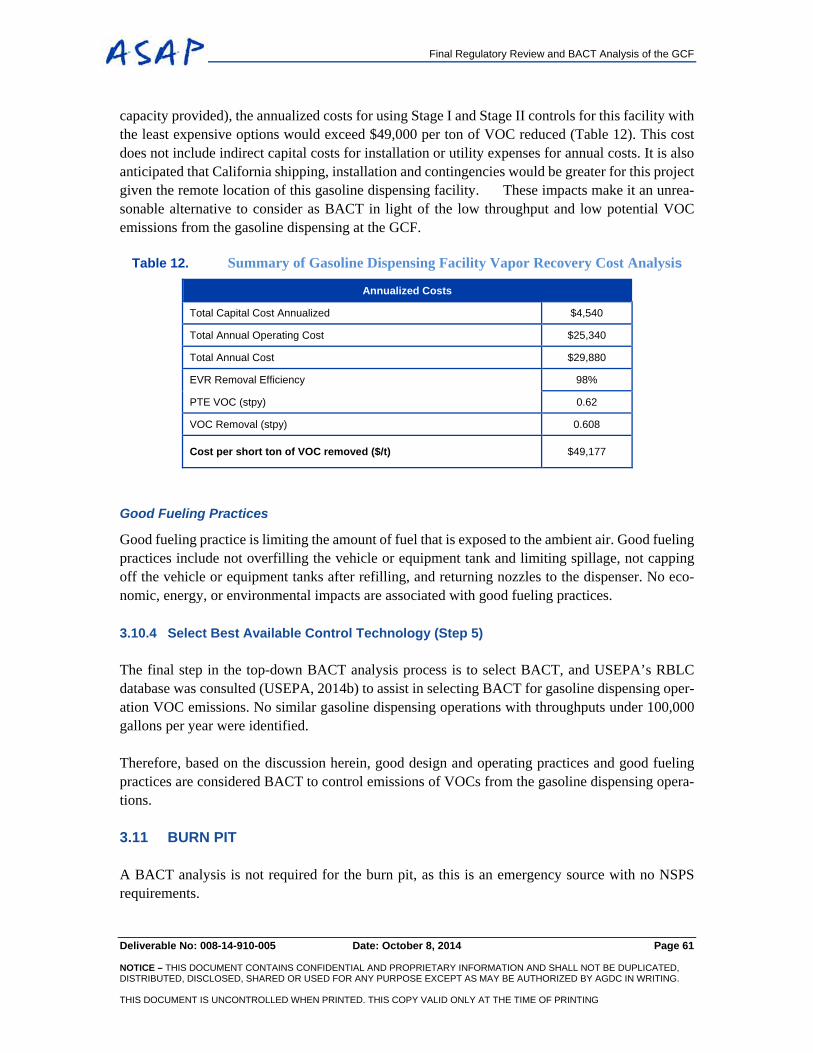
Final Regulatory Review and BACT Analysis of the GCF
Deliverable No: 008-14-910-005 Date: October 8, 2014 Page 61 NOTICE – THIS DOCUMENT CONTAINS CONFIDENTIAL AND PROPRIETARY INFORMATION AND SHALL NOT BE DUPLICATED, DISTRIBUTED, DISCLOSED, SHARED OR USED FOR ANY PURPOSE EXCEPT AS MAY BE AUTHORIZED BY AGDC IN WRITING. THIS DOCUMENT IS UNCONTROLLED WHEN PRINTED. THIS COPY VALID ONLY AT THE TIME OF PRINTING
capacity provided), the annualized costs for using Stage I and Stage II controls for this facility with the least expensive options would exceed $49,000 per ton of VOC reduced (Table 12). This cost does not include indirect capital costs for installation or utility expenses for annual costs. It is also anticipated that California shipping, installation and contingencies would be greater for this project given the remote location of this gasoline dispensing facility. These impacts make it an unrea-sonable alternative to consider as BACT in light of the low throughput and low potential VOC emissions from the gasoline dispensing at the GCF.
Table 12. Summary of Gasoline Dispensing Facility Vapor Recovery Cost Analysis
Annualized Costs
Total Capital Cost Annualized $4,540
Total Annual Operating Cost $25,340
Total Annual Cost $29,880
EVR Removal Efficiency 98%
PTE VOC (stpy) 0.62
VOC Removal (stpy) 0.608
Cost per short ton of VOC removed ($/t) $49,177
Good Fueling Practices
Good fueling practice is limiting the amount of fuel that is exposed to the ambient air. Good fueling practices include not overfilling the vehicle or equipment tank and limiting spillage, not capping off the vehicle or equipment tanks after refilling, and returning nozzles to the dispenser. No eco-nomic, energy, or environmental impacts are associated with good fueling practices.
3.10.4 Select Best Available Control Technology (Step 5)
The final step in the top-down BACT analysis process is to select BACT, and USEPA’s RBLC database was consulted (USEPA, 2014b) to assist in selecting BACT for gasoline dispensing oper-ation VOC emissions. No similar gasoline dispensing operations with throughputs under 100,000 gallons per year were identified.
Therefore, based on the discussion herein, good design and operating practices and good fueling practices are considered BACT to control emissions of VOCs from the gasoline dispensing opera-tions.
3.11 BURN PIT
A BACT analysis is not required for the burn pit, as this is an emergency source with no NSPS requirements.
Final Regulatory Review and BACT Analysis of the GCF
Deliverable No: 008-14-910-005 Date: October 8, 2014 Page 62 NOTICE – THIS DOCUMENT CONTAINS CONFIDENTIAL AND PROPRIETARY INFORMATION AND SHALL NOT BE DUPLICATED, DISTRIBUTED, DISCLOSED, SHARED OR USED FOR ANY PURPOSE EXCEPT AS MAY BE AUTHORIZED BY AGDC IN WRITING. THIS DOCUMENT IS UNCONTROLLED WHEN PRINTED. THIS COPY VALID ONLY AT THE TIME OF PRINTING
4. GREENHOUSE GAS BEST AVAILABLE CONTROL TECHNOLOGY
This section presents the BACT analysis for GHGs. Because, as will be shown to be the case for the GCF, GHG BACT evaluations typically focus primarily on energy efficiency, the analysis is highly dependent on equipment selection. For the GCF, final equipment cannot be identified until after competitive bid, which will occur after submittal of the permit application; therefore, the final equipment selection cannot be incorporated into the application.
Therefore, this GHG BACT analysis is based on equipment known to be of the size and efficiency required (thus, similar to) of the various options to be bid. Reasonable operating profiles based on assumed use of the indicative equipment will be used to develop long averaging period, output-based limits, as suggested in USEPA guidance (2011). AGDC commits to meeting the limits pro-posed herein regardless of final equipment selection.
4.1 OVERVIEW
The primary sources of GCF GHG emissions are the combustion turbines and process heaters, followed by fugitive emissions, flare and vents, and the emergency engines. The GCF GHG emis-sions are dominated by CO2; however, Methane (CH4) will also be emitted from fugitive sources, and small quantities of CH4 and Nitrous Oxide (N2O) will be emitted from combustion sources. No sources of Perfluorocarbons (PFCs), Hydrofluorocarbons (HFCs), or Sulfur Hexafluoride (SF6) are anticipated with this project.
This analysis follows USEPA’s top-down analysis method, as specified in their GHG Permitting Guidance (2011). The following top-down analysis steps are listed in the USEPA’s Draft New Source Review Workshop Manual: Prevention of Significant Deterioration and Nonattainment Area Permitting (1990b):
Step 1: Identify all control technologies Step 2: Eliminate technically infeasible options Step 3: Rank remaining control technologies by control effectiveness Step 4: Evaluate most effective controls and document results Step 5: Select BACT
This BACT analysis follows the five-step process for combustion sources, fugitives, process heat-ers, and emergency flares and venting.
One of the primary purposes of the GCF is to separate CO2 from the produced gas. This CO2 will be returned to the Prudhoe Bay Unit (PBU), the source of the raw gas, which will then inject the CO2 back into the geologic reservoir. Because it is AGDC’s understanding that no CO2 will be
Final Regulatory Review and BACT Analysis of the GCF
Deliverable No: 008-14-910-005 Date: October 8, 2014 Page 63 NOTICE – THIS DOCUMENT CONTAINS CONFIDENTIAL AND PROPRIETARY INFORMATION AND SHALL NOT BE DUPLICATED, DISTRIBUTED, DISCLOSED, SHARED OR USED FOR ANY PURPOSE EXCEPT AS MAY BE AUTHORIZED BY AGDC IN WRITING. THIS DOCUMENT IS UNCONTROLLED WHEN PRINTED. THIS COPY VALID ONLY AT THE TIME OF PRINTING
intentionally vented by PBU, and the management of that CO2 will be outside of AGDC’s control, control of CO2 transported to the GCF with the raw gas will not be covered in this GHG BACT analysis.
Because of the evolving nature of GHG BACT analyses, little useful information exists in the RBLC database (USEPA, 2014b). A recent review yielded:
No permitting data for natural gas-fired combustion turbines of 25 MW or less. For natural gas-fired combustion turbines greater than 25 MW, seven projects were listed
with stpy limits; this is not a useful metric for comparison between projects. One project was listed with a limit of 1,328 pounds per megawatt-hour (lb/MWh) gross; however, the turbines for this project are much larger than those at the GCF, and in general, larger tur-bines can be operated more efficiently.
No permitting data for heaters of less than 100 MMBTU/hr. For heaters greater than 100 MMBTU/hr, six were listed with stpy limits. One had a limit
in lb/MMBTU of heat input; this is also not a useful metric, as all combustion devices will emit the same amount of CO2 for a given fuel input, regardless of efficiency. The stated lb/MMBTU limit is simply the default GHG emission factor for natural gas combustion.
For fugitive emissions, no GHG limits were specified. For process flares, several projects listed good combustion practices as GHG limits. One
project required analysis of root causes of malfunction events that caused emergency re-leases to the flares; this is considered a useful approach for the GCF.
Because of the limited value of this information, RBLC data will not be further detailed herein.
4.2 REGULATORY BASIS
In 2010, USEPA issued the GHG permitting rule officially known as the Prevention of Significant Deterioration and Title V Greenhouse Gas Tailoring Rule (GHG Tailoring Rule), in which USEPA determined that six GHG pollutants (collectively combined and measured as CO2e) were NSR-regulated pollutants and, therefore, subject to PSD permitting when new or modified projects emit-ted those pollutants in amounts exceeding certain threshold levels. Under the GHG Tailoring Rule, beginning July 1, 2011, new sources with a GHG PTE equal to or greater than 100,000 stpy of CO2e are considered a major source and required to undergo PSD permitting, including preparation of a BACT analysis for GHG emissions. Modifications to existing major sources (CO2e PTE of 100,000 stpy or greater) that result in an increase of CO2e greater than 75,000 stpy are similarly required to obtain a PSD permit, which includes a GHG BACT analysis.
In June 2014, the U.S. Supreme Court upheld USEPA’s authority to regulate GHG emissions via the Clean Air Act, including PSD permitting, but ruled that GHG emissions alone cannot trigger PSD. Thus, GHG BACT review is limited to only “anyway” sources, or those otherwise subject to PSD review for criteria pollutants. In a recent guidance memo (2014a), USEPA indicated their intent to continue application of GHG BACT requirements for anyway sources with GHG PTE of 75,000 stpy or greater.

Final Regulatory Review and BACT Analysis of the GCF
Deliverable No: 008-14-910-005 Date: October 8, 2014 Page 64 NOTICE – THIS DOCUMENT CONTAINS CONFIDENTIAL AND PROPRIETARY INFORMATION AND SHALL NOT BE DUPLICATED, DISTRIBUTED, DISCLOSED, SHARED OR USED FOR ANY PURPOSE EXCEPT AS MAY BE AUTHORIZED BY AGDC IN WRITING. THIS DOCUMENT IS UNCONTROLLED WHEN PRINTED. THIS COPY VALID ONLY AT THE TIME OF PRINTING
The GCF project is subject to PSD for criteria pollutants and will emit greater than 75,000 stpy of CO2e; therefore, is subject to PSD permitting for GHGs.
In September 2013, USEPA issued a new Proposed Carbon Pollution Standard for New Power Plants. Among other applicability conditions, the scope of this proposed rule is limited to facilities that deliver specified fractions of potential power output to the electrical grid. Thus, despite the power generation equipment at the GCF, the standard is not applicable to this project.
4.3 COMBUSTION SOURCES
Five categories of combustion sources were identified for the GCF:
1) Power generation gas turbines 2) Feed-gas compressor drive turbines 3) CO2 compressor drive turbines 4) Process heaters 5) Emergency generators
This section reviews options for each category.
4.3.1 Step 1 –Identify All Control Technologies
There are two basic alternatives for limiting GHG emissions from combustion equipment:
1) Carbon Capture and Storage (CCS) 2) Energy efficiency
AGDC has determined that gas-fired combustion turbines, for production of electricity and to drive compressors, and a gas-fired heater, for space and process heat, are the only alternatives that meet all of the project objectives. Other potentially lower-emitting electrical generation technologies, such as wind, solar, geothermal, hydroelectric, nuclear, and biomass-fueled plants, are either not technically feasible given the North Slope location or would be inadequate for operation of the GCF and would, therefore, change the fundamental business purpose of the project; thus, are out-side the scope of this BACT analysis.
This is consistent with USEPA’s 2011 PSD and Title V Permitting Guidance for Greenhouse Gases, which states:
EPA has recognized that a Step 1 list of options need not necessarily include in-herently lower polluting processes that would fundamentally redefine the nature of the source proposed by the permit applicant…”, and “…the permitting authority should keep in mind that BACT, in most cases, should not regulate the applicant’s purpose or objective for the proposed facility… (p. 26).

Final Regulatory Review and BACT Analysis of the GCF
Deliverable No: 008-14-910-005 Date: October 8, 2014 Page 65 NOTICE – THIS DOCUMENT CONTAINS CONFIDENTIAL AND PROPRIETARY INFORMATION AND SHALL NOT BE DUPLICATED, DISTRIBUTED, DISCLOSED, SHARED OR USED FOR ANY PURPOSE EXCEPT AS MAY BE AUTHORIZED BY AGDC IN WRITING. THIS DOCUMENT IS UNCONTROLLED WHEN PRINTED. THIS COPY VALID ONLY AT THE TIME OF PRINTING
Where produced energy is consumed by facilities owned or operated by other parties, as is the case with grid-connected electricity generation, the focus is on efficiency of the individual emissions unit. For facilities that use energy generated onsite, efficient use of that energy is also subject to BACT review. As stated in the USEPA PSD/Title V guidance (2011):
However, when reviewing a PSD permit application for the construction of a new facility that creates its own energy (thermal or electric) for its own use, USEPA recommends that permitting authorities consider technologies or processes that not only maximize the energy efficiency of the individual emitting units, but also process improvements that impact the facility’s energy utilization assuming it can be shown that efficiencies in energy use by the facility’s higher-energy-using equipment, processes or operations could lead to reductions in emissions from the facility.
Thus, energy efficiency options for reduction of GHG emissions can be further categorized into:
More efficient production of energy, including: Combined-cycle generation of electricity using gas-fired turbines
More efficient simple-cycle alternatives for production of electricity or mechanical energy using gas-fired turbines
More energy-efficient heaters or engines
More efficient use of electrical or mechanical energy
These options are reviewed in the subsequent sections.
Carbon Capture and Storage / Carbon Capture, Use, and Storage
CCS, where captured CO2 is injected into geologic formations, such as depleted O&G reservoirs, deep saline aquifers, depleted coal seams, and basalt formations, is more developed than Carbon Capture, Use, and Storage (CCUS). The “U” in CCUS refers to production of useful by-products from the captured CO2, but process development is still in infancy. No credible, commercially available options for production of beneficial by-products have been identified. Thus, this discus-sion will focus on CCS in the more classical sense, including Enhanced Oil Recovery (EOR), as opposed to production of other chemical products, or conversion and storage in the form of solid waste.
CCS involves at least four distinct steps, including capture of CO2 from exhaust gases or other streams, compression to supercritical temperature and pressure, transport (presumably via pipe-line), and subsurface injection/storage, as described in the following paragraphs.
Carbon Dioxide Capture and Compression
The capture of CO2 from industrial gas streams has occurred for decades using several processes to separate CO2 from other gases. These processes have been used in energy production and to
Final Regulatory Review and BACT Analysis of the GCF
Deliverable No: 008-14-910-005 Date: October 8, 2014 Page 66 NOTICE – THIS DOCUMENT CONTAINS CONFIDENTIAL AND PROPRIETARY INFORMATION AND SHALL NOT BE DUPLICATED, DISTRIBUTED, DISCLOSED, SHARED OR USED FOR ANY PURPOSE EXCEPT AS MAY BE AUTHORIZED BY AGDC IN WRITING. THIS DOCUMENT IS UNCONTROLLED WHEN PRINTED. THIS COPY VALID ONLY AT THE TIME OF PRINTING
produce food- and chemical-grade CO2. In the middle of the century, gas adsorption technologies were developed at refineries for hydrogen production (USDOE, 2010).
Three classes of technologies exist for carbon capture: pre-combustion, post-combustion, and oxy-combustion. Pre-combustion capture refers to a process in which a hydrocarbon fuel is gasified to form a synthetic mixture of hydrogen and CO. The CO is converted to CO2, using shift reactors, and captured before combusting the hydrogen-based fuel. Post-combustion capture technologies include sorbent adsorption, physical adsorption, and chemical absorption. Oxy-combustion tech-nology uses air separators to remove the nitrogen from combustion air so that the combustion prod-ucts are almost exclusively CO2, thereby reducing the volume of exhaust gases needed to be treated by the carbon capture system.
Pre-combustion CO2 capture technologies are currently not as mature as post-combustion capture technologies. Although improvement in the technology and reduction in cost of pre-combustion technologies is expected in 15 to 20 years, pre-combustion and oxyfuel CO2 capture technologies require a large degree of interaction with the process that generates the CO2 emissions. Therefore, despite the high energy consumption and resulting cost impacts for post-combustion-capture, over the short term, it will continue to be the preferred CO2 capture path for existing CO2 sources even with advances in pre-combustion or oxyfuel technology (BEST, undated). Projects shown in the U.S. Department of Energy (DOE) National Energy Technology Laboratory’s (NETL’s) database (2013) also confirms that most process development and research has been conducted on the post-combustion technology. Oxy-combustion capture is still under development and is not currently commercial (Congressional Research Service, 2013b). Due to this, it is assumed that post-combus-tion capture is the option most likely to be feasible for CO2 from the GCF combustion sources.
The post-combustion capture of CO2 from gas streams can be accomplished using either physical or chemical solvents or solid sorbents to separate and capture CO2 from the flue gas, with subse-quent desorption to produce a concentrated CO2 stream. Applicability of different processes to par-ticular applications will depend on temperature, pressure, CO2 concentration, and contaminants in the gas or exhaust stream. Although CO2 separation processes have been used for years in the O&G industry, the characteristics of the gas streams are markedly different than power plant exhaust; such differences include temperature, pressure, CO2 concentrations, and chemical makeup of the other gas components. Thus, the processes that could be used for post-combustion CO2 capture are different than those proposed for separation of CO2 from raw gas at the GCF. CO2 separation from power plant exhaust has been demonstrated in large pilot-scale tests, but has not been implemented in full-scale power plant applications anywhere in the world.
After separation, the CO2 must be compressed to supercritical temperature and pressure for suitable pipeline transport and geological storage properties. The supercritical temperature and pressure is a state in which CO2 exists neither as a liquid nor a gas; instead, it has physical properties of both liquids and gases. Compressor systems for such applications are proven and commercially availa-ble; however, specialized equipment is required, and energy requirements are very high.
Final Regulatory Review and BACT Analysis of the GCF
Deliverable No: 008-14-910-005 Date: October 8, 2014 Page 67 NOTICE – THIS DOCUMENT CONTAINS CONFIDENTIAL AND PROPRIETARY INFORMATION AND SHALL NOT BE DUPLICATED, DISTRIBUTED, DISCLOSED, SHARED OR USED FOR ANY PURPOSE EXCEPT AS MAY BE AUTHORIZED BY AGDC IN WRITING. THIS DOCUMENT IS UNCONTROLLED WHEN PRINTED. THIS COPY VALID ONLY AT THE TIME OF PRINTING
Carbon Dioxide Transport
After capture and compression, the supercritical CO2 is transported to an appropriate location for underground injection into a suitable geological storage reservoir, such as a deep saline aquifer or depleted coal seam, used for enhanced oil or natural gas recovery, or disposed via ocean sequestra-tion. The transport options may include pipeline or truck transport, or in the case of ocean storage, transport by ocean-going vessels.
Because of the extremely high pressures, as well as the unique thermodynamic and dense-phase fluid properties of supercritical CO2, specialized designs are required for CO2 pipelines. Control of potential propagation fractures and corrosion also require careful attention to contaminants, such as O2, N2, CH4, H2O, and H2S.
Carbon Dioxide Storage
Potential CO2 storage methods include geological sequestration, oceanic storage, and mineral car-bonation, as detailed further in the following paragraphs.
Geological Sequestration
Geological sequestration is the process of injecting captured CO2 into deep subsurface rock for-mations for long-term storage, which includes injection into a deep saline aquifer, depleted/un-mineable coal seams, and basalt/organic shale formations, or in depleted petroleum reservoirs for EOR in crude oil production operations.
In general, under geological sequestration, a suitable geological formation is identified close to the proposed project, and the captured CO2 from the process is compressed and transported to the se-questration location. CO2 is injected into that formation at a high pressure and to depths generally greater than 2,625 feet. Below this depth, the pressurized CO2 remains supercritical and behaves like a liquid. Supercritical CO2 is denser and takes up less space than gaseous CO2. Once injected, the CO2 occupies pore spaces in the surrounding rock, like water in a sponge. Saline water that already resides in the pore space is displaced by the denser CO2. Over time, the CO2 can dissolve in residual water, and chemical reactions between the dissolved CO2 and rock can create solid car-bonate minerals, more permanently trapping the CO2.
With respect to EOR, when CO2 is injected, it raises the reservoir pressure and decreases the density and viscosity of crude oil, making it easier for the oil to flow towards producing wells. It uses pore space that otherwise would remain unavailable, and allows for the recovery and sale of additional oil that would otherwise remain trapped in the reservoir; the CO2 is, thus, assumed to typically have an economic value for EOR applications that, in turn, lowers the net cost of CO2 storage (NACAP, 2011).
AGDC has not been able to identify an underground facility willing or able to accept the CO2 emissions from combustion sources. The Point Thompson PSD application indicates that the Point Thompson field is unsuitable for EOR (ExxonMobil, 2011). Furthermore, as detailed further herein, the USDOE NETL identifies no suitable deep saline aquifers in the North Slope area, and although

Final Regulatory Review and BACT Analysis of the GCF
Deliverable No: 008-14-910-005 Date: October 8, 2014 Page 68 NOTICE – THIS DOCUMENT CONTAINS CONFIDENTIAL AND PROPRIETARY INFORMATION AND SHALL NOT BE DUPLICATED, DISTRIBUTED, DISCLOSED, SHARED OR USED FOR ANY PURPOSE EXCEPT AS MAY BE AUTHORIZED BY AGDC IN WRITING. THIS DOCUMENT IS UNCONTROLLED WHEN PRINTED. THIS COPY VALID ONLY AT THE TIME OF PRINTING
shale formations exist in the North Slope area, there are many uncertainties regarding storage po-tential at this time. Thus, the only potential geological storage option available for the GCF is un-mineable coal seams.
Oceanic Storage
Ocean sequestration has been theorized as a possible means of sequestering combustion CO2. Var-ious methods, including droplet plumes, dense plumes, dry ice, towed pipe, and deep ‘CO2 lakes’, have been included in these discussions. The variations pertain to different methods of introducing CO2 to the waterbody through deep or shallow release, intent to maintain the CO2 as a separate liquid phase versus dispersing it into seawater, and intent for dense-phase CO2 to rise or sink in the water.
Mineral Carbonation
Mineral carbonation involves converting CO2 to solid, inorganic carbonates via chemical reactions, such as limestone (Calcium Carbonate [CaCO3]). Although this process occurs naturally and takes place over thousands or millions of years, the process can be accelerated by reacting a high con-centration of CO2 with minerals found in large quantities on the Earth’s surface, such as olivine or serpentine (Congressional Research Service, 2013a).
Generation Efficiency
Because the CO2 emissions from a combustion source are directly proportional to the quantity of fuel burned, a practical approach for minimizing GHG emissions is to produce the required energy as efficiently as possible.
For the combustion turbines used for the production of electricity, combined-cycle systems, other heat recovery, and simple-cycle systems are potential options. For turbines used for mechanical drive of other equipment, such as that for the feed-gas compressors, options are limited to heat recovery and efficient, simple-cycle systems. For fired heaters and reciprocating engines, options are limited to maximizing the combustion efficiency of the unit.
Combined Cycle/Heat Recovery
A combined-cycle system uses the waste heat from combustion turbine exhaust to produce steam to drive a Steam Turbine Generator (STG). The additional power produced by the STG does not require additional fuel-gas consumption; although, in some cases, duct burners consume fuel to produce additional heat downstream of the combustion turbine to produce additional steam for additional power production. Thus, power can be produced at a lower heat rate (a measure of the amount of fuel used to produce a unit of electrical energy) and lower GHG emissions. In addition to the STG, to complete the system, a Heat Recovery Steam Generator (HRSG), condenser, water treatment systems, and other equipment are required.
Relevant disadvantages for combined cycle include the need for production of high-quality makeup water and disposal of wastewater, higher labor requirements, larger footprint, risk of freezing in

Final Regulatory Review and BACT Analysis of the GCF
Deliverable No: 008-14-910-005 Date: October 8, 2014 Page 69 NOTICE – THIS DOCUMENT CONTAINS CONFIDENTIAL AND PROPRIETARY INFORMATION AND SHALL NOT BE DUPLICATED, DISTRIBUTED, DISCLOSED, SHARED OR USED FOR ANY PURPOSE EXCEPT AS MAY BE AUTHORIZED BY AGDC IN WRITING. THIS DOCUMENT IS UNCONTROLLED WHEN PRINTED. THIS COPY VALID ONLY AT THE TIME OF PRINTING
the arctic environmental, potential reduction to system availability and reliability, and higher maintenance costs.
Simple Cycle
Simple-cycle systems generally refer to electrical production using only a combustion turbine cou-pled to an electrical generator, without production of additional electricity by an STG using waste heat. For the purposes of this BACT, the mechanical drive combustion turbines without heat re-covery will also be referred to as simple cycle. Combustion turbines vary in thermal efficiency, and the efficiency of all turbines are highly dependent on load, generally decreasing gradually as load is reduced from the 100 to 75 percent range, and decreasing dramatically at 50 percent or lower loads.
Heat Recovery
A waste-heat recovery unit is a heat exchanger that recovers energy from hot gas or liquid flows, such as gas turbine exhaust. Waste-heat recovery has a fairly low dollar per kilowatt cost due to its simple and flexible operation. A disadvantage is that the process pairs electric generation and pro-cess heat production; thus, if thermal energy could be required when electrical energy is not, re-dundant systems may be necessary.
Heat recovery is generally not a practical alternative for heaters and reciprocating engines, as the exhaust flows are lower and have a lower temperature than for combustion turbines.
Utilization Efficiency
As noted, the quantity of CO2 produced from a combustion source is directly proportional to the quantity of fuel burned. In most devices, nearly 100 percent of the fuel is burned, thus, producing CO2 from almost all carbon in that fuel. As with generation efficiency, reducing the electricity, thermal, or mechanical energy required for an operation will reduce the amount of fuel needed to produce that energy. Thus, if the produced energy can be used more efficiently, less fuel is con-sumed, and less CO2 is emitted.
4.3.2 Step 2 – Eliminate Technically Infeasible Options
Carbon Capture and Storage/Carbon Capture, Use, and Storage
A number of vendors are developing post-combustion carbon capture technologies, including solid-phase adsorption processes, liquid absorption processes, and membrane separation. Various ven-dors have commercial offerings, and performance guarantees are available. However, there are very few commercial-scale facilities that have implemented CCS, as detailed further in this section.
The Interagency Task Force on Carbon Capture and Storage consists of 14 executive departments and federal agencies, co-chaired by the USDOE and USEPA. In their August 2010 Report of the Interagency Task Force on Carbon Capture and Storage (USDOE), the task force discusses four currently operating post-combustion CO2 capture systems associated with power production. All
Final Regulatory Review and BACT Analysis of the GCF
Deliverable No: 008-14-910-005 Date: October 8, 2014 Page 70 NOTICE – THIS DOCUMENT CONTAINS CONFIDENTIAL AND PROPRIETARY INFORMATION AND SHALL NOT BE DUPLICATED, DISTRIBUTED, DISCLOSED, SHARED OR USED FOR ANY PURPOSE EXCEPT AS MAY BE AUTHORIZED BY AGDC IN WRITING. THIS DOCUMENT IS UNCONTROLLED WHEN PRINTED. THIS COPY VALID ONLY AT THE TIME OF PRINTING
four are on coal-based power plants where CO2 concentrations are higher (typically, 12 to 15 per-cent), with none noted for natural gas-based power plants (typically, 3 to 5 percent).
As also detailed in the August 2010 report, one goal of the task force is to bring 5 to 10 commercial demonstration projects online by 2016; the lack of experience with demonstration projects indicates that the technology is not currently commercially available at the scale necessary to operate at the GCF. It is notable that several projects, including those with USDOE funding or loan guarantees, were cancelled in 2011, making it further unlikely that technical information required to scale up these processes can be accomplished in the near future. For example, the American Electric Power (AEP) Mountaineer site (a former USDOE demonstration commercial-scale project) was to expand capture capacity to 100,000 metric tons per year (mtpy). However, to date, only the Project Vali-dation Facility has been completed, and it only accomplished capture of a total of 50,000 metric tons and storage of 37,000 metric tons of CO2. AEP also announced that the larger project will be cancelled after completion of the front-end engineering design because of uncertain economic and policy conditions.
The USDOE NETL is one of the leaders in the nation’s efforts to realize commercial deployment of CCS technology. A downloadable database of worldwide CCS projects is available, called NETL’s Carbon Capture, Utilization, & Storage Database - Ver 4 (2013). Filtering this database for projects that involve both capture and storage, which are based on post-combustion capture technology, and are shown as “active” with “injection ongoing” or “plant in operation,” yields six projects. Five of the six projects have a capacity of only 25 to 400 metric tons per day (mtpd). The sixth project sequestered a total of approximately 200,000 metric tons. Post-combustion CCS has not been accomplished on a scale of the proposed GCF, which could produce up to 976,000 stpy (885,000 mtpy) or 2,670 short tons per day (stpd) (2,420 mtpd). Furthermore, scale-up involving a substantial increase in size from pilot scale to commercial scale is unusual in chemical process development and presents a significant technical risk.
In addition, the majority of carbon capture demonstration projects accomplished or planned are for coal-fired combustion exhaust. Even less experience exists for natural gas-fired facilities, and ad-ditional technical challenges result from the higher exhaust temperatures and lower CO2 concentra-tions from natural gas combustion.
Another important aspect regarding BACT feasibility is that few, if any, vendors have integrated the capture, compression, transport, and geological storage into one commercial package. Any en-tity wishing to implement CCS on a full-scale basis faces significant technical, legal, economic, and liability risks from integration of the different steps; in large part, due to the major uncertainties regarding design of the geological storage.
For technologies to be considered technically feasible within the BACT process, they must be com-mercially available. While capture systems are commercially available, if not demonstrated full-scale, integrated capture, compression, transport, and storage systems are not available as a package with guaranteed performance. Considerable research and development are needed to design geo-logical storage systems at this time.
Final Regulatory Review and BACT Analysis of the GCF
Deliverable No: 008-14-910-005 Date: October 8, 2014 Page 71 NOTICE – THIS DOCUMENT CONTAINS CONFIDENTIAL AND PROPRIETARY INFORMATION AND SHALL NOT BE DUPLICATED, DISTRIBUTED, DISCLOSED, SHARED OR USED FOR ANY PURPOSE EXCEPT AS MAY BE AUTHORIZED BY AGDC IN WRITING. THIS DOCUMENT IS UNCONTROLLED WHEN PRINTED. THIS COPY VALID ONLY AT THE TIME OF PRINTING
More specifics on the technical feasibility and commercial availability of the various methods of sequestration is presented in the following paragraphs.
Geological Sequestration
The USDOE NETL, via the West Coast Regional Carbon Sequestration Partnership (WESTCARB), researched potential geological storage locations, including those on the North Slope. This information was presented in The 2012 United States Carbon Utilization and Storage Atlas, fourth edition (referred to herein as the 2012 WESTCARB Atlas) (USDOE, 2012), The North American Carbon Storage Atlas (NACAP, 2011), and NETL’s National Carbon Sequestration Da-tabase and Geographic Information System (NATCARB), called the NATCARB/ATLAS (USDOE, undated).
According to the 2012 WESTCARB Atlas, in Alaska, the hydrocarbon reservoirs of the North Slope (and Cook Inlet) are of interest to researchers because of their proximity to large, stationary CO2 sources and the potential for CO2 (USDOE, 2012).
Technical feasibility of various methods of geological sequestration, including EOR, as well as the use of a depleted/unmineable coal seams, basalt, shale formations, and deep saline aquifers, is de-tailed further in the following paragraphs.
Enhanced Oil Recovery
The use of CO2 for EOR eliminates some of the uncertainties discussed with respect to CCS. In North America, CO2 has been injected into oil reservoirs to increase oil recovery for more than 30 years (NACAP, 2011). O&G companies have the capability to evaluate the feasibility and design CO2 flood processes for suitable reservoirs, and to design the required aboveground systems.
In addition, EOR is already occurring at the existing Prudhoe Bay Central Gas Facility (CGF) (ap-proximately 4,250 feet away from the proposed GCF). Specifically, a portion of the NGLs is mixed with dry gas (CH4) to create Miscible Injectant (MI) for EOR. Some of the NGL stream is routed to Kuparuk where it is converted to MI, as well. The MI is injected back into selected areas of the oil reservoir, as it acts as a solvent, allowing more oil to move through the reservoir to the producing wells. MI and water are injected into the reservoir alternately in repeated cycles to push the oil through the formation. The use of MI has increased daily oil recovery by approximately 90,000 bar-rels (BP plc, 2011).
PBU intends to receive and inject CO2 separated from the raw gas supplied from PBU to AGDC, although it is not clear at this time if it would be mixed with the MI or otherwise used for EOR purposes. Furthermore, as noted, PBU has indicated that they are unwilling or unable to accept CO2
separated from combustion exhaust, and according to the Point Thompson PSD application (Exx-onMobil, 2011), the Point Thompson field is not suitable for EOR. Therefore, due to lack of suitable CO2-flood EOR opportunities in the vicinity, use of CO2 for EOR is not a technically feasible BACT option for the GCF.
Final Regulatory Review and BACT Analysis of the GCF
Deliverable No: 008-14-910-005 Date: October 8, 2014 Page 72 NOTICE – THIS DOCUMENT CONTAINS CONFIDENTIAL AND PROPRIETARY INFORMATION AND SHALL NOT BE DUPLICATED, DISTRIBUTED, DISCLOSED, SHARED OR USED FOR ANY PURPOSE EXCEPT AS MAY BE AUTHORIZED BY AGDC IN WRITING. THIS DOCUMENT IS UNCONTROLLED WHEN PRINTED. THIS COPY VALID ONLY AT THE TIME OF PRINTING
Unmineable Coal Seams
Coal resources that are unmineable using current technology are those where the coal beds are too deep or not thick enough, or whose structural integrity is inadequate for mining.
Coal beds are typically permeable and can trap gases, such as CH4 (and other gases), which are adsorbed (physically bound) to the coal. CO2 binds more tightly to coal than CH4, thus will be adsorbed even though CH4 is already present in the formation. CO2 injected into permeable coal seams is adsorbed onto the coal, and remains there provided the coal is not mined. During this process, CH4 is displaced, which could be recovered by wells and brought to the surface to be used as a fuel source, providing a source of revenue to offset the costs of CO2 injection. This CH4 is referred to as coal-bed CH4. Since CO2 binds more tightly to coal than CH4, capturing the CH4 in this regard yields a higher rate of CH4 extraction as compared to traditional depressurization meth-ods used to extract coal-bed CH4. In addition, during this process, the coal seam is depressurized, which allows an additional 50 percent more CO2 to be stored in the coal (ICO2N, undated). Coal can also adsorb about twice as much CO2 by volume as CH4, so if the recovered CH4 is combusted, and the resulting CO2 is re-injected, the coal bed can still provide net storage of CO2 (ICO2N, un-dated).
According to the 2012 WESTCARB Atlas (USDOE, 2012), although coal mining in Alaska has been limited, the state contains major coal deposits that range from shallow to more than 6,500 feet deep. Alaska’s coal-bed CH4 resources are comparable to the coal-bed CH4 resources in all of the Lower Continental 48 U.S. States (Lower 48) (estimated to be approximately 777 trillion cubic feet). Only a portion of the state’s coal resource is considered favorable for CO2 storage due to site-specific conditions, including coal quality, permeability, surface access, seam geometry, perma-frost, faulting, and depositional environment. The coal-seam CO2 storage opportunities of the high-est potential lie in unmineable coal beds in the North Slope (and Cook Inlet) region(s), which are accessible and have coal of suitable permeability, depth, and thickness. Preliminary estimates re-veal a geological CO2 storage resource of approximately 26 billion short tons in these coal seams.
However, without ongoing commercial experience, storing CO2 in coal seams has significant un-certainties compared to deep saline formations and O&G storage options (2013). According to the Integrated CO2 Network (ICO2N) and the CO2 Capture Project (ICO2N, undated), there is only one CO2-enhanced coal-bed CH4 project in the U.S., the Allison project in New Mexico. Under this project, more than 100,000 metric tons of CO2 have been captured over a 3-year period.
Basalt Formations and Organic Shale Formations
Basalt formations have a unique chemical makeup that could potentially convert injected CO2 into a solid mineral form, thus isolating it from the atmosphere permanently. Organic-rich shales are another geological storage option. Shales are rock layers with extremely low permeability in a ver-tical direction.
According to the 2012 North American Carbon Storage Atlas (NACAP, 2011), shale formations exist in the North Slope. However, the Atlas also noted that before these formations can be consid-ered viable storage targets, questions relating to the basic geology, the CO2 trapping mechanisms
Final Regulatory Review and BACT Analysis of the GCF
Deliverable No: 008-14-910-005 Date: October 8, 2014 Page 73 NOTICE – THIS DOCUMENT CONTAINS CONFIDENTIAL AND PROPRIETARY INFORMATION AND SHALL NOT BE DUPLICATED, DISTRIBUTED, DISCLOSED, SHARED OR USED FOR ANY PURPOSE EXCEPT AS MAY BE AUTHORIZED BY AGDC IN WRITING. THIS DOCUMENT IS UNCONTROLLED WHEN PRINTED. THIS COPY VALID ONLY AT THE TIME OF PRINTING
and their kinetics, and monitoring and modeling tools need to be addressed. As such, no CO2 stor-age resource estimates for basalt formations or organic-rich shale basins are currently available.
Deep Saline Reservoirs
Some rocks in sedimentary basins contain brines or brackish water that are unsuitable for drinking or agriculture; these are known as deep saline reservoirs. These reservoirs can be found onshore and offshore, and are often part of O&G reservoirs; therefore, they share many characteristics. Saline reservoirs have potentially the largest reservoir capacity of the three types of geologic for-mations.
The technology required to inject into deep saline aquifers as an alternative to EOR reservoirs is a major focus of the NETL research program. Although it is believed that saline aquifers are a viable opportunity, there are many uncertainties. Risk of mobilization of natural elements, such as man-ganese, cobalt, nickel, iron, uranium, and barium into potable aquifers, is of concern. Technical considerations for site selection include geological siting, monitoring and verification programs, post-injection site care, long-term stewardship, property rights, and other issues.
In addition, neither the 2012 WESTCARB Atlas (USDOE, 2012) nor the 2012 North American Carbon Storage Atlas (NACAP, 2011) showed saline formations in the North Slope.
Oceanic Storage
The effectiveness of ocean sequestration as a full-scale method for CO2 capture and storage is un-clear given the limited availability of injection pilot tests and the ecological impacts to shallow and deep ocean ecosystems. Through NETL, research is being conducted by the Monterey Bay Aquar-ium Research Institute on the behavior of CO2 hydrates and dispersion of these hydrates within the various depth horizons of the marine environment; however, the experiments are small in scale, and the results may not be applicable to larger-scale injection projects in the near future. Long-term effects on the marine environment, including pH excursions, are ongoing, making the use of ocean sequestration technically infeasible at the current time. The feasibility of implementing a commer-cially available sequestration approach is further brought into question, with the Intergovernmental Panel on Climate Change (IPCC) stating:
Ocean storage, however, is in the research phase and will not retain CO2 permanently as the CO2 will re-equilibrate with the atmosphere over the course of several centuries…Be-fore the option of ocean injection can be deployed, significant research is needed into its potential biological impacts to clarify the nature and scope of environmental conse-quences, especially in the longer term…Clarification of the nature and scope of long-term environmental consequences of ocean storage requires further research. (IPCC, 2005).
Questions may also arise regarding the international legal implications of injecting industrial-gen-erated CO2 into the ocean, which may eventually migrate to other international waters. Further-more, there has been no research on oceanic storage in arctic environments.
Final Regulatory Review and BACT Analysis of the GCF
Deliverable No: 008-14-910-005 Date: October 8, 2014 Page 74 NOTICE – THIS DOCUMENT CONTAINS CONFIDENTIAL AND PROPRIETARY INFORMATION AND SHALL NOT BE DUPLICATED, DISTRIBUTED, DISCLOSED, SHARED OR USED FOR ANY PURPOSE EXCEPT AS MAY BE AUTHORIZED BY AGDC IN WRITING. THIS DOCUMENT IS UNCONTROLLED WHEN PRINTED. THIS COPY VALID ONLY AT THE TIME OF PRINTING
Mineral Carbonation
The advantage of mineral carbonation is that the carbon can be stored without risk of releasing carbon to the atmosphere over geological time scales. Mineral carbonation is well-understood and can be applied at small scales, but is at an early phase of development as a technique for sequester-ing large amounts of captured CO2 (Congressional Research Service, 2013a).
Carbon Capture and Storage Technical Feasibility Summary
Many believe that CCS will allow the future use of fossil fuels while minimizing GHG emissions, and research on CCS is ongoing. However, there are currently a number of major technical barriers and legal uncertainties concerning the use of CCS that present hurdles and eliminate it as a viable BACT option, which can be summarized as follows:
No full-scale/commercial systems for carbon capture are currently in operation to capture CO2 from dilute combustion exhaust steams.
Because of the developmental nature of CCS technology, vendors and contractors do not provide turnkey offerings; separate contracting would be required for: Capture system design and construction
Compression and pipeline system routing, siting, and licensing; engineering; and construction
Geological storage system design, deployment, operations, and monitoring.
Because no individual facility could be expected to take on all of these requirements to implement a control technology, this technology as a whole is not yet commercially avail-able.
The geological storage assessment will require the engineering expertise of AGDC or the Owner’s Engineer, which is not a reasonable expectation at this time, given the current stage of CCS technology.
Significant legal uncertainties continue to exist regarding the relationship between land surface ownership rights and subsurface (pore space) ownership, and potential conflicts with other uses of land, such as exploitation of mineral rights, and management of risks and liabilities.
Use of captured CO2 for EOR is widely believed to represent the practical first opportunity for CCS deployment. O&G production and EOR is occurring at the CGF; however, no parties willing to accept GCF combustion exhaust have been identified in the region.
Little experience exists with other types of storage systems, or they are not available on the North Slope, as detailed herein. The storage option considered most viable on the North Slope, following EOR, includes unmineable coal seams; however, very little practical ex-perience with CO2 storage in such systems has been accomplished.
We, therefore, conclude that CCS is not yet technically feasible. However, based on precedents set by USEPA and state agencies on other projects, CCS with injection into unmineable coal seams is, nonetheless, being carried forward for assessment of economic feasibility in Step 4.
Final Regulatory Review and BACT Analysis of the GCF
Deliverable No: 008-14-910-005 Date: October 8, 2014 Page 75 NOTICE – THIS DOCUMENT CONTAINS CONFIDENTIAL AND PROPRIETARY INFORMATION AND SHALL NOT BE DUPLICATED, DISTRIBUTED, DISCLOSED, SHARED OR USED FOR ANY PURPOSE EXCEPT AS MAY BE AUTHORIZED BY AGDC IN WRITING. THIS DOCUMENT IS UNCONTROLLED WHEN PRINTED. THIS COPY VALID ONLY AT THE TIME OF PRINTING
Generation Efficiency
As noted, use of combined-cycle systems, efficient combustion turbines and other combustion de-vices, and other heat-recovery systems are potentially applicable options for GHG BACT. These are reviewed for each combustion device in this section.
Power Generation Turbines
Combined Cycle
Simple-cycle GE LM2500+PR turbines are representative of possible choices of power generation turbines for the GCF. Based on information provided in 2014 Performance Specs, 30th Edition (Gas Turbine World, 2014), the efficiency for a GE LM2500+ PR running in simple-cycle mode is 38.5 percent; at full load and “ISO conditions,” or the ambient conditions and other operating parameters specified by International Organization for Standardization (ISO) specification 3977-2, Gas tur-bines – Procurement – Part 2 (1997). The same unit running in combined cycle is only approxi-mately 12 percent more efficient. The increase in efficiency may not be enough to offset the high costs of purchasing and maintaining a combined-cycle unit on the North Slope. As such, the project also compared the efficiency of the potential power generation turbine to other similarly sized sim-ple-cycle units.
Combined-cycle technology is a technically feasible option to reduce GHG emissions from the power generation turbines.
Simple Cycle
As noted herein, GE LM2500+PR is being used as representative for the power generation turbines. Using information provided in 2014 Performance Specs, 30th Edition (Gas Turbine World, 2014), and by looking at units with similar-sized production, the comparison in Table 13 was developed.
Table 13 lists comparable combustion turbine manufacturers and a comparison of estimated per-formance efficiency. The LM2500+PR full-load combustion turbine efficiency is comparable to that of the majority of other combustion turbines in this size range. Therefore, it is concluded that meaningful GHG emission reductions cannot be achieved through alternative turbine selection, and the GE LM2500+PR, as a representative turbine, will be carried forward in the analysis.
Table 13. Combustion Turbine Comparison
TURBINEa PRODUCTION
(kW) HEAT RATE (BTU/kWh) EFFICIENCY
Dresser-Rand (50/60 Hz) Vectra 40G 30,460 8,780 38.9%
Vectra 40G4 33,209 8,737 39.1%
Dresser-Rand (60 Hz) DR-61GP 30,742 8,821 38.7%
DR-61G4 33,175 8,811 38.7%
GE Energy Aeorderivative (60 Hz)

Final Regulatory Review and BACT Analysis of the GCF
Deliverable No: 008-14-910-005 Date: October 8, 2014 Page 76 NOTICE – THIS DOCUMENT CONTAINS CONFIDENTIAL AND PROPRIETARY INFORMATION AND SHALL NOT BE DUPLICATED, DISTRIBUTED, DISCLOSED, SHARED OR USED FOR ANY PURPOSE EXCEPT AS MAY BE AUTHORIZED BY AGDC IN WRITING. THIS DOCUMENT IS UNCONTROLLED WHEN PRINTED. THIS COPY VALID ONLY AT THE TIME OF PRINTING
TURBINEa PRODUCTION
(kW) HEAT RATE (BTU/kWh) EFFICIENCY
LM2500PK 30,982 9,287 36.7%
LM2500PRb 30,464 8,854 38.5% LM2500+ RD 33,156 8,774 38.9%
GE Energy Oil & Gas (50/60 Hz) PGT25+ 30,226 8,610 39.6%
PGT25+G4 33,057 8,530 40.0%
GE Energy Oil & Gas (Frame units) MS5002E 31,100 9,748 35.0%
IHI Power Systems (50/60 Hz) LM2500RB 31,970 8,720 39.2%
IHI Power Systems (60 Hz) LM2500PK 28,500 8,660 39.4%
LM2500PR 30,530 8,835 38.6%
LM2500RD 32,941 8,826 38.7%
Kawasaki Heavy Industries L30A 30,120 8,502 40.1%
Mitsubishi Hitachi Power Systems (50/60 Hz) H-25(32) 32,300 9,802 34.8%
MTU Friedrichshafen LM2500+ (PR) 31,154 8,658 39.4%
LM2500+G4 (RD) 33,613 8,650 39.4%
Pratt & Whitney Power Systems SwiftPac 30 30,850 9,260 36.8%
Rolls-Royce (50/60 Hz) RB211-G62 DLE 29,845 9,089 37.5%
RB211-G62 DLE 32,130 8,681 39.3%
Siemens Energy (50/60 Hz) SGT-700 32,820 9,170 37.2%
a Specifications for production output at 59ºF sea level ISO conditions
b Currently Selected Turbine
BTU/kWH - British thermal unit per kilowatt-hour
Hz - hertz
kW – kilowatt
Heat Recovery
Waste-heat recovery is often incorporated in plant design to decrease fuel consumption and opti-mize the total life-cycle cost of a project. There are various types of heat-recovery systems that could be applicable to the ASAP project. A heat-recovery system could displace load on the heater but will not improve efficiency of the power production or compressor drive, although it is still a technically feasible technology to consider.
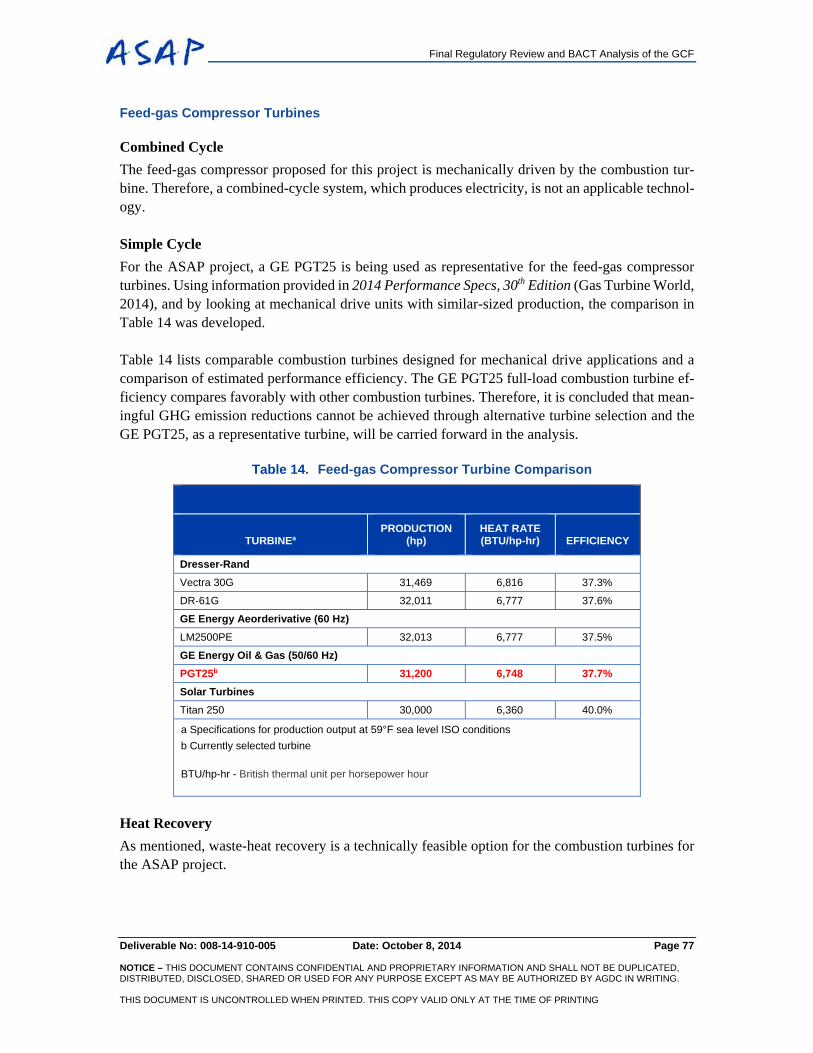
Final Regulatory Review and BACT Analysis of the GCF
Deliverable No: 008-14-910-005 Date: October 8, 2014 Page 77 NOTICE – THIS DOCUMENT CONTAINS CONFIDENTIAL AND PROPRIETARY INFORMATION AND SHALL NOT BE DUPLICATED, DISTRIBUTED, DISCLOSED, SHARED OR USED FOR ANY PURPOSE EXCEPT AS MAY BE AUTHORIZED BY AGDC IN WRITING. THIS DOCUMENT IS UNCONTROLLED WHEN PRINTED. THIS COPY VALID ONLY AT THE TIME OF PRINTING
Feed-gas Compressor Turbines
Combined Cycle
The feed-gas compressor proposed for this project is mechanically driven by the combustion tur-bine. Therefore, a combined-cycle system, which produces electricity, is not an applicable technol-ogy.
Simple Cycle
For the ASAP project, a GE PGT25 is being used as representative for the feed-gas compressor turbines. Using information provided in 2014 Performance Specs, 30th Edition (Gas Turbine World, 2014), and by looking at mechanical drive units with similar-sized production, the comparison in Table 14 was developed.
Table 14 lists comparable combustion turbines designed for mechanical drive applications and a comparison of estimated performance efficiency. The GE PGT25 full-load combustion turbine ef-ficiency compares favorably with other combustion turbines. Therefore, it is concluded that mean-ingful GHG emission reductions cannot be achieved through alternative turbine selection and the GE PGT25, as a representative turbine, will be carried forward in the analysis.
Table 14. Feed-gas Compressor Turbine Comparison
TURBINEa PRODUCTION
(hp) HEAT RATE (BTU/hp-hr) EFFICIENCY
Dresser-Rand Vectra 30G 31,469 6,816 37.3%
DR-61G 32,011 6,777 37.6%
GE Energy Aeorderivative (60 Hz) LM2500PE 32,013 6,777 37.5%
GE Energy Oil & Gas (50/60 Hz) PGT25b 31,200 6,748 37.7% Solar Turbines Titan 250 30,000 6,360 40.0%
a Specifications for production output at 59°F sea level ISO conditions
b Currently selected turbine
BTU/hp-hr - British thermal unit per horsepower hour
Heat Recovery
As mentioned, waste-heat recovery is a technically feasible option for the combustion turbines for the ASAP project.
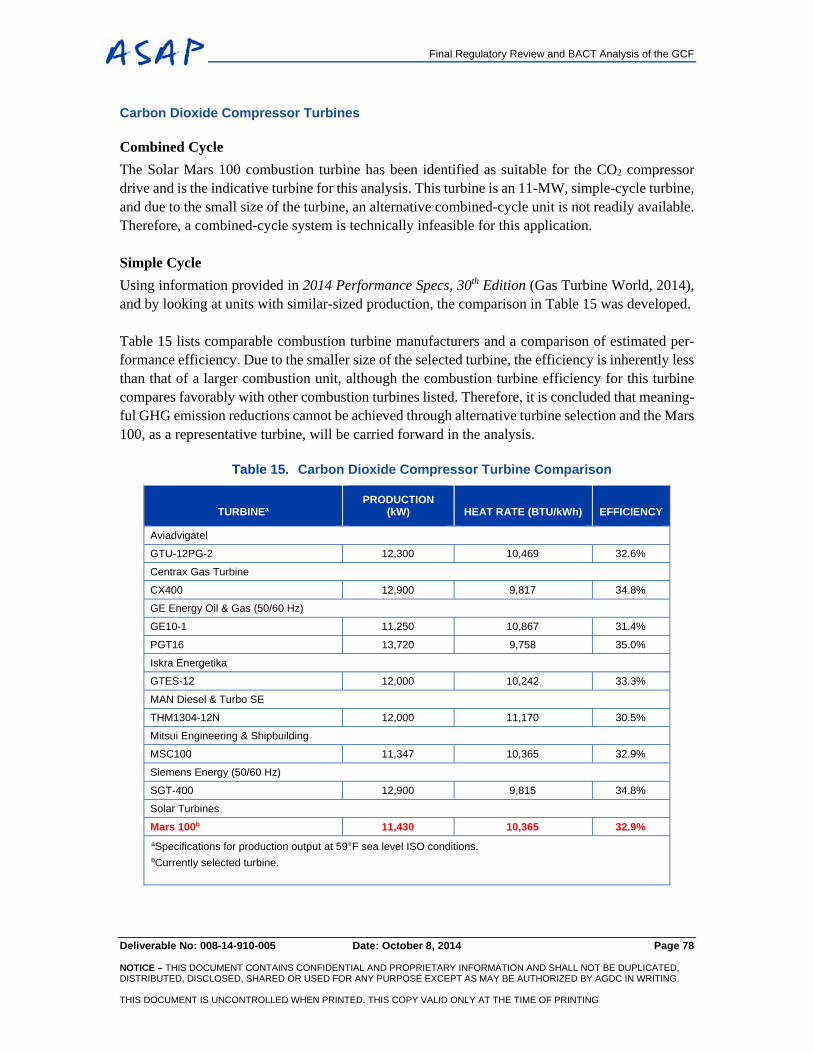
Final Regulatory Review and BACT Analysis of the GCF
Deliverable No: 008-14-910-005 Date: October 8, 2014 Page 78 NOTICE – THIS DOCUMENT CONTAINS CONFIDENTIAL AND PROPRIETARY INFORMATION AND SHALL NOT BE DUPLICATED, DISTRIBUTED, DISCLOSED, SHARED OR USED FOR ANY PURPOSE EXCEPT AS MAY BE AUTHORIZED BY AGDC IN WRITING. THIS DOCUMENT IS UNCONTROLLED WHEN PRINTED. THIS COPY VALID ONLY AT THE TIME OF PRINTING
Carbon Dioxide Compressor Turbines
Combined Cycle
The Solar Mars 100 combustion turbine has been identified as suitable for the CO2 compressor drive and is the indicative turbine for this analysis. This turbine is an 11-MW, simple-cycle turbine, and due to the small size of the turbine, an alternative combined-cycle unit is not readily available. Therefore, a combined-cycle system is technically infeasible for this application.
Simple Cycle
Using information provided in 2014 Performance Specs, 30th Edition (Gas Turbine World, 2014), and by looking at units with similar-sized production, the comparison in Table 15 was developed.
Table 15 lists comparable combustion turbine manufacturers and a comparison of estimated per-formance efficiency. Due to the smaller size of the selected turbine, the efficiency is inherently less than that of a larger combustion unit, although the combustion turbine efficiency for this turbine compares favorably with other combustion turbines listed. Therefore, it is concluded that meaning-ful GHG emission reductions cannot be achieved through alternative turbine selection and the Mars 100, as a representative turbine, will be carried forward in the analysis.
Table 15. Carbon Dioxide Compressor Turbine Comparison
TURBINEa PRODUCTION
(kW) HEAT RATE (BTU/kWh) EFFICIENCY
Aviadvigatel
GTU-12PG-2 12,300 10,469 32.6%
Centrax Gas Turbine
CX400 12,900 9,817 34.8%
GE Energy Oil & Gas (50/60 Hz)
GE10-1 11,250 10,867 31.4%
PGT16 13,720 9,758 35.0%
Iskra Energetika
GTES-12 12,000 10,242 33.3%
MAN Diesel & Turbo SE
THM1304-12N 12,000 11,170 30.5%
Mitsui Engineering & Shipbuilding
MSC100 11,347 10,365 32.9%
Siemens Energy (50/60 Hz)
SGT-400 12,900 9,815 34.8%
Solar Turbines
Mars 100b 11,430 10,365 32.9% aSpecifications for production output at 59°F sea level ISO conditions. bCurrently selected turbine.

Final Regulatory Review and BACT Analysis of the GCF
Deliverable No: 008-14-910-005 Date: October 8, 2014 Page 79 NOTICE – THIS DOCUMENT CONTAINS CONFIDENTIAL AND PROPRIETARY INFORMATION AND SHALL NOT BE DUPLICATED, DISTRIBUTED, DISCLOSED, SHARED OR USED FOR ANY PURPOSE EXCEPT AS MAY BE AUTHORIZED BY AGDC IN WRITING. THIS DOCUMENT IS UNCONTROLLED WHEN PRINTED. THIS COPY VALID ONLY AT THE TIME OF PRINTING
Heat Recovery
As mentioned, waste-heat recovery is a technically feasible option for the combustion turbines for the ASAP project.
Fired Heaters and Emergency Generators
Thermal efficiency is technically feasible as a control technology for BACT consideration.
Based on review of information available on websites of typical vendors, such as Sigma Thermal, GTS Energy, Weatherford, and STRAD Energy Services, efficiencies ranged from 75 to 88 per-cent. One noted an available efficiency of 93 percent for units available with economizers. How-ever, these are noted to depend on return fluid temperatures and other process parameters.
The fired heaters for the ASAP project will incorporate a high-efficiency design, with an estimated efficiency of 85 percent. Given the cold temperatures of combustion air, 85 percent is assumed to be at or near the top range of efficiencies feasible for the GCF heaters.
Utilization Efficiency
As noted, the USEPA PSD/Title V guidance document (2011) indicates that, for greenfield facili-ties producing energy for internal use, efficiency of the equipment and facilities that consume that energy should be examined in the BACT process. Utilization efficiency is relevant to the GCF and can present technically feasible options, although the design of the facility has not sufficiently pro-gressed to address the options available for the facility that have not already been incorporated.
It should be noted, however, that the extreme climactic conditions, the CO2 compression and transport, and unique aspects of the production process for the AGDC GCF facility will be unprec-edented. Thus, a direct comparison of the GCF energy usage to that of other acid-gas treatment systems is not a relevant indicator of energy-efficient design; even if all feasible energy-efficiency options are implemented, the GCF energy use per unit of gas treated could still be higher.
4.3.3 Step 3 – Rank Remaining Control Technologies by Control Effectiveness
If feasible, CCS ranks as the option with the highest CO2 control efficiency for all combustion sources at the GCF (CCS will not be applied on the basis of individual combustion sources), since pilot demonstration projects have capture rates in the range of 90 percent. As noted herein, com-bined cycle energy reductions (thus, GHG emission reductions) are likely in the range of 15 percent. Where a practical use of waste heat exists, heat recovery is in the range of combined cycle, although for the GCF, the GHG reduction occurs at a secondary source. Finally, improvements with alterna-tive simple-cycle equipment are estimated to be less than 5 percent.
On this basis, the relative rankings among the generation efficiency options by combustion source (in order of highest to lowest rank by source) are as follows:

Final Regulatory Review and BACT Analysis of the GCF
Deliverable No: 008-14-910-005 Date: October 8, 2014 Page 80 NOTICE – THIS DOCUMENT CONTAINS CONFIDENTIAL AND PROPRIETARY INFORMATION AND SHALL NOT BE DUPLICATED, DISTRIBUTED, DISCLOSED, SHARED OR USED FOR ANY PURPOSE EXCEPT AS MAY BE AUTHORIZED BY AGDC IN WRITING. THIS DOCUMENT IS UNCONTROLLED WHEN PRINTED. THIS COPY VALID ONLY AT THE TIME OF PRINTING
Power Generation Turbines:
1) Combined cycle 2) Heat recovery (actual reduction occurs at the heater, not the turbines) 3) Simple-cycle options
Feed-gas and CO2 Compressor Turbines:
1) Heat recovery 2) Simple-cycle options
Fired Heaters and Emergency Generators:
1) Thermal efficiency
4.3.4 Step 4 – Evaluate Most Effective Controls and Document Results
Carbon Capture and Storage / Carbon Capture, Use, and Storage
Although CCS was shown to be technically infeasible based on precedent from other projects, eco-nomic feasibility will, nonetheless, be evaluated here. Of the various capture and storage alterna-tives under development, post-combustion CO2 capture with geological storage in unmineable coal seams was shown to be the closest to technical feasibility.
Since the capture, compression, transport, and geological storage have yet to be integrated into one commercial package, published data on costs for each component, combined with site-specific es-timates (Arctic Solutions, 2014a and b), were incorporated into the total estimated cost for the CCS. Component costs range widely, depending on system design, project location, and site conditions, among other factors. The higher cost for each component were factored into the total cost, given the challenging site-specific environmental conditions and technical challenges.
Carbon Capture and Storage / Carbon Capture, Use, and Storage - Cost Estimat-ing Assumptions and Methodology
Following are the assumptions and general methodology for quantifying the component cost data. It is important to note that this Rough Order of Magnitude (ROM) cost estimate is limited to major components of the CCS system, and does not factor in the costs associated with resolving the tech-nical and legal uncertainties identified herein or demonstration of the actual feasibility of geological storage at this site. In addition, the costs are somewhat uncertain due to the lack of commercial-scale projects that integrate the individual CCS components.
Capture: The capital and Operations and Maintenance (O&M) (annual fixed and variable) costs for capture of combusted CO2 were estimated by Arctic Solutions (2014a and b). The estimate assumes the use of Fluor’s Econamine FG+ Process, which is a Fluor proprietary,

Final Regulatory Review and BACT Analysis of the GCF
Deliverable No: 008-14-910-005 Date: October 8, 2014 Page 81 NOTICE – THIS DOCUMENT CONTAINS CONFIDENTIAL AND PROPRIETARY INFORMATION AND SHALL NOT BE DUPLICATED, DISTRIBUTED, DISCLOSED, SHARED OR USED FOR ANY PURPOSE EXCEPT AS MAY BE AUTHORIZED BY AGDC IN WRITING. THIS DOCUMENT IS UNCONTROLLED WHEN PRINTED. THIS COPY VALID ONLY AT THE TIME OF PRINTING
amine-based technology for large-scale, post-combustion CO2 capture. As noted, the tech-nology used for separation of CO2 from raw gas is necessarily very different from that used for capture of CO2 from combustion exhaust, so separate processes are required. The esti-mate assumed a capacity of 2,270 stpd of CO2 recovered; as noted earlier, the current esti-mate of combustion CO2 is slightly higher, so for the BACT cost-effectiveness, this cost estimate is conservative (low).
Arctic Solutions noted (2014a) that:
The combustion CO2 capture estimate was developed from information provided by Fluor process engineering utilizing Fluor proprietary technology. The esti-mate was based on a similar Gulf Coast plant of similar capacity. Fluor in-house equipment modeling techniques were utilized to develop an estimate with repre-sentative quantities for construction materials for a CO2 recovery unit, to be located at a US Gulf Coast Greenfield location, utilizing a stick built construc-tion execution plan. However, to create an estimate for an Alaska North Slope modular installation, the same methodology could not be used as pertinent data points do not exist in that format. Therefore, Arctic Solutions utilized a proprie-tary historical method for converting US Gulf Coast plant costs to a modular North Slope installation.
This resulted in an almost 2.5 multiplier over the U.S. Gulf Coast estimate to account for the North Slope location, and resulting cost estimates are higher than that estimated by USDOE and other parties for more temperate locations.
It was also assumed that the capital cost provided included direct, indirect (including gen-eral facilities, engineering, and construction fees), and contingency costs. The capital cost provided by Arctic Solutions (2014a) was converted into an annualized/present value cost by assuming a 7 percent interest rate over a 10-year operating life.
Note that the capital cost does not include the upsizing of the power generation turbines, which is required to produce the extra power required for CCS.
Other indirect costs, such as property taxes, insurance, and General and Administrative (G&A) charges were estimated and added to the capital cost provided by Flour based on default values (percentages) from the Office of Air Quality Planning and Studies (OAQPS) Control Cost Manual (USEPA, 2002).
The O&M costs for capture provided by Arctic Solutions (2014a) included overall utility and chemical requirements, fuel for additional power generation, personnel requirements, and maintenance requirements.
Compression: The CCS capital and O&M cost estimates provided by Arctic Solutions (2014a and b) include an additional CO2 compressor and a dedicated combustion turbine

Final Regulatory Review and BACT Analysis of the GCF
Deliverable No: 008-14-910-005 Date: October 8, 2014 Page 82 NOTICE – THIS DOCUMENT CONTAINS CONFIDENTIAL AND PROPRIETARY INFORMATION AND SHALL NOT BE DUPLICATED, DISTRIBUTED, DISCLOSED, SHARED OR USED FOR ANY PURPOSE EXCEPT AS MAY BE AUTHORIZED BY AGDC IN WRITING. THIS DOCUMENT IS UNCONTROLLED WHEN PRINTED. THIS COPY VALID ONLY AT THE TIME OF PRINTING
to drive the compressor. These costs were included in the BACT cost analyses. Although fuel for additional power generation was included, additional fuel for the dedicated com-bustion turbine to drive the compressor was not.
Cost of fuel for the additional turbine was, therefore, calculated by estimating required hp by comparison to the compressors for separated CO2. Specifically, based on Arctic Solu-tions’ review of the draft of this document, the separated CO2 compressors have a design rating of 33 million standard cubic feet per day (MMSCFD), and are driven by turbines with a requirement of 9,837 hp each. The 2,270-stpd basis of design for the CCS system is equivalent to 39 MMSCFD. Therefore, because the required CO2 pressure is the same for the two types of compressors, the output of the new combustion turbine is estimated by proration of the separated CO2 compressor turbines, and the combustion CO2 compressor turbine is estimated as 11,626 hp. Further assuming a 30 percent thermal efficiency, and fuel cost of $2/ million British thermal units (MMBTU), annual cost of fuel for the addi-tional turbine is estimated as $1,727,500.
Transport: The range of costs for CO2 transport was obtained from the Report of the In-teragency Task Force on Carbon Capture and Storage (USDOE, 2010). According to the AGDC’s ASAP Plan of Development (2014), untreated natural gas will be obtained from the existing PBU CGF located approximately 4,250 feet to the southeast of the proposed ASAP GCF. The current EOR MI injection site is located at the existing CGF; therefore, it was assumed that the distance from the proposed GCF to the potential EOR is the same.
Lastly, the published ranges of cost for transport included capital and operational costs together (not broken down). As such, the total costs associated with this component was assumed to be part of the annual variable operating costs.
Storage: The range of costs for CO2 storage (general) were obtained from the Report of the Interagency Task Force on Carbon Capture and Storage (USDOE, 2010). Cost estimates for storage did not include potential costs associated with long-term liability. Lastly, the published ranges of cost for this component included capital and operational costs together (not broken down). As such, the total costs associated with storage was assumed to be an annual variable operating cost.
As noted herein, a potential benefit of CO2 storage in coal seams is the displacement of coal-bed CH4, which can be captured and used as fuel. This cost estimate for storage does not include the cost associated with CH4 capture, or the associated potential economic value of recovered CH4, under the unmineable coal-bed option.
Monitoring: The ranges of costs for CO2 monitoring was obtained from the IPCC Special Report on Carbon Dioxide Capture and Storage (2005). The estimates for monitoring did not include any well remediation or long-term liabilities. Lastly, the published ranges of cost for this component included capital and operational costs together (not broken down).

Final Regulatory Review and BACT Analysis of the GCF
Deliverable No: 008-14-910-005 Date: October 8, 2014 Page 83 NOTICE – THIS DOCUMENT CONTAINS CONFIDENTIAL AND PROPRIETARY INFORMATION AND SHALL NOT BE DUPLICATED, DISTRIBUTED, DISCLOSED, SHARED OR USED FOR ANY PURPOSE EXCEPT AS MAY BE AUTHORIZED BY AGDC IN WRITING. THIS DOCUMENT IS UNCONTROLLED WHEN PRINTED. THIS COPY VALID ONLY AT THE TIME OF PRINTING
As such, the total cost associated with this component was assumed to be an annual variable operating cost.
Table 16 summarizes results of the cost analysis.
Table 16. Cost-effectiveness of Carbon Capture and Storage: Combusted Carbon Dioxide
CCS ‐ EOR Item CostDirect Costs Capital cost of capture system = $ 678,000,000TDC = $ 678,000,000 Indirect Costs General facilities, engineering, construction fees = $ ‐ TIC = $ ‐ TDIC (TDC) +(TIC) = $ 678,000,000 Contingency x (TDIC) = $ ‐ TICC = $ 678,000,000 Annual Fixed O&M Costs Operating Labor (Capture system) = $4,700,000 Administrative and Support Labor = $ ‐ Maintenance Labor and Materials (Capture system) = $3,000,000 Parts and Materials (included in maintenance labor and materials cost) = $0 Total FOM = $ 7,700,000 Annual Variable O&M Costs Utility and Chemical Requirements (Capture system) = $ 4,946,000 Energy Requirement (Compression system) = $ 1,729,000CO2 Transport (via pipeline) = $ 38,000CO2 Storage = $ 9,953,000CO2 Monitoring = $195,000
Total VOM = $ 16,860,000
TDC = FOM + VOM = $ 24,560,000
Indirect Costs
Overhead Assumed Included in FOM = Property Tax 1% of (TICC) = $ 6,780,000 Insurance 1% of (TICC) = $ 6,780,000 G&A Charges 2% of (TICC) = $ 13,560,000 Capital Recovery (annualized/present value capital cost) 0.14238 x (TICC) = $ 96,534,000 TIAC = $ 123,654,000
Total Annualized Costs TDAC + TIAC = $ 123,654,000
Total Short Tons Removed per Year (CO2) = 976,000
Cost Effectiveness($ per short ton of pollutant removed) = $152
Total Throughput for GCF per Year (MCF) = 182,500,000
Cost Effectiveness ($ per MCF) = $ 0.81
Final Regulatory Review and BACT Analysis of the GCF
Deliverable No: 008-14-910-005 Date: October 8, 2014 Page 84 NOTICE – THIS DOCUMENT CONTAINS CONFIDENTIAL AND PROPRIETARY INFORMATION AND SHALL NOT BE DUPLICATED, DISTRIBUTED, DISCLOSED, SHARED OR USED FOR ANY PURPOSE EXCEPT AS MAY BE AUTHORIZED BY AGDC IN WRITING. THIS DOCUMENT IS UNCONTROLLED WHEN PRINTED. THIS COPY VALID ONLY AT THE TIME OF PRINTING
CCS ‐ EOR Item CostFOM - Fixed O&M Costs
MCF - million cubic feet
TDC - Total Direct Cost TDIC - Total Direct and Indirect Cost
TIAC - Total Indirect Annualized Cost
TIC – Total Indirect Cost
TICC - Total Installed Capital Cost
VOM - Variable O&M Cost
Carbon Capture and Storage / Carbon Capture, Use, and Storage – Cost and In-terpretation of Cost-effectiveness
It is expected that the costs for CCS at the GCF will be higher relative to other sites or published data for various reasons. As noted by Arctic Solutions with respect to their capital cost estimate for the capture component (2014a), costs are significantly higher than is typically expected for the Lower 48 due to the unique site location at Prudhoe Bay. This is due to site conditions being quite severe (winterization requirements), a shortage of skilled labor availability (resulting in higher wages, incentives, and indirect costs), and the use of modular construction (although this reduces craft hours at the site, it increases the engineering effort and design required when compared to a similar ‘stick-built’ installation in the Lower 48, including U.S. Gulf Coast locations).
The costs presented herein for CCS are likely an underestimate. Although the largest component of the costs were estimated (capture and energy usage associated with compression), as noted, the capital cost associated with upsizing of the power generation turbines to produce the extra power required for CCS, as well as the cost associated with CH4 recovery for coal-bed CH4 released by the CO2 injection, were not included as part of the cost estimate. Potential economic value of that recovered CH4 is difficult to assess, but as the ASAP project could run at capacity for many years based on produced natural gas, and no other market for natural gas currently exists on the North Slope, any such revenue could not be realized for many years. Furthermore, as noted, capital and O&M costs for the CCS system were based on a smaller throughput than indicated by the current emission inventory.
As noted in the USEPA PSD and Title V Permitting Guidance (2011), there is little history with GHG BACT analyses, and as such, insufficient GHG cost-effectiveness data from prior permitting actions in order to determine what cost level is acceptable for GHG BACT. In addition, GHG BACT costs cannot be compared to historically regulated criteria pollutant BACT costs. This is because the volumes of GHGs emitted are orders of magnitude higher than criteria pollutants emit-ted from the same equipment, and as such, the cost-effectiveness for criteria pollutant control de-vices are based on much lower volumes of emissions than for GHG control devices. Therefore, the estimated ROM CCS cost was put into perspective by comparing it to other types of published reference points associated with GHGs, as well as some site-related data points.
Final Regulatory Review and BACT Analysis of the GCF
Deliverable No: 008-14-910-005 Date: October 8, 2014 Page 85 NOTICE – THIS DOCUMENT CONTAINS CONFIDENTIAL AND PROPRIETARY INFORMATION AND SHALL NOT BE DUPLICATED, DISTRIBUTED, DISCLOSED, SHARED OR USED FOR ANY PURPOSE EXCEPT AS MAY BE AUTHORIZED BY AGDC IN WRITING. THIS DOCUMENT IS UNCONTROLLED WHEN PRINTED. THIS COPY VALID ONLY AT THE TIME OF PRINTING
Specifically, the estimated ROM cost for CCS was compared to the costs of other GHG controls targeted by public policy, as well as the market value of GHG offsets, as detailed further in the following list:
Cost as Compared to the Cost of Other GHG Controls: The cost of combustion CO2, approximately $152 /short ton, was estimated by dividing total annualized CCS costs by the estimated annual amount of combustion CO2.
As a comparison, a 2030 GHG Marginal Abatement Cost (MAC) curve was used to obtain information regarding cost of other types of GHG control (in 2009 dollars). A MAC curve provides estimates of the potential magnitude and costs of benefits for various control op-tions. Costs ranged from -$50 (that is, an economic benefit of +$50) per metric ton CO2e for lighting to $140 per metric ton CO2e for solar thermal, and more than $1,000 per metric ton for gas industry projects (Bloomberg New Energy Finance, 2010).
Also based on this MAC curve, the Waxman-Markey Bill, which proposed a 42 percent reduction from 2005 levels by 2030, results in abatement at a cost of less than $143 per metric ton by 2030, which is considered a relatively steep cost compared to projections for carbon allowance prices. Specifically, this reduction target will be met by employing tech-nologies ranging from vehicle efficiency (in the negative cost range) up to $143 per metric ton for solar energy by 2030. The 17 percent reduction target from 2005 to 2020 proposed by President Obama in Copenhagen will occur at an average cost of $25 per metric ton (Bloomberg New Energy Finance, 2010).
This data indicates that $190 per short ton is an extremely high cost for CO2 control, as the majority of emission reduction options targeted by public policy are available for lower cost.
Cost as Compared to the Cost of Carbon Offsets: The average price (volume-weighted dollar per metric ton [$/mt] CO2e) in 2012 was $5.9/mt. This was slightly down from 2011’s $6.2/mt CO2e; however, is significantly higher than the United Nations’ regulatory Clean Development Mechanism (CDM) carbon offset price of less than a $1/mt CO2e (For-est Trends’ Ecosystems Marketplace and Bloomberg New Energy Finance, 2013). The cost of CCS at the GCF is far higher than the market value of other, currently available GHG reduction or sequestration options.
In addition, the estimated ROM cost for CCS was compared to site-related data points, including the cost of the GCF, as well as the impact the CCS system will have on delivered natural gas prices, as detailed further herein.
Cost as Compared to the Cost of the GCF: Arctic Solutions provided (2014a) the total capital cost for the GCF, which was converted into a present value cost by assuming a 7 percent interest rate over a 10-year operating life. The quantified ROM present value cost of the CCS (capture component only) is approximately 20 percent of the present value
Final Regulatory Review and BACT Analysis of the GCF
Deliverable No: 008-14-910-005 Date: October 8, 2014 Page 86 NOTICE – THIS DOCUMENT CONTAINS CONFIDENTIAL AND PROPRIETARY INFORMATION AND SHALL NOT BE DUPLICATED, DISTRIBUTED, DISCLOSED, SHARED OR USED FOR ANY PURPOSE EXCEPT AS MAY BE AUTHORIZED BY AGDC IN WRITING. THIS DOCUMENT IS UNCONTROLLED WHEN PRINTED. THIS COPY VALID ONLY AT THE TIME OF PRINTING
capital cost of the GCF. This is a substantial increase to costs that threatens the economic viability of the overall project.
Increase in the Price of Delivered Natural Gas: The natural gas industrial price (since the end-uses of the natural gas from the site are utility and industrial customers) in Alaska is $5.11 per MCF (U.S. Energy Information Administration, 2014). The estimated natural gas throughput for the GCF was used to determine the cost-effectiveness per MCF of natural gas, or approximately $0.81/MCF (ROM). This translates to an approximate 16 percent potential increase in the price of natural gas with the addition of the CCS; this increase threatens the economic viability of the ASAP project.
As demonstrated, based on various published and site-related data points and associated analyses, CCS will impact project economics; therefore, it is not deemed cost-effective.
Generation Efficiency
Economic viability of technically feasible options for increased energy production efficiency are discussed in this section.
Power Generation Turbines
Combined Cycle
As discussed in Step 2, while serious technical challenges exist for use of combined-cycle systems on the North Slope, this analysis assumes combined cycle is technically feasible for the power generation turbines.
A high-level assessment of heat-recovery options was part of the initial plant design process. There are significant technical challenges involved with providing a steam system on the North Slope, which translate to cost impacts. To provide high reliability of the steam turbine for a combined-cycle system, the steam turbine operation and performance requires adequate steam pressure at the turbine inlet and high-quality steam. Any condensate entrapment in the steam supply reduces the steam turbine efficiency and causes erosion of steam turbine components. Therefore, significant consideration in insulation and winterization is required for a severe site location such as Prudhoe Bay to provide proper steam quality. In addition, proper steam line expansion compensation and properly supported steam lines are required. All these contribute to significant cost impact.
To deliver a high-quality steam supply, several integrated, complex systems need to be in place to provide the required high-purity water for steam generation and proper handling of steam conden-sate from the system. A typical integrated system includes a fresh water treatment plant, boiler feed water system, condensate system, and wastewater treatment plant. To meet the water quality and flow capacity required for steam generation, a significant increase in footprint, insulation, and win-terization, as well as modularization, will be required for proper operation of equipment and pro-tection from severe weather.

Final Regulatory Review and BACT Analysis of the GCF
Deliverable No: 008-14-910-005 Date: October 8, 2014 Page 87 NOTICE – THIS DOCUMENT CONTAINS CONFIDENTIAL AND PROPRIETARY INFORMATION AND SHALL NOT BE DUPLICATED, DISTRIBUTED, DISCLOSED, SHARED OR USED FOR ANY PURPOSE EXCEPT AS MAY BE AUTHORIZED BY AGDC IN WRITING. THIS DOCUMENT IS UNCONTROLLED WHEN PRINTED. THIS COPY VALID ONLY AT THE TIME OF PRINTING
Given these significant technical and economic challenges, a combined-cycle power plant config-uration does not appear justified for the ASAP GCF.
Heat Recovery
The ASAP GCF has significant sources of waste heat that could be used to provide additional heat for other uses. The primary sources of this waste heat are the seven gas turbines included in the GCF design. However, the currently selected treating process uses very little heat because the se-lected process is regenerated by pressure swing instead of heat regeneration. No other significant process heat loads are required by the GCF. The only major heat loads associated with the GCF design are heating units for module heating and ventilation. Process loads to the current heat me-dium system account for less than 5 percent of the total heat requirement.
Use of waste-heat recovery for building heat presents numerous challenges. One major obstacle is the seasonal (and daily) variability of the heat demand. It is expected that heating requirements during the summer months will be near zero. Additionally, during transitional periods, daily tem-perature variation may require a significant heat demand at night to a very low demand during the day. As the source of the waste heat is the gas turbines, whose power output requirements are not impacted by these ambient air temperature variations, the waste-heat recovery system will have to fully accommodate these wide temperature swings. The main methods for controlling the heat re-covered considering the varying heat demand are flue-gas bypass or air cooler heat rejection.
Flue-gas bypass could potentially allow for control of the amount of recovered heat to meet the varying heat demand. However, field performance in mild climates has been poor. Continuously variable dampers have proven to be unreliable, and require substantial and continuous maintenance. In an arctic environment, it is assumed that this already poor performance would be magnified to the point of being not feasible.
Air cooler heat rejection is the other method of trying to match the recovered heat duty with the heat demand. This entails putting in an air cooler system capable of near 100 percent rejection of recovered heat. Currently, the heat medium system has a small air cooler to assist with startup and trim control. Adding this very large air cooler system adds significant capital cost, and it would likely be in operation for many hours per year. No capital offset for reducing the size of the existing fired heaters is possible, due to the requirement that the plant be kept warm even when the gas turbines are not in operation. Therefore, waste-heat recovery entails addition of waste-heat recovery coils and a very large air cooler system.
Based on these factors, a fired heater is still required, since building heat is still needed even when the turbines are not operating. Thus, heat recovery is not a practical alternative. Waste-heat recov-ery is deemed economically infeasible for the ASAP GCF.
Other Simple-cycle Options
The combustion turbine efficiency for this turbine compares favorably with other similarly sized combustion turbines listed in Table 13. Therefore, efficiency cannot be meaningfully improved with other simple-cycle options at any cost.
Final Regulatory Review and BACT Analysis of the GCF
Deliverable No: 008-14-910-005 Date: October 8, 2014 Page 88 NOTICE – THIS DOCUMENT CONTAINS CONFIDENTIAL AND PROPRIETARY INFORMATION AND SHALL NOT BE DUPLICATED, DISTRIBUTED, DISCLOSED, SHARED OR USED FOR ANY PURPOSE EXCEPT AS MAY BE AUTHORIZED BY AGDC IN WRITING. THIS DOCUMENT IS UNCONTROLLED WHEN PRINTED. THIS COPY VALID ONLY AT THE TIME OF PRINTING
Feed-gas Compressor Turbines
Heat Recovery
As discussed herein for the power generation turbines, given the technical and economic chal-lenges, a waste-heat recovery process does not appear justified for the ASAP GCF.
Other Simple-cycle Options
The combustion turbine efficiency for this turbine compares favorably with other similarly sized combustion turbines listed in Table 14. Therefore, efficiency cannot be meaningfully improved with other simple-cycle options at any cost.
Carbon Dioxide Compressor Turbines
Heat Recovery
As discussed herein, given the technical and economic challenges, a waste-heat recovery process does not appear justified for the ASAP GCF.
Other Simple-cycle Options
The combustion turbine efficiency for this turbine compares favorably with other similarly sized combustion turbines listed in Table 15. Therefore, efficiency cannot be meaningfully improved with other simple-cycle options at any cost.
Fired Heaters and Emergency Generators
Based on available information, the AGDC team does not believe that more thermally efficient options are available for the heaters. As noted in Section 4.3.5, a review of options for efficient use of energy will be conducted during facility design; this will include the thermal energy from the heaters.
The expected use and emissions associated with the emergency generators are low, and any unit changes based on efficiency are expensive on a per ton basis.
Energy Use Efficiency
Because the engineering design of the GCF has not progressed sufficiently, equipment options that may present more or less efficient operation cannot be identified at this time; as such, cost estimates cannot be provided.
4.3.5 Step 5 – Select Best Available Control Technology
As demonstrated herein, use of the proposed equipment, combined with maximization of the effi-cient use of energy, are the lowest emitting options for the GCF given technical and economic feasibility.

Final Regulatory Review and BACT Analysis of the GCF
Deliverable No: 008-14-910-005 Date: October 8, 2014 Page 89 NOTICE – THIS DOCUMENT CONTAINS CONFIDENTIAL AND PROPRIETARY INFORMATION AND SHALL NOT BE DUPLICATED, DISTRIBUTED, DISCLOSED, SHARED OR USED FOR ANY PURPOSE EXCEPT AS MAY BE AUTHORIZED BY AGDC IN WRITING. THIS DOCUMENT IS UNCONTROLLED WHEN PRINTED. THIS COPY VALID ONLY AT THE TIME OF PRINTING
The USEPA’s PSD permitting guidance for GHGs (2011) suggests use of output-based BACT emission limits and longer-term averaging periods for GHGs. Based on ASAP analysis of con-servative annual operating profiles for turbine partial load operation and ambient temperature dur-ing operations, and considering turbine degradation that occurs over time, BACT limits are proposed in this section.
In practice, the impact of low-load operations, startup and shutdown, and heat rate degradation has a far greater impact on annual average turbine efficiency than the selection of turbine type (make and model).
An energy use efficiency review will be conducted as the facility design proceeds, but before con-struction begins. Economically feasible options for reducing power and energy consumption will be applied in the final design.
Power Generation Turbines
The proposed BACT permit limit is 1,665 lb/MWh, on an annual average, based on aggregate gross Combustion Turbine Generator (CTG) output of the three power generation turbines. The proposed limit is based on emissions from GE LM2500+ turbines, which are similar to the alternative tur-bines that may be used for the ASAP project. The proposed limit is the result of each engine running at 50 percent load throughout the year, and considers an estimated 10 percent degradation based on compliance with the manufacturer’s recommended maintenance schedule.
The equivalent annual PTE for this limit is 375,295 stpy.
Feed-gas Compressor Turbine
The proposed BACT permit limit is 1.3 pounds per horsepower hour (lb/hp-h) (which is equivalent to approximately 1,730 lb/MWh), on an annual average, based on aggregate gross CTG output of the two feed-gas compressor turbines. This is based on emissions from GE PTG25/DLE turbines, which are similar to the alternative turbines that may be used for the ASAP project. The proposed limit is the result of two units running at 50 percent load throughout the year, and considers an estimated 10 percent degradation based on compliance with the manufacturer’s recommended maintenance schedule.
The annual PTE for this limit is 260,756 stpy.
Carbon Dioxide Compressor Turbines
The proposed BACT permit limit is 2,296 lb/MWh on an annual average, based on aggregate gross CTG output of the two CO2 compressor turbines. This is based on emissions from Solar Mars 100 turbines, which are similar to the alternative turbines that may be used for the ASAP project. The proposed limit is the result of each engine running at 50 percent load throughout the year, and considers an estimated 10 percent degradation based on compliance with the manufacturer’s rec-ommended maintenance schedule.

Final Regulatory Review and BACT Analysis of the GCF
Deliverable No: 008-14-910-005 Date: October 8, 2014 Page 90 NOTICE – THIS DOCUMENT CONTAINS CONFIDENTIAL AND PROPRIETARY INFORMATION AND SHALL NOT BE DUPLICATED, DISTRIBUTED, DISCLOSED, SHARED OR USED FOR ANY PURPOSE EXCEPT AS MAY BE AUTHORIZED BY AGDC IN WRITING. THIS DOCUMENT IS UNCONTROLLED WHEN PRINTED. THIS COPY VALID ONLY AT THE TIME OF PRINTING
The annual PTE for this limit is 140, 347 stpy.
Fired Heaters and Emergency Generators
Thermal energy efficiency is selected as BACT for the fired heaters, and the selected heaters will have an efficiency of 85 percent or greater. Engine efficiency for the emergency generators has not yet been identified, but the selected model will be of high efficiency.
The annual PTE for this limit is 206,848 stpy.
4.4 FUGITIVES
The GCF emission inventory estimates fugitive emissions of CH4 and CO2 to be 41,000 stpy on a CO2e basis, or about 5 percent of the total GHG emissions of the facility. Fugitives are, therefore, considered in this GHG BACT analysis. However, since no available alternatives are identified, the five-step process is abbreviated.
BACT for facility components, including flanges, valves, pump seals, and compressor seals, will include a Leak Detection and Repair (LDAR) program after GCF operation begins. AGDC will implement the LDAR program, periodically inspecting the equipment for small leaks. In addition, because of the cold weather, compressors and GCF process systems will be enclosed in modules. For health and safety purposes, each module will include sensors to monitor concentrations of CO2 and combustible gases, including CH4. When sensors detect high concentrations, alarms will be activated, and operators will respond with a series of actions, including investigating and repairing the source of the leak.
The design of the GCF has not sufficiently progressed to address other options available, but these may include:
Avoiding screwed and flanged joints, with use of welded joints where practical. Choice of pump and compressor seals; for example, use of dry compressor seals. Use of bellow seals for smaller valves. (Note that due to the considerable space constraints
resulting from modular construction, AGDC has determined that bellow seals on larger valves are not possible.)
AGDC is committed to incorporating technically and economically feasible options to limit fugitive emissions as the GCF design proceeds.
4.5 FLARES AND VENTS
The flares and vents at the GCF will be used only for emergency and upset conditions. However, pilot gas will be continuously burned at the flares; therefore, the flares and vents are a source of CO2 emissions.
Final Regulatory Review and BACT Analysis of the GCF
Deliverable No: 008-14-910-005 Date: October 8, 2014 Page 91 NOTICE – THIS DOCUMENT CONTAINS CONFIDENTIAL AND PROPRIETARY INFORMATION AND SHALL NOT BE DUPLICATED, DISTRIBUTED, DISCLOSED, SHARED OR USED FOR ANY PURPOSE EXCEPT AS MAY BE AUTHORIZED BY AGDC IN WRITING. THIS DOCUMENT IS UNCONTROLLED WHEN PRINTED. THIS COPY VALID ONLY AT THE TIME OF PRINTING
The USEPA’s RBLC database was searched for process flares, and several projects listed good combustion practices as GHG limits. One project, Indiana Gasification (RBLC ID: IN-0166), which is permitted for an acid-gas flare, has a BACT control method that requires analysis of the root cause of malfunction events that caused emergency releases to the flares, determination of whether additional preventative measures could be implemented to minimize reoccurrence of these events, and documentation of this process (USEPA, 2014b). ASAP considers this to be an acceptable BACT approach for the GCF.
Since the flares and vents at the GCF will be used only for emergency and upset conditions, no permit limit for GHG BACT is recommended for the ASAP process flares.
Final Regulatory Review and BACT Analysis of the GCF
Deliverable No: 008-14-910-005 Date: October 8, 2014 Page 92 NOTICE – THIS DOCUMENT CONTAINS CONFIDENTIAL AND PROPRIETARY INFORMATION AND SHALL NOT BE DUPLICATED, DISTRIBUTED, DISCLOSED, SHARED OR USED FOR ANY PURPOSE EXCEPT AS MAY BE AUTHORIZED BY AGDC IN WRITING. THIS DOCUMENT IS UNCONTROLLED WHEN PRINTED. THIS COPY VALID ONLY AT THE TIME OF PRINTING
5. REFERENCES
Alaska Gasline Development Corporation (AGDC). 2014. Alaska Stand Alone Pipeline Plan of Development. June.
Arctic Solutions Inc. (Arctic Solutions). 2013. Response to Requests for Emissions Information. Document No: 035-C-24-R-P-0008. December 30.
Arctic Solutions Inc. (Arctic Solutions). 2014a. ROM Study Estimate(s) CO2 Capture, BACT Emis-sions Control, SCR/CO Catalyst Installations. 035-C-20-P-S-0003. June 27.
Arctic Solutions Inc. (Arctic Solutions). 2014b. ROM Study Estimate(s) Supporting Document for BACT Analysis. 035-C-24-R-P-0013. July 14.
Bellona Environmental CCS Team (BEST). Undated. Carbon Capture and Storage. http://bel-lona.org/ccs/technology/capture. Accessed August 25, 2014.
Bloomberg New Energy Finance. 2010. US MAC CURVE: A FRESH LOOK AT THE COSTS OF REDUCING US CARBON EMISSIONS. January 14. http://about.bnef.com/white-papers/us-mac-curve-a-fresh-look-at-the-costs-of-reducing-us-carbon-emissions/. Accessed September 3, 2014.
BP plc. 2011. Fact Sheet, Prudhoe Bay Field Gas Handling Facilities. June. http://www.arc-ticgas.gov/sites/default/files/documents/cgf-ccp-fact-sheet-6-2011.pdf. Accessed August 25, 2014.
California Air Resources Board (CARB). 2002. Staff Report - Initial Statement of Reason Appendix 4, Enhanced Vapor Recovery Technology Review Report. October
Congressional Research Service. 2013a. Carbon Capture and Sequestration (CCS): A Primer. July 16. http://fas.org/sgp/crs/misc/R42532.pdf. Accessed August 26, 2014.
Congressional Research Service. 2013b. Carbon Capture: A Technology Assessment. November 5. http://fas.org/sgp/crs/misc/R41325.pdf. Accessed August 26, 2014.
ExxonMobil. 2011. Application for a Prevention of Significant Deterioration Air Quality Construc-tion Permit for the Point Thomson Project. July.
Forest Trends’ Ecosystems Marketplace and Bloomberg New Energy Finance. 2013. Maneuvering the Mosaic, State of the Voluntary Carbon Markets 2013. June 20. http://theredddesk.org/sites/de-fault/files/resources/pdf/doc_3898.pdf. Accessed August 25, 2014.
Gas Turbine World. 2014. 2014 Performance Specs, 30th Edition. January-February, Vol. 44, No. 1.
Final Regulatory Review and BACT Analysis of the GCF
Deliverable No: 008-14-910-005 Date: October 8, 2014 Page 93 NOTICE – THIS DOCUMENT CONTAINS CONFIDENTIAL AND PROPRIETARY INFORMATION AND SHALL NOT BE DUPLICATED, DISTRIBUTED, DISCLOSED, SHARED OR USED FOR ANY PURPOSE EXCEPT AS MAY BE AUTHORIZED BY AGDC IN WRITING. THIS DOCUMENT IS UNCONTROLLED WHEN PRINTED. THIS COPY VALID ONLY AT THE TIME OF PRINTING
General Electric (GE). 2014. Applications for Packaged Power Solutions (APPS). https://sup-portcentral.ge.com/products/sup_products.asp?prod_id=60154. Accessed July 31, 2014.
ICO2N. Undated. “Unmineable Coal Seams.” What is Carbon Capture? http://www.ico2n.com/what-is-carbon-capture/co2-storage/unmineable-coal-seams. Accessed September 26, 2014. Interagency Task Force on Carbon Capture and Storage. 2010. Report of the Interagency Task Force on Carbon Capture and Storage. August.
Intergovernmental Panel on Climate Change (IPCC). 2005. IPCC Special Report on Carbon Diox-ide Capture and Storage. Prepared by Working Group III of the IPCC: Metz, B., O. Davidson, H. C. de Coninck, M. Loos, and L. A. Meyer (eds.). Cambridge, United Kingdom and New York, NY, U.S.: Cambridge University Press. pp. 442.
International Organization for Standardization (ISO). 1997. Specification 3977-2, Gas turbines – Procurement – Part 2.
National Energy Technology Laboratory (NETL). 2013. NETL’s Carbon Capture, Utilization, & Storage Database - Ver 4. January. http://www.netl.doe.gov/research/coal/carbon-storage/cs-global/database. Accessed September 26, 2014.
North American Carbon Atlas Partnership (NACAP). 2011. NACSA 2012. The North American Carbon Storage Atlas. 1st ed. Natural Resources Canada, the Mexican Ministry of Energy, and the U.S. Department of Energy. April. http://www.netl.doe.gov/File%20Library/Research/Carbon-Storage/NACSA2012.pdf. Accessed August 25, 2014.
U.S. Department of Energy (USDOE). Undated. NATCARB/ATLAS. http://www.netl.doe.gov/tech-nologies/carbon_seq/natcarb/storage.html. Accessed August 25, 2014.
U.S. Department of Energy (USDOE). 2010. Report of the Interagency Task Force on Carbon Capture and Storage. August. http://energy.gov/sites/prod/files/2013/04/f0/CCSTaskForceRe-port2010_0.pdf Accessed August 25, 2014.
U.S. Department of Energy (USDOE). 2012. The United States 2012 Carbon Utilization and Stor-age Atlas. 4th ed. Office of Fossil Energy and NETL. November. http://www.netl.doe.gov/File%20Library/Research/Coal/carbon-storage/atlasiv/Atlas-IV-2012.pdf. Accessed August 25, 2014.
U.S. Department of Energy (USDOE). 2013. NETL’s Carbon Capture, Utilization, & Storage Da-tabase – Ver. 4. January. http://www.netl.doe.gov/research/coal/carbon-storage/cs-global/database. Accessed August 25, 2014.
U.S. Energy Information Administration. 2014. “Table 5.6.A. Average Retail Price of Electricity to Ultimate Customers by End-Use Sector, by State, June 2014 and 2013 (Cents per Kilowatthour).”
Final Regulatory Review and BACT Analysis of the GCF
Deliverable No: 008-14-910-005 Date: October 8, 2014 Page 94 NOTICE – THIS DOCUMENT CONTAINS CONFIDENTIAL AND PROPRIETARY INFORMATION AND SHALL NOT BE DUPLICATED, DISTRIBUTED, DISCLOSED, SHARED OR USED FOR ANY PURPOSE EXCEPT AS MAY BE AUTHORIZED BY AGDC IN WRITING. THIS DOCUMENT IS UNCONTROLLED WHEN PRINTED. THIS COPY VALID ONLY AT THE TIME OF PRINTING
Electric Power Monthly. August 25. http://www.eia.gov/electricity/monthly/epm_ta-ble_grapher.cfm?t=epmt_5_6_a. Accessed August 25, 2014.
U.S. Environmental Protection Agency (USEPA). 1990a. OAQPS Cost Control Manual. 4th ed. EPA 450/3-90-006. North Carolina: Office of Air Quality Planning and Studies. January.
U.S. Environmental Protection Agency (USEPA). 1990b. New Source Review Workshop Manual: Prevention of Significant Deterioration and Nonattainment Area Permitting. Draft. October.
U.S. Environmental Protection Agency (USEPA). 1993. Alternative Control Techniques (ACT) Document – Internal Combustion NOx, Part 1 and 2.
U.S. Environmental Protection Agency (USEPA). 1997. Alternative Control Techniques (ACT) Document – Internal Combustion NOx, Part 1 and 2. EPA-453/R 93-032.
U.S. Environmental Protection Agency (USEPA). 2002. EPA Air Pollution Control Cost Manual. 6th ed. EPA/452/B-02-001. January. Research Triangle Park, NC: USEPA Office of Air Quality Planning and Standards. http://www.epa.gov/ttncatc1/dir1/c_allchs.pdf. Accessed Septebmer 29, 2014.
U.S. Environmental Protection Agency (USEPA). 2006. AP-42: Compilation of Air Pollutant Emission Factors.
U.S. Environmental Protection Agency (USEPA). 2011. PSD and Title V Permitting Guidance for Greenhouse Gases. March.
U.S. Environmental Protection Agency (USEPA). 2013. Proposed Carbon Pollution Standards for New Power Plants. September 20. http://www2.epa.gov/carbon-pollution-standards/2013-pro-posed-carbon-pollution-standard-new-power-plants. Accessed September 26, 2014.
U.S. Environmental Protection Agency (USEPA). 2014a. Next Steps and Preliminary Views on the Application of Clean Air Permitting Programs to Greenhouse Gases Following the Supreme Court's Decision in “Utility Air Regulatory Group 1·vs. Environmental Protection Agency.” Wash-ington, DC: USEPA Office of Air and Radiation. July 14.
U.S. Environmental Protection Agency (USEPA). 2014b. RACT/BACT/LAER Clearinghouse (RBLC). July 31. http://cfpub.epa.gov/rblc/. Accessed July 25, 2014.

Final Regulatory Review and BACT Analysis of the GCF
Deliverable No: 008-14-910-005 Date: October 8, 2014 Page 95 NOTICE – THIS DOCUMENT CONTAINS CONFIDENTIAL AND PROPRIETARY INFORMATION AND SHALL NOT BE DUPLICATED, DISTRIBUTED, DISCLOSED, SHARED OR USED FOR ANY PURPOSE EXCEPT AS MAY BE AUTHORIZED BY AGDC IN WRITING. THIS DOCUMENT IS UNCONTROLLED WHEN PRINTED. THIS COPY VALID ONLY AT THE TIME OF PRINTING
Appendix A RACT/BACT/LAER Clearinghouse Tables
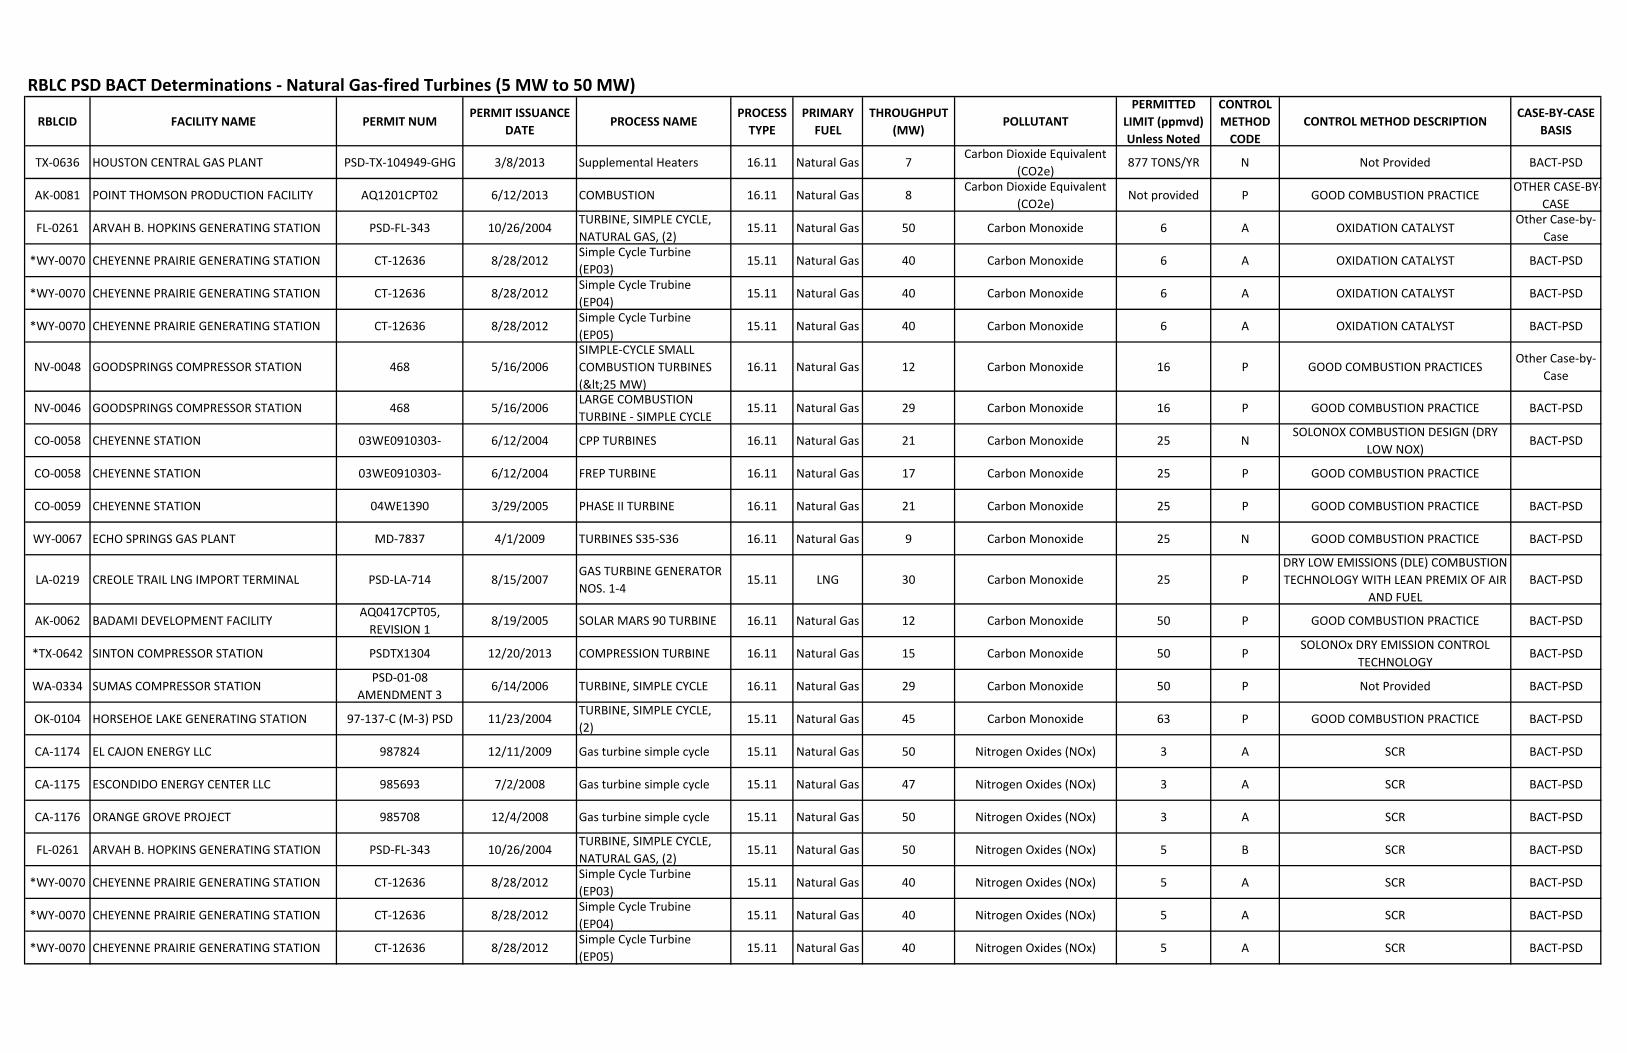
RBLC PSD BACT Determinations ‐ Natural Gas‐fired Turbines (5 MW to 50 MW)
RBLCID FACILITY NAME PERMIT NUMPERMIT ISSUANCE
DATEPROCESS NAME
PROCESS TYPE
PRIMARY FUEL
THROUGHPUT (MW)
POLLUTANTPERMITTED
LIMIT (ppmvd) Unless Noted
CONTROL METHOD CODE
CONTROL METHOD DESCRIPTIONCASE‐BY‐CASE
BASIS
TX‐0636 HOUSTON CENTRAL GAS PLANT PSD‐TX‐104949‐GHG 3/8/2013 Supplemental Heaters 16.11 Natural Gas 7Carbon Dioxide Equivalent
(CO2e)877 TONS/YR N Not Provided BACT‐PSD
AK‐0081 POINT THOMSON PRODUCTION FACILITY AQ1201CPT02 6/12/2013 COMBUSTION 16.11 Natural Gas 8Carbon Dioxide Equivalent
(CO2e)Not provided P GOOD COMBUSTION PRACTICE
OTHER CASE‐BY‐CASE
FL‐0261 ARVAH B. HOPKINS GENERATING STATION PSD‐FL‐343 10/26/2004TURBINE, SIMPLE CYCLE, NATURAL GAS, (2)
15.11 Natural Gas 50 Carbon Monoxide 6 A OXIDATION CATALYSTOther Case‐by‐
Case
*WY‐0070 CHEYENNE PRAIRIE GENERATING STATION CT‐12636 8/28/2012Simple Cycle Turbine (EP03)
15.11 Natural Gas 40 Carbon Monoxide 6 A OXIDATION CATALYST BACT‐PSD
*WY‐0070 CHEYENNE PRAIRIE GENERATING STATION CT‐12636 8/28/2012Simple Cycle Trubine (EP04)
15.11 Natural Gas 40 Carbon Monoxide 6 A OXIDATION CATALYST BACT‐PSD
*WY‐0070 CHEYENNE PRAIRIE GENERATING STATION CT‐12636 8/28/2012Simple Cycle Turbine (EP05)
15.11 Natural Gas 40 Carbon Monoxide 6 A OXIDATION CATALYST BACT‐PSD
NV‐0048 GOODSPRINGS COMPRESSOR STATION 468 5/16/2006SIMPLE‐CYCLE SMALL COMBUSTION TURBINES (<25 MW)
16.11 Natural Gas 12 Carbon Monoxide 16 P GOOD COMBUSTION PRACTICESOther Case‐by‐
Case
NV‐0046 GOODSPRINGS COMPRESSOR STATION 468 5/16/2006LARGE COMBUSTION TURBINE ‐ SIMPLE CYCLE
15.11 Natural Gas 29 Carbon Monoxide 16 P GOOD COMBUSTION PRACTICE BACT‐PSD
CO‐0058 CHEYENNE STATION 03WE0910303‐ 6/12/2004 CPP TURBINES 16.11 Natural Gas 21 Carbon Monoxide 25 NSOLONOX COMBUSTION DESIGN (DRY
LOW NOX)BACT‐PSD
CO‐0058 CHEYENNE STATION 03WE0910303‐ 6/12/2004 FREP TURBINE 16.11 Natural Gas 17 Carbon Monoxide 25 P GOOD COMBUSTION PRACTICE
CO‐0059 CHEYENNE STATION 04WE1390 3/29/2005 PHASE II TURBINE 16.11 Natural Gas 21 Carbon Monoxide 25 P GOOD COMBUSTION PRACTICE BACT‐PSD
WY‐0067 ECHO SPRINGS GAS PLANT MD‐7837 4/1/2009 TURBINES S35‐S36 16.11 Natural Gas 9 Carbon Monoxide 25 N GOOD COMBUSTION PRACTICE BACT‐PSD
LA‐0219 CREOLE TRAIL LNG IMPORT TERMINAL PSD‐LA‐714 8/15/2007GAS TURBINE GENERATOR NOS. 1‐4
15.11 LNG 30 Carbon Monoxide 25 PDRY LOW EMISSIONS (DLE) COMBUSTION TECHNOLOGY WITH LEAN PREMIX OF AIR
AND FUELBACT‐PSD
AK‐0062 BADAMI DEVELOPMENT FACILITYAQ0417CPT05, REVISION 1
8/19/2005 SOLAR MARS 90 TURBINE 16.11 Natural Gas 12 Carbon Monoxide 50 P GOOD COMBUSTION PRACTICE BACT‐PSD
*TX‐0642 SINTON COMPRESSOR STATION PSDTX1304 12/20/2013 COMPRESSION TURBINE 16.11 Natural Gas 15 Carbon Monoxide 50 PSOLONOx DRY EMISSION CONTROL
TECHNOLOGYBACT‐PSD
WA‐0334 SUMAS COMPRESSOR STATIONPSD‐01‐08
AMENDMENT 36/14/2006 TURBINE, SIMPLE CYCLE 16.11 Natural Gas 29 Carbon Monoxide 50 P Not Provided BACT‐PSD
OK‐0104 HORSEHOE LAKE GENERATING STATION 97‐137‐C (M‐3) PSD 11/23/2004TURBINE, SIMPLE CYCLE, (2)
15.11 Natural Gas 45 Carbon Monoxide 63 P GOOD COMBUSTION PRACTICE BACT‐PSD
CA‐1174 EL CAJON ENERGY LLC 987824 12/11/2009 Gas turbine simple cycle 15.11 Natural Gas 50 Nitrogen Oxides (NOx) 3 A SCR BACT‐PSD
CA‐1175 ESCONDIDO ENERGY CENTER LLC 985693 7/2/2008 Gas turbine simple cycle 15.11 Natural Gas 47 Nitrogen Oxides (NOx) 3 A SCR BACT‐PSD
CA‐1176 ORANGE GROVE PROJECT 985708 12/4/2008 Gas turbine simple cycle 15.11 Natural Gas 50 Nitrogen Oxides (NOx) 3 A SCR BACT‐PSD
FL‐0261 ARVAH B. HOPKINS GENERATING STATION PSD‐FL‐343 10/26/2004TURBINE, SIMPLE CYCLE, NATURAL GAS, (2)
15.11 Natural Gas 50 Nitrogen Oxides (NOx) 5 B SCR BACT‐PSD
*WY‐0070 CHEYENNE PRAIRIE GENERATING STATION CT‐12636 8/28/2012Simple Cycle Turbine (EP03)
15.11 Natural Gas 40 Nitrogen Oxides (NOx) 5 A SCR BACT‐PSD
*WY‐0070 CHEYENNE PRAIRIE GENERATING STATION CT‐12636 8/28/2012Simple Cycle Trubine (EP04)
15.11 Natural Gas 40 Nitrogen Oxides (NOx) 5 A SCR BACT‐PSD
*WY‐0070 CHEYENNE PRAIRIE GENERATING STATION CT‐12636 8/28/2012Simple Cycle Turbine (EP05)
15.11 Natural Gas 40 Nitrogen Oxides (NOx) 5 A SCR BACT‐PSD

RBLC PSD BACT Determinations ‐ Natural Gas‐fired Turbines (5 MW to 50 MW)
RBLCID FACILITY NAME PERMIT NUMPERMIT ISSUANCE
DATEPROCESS NAME
PROCESS TYPE
PRIMARY FUEL
THROUGHPUT (MW)
POLLUTANTPERMITTED
LIMIT (ppmvd) Unless Noted
CONTROL METHOD CODE
CONTROL METHOD DESCRIPTIONCASE‐BY‐CASE
BASIS
CO‐0058 CHEYENNE STATION 03WE0910303‐ 6/12/2004 FREP TURBINE 16.11 Natural Gas 17 Nitrogen Oxides (NOx) 15 PSOLONOX COMBUSTION DESIGN (DRY
LOW NOX)BACT‐PSD
CO‐0059 CHEYENNE STATION 04WE1390 3/29/2005 PHASE II TURBINE 16.11 Natural Gas 21 Nitrogen Oxides (NOx) 15 P SOLONOX II (DRY LOW NOX). BACT‐PSD
LA‐0232 STERLINGTON COMPRESSOR STATION PSD‐LA‐729 6/24/2008COMPRESSOR TURBINE NO. 1
16.11 Natural Gas 23 Nitrogen Oxides (NOx) 15 PDRY LOW NOX BURNERS AND GOOD
COMBUSTION PRACTICESBACT‐PSD
LA‐0232 STERLINGTON COMPRESSOR STATION PSD‐LA‐729 6/24/2008COMPRESSOR TURBINE NO. 2
16.11 Natural Gas 23 Nitrogen Oxides (NOx) 15 NDRY LOW NOX BURNERS AND GOOD
COMBUSTION PRACTICESBACT‐PSD
WY‐0067 ECHO SPRINGS GAS PLANT MD‐7837 4/1/2009 TURBINES S35‐S36 16.11 Natural Gas 9 Nitrogen Oxides (NOx) 15 N SOLONOX BACT‐PSD
FL‐0266PAYNE CREEK GENERATING STATION/SEMINOLE ELECTRIC
PSD‐FL‐344 AND 0490340‐003‐AC
6/29/2005SIMPLE CYCLE COMBUSTION TURBINES
16.11 Natural Gas 30 Nitrogen Oxides (NOx) 20 PWATER INJECTION AND LOW OPERATING
HOURSOther Case‐by‐
Case
NV‐0048 GOODSPRINGS COMPRESSOR STATION 468 5/16/2006SIMPLE‐CYCLE SMALL COMBUSTION TURBINES (<25 MW)
16.11 Natural Gas 12 Nitrogen Oxides (NOx) 25 P SOLONOX BACT‐PSD
*TX‐0642 SINTON COMPRESSOR STATION PSDTX1304 12/20/2013 COMPRESSION TURBINE 16.11 Natural Gas 15 Nitrogen Oxides (NOx) 25 PSOLONOx DRY EMISSION CONTROL
TECHNOLOGYBACT‐PSD
WA‐0316NORTHWEST PIPELINE CORP.‐MT VERNON COMPRESSOR
PSD‐01‐09 AMENDMENT 5
6/14/2006 TURBINE, SIMPLE CYCLE 16.11 Natural Gas 10 Nitrogen Oxides (NOx) 25 P DRY LOW NOX COMBUSTORS BACT‐PSD
LA‐0219 CREOLE TRAIL LNG IMPORT TERMINAL PSD‐LA‐714 8/15/2007GAS TURBINE GENERATOR NOS. 1‐4
15.11 LNG 30 Nitrogen Oxides (NOx) 25 PDRY LOW EMISSIONS (DLE) COMBUSTION TECHNOLOGY WITH LEAN PREMIX OF AIR
AND FUELBACT‐PSD
NV‐0046 GOODSPRINGS COMPRESSOR STATION 468 5/16/2006LARGE COMBUSTION TURBINE ‐ SIMPLE CYCLE
15.11 Natural Gas 29 Nitrogen Oxides (NOx) 25 P SOLONOX BURNERS BACT‐PSD
CO‐0058 CHEYENNE STATION 03WE0910303‐ 6/12/2004 CPP TURBINES 16.11 Natural Gas 21 Nitrogen Oxides (NOx) 49 P GOOD COMBUSTION PRACTICE BACT‐PSD
AK‐0062 BADAMI DEVELOPMENT FACILITYAQ0417CPT05, REVISION 1
8/19/2005 SOLAR MARS 90 TURBINE 16.11 Natural Gas 12 Nitrogen Oxides (NOx) 85 PDRY LOW NOX COMBUSTION TECHNOLOGY (SOLONOX)
BACT‐PSD
NV‐0048 GOODSPRINGS COMPRESSOR STATION 468 5/16/2006SIMPLE‐CYCLE SMALL COMBUSTION TURBINES (<25 MW)
16.11 Natural Gas 12Particulate matter, filterable
<10 µ (FPM10)0.0066
LB/MMBTUP GOOD COMBUSTION PRACTICE
Other Case‐by‐Case
NV‐0046 GOODSPRINGS COMPRESSOR STATION 468 5/16/2006LARGE COMBUSTION TURBINE ‐ SIMPLE CYCLE
15.11 Natural Gas 29Particulate matter, filterable
<10 µ (FPM10)0.0066
LB/MMBTUP NATURAL GAS BACT‐PSD
FL‐0261 ARVAH B. HOPKINS GENERATING STATION PSD‐FL‐343 10/26/2004TURBINE, SIMPLE CYCLE, NATURAL GAS, (2)
15.11 Natural Gas 50Particulate matter, filterable
<10 µ (FPM10)0.0143
LB/MMBTUP CLEAN FUELS BACT‐PSD
LA‐0219 CREOLE TRAIL LNG IMPORT TERMINAL PSD‐LA‐714 8/15/2007GAS TURBINE GENERATOR NOS. 1‐4
15.11 LNG 30Particulate matter, filterable
<10 µ (FPM10)0.0206
LB/MMBTUP
DRY LOW EMISSIONS (DLE) COMBUSTION TECHNOLOGY WITH LEAN PREMIX OF AIR
AND FUELBACT‐PSD
AK‐0062 BADAMI DEVELOPMENT FACILITYAQ0417CPT05, REVISION 1
8/19/2005 SOLAR MARS 90 TURBINE 16.11 Natural Gas 12Particulate matter, filterable
<10 µ (FPM10)10 % OPACITY P GOOD OPERATION PRACTICES BACT‐PSD
FL‐0266PAYNE CREEK GENERATING STATION/SEMINOLE ELECTRIC
PSD‐FL‐344 AND 0490340‐003‐AC
6/29/2005SIMPLE CYCLE COMBUSTION TURBINES
16.11 Natural Gas 30Particulate matter, filterable
<10 µ (FPM10)10 % OPACITY P CLEAN FUELS BACT‐PSD
*WY‐0070 CHEYENNE PRAIRIE GENERATING STATION CT‐12636 8/28/2012Simple Cycle Turbine (EP03)
15.11 Natural Gas 40Particulate matter, total
(TPM)0.0293
LB/MMBTUP GOOD COMBUSTION PRACTICE BACT‐PSD
*WY‐0070 CHEYENNE PRAIRIE GENERATING STATION CT‐12636 8/28/2012Simple Cycle Trubine (EP04)
15.11 Natural Gas 40Particulate matter, total
(TPM)0.0293
LB/MMBTUP GOOD COMBUSTION PRACTICE BACT‐PSD
*WY‐0070 CHEYENNE PRAIRIE GENERATING STATION CT‐12636 8/28/2012Simple Cycle Turbine (EP05)
15.11 Natural Gas 40Particulate matter, total
(TPM)0.0293
LB/MMBTUP GOOD COMBUSTION PRACTICE BACT‐PSD
AK‐0081 POINT THOMSON PRODUCTION FACILITY AQ1201CPT02 6/12/2013 COMBUSTION 16.11 Natural Gas 8Particulate matter, total <2.5
µ (TPM2.5)0.0066
LB/MMBTUP GOOD COMBUSTION PRACTICE
OTHER CASE‐BY‐CASE

RBLC PSD BACT Determinations ‐ Natural Gas‐fired Turbines (5 MW to 50 MW)
RBLCID FACILITY NAME PERMIT NUMPERMIT ISSUANCE
DATEPROCESS NAME
PROCESS TYPE
PRIMARY FUEL
THROUGHPUT (MW)
POLLUTANTPERMITTED
LIMIT (ppmvd) Unless Noted
CONTROL METHOD CODE
CONTROL METHOD DESCRIPTIONCASE‐BY‐CASE
BASIS
CA‐1174 EL CAJON ENERGY LLC 987824 12/11/2009 Gas turbine simple cycle 15.11 Natural Gas 50Volatile Organic Compounds
(VOC)2 A OXIDATION CATALYST BACT‐PSD
CA‐1175 ESCONDIDO ENERGY CENTER LLC 985693 7/2/2008 Gas turbine simple cycle 15.11 Natural Gas 47Volatile Organic Compounds
(VOC)2 A OXIDATION CATALYST BACT‐PSD
CA‐1176 ORANGE GROVE PROJECT 985708 12/4/2008 Gas turbine simple cycle 15.11 Natural Gas 50Volatile Organic Compounds
(VOC)2 A OXIDATION CATALYST BACT‐PSD
CO‐0058 CHEYENNE STATION 03WE0910303‐ 6/12/2004 FREP TURBINE 16.11 Natural Gas 17Volatile Organic Compounds
(VOC)3 P GOOD COMBUSTION PRACTICE BACT‐PSD
CO‐0058 CHEYENNE STATION 03WE0910303‐ 6/12/2004 CPP TURBINES 16.11 Natural Gas 21Volatile Organic Compounds
(VOC)3 P GOOD COMBUSTION PRACTICE BACT‐PSD
CO‐0059 CHEYENNE STATION 04WE1390 3/29/2005 PHASE II TURBINE 16.11 Natural Gas 21Volatile Organic Compounds
(VOC)3 P GOOD COMBUSTION PRACTICE BACT‐PSD
FL‐0261 ARVAH B. HOPKINS GENERATING STATION PSD‐FL‐343 10/26/2004TURBINE, SIMPLE CYCLE, NATURAL GAS, (2)
15.11 Natural Gas 50Volatile Organic Compounds
(VOC)3 N Not Provided
Other Case‐by‐Case
*WY‐0070 CHEYENNE PRAIRIE GENERATING STATION CT‐12636 8/28/2012Simple Cycle Turbine (EP03)
15.11 Natural Gas 40Volatile Organic Compounds
(VOC)3 A OXIDATION CATALYST BACT‐PSD
*WY‐0070 CHEYENNE PRAIRIE GENERATING STATION CT‐12636 8/28/2012Simple Cycle Trubine (EP04)
15.11 Natural Gas 40Volatile Organic Compounds
(VOC)3 A OXIDATION CATALYST BACT‐PSD
*WY‐0070 CHEYENNE PRAIRIE GENERATING STATION CT‐12636 8/28/2012Simple Cycle Turbine (EP05)
15.11 Natural Gas 40Volatile Organic Compounds
(VOC)3 A OXIDATION CATALYST BACT‐PSD
WY‐0067 ECHO SPRINGS GAS PLANT MD‐7837 4/1/2009 TURBINES S35‐S36 16.11 Natural Gas 9Volatile Organic Compounds
(VOC)25 N GOOD COMBUSTION PRACTICE BACT‐PSD
NV‐0048 GOODSPRINGS COMPRESSOR STATION 468 5/16/2006SIMPLE‐CYCLE SMALL COMBUSTION TURBINES (<25 MW)
16.11 Natural Gas 12Volatile Organic Compounds
(VOC)0.0069
LB/MMBTUP GOOD COMBUSTION PRACTICE
Other Case‐by‐Case
NV‐0046 GOODSPRINGS COMPRESSOR STATION 468 5/16/2006LARGE COMBUSTION TURBINE ‐ SIMPLE CYCLE
15.11 Natural Gas 29Volatile Organic Compounds
(VOC)0.0069
LB/MMBTUP GOOD COMBUSTION PRACTICE BACT‐PSD
LA‐0219 CREOLE TRAIL LNG IMPORT TERMINAL PSD‐LA‐714 8/15/2007GAS TURBINE GENERATOR NOS. 1‐4
15.11 LNG 30Volatile Organic Compounds
(VOC)0.0118
LB/MMBTUP GOOD COMBUSTION PRACTICE BACT‐PSD
LA‐0232 STERLINGTON COMPRESSOR STATION PSD‐LA‐729 6/24/2008COMPRESSOR TURBINE NO. 1
16.11 Natural Gas 23Volatile Organic Compounds
(VOC)0.0331
LB/MMBTUN
GOOD COMBUSTION PRACTICES INCLUDING THE USE OF CLEAN BURNING
FUELS SUCH AS NATURAL GASBACT‐PSD
LA‐0232 STERLINGTON COMPRESSOR STATION PSD‐LA‐729 6/24/2008COMPRESSOR TURBINE NO. 2
16.11 Natural Gas 23Volatile Organic Compounds
(VOC)0.0331
LB/MMBTUN
GOOD COMBUSTION PRACTICES INCLUDING THE USE OF CLEAN BURNING
FUELS SUCH AS NATURAL GASBACT‐PSD
FL‐0266PAYNE CREEK GENERATING STATION/SEMINOLE ELECTRIC
PSD‐FL‐344 AND 0490340‐003‐AC
6/29/2005SIMPLE CYCLE COMBUSTION TURBINES
16.11 Natural Gas 30Volatile Organic Compounds
(VOC)90 % REMOVAL A OXIDATION CATALYST BACT‐PSD
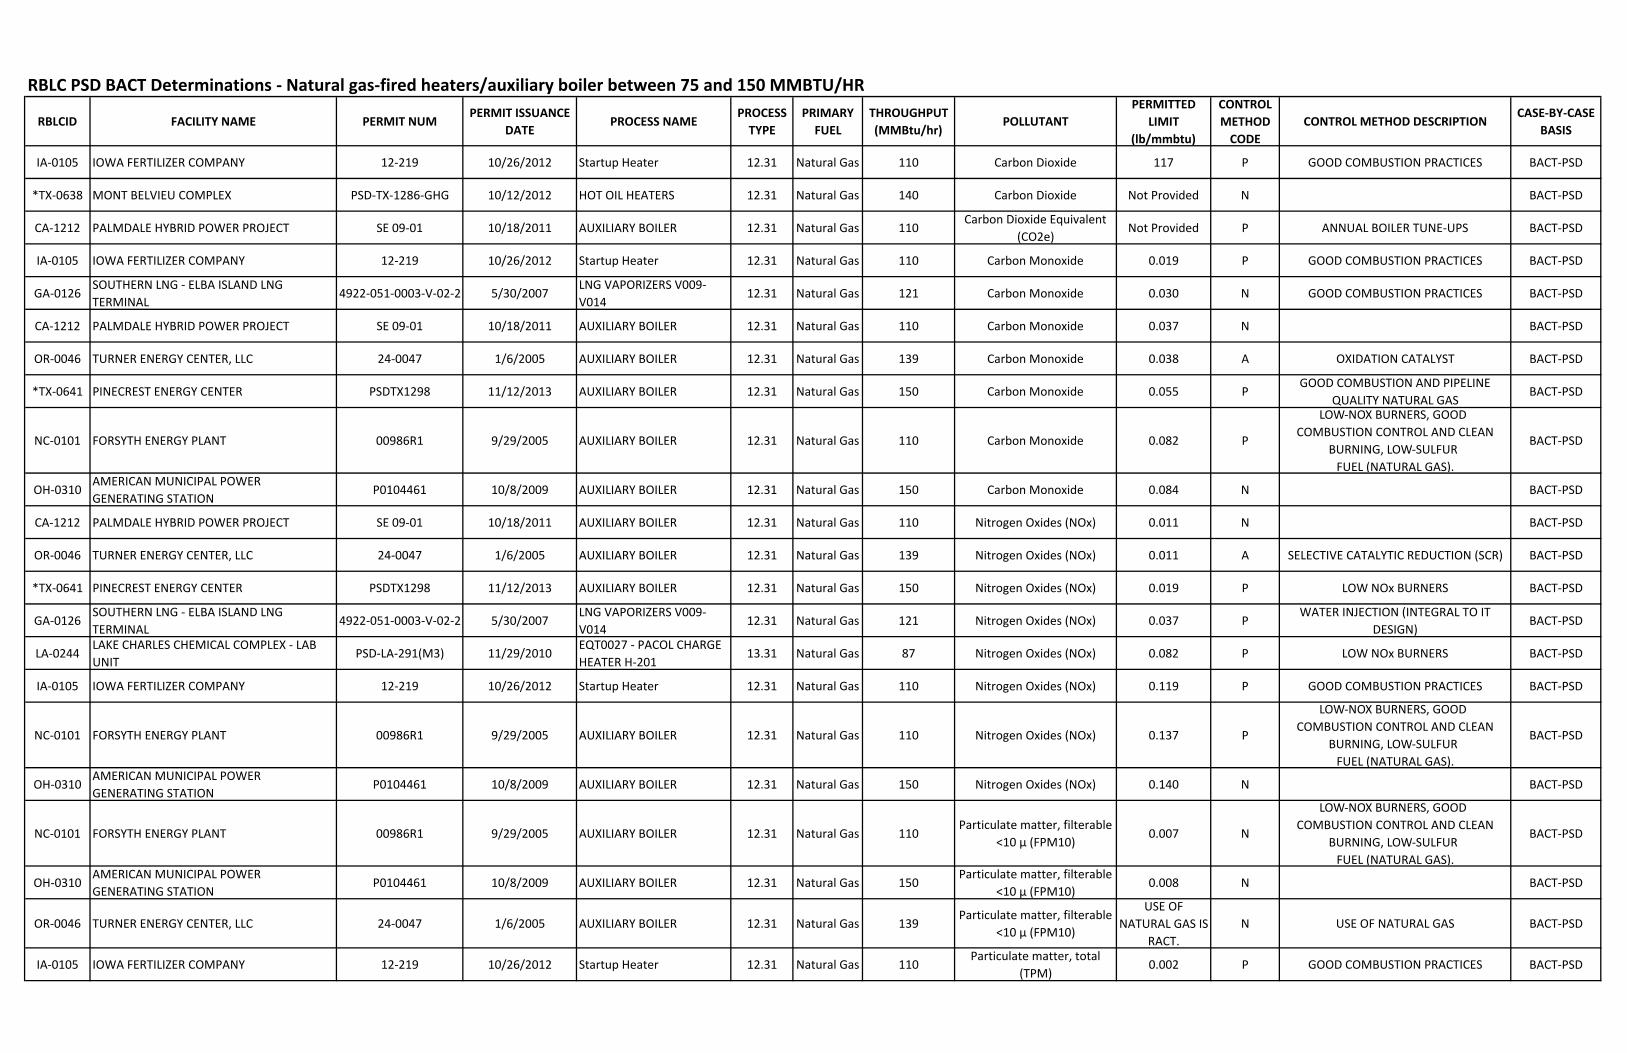
RBLC PSD BACT Determinations ‐ Natural gas‐fired heaters/auxiliary boiler between 75 and 150 MMBTU/HR
RBLCID FACILITY NAME PERMIT NUMPERMIT ISSUANCE
DATEPROCESS NAME
PROCESS TYPE
PRIMARY FUEL
THROUGHPUT (MMBtu/hr)
POLLUTANTPERMITTED
LIMIT (lb/mmbtu)
CONTROL METHOD CODE
CONTROL METHOD DESCRIPTIONCASE‐BY‐CASE
BASIS
IA‐0105 IOWA FERTILIZER COMPANY 12‐219 10/26/2012 Startup Heater 12.31 Natural Gas 110 Carbon Dioxide 117 P GOOD COMBUSTION PRACTICES BACT‐PSD
*TX‐0638 MONT BELVIEU COMPLEX PSD‐TX‐1286‐GHG 10/12/2012 HOT OIL HEATERS 12.31 Natural Gas 140 Carbon Dioxide Not Provided N BACT‐PSD
CA‐1212 PALMDALE HYBRID POWER PROJECT SE 09‐01 10/18/2011 AUXILIARY BOILER 12.31 Natural Gas 110Carbon Dioxide Equivalent
(CO2e)Not Provided P ANNUAL BOILER TUNE‐UPS BACT‐PSD
IA‐0105 IOWA FERTILIZER COMPANY 12‐219 10/26/2012 Startup Heater 12.31 Natural Gas 110 Carbon Monoxide 0.019 P GOOD COMBUSTION PRACTICES BACT‐PSD
GA‐0126SOUTHERN LNG ‐ ELBA ISLAND LNG TERMINAL
4922‐051‐0003‐V‐02‐2 5/30/2007LNG VAPORIZERS V009‐V014
12.31 Natural Gas 121 Carbon Monoxide 0.030 N GOOD COMBUSTION PRACTICES BACT‐PSD
CA‐1212 PALMDALE HYBRID POWER PROJECT SE 09‐01 10/18/2011 AUXILIARY BOILER 12.31 Natural Gas 110 Carbon Monoxide 0.037 N BACT‐PSD
OR‐0046 TURNER ENERGY CENTER, LLC 24‐0047 1/6/2005 AUXILIARY BOILER 12.31 Natural Gas 139 Carbon Monoxide 0.038 A OXIDATION CATALYST BACT‐PSD
*TX‐0641 PINECREST ENERGY CENTER PSDTX1298 11/12/2013 AUXILIARY BOILER 12.31 Natural Gas 150 Carbon Monoxide 0.055 PGOOD COMBUSTION AND PIPELINE
QUALITY NATURAL GASBACT‐PSD
NC‐0101 FORSYTH ENERGY PLANT 00986R1 9/29/2005 AUXILIARY BOILER 12.31 Natural Gas 110 Carbon Monoxide 0.082 P
LOW‐NOX BURNERS, GOOD COMBUSTION CONTROL AND CLEAN
BURNING, LOW‐SULFUR FUEL (NATURAL GAS).
BACT‐PSD
OH‐0310AMERICAN MUNICIPAL POWER GENERATING STATION
P0104461 10/8/2009 AUXILIARY BOILER 12.31 Natural Gas 150 Carbon Monoxide 0.084 N BACT‐PSD
CA‐1212 PALMDALE HYBRID POWER PROJECT SE 09‐01 10/18/2011 AUXILIARY BOILER 12.31 Natural Gas 110 Nitrogen Oxides (NOx) 0.011 N BACT‐PSD
OR‐0046 TURNER ENERGY CENTER, LLC 24‐0047 1/6/2005 AUXILIARY BOILER 12.31 Natural Gas 139 Nitrogen Oxides (NOx) 0.011 A SELECTIVE CATALYTIC REDUCTION (SCR) BACT‐PSD
*TX‐0641 PINECREST ENERGY CENTER PSDTX1298 11/12/2013 AUXILIARY BOILER 12.31 Natural Gas 150 Nitrogen Oxides (NOx) 0.019 P LOW NOx BURNERS BACT‐PSD
GA‐0126SOUTHERN LNG ‐ ELBA ISLAND LNG TERMINAL
4922‐051‐0003‐V‐02‐2 5/30/2007LNG VAPORIZERS V009‐V014
12.31 Natural Gas 121 Nitrogen Oxides (NOx) 0.037 PWATER INJECTION (INTEGRAL TO IT
DESIGN)BACT‐PSD
LA‐0244LAKE CHARLES CHEMICAL COMPLEX ‐ LAB UNIT
PSD‐LA‐291(M3) 11/29/2010EQT0027 ‐ PACOL CHARGE HEATER H‐201
13.31 Natural Gas 87 Nitrogen Oxides (NOx) 0.082 P LOW NOx BURNERS BACT‐PSD
IA‐0105 IOWA FERTILIZER COMPANY 12‐219 10/26/2012 Startup Heater 12.31 Natural Gas 110 Nitrogen Oxides (NOx) 0.119 P GOOD COMBUSTION PRACTICES BACT‐PSD
NC‐0101 FORSYTH ENERGY PLANT 00986R1 9/29/2005 AUXILIARY BOILER 12.31 Natural Gas 110 Nitrogen Oxides (NOx) 0.137 P
LOW‐NOX BURNERS, GOOD COMBUSTION CONTROL AND CLEAN
BURNING, LOW‐SULFUR FUEL (NATURAL GAS).
BACT‐PSD
OH‐0310AMERICAN MUNICIPAL POWER GENERATING STATION
P0104461 10/8/2009 AUXILIARY BOILER 12.31 Natural Gas 150 Nitrogen Oxides (NOx) 0.140 N BACT‐PSD
NC‐0101 FORSYTH ENERGY PLANT 00986R1 9/29/2005 AUXILIARY BOILER 12.31 Natural Gas 110Particulate matter, filterable
<10 µ (FPM10)0.007 N
LOW‐NOX BURNERS, GOOD COMBUSTION CONTROL AND CLEAN
BURNING, LOW‐SULFUR FUEL (NATURAL GAS).
BACT‐PSD
OH‐0310AMERICAN MUNICIPAL POWER GENERATING STATION
P0104461 10/8/2009 AUXILIARY BOILER 12.31 Natural Gas 150Particulate matter, filterable
<10 µ (FPM10)0.008 N BACT‐PSD
OR‐0046 TURNER ENERGY CENTER, LLC 24‐0047 1/6/2005 AUXILIARY BOILER 12.31 Natural Gas 139Particulate matter, filterable
<10 µ (FPM10)
USE OF NATURAL GAS IS
RACT.N USE OF NATURAL GAS BACT‐PSD
IA‐0105 IOWA FERTILIZER COMPANY 12‐219 10/26/2012 Startup Heater 12.31 Natural Gas 110Particulate matter, total
(TPM)0.002 P GOOD COMBUSTION PRACTICES BACT‐PSD
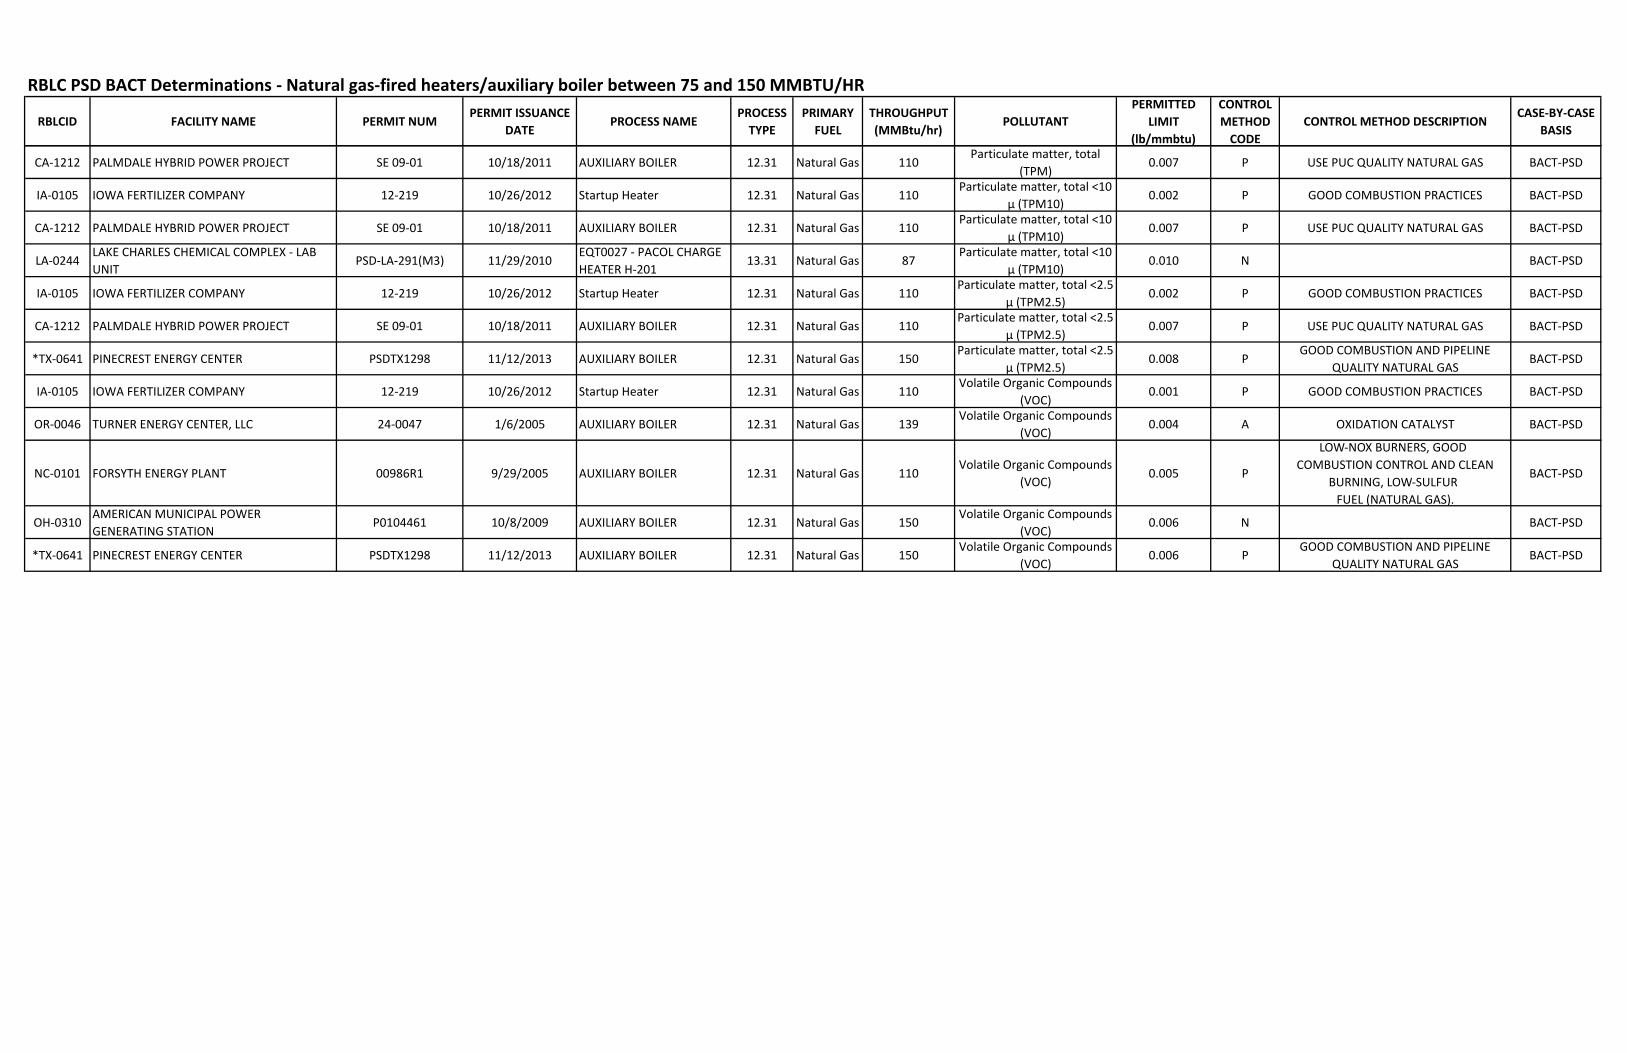
RBLC PSD BACT Determinations ‐ Natural gas‐fired heaters/auxiliary boiler between 75 and 150 MMBTU/HR
RBLCID FACILITY NAME PERMIT NUMPERMIT ISSUANCE
DATEPROCESS NAME
PROCESS TYPE
PRIMARY FUEL
THROUGHPUT (MMBtu/hr)
POLLUTANTPERMITTED
LIMIT (lb/mmbtu)
CONTROL METHOD CODE
CONTROL METHOD DESCRIPTIONCASE‐BY‐CASE
BASIS
CA‐1212 PALMDALE HYBRID POWER PROJECT SE 09‐01 10/18/2011 AUXILIARY BOILER 12.31 Natural Gas 110Particulate matter, total
(TPM)0.007 P USE PUC QUALITY NATURAL GAS BACT‐PSD
IA‐0105 IOWA FERTILIZER COMPANY 12‐219 10/26/2012 Startup Heater 12.31 Natural Gas 110Particulate matter, total <10
µ (TPM10)0.002 P GOOD COMBUSTION PRACTICES BACT‐PSD
CA‐1212 PALMDALE HYBRID POWER PROJECT SE 09‐01 10/18/2011 AUXILIARY BOILER 12.31 Natural Gas 110Particulate matter, total <10
µ (TPM10)0.007 P USE PUC QUALITY NATURAL GAS BACT‐PSD
LA‐0244LAKE CHARLES CHEMICAL COMPLEX ‐ LAB UNIT
PSD‐LA‐291(M3) 11/29/2010EQT0027 ‐ PACOL CHARGE HEATER H‐201
13.31 Natural Gas 87Particulate matter, total <10
µ (TPM10)0.010 N BACT‐PSD
IA‐0105 IOWA FERTILIZER COMPANY 12‐219 10/26/2012 Startup Heater 12.31 Natural Gas 110Particulate matter, total <2.5
µ (TPM2.5)0.002 P GOOD COMBUSTION PRACTICES BACT‐PSD
CA‐1212 PALMDALE HYBRID POWER PROJECT SE 09‐01 10/18/2011 AUXILIARY BOILER 12.31 Natural Gas 110Particulate matter, total <2.5
µ (TPM2.5)0.007 P USE PUC QUALITY NATURAL GAS BACT‐PSD
*TX‐0641 PINECREST ENERGY CENTER PSDTX1298 11/12/2013 AUXILIARY BOILER 12.31 Natural Gas 150Particulate matter, total <2.5
µ (TPM2.5)0.008 P
GOOD COMBUSTION AND PIPELINE QUALITY NATURAL GAS
BACT‐PSD
IA‐0105 IOWA FERTILIZER COMPANY 12‐219 10/26/2012 Startup Heater 12.31 Natural Gas 110Volatile Organic Compounds
(VOC)0.001 P GOOD COMBUSTION PRACTICES BACT‐PSD
OR‐0046 TURNER ENERGY CENTER, LLC 24‐0047 1/6/2005 AUXILIARY BOILER 12.31 Natural Gas 139Volatile Organic Compounds
(VOC)0.004 A OXIDATION CATALYST BACT‐PSD
NC‐0101 FORSYTH ENERGY PLANT 00986R1 9/29/2005 AUXILIARY BOILER 12.31 Natural Gas 110Volatile Organic Compounds
(VOC)0.005 P
LOW‐NOX BURNERS, GOOD COMBUSTION CONTROL AND CLEAN
BURNING, LOW‐SULFUR FUEL (NATURAL GAS).
BACT‐PSD
OH‐0310AMERICAN MUNICIPAL POWER GENERATING STATION
P0104461 10/8/2009 AUXILIARY BOILER 12.31 Natural Gas 150Volatile Organic Compounds
(VOC)0.006 N BACT‐PSD
*TX‐0641 PINECREST ENERGY CENTER PSDTX1298 11/12/2013 AUXILIARY BOILER 12.31 Natural Gas 150Volatile Organic Compounds
(VOC)0.006 P
GOOD COMBUSTION AND PIPELINE QUALITY NATURAL GAS
BACT‐PSD
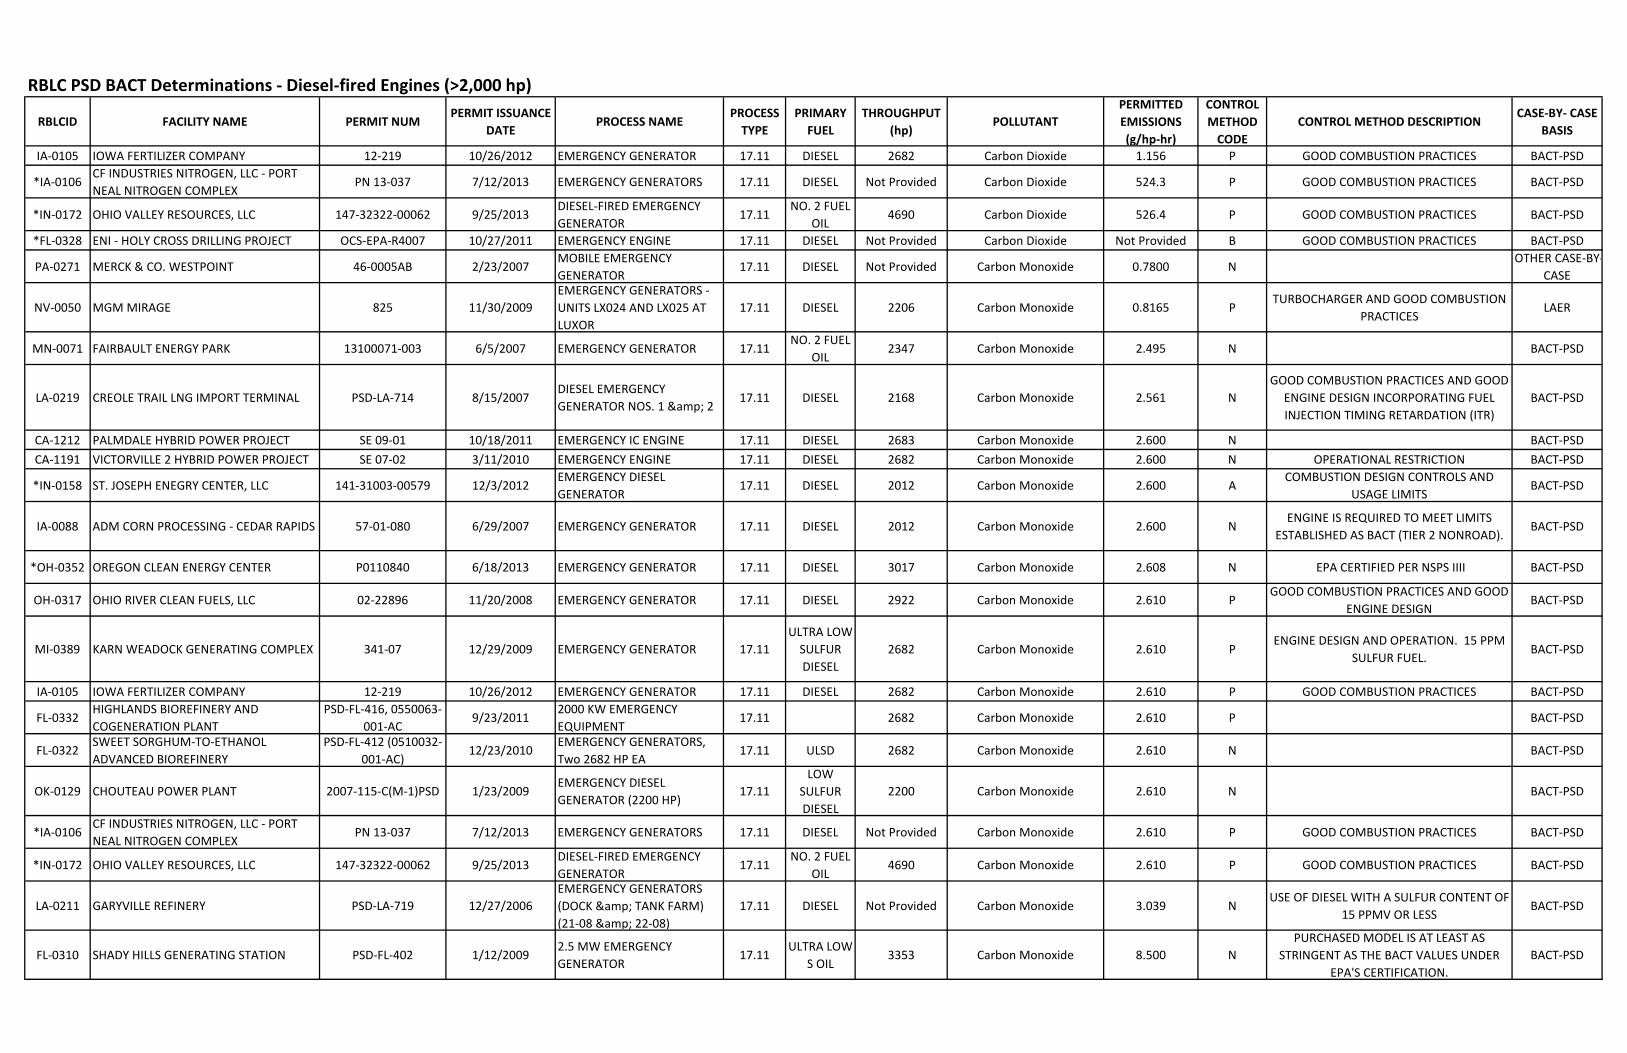
RBLC PSD BACT Determinations ‐ Diesel‐fired Engines (>2,000 hp)
RBLCID FACILITY NAME PERMIT NUMPERMIT ISSUANCE
DATEPROCESS NAME
PROCESS TYPE
PRIMARY FUEL
THROUGHPUT (hp)
POLLUTANTPERMITTED EMISSIONS(g/hp‐hr)
CONTROL METHOD CODE
CONTROL METHOD DESCRIPTIONCASE‐BY‐ CASE
BASIS
IA‐0105 IOWA FERTILIZER COMPANY 12‐219 10/26/2012 EMERGENCY GENERATOR 17.11 DIESEL 2682 Carbon Dioxide 1.156 P GOOD COMBUSTION PRACTICES BACT‐PSD
*IA‐0106CF INDUSTRIES NITROGEN, LLC ‐ PORT NEAL NITROGEN COMPLEX
PN 13‐037 7/12/2013 EMERGENCY GENERATORS 17.11 DIESEL Not Provided Carbon Dioxide 524.3 P GOOD COMBUSTION PRACTICES BACT‐PSD
*IN‐0172 OHIO VALLEY RESOURCES, LLC 147‐32322‐00062 9/25/2013DIESEL‐FIRED EMERGENCY GENERATOR
17.11NO. 2 FUEL
OIL4690 Carbon Dioxide 526.4 P GOOD COMBUSTION PRACTICES BACT‐PSD
*FL‐0328 ENI ‐ HOLY CROSS DRILLING PROJECT OCS‐EPA‐R4007 10/27/2011 EMERGENCY ENGINE 17.11 DIESEL Not Provided Carbon Dioxide Not Provided B GOOD COMBUSTION PRACTICES BACT‐PSD
PA‐0271 MERCK & CO. WESTPOINT 46‐0005AB 2/23/2007MOBILE EMERGENCY GENERATOR
17.11 DIESEL Not Provided Carbon Monoxide 0.7800 NOTHER CASE‐BY‐
CASE
NV‐0050 MGM MIRAGE 825 11/30/2009EMERGENCY GENERATORS ‐ UNITS LX024 AND LX025 AT LUXOR
17.11 DIESEL 2206 Carbon Monoxide 0.8165 PTURBOCHARGER AND GOOD COMBUSTION
PRACTICESLAER
MN‐0071 FAIRBAULT ENERGY PARK 13100071‐003 6/5/2007 EMERGENCY GENERATOR 17.11NO. 2 FUEL
OIL2347 Carbon Monoxide 2.495 N BACT‐PSD
LA‐0219 CREOLE TRAIL LNG IMPORT TERMINAL PSD‐LA‐714 8/15/2007DIESEL EMERGENCY GENERATOR NOS. 1 & 2
17.11 DIESEL 2168 Carbon Monoxide 2.561 NGOOD COMBUSTION PRACTICES AND GOOD
ENGINE DESIGN INCORPORATING FUEL INJECTION TIMING RETARDATION (ITR)
BACT‐PSD
CA‐1212 PALMDALE HYBRID POWER PROJECT SE 09‐01 10/18/2011 EMERGENCY IC ENGINE 17.11 DIESEL 2683 Carbon Monoxide 2.600 N BACT‐PSDCA‐1191 VICTORVILLE 2 HYBRID POWER PROJECT SE 07‐02 3/11/2010 EMERGENCY ENGINE 17.11 DIESEL 2682 Carbon Monoxide 2.600 N OPERATIONAL RESTRICTION BACT‐PSD
*IN‐0158 ST. JOSEPH ENEGRY CENTER, LLC 141‐31003‐00579 12/3/2012EMERGENCY DIESEL GENERATOR
17.11 DIESEL 2012 Carbon Monoxide 2.600 ACOMBUSTION DESIGN CONTROLS AND
USAGE LIMITSBACT‐PSD
IA‐0088 ADM CORN PROCESSING ‐ CEDAR RAPIDS 57‐01‐080 6/29/2007 EMERGENCY GENERATOR 17.11 DIESEL 2012 Carbon Monoxide 2.600 NENGINE IS REQUIRED TO MEET LIMITS
ESTABLISHED AS BACT (TIER 2 NONROAD). BACT‐PSD
*OH‐0352 OREGON CLEAN ENERGY CENTER P0110840 6/18/2013 EMERGENCY GENERATOR 17.11 DIESEL 3017 Carbon Monoxide 2.608 N EPA CERTIFIED PER NSPS IIII BACT‐PSD
OH‐0317 OHIO RIVER CLEAN FUELS, LLC 02‐22896 11/20/2008 EMERGENCY GENERATOR 17.11 DIESEL 2922 Carbon Monoxide 2.610 PGOOD COMBUSTION PRACTICES AND GOOD
ENGINE DESIGNBACT‐PSD
MI‐0389 KARN WEADOCK GENERATING COMPLEX 341‐07 12/29/2009 EMERGENCY GENERATOR 17.11ULTRA LOW SULFUR DIESEL
2682 Carbon Monoxide 2.610 PENGINE DESIGN AND OPERATION. 15 PPM
SULFUR FUEL.BACT‐PSD
IA‐0105 IOWA FERTILIZER COMPANY 12‐219 10/26/2012 EMERGENCY GENERATOR 17.11 DIESEL 2682 Carbon Monoxide 2.610 P GOOD COMBUSTION PRACTICES BACT‐PSD
FL‐0332HIGHLANDS BIOREFINERY AND COGENERATION PLANT
PSD‐FL‐416, 0550063‐001‐AC
9/23/20112000 KW EMERGENCY EQUIPMENT
17.11 2682 Carbon Monoxide 2.610 P BACT‐PSD
FL‐0322SWEET SORGHUM‐TO‐ETHANOL ADVANCED BIOREFINERY
PSD‐FL‐412 (0510032‐001‐AC)
12/23/2010EMERGENCY GENERATORS, Two 2682 HP EA
17.11 ULSD 2682 Carbon Monoxide 2.610 N BACT‐PSD
OK‐0129 CHOUTEAU POWER PLANT 2007‐115‐C(M‐1)PSD 1/23/2009EMERGENCY DIESEL GENERATOR (2200 HP)
17.11LOW
SULFUR DIESEL
2200 Carbon Monoxide 2.610 N BACT‐PSD
*IA‐0106CF INDUSTRIES NITROGEN, LLC ‐ PORT NEAL NITROGEN COMPLEX
PN 13‐037 7/12/2013 EMERGENCY GENERATORS 17.11 DIESEL Not Provided Carbon Monoxide 2.610 P GOOD COMBUSTION PRACTICES BACT‐PSD
*IN‐0172 OHIO VALLEY RESOURCES, LLC 147‐32322‐00062 9/25/2013DIESEL‐FIRED EMERGENCY GENERATOR
17.11NO. 2 FUEL
OIL4690 Carbon Monoxide 2.610 P GOOD COMBUSTION PRACTICES BACT‐PSD
LA‐0211 GARYVILLE REFINERY PSD‐LA‐719 12/27/2006EMERGENCY GENERATORS (DOCK & TANK FARM) (21‐08 & 22‐08)
17.11 DIESEL Not Provided Carbon Monoxide 3.039 NUSE OF DIESEL WITH A SULFUR CONTENT OF
15 PPMV OR LESSBACT‐PSD
FL‐0310 SHADY HILLS GENERATING STATION PSD‐FL‐402 1/12/20092.5 MW EMERGENCY GENERATOR
17.11ULTRA LOW
S OIL3353 Carbon Monoxide 8.500 N
PURCHASED MODEL IS AT LEAST AS STRINGENT AS THE BACT VALUES UNDER
EPA'S CERTIFICATION.BACT‐PSD
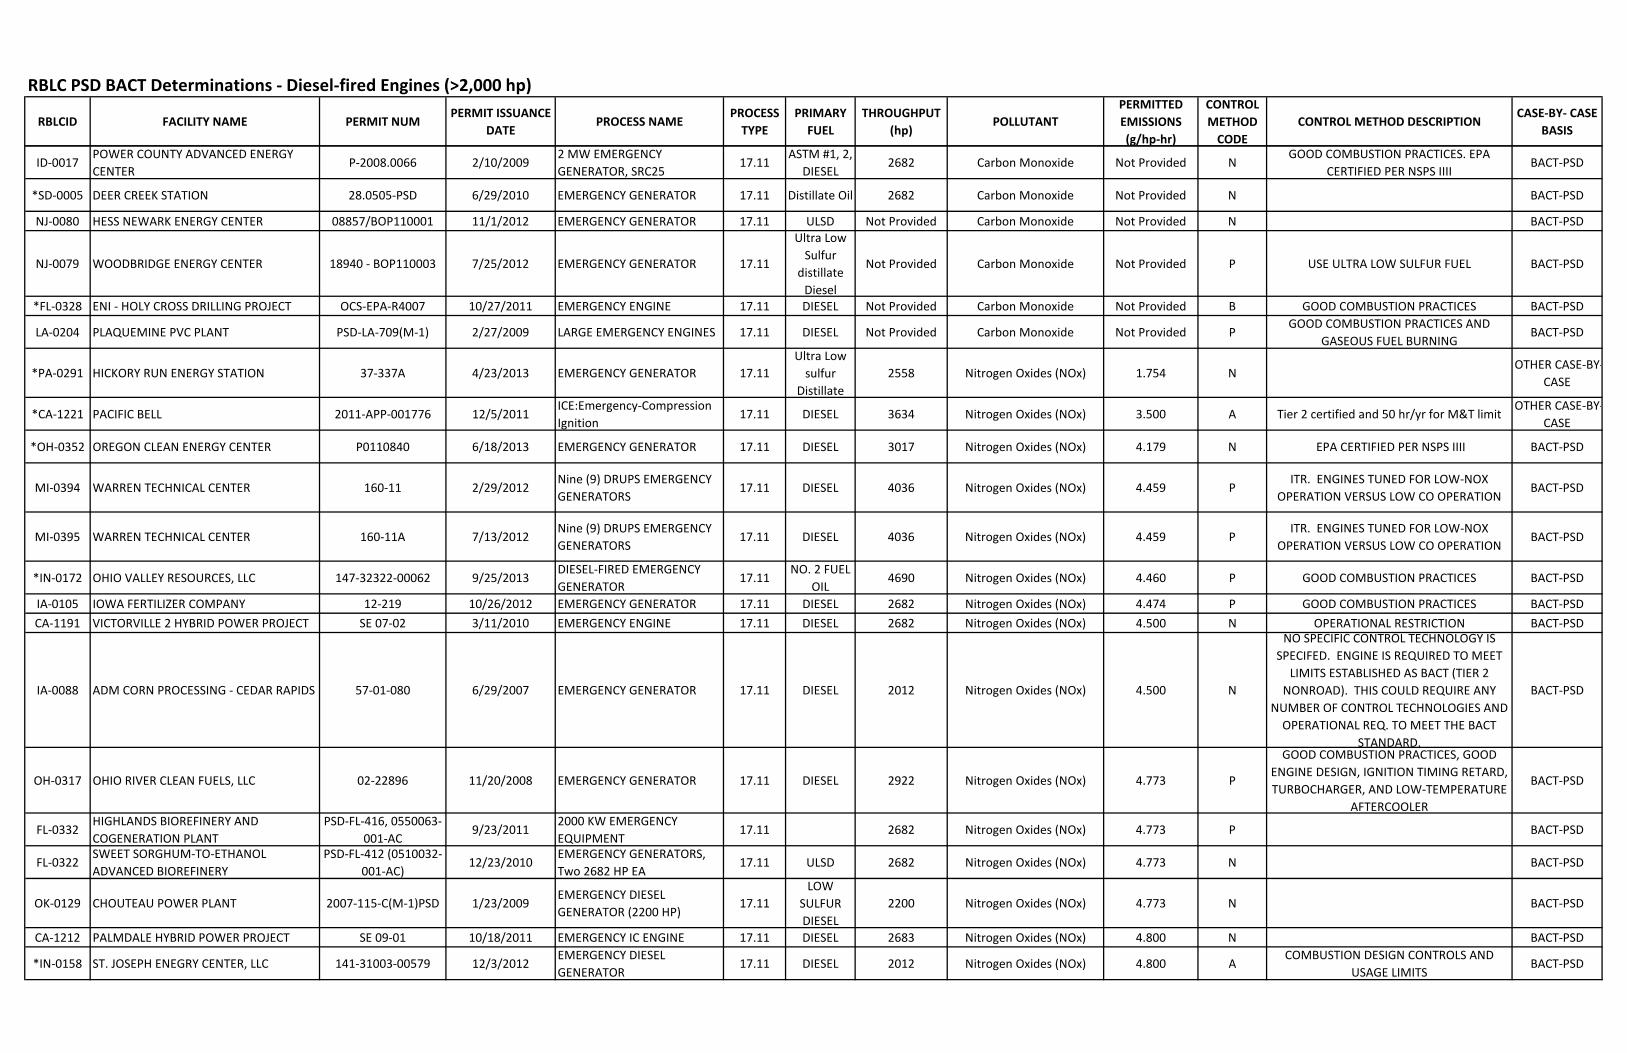
RBLC PSD BACT Determinations ‐ Diesel‐fired Engines (>2,000 hp)
RBLCID FACILITY NAME PERMIT NUMPERMIT ISSUANCE
DATEPROCESS NAME
PROCESS TYPE
PRIMARY FUEL
THROUGHPUT (hp)
POLLUTANTPERMITTED EMISSIONS(g/hp‐hr)
CONTROL METHOD CODE
CONTROL METHOD DESCRIPTIONCASE‐BY‐ CASE
BASIS
ID‐0017POWER COUNTY ADVANCED ENERGY CENTER
P‐2008.0066 2/10/20092 MW EMERGENCY GENERATOR, SRC25
17.11ASTM #1, 2,
DIESEL2682 Carbon Monoxide Not Provided N
GOOD COMBUSTION PRACTICES. EPA CERTIFIED PER NSPS IIII
BACT‐PSD
*SD‐0005 DEER CREEK STATION 28.0505‐PSD 6/29/2010 EMERGENCY GENERATOR 17.11 Distillate Oil 2682 Carbon Monoxide Not Provided N BACT‐PSD
NJ‐0080 HESS NEWARK ENERGY CENTER 08857/BOP110001 11/1/2012 EMERGENCY GENERATOR 17.11 ULSD Not Provided Carbon Monoxide Not Provided N BACT‐PSD
NJ‐0079 WOODBRIDGE ENERGY CENTER 18940 ‐ BOP110003 7/25/2012 EMERGENCY GENERATOR 17.11
Ultra Low Sulfur
distillate Diesel
Not Provided Carbon Monoxide Not Provided P USE ULTRA LOW SULFUR FUEL BACT‐PSD
*FL‐0328 ENI ‐ HOLY CROSS DRILLING PROJECT OCS‐EPA‐R4007 10/27/2011 EMERGENCY ENGINE 17.11 DIESEL Not Provided Carbon Monoxide Not Provided B GOOD COMBUSTION PRACTICES BACT‐PSD
LA‐0204 PLAQUEMINE PVC PLANT PSD‐LA‐709(M‐1) 2/27/2009 LARGE EMERGENCY ENGINES 17.11 DIESEL Not Provided Carbon Monoxide Not Provided PGOOD COMBUSTION PRACTICES AND
GASEOUS FUEL BURNINGBACT‐PSD
*PA‐0291 HICKORY RUN ENERGY STATION 37‐337A 4/23/2013 EMERGENCY GENERATOR 17.11Ultra Low sulfur
Distillate2558 Nitrogen Oxides (NOx) 1.754 N
OTHER CASE‐BY‐CASE
*CA‐1221 PACIFIC BELL 2011‐APP‐001776 12/5/2011ICE:Emergency‐Compression Ignition
17.11 DIESEL 3634 Nitrogen Oxides (NOx) 3.500 A Tier 2 certified and 50 hr/yr for M&T limitOTHER CASE‐BY‐
CASE
*OH‐0352 OREGON CLEAN ENERGY CENTER P0110840 6/18/2013 EMERGENCY GENERATOR 17.11 DIESEL 3017 Nitrogen Oxides (NOx) 4.179 N EPA CERTIFIED PER NSPS IIII BACT‐PSD
MI‐0394 WARREN TECHNICAL CENTER 160‐11 2/29/2012Nine (9) DRUPS EMERGENCY GENERATORS
17.11 DIESEL 4036 Nitrogen Oxides (NOx) 4.459 PITR. ENGINES TUNED FOR LOW‐NOX
OPERATION VERSUS LOW CO OPERATION BACT‐PSD
MI‐0395 WARREN TECHNICAL CENTER 160‐11A 7/13/2012Nine (9) DRUPS EMERGENCY GENERATORS
17.11 DIESEL 4036 Nitrogen Oxides (NOx) 4.459 PITR. ENGINES TUNED FOR LOW‐NOX
OPERATION VERSUS LOW CO OPERATION BACT‐PSD
*IN‐0172 OHIO VALLEY RESOURCES, LLC 147‐32322‐00062 9/25/2013DIESEL‐FIRED EMERGENCY GENERATOR
17.11NO. 2 FUEL
OIL4690 Nitrogen Oxides (NOx) 4.460 P GOOD COMBUSTION PRACTICES BACT‐PSD
IA‐0105 IOWA FERTILIZER COMPANY 12‐219 10/26/2012 EMERGENCY GENERATOR 17.11 DIESEL 2682 Nitrogen Oxides (NOx) 4.474 P GOOD COMBUSTION PRACTICES BACT‐PSDCA‐1191 VICTORVILLE 2 HYBRID POWER PROJECT SE 07‐02 3/11/2010 EMERGENCY ENGINE 17.11 DIESEL 2682 Nitrogen Oxides (NOx) 4.500 N OPERATIONAL RESTRICTION BACT‐PSD
IA‐0088 ADM CORN PROCESSING ‐ CEDAR RAPIDS 57‐01‐080 6/29/2007 EMERGENCY GENERATOR 17.11 DIESEL 2012 Nitrogen Oxides (NOx) 4.500 N
NO SPECIFIC CONTROL TECHNOLOGY IS SPECIFED. ENGINE IS REQUIRED TO MEET
LIMITS ESTABLISHED AS BACT (TIER 2 NONROAD). THIS COULD REQUIRE ANY
NUMBER OF CONTROL TECHNOLOGIES AND OPERATIONAL REQ. TO MEET THE BACT
STANDARD.
BACT‐PSD
OH‐0317 OHIO RIVER CLEAN FUELS, LLC 02‐22896 11/20/2008 EMERGENCY GENERATOR 17.11 DIESEL 2922 Nitrogen Oxides (NOx) 4.773 P
GOOD COMBUSTION PRACTICES, GOOD ENGINE DESIGN, IGNITION TIMING RETARD, TURBOCHARGER, AND LOW‐TEMPERATURE
AFTERCOOLER
BACT‐PSD
FL‐0332HIGHLANDS BIOREFINERY AND COGENERATION PLANT
PSD‐FL‐416, 0550063‐001‐AC
9/23/20112000 KW EMERGENCY EQUIPMENT
17.11 2682 Nitrogen Oxides (NOx) 4.773 P BACT‐PSD
FL‐0322SWEET SORGHUM‐TO‐ETHANOL ADVANCED BIOREFINERY
PSD‐FL‐412 (0510032‐001‐AC)
12/23/2010EMERGENCY GENERATORS, Two 2682 HP EA
17.11 ULSD 2682 Nitrogen Oxides (NOx) 4.773 N BACT‐PSD
OK‐0129 CHOUTEAU POWER PLANT 2007‐115‐C(M‐1)PSD 1/23/2009EMERGENCY DIESEL GENERATOR (2200 HP)
17.11LOW
SULFUR DIESEL
2200 Nitrogen Oxides (NOx) 4.773 N BACT‐PSD
CA‐1212 PALMDALE HYBRID POWER PROJECT SE 09‐01 10/18/2011 EMERGENCY IC ENGINE 17.11 DIESEL 2683 Nitrogen Oxides (NOx) 4.800 N BACT‐PSD
*IN‐0158 ST. JOSEPH ENEGRY CENTER, LLC 141‐31003‐00579 12/3/2012EMERGENCY DIESEL GENERATOR
17.11 DIESEL 2012 Nitrogen Oxides (NOx) 4.800 ACOMBUSTION DESIGN CONTROLS AND
USAGE LIMITSBACT‐PSD
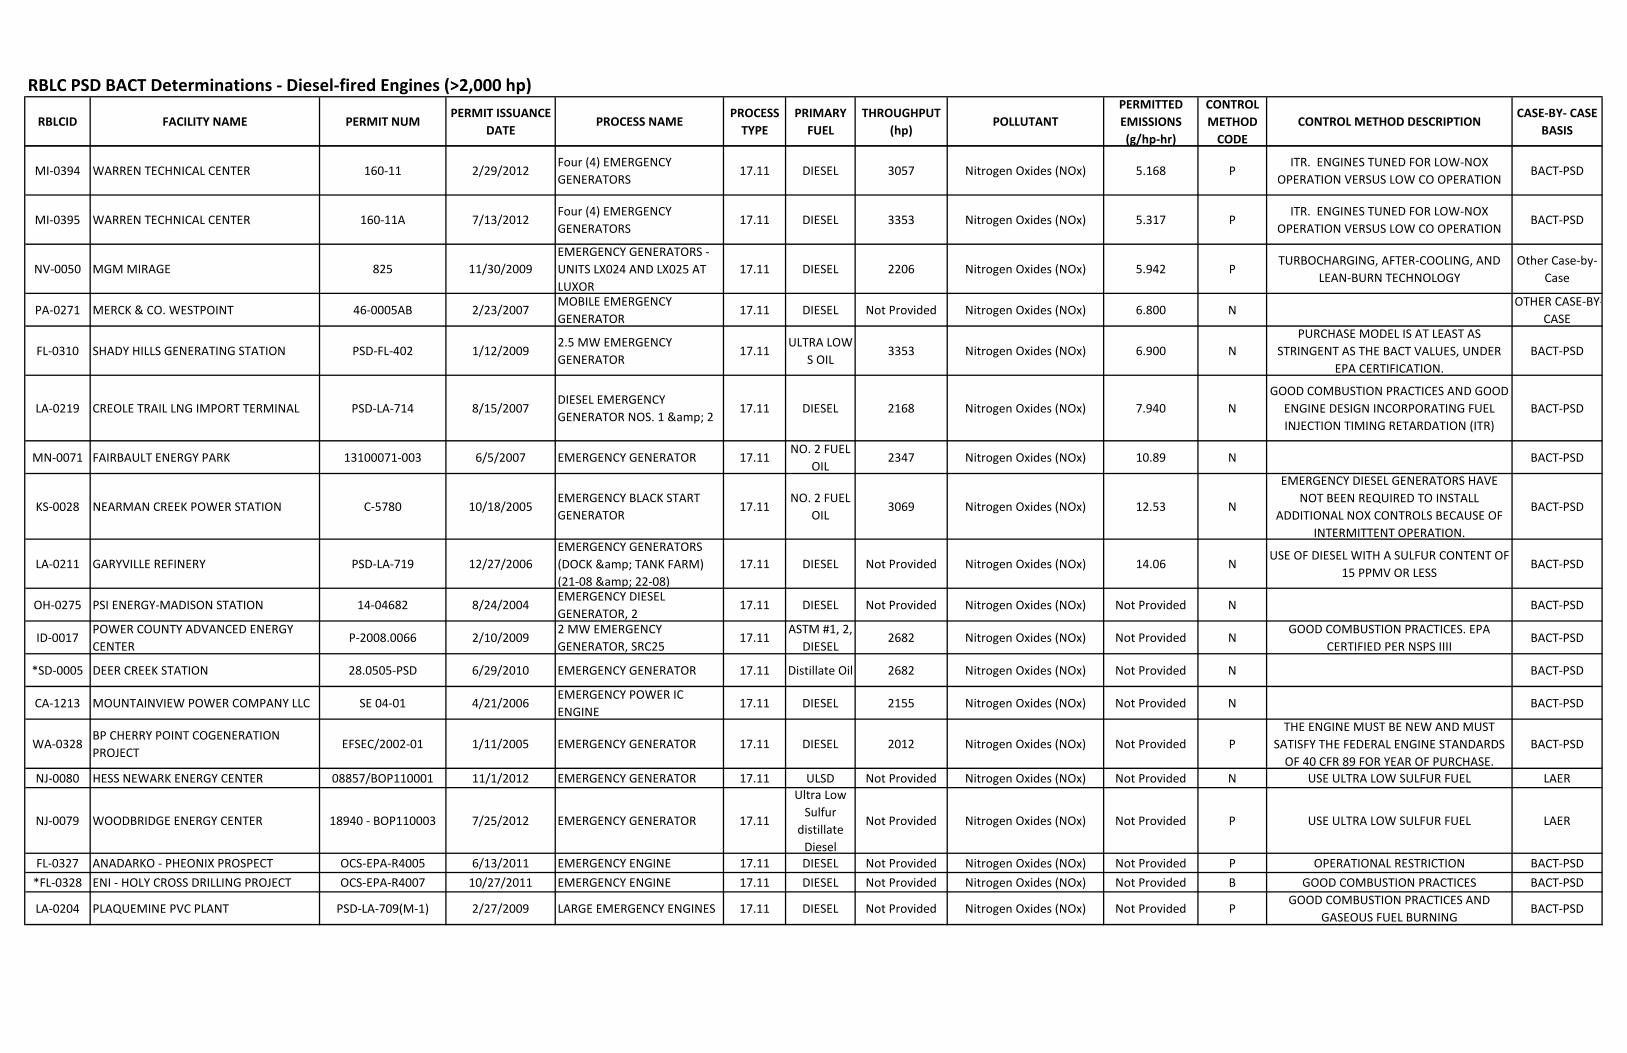
RBLC PSD BACT Determinations ‐ Diesel‐fired Engines (>2,000 hp)
RBLCID FACILITY NAME PERMIT NUMPERMIT ISSUANCE
DATEPROCESS NAME
PROCESS TYPE
PRIMARY FUEL
THROUGHPUT (hp)
POLLUTANTPERMITTED EMISSIONS(g/hp‐hr)
CONTROL METHOD CODE
CONTROL METHOD DESCRIPTIONCASE‐BY‐ CASE
BASIS
MI‐0394 WARREN TECHNICAL CENTER 160‐11 2/29/2012Four (4) EMERGENCY GENERATORS
17.11 DIESEL 3057 Nitrogen Oxides (NOx) 5.168 PITR. ENGINES TUNED FOR LOW‐NOX
OPERATION VERSUS LOW CO OPERATION BACT‐PSD
MI‐0395 WARREN TECHNICAL CENTER 160‐11A 7/13/2012Four (4) EMERGENCY GENERATORS
17.11 DIESEL 3353 Nitrogen Oxides (NOx) 5.317 PITR. ENGINES TUNED FOR LOW‐NOX
OPERATION VERSUS LOW CO OPERATION BACT‐PSD
NV‐0050 MGM MIRAGE 825 11/30/2009EMERGENCY GENERATORS ‐ UNITS LX024 AND LX025 AT LUXOR
17.11 DIESEL 2206 Nitrogen Oxides (NOx) 5.942 PTURBOCHARGING, AFTER‐COOLING, AND
LEAN‐BURN TECHNOLOGYOther Case‐by‐
Case
PA‐0271 MERCK & CO. WESTPOINT 46‐0005AB 2/23/2007MOBILE EMERGENCY GENERATOR
17.11 DIESEL Not Provided Nitrogen Oxides (NOx) 6.800 NOTHER CASE‐BY‐
CASE
FL‐0310 SHADY HILLS GENERATING STATION PSD‐FL‐402 1/12/20092.5 MW EMERGENCY GENERATOR
17.11ULTRA LOW
S OIL3353 Nitrogen Oxides (NOx) 6.900 N
PURCHASE MODEL IS AT LEAST AS STRINGENT AS THE BACT VALUES, UNDER
EPA CERTIFICATION.BACT‐PSD
LA‐0219 CREOLE TRAIL LNG IMPORT TERMINAL PSD‐LA‐714 8/15/2007DIESEL EMERGENCY GENERATOR NOS. 1 & 2
17.11 DIESEL 2168 Nitrogen Oxides (NOx) 7.940 NGOOD COMBUSTION PRACTICES AND GOOD
ENGINE DESIGN INCORPORATING FUEL INJECTION TIMING RETARDATION (ITR)
BACT‐PSD
MN‐0071 FAIRBAULT ENERGY PARK 13100071‐003 6/5/2007 EMERGENCY GENERATOR 17.11NO. 2 FUEL
OIL2347 Nitrogen Oxides (NOx) 10.89 N BACT‐PSD
KS‐0028 NEARMAN CREEK POWER STATION C‐5780 10/18/2005EMERGENCY BLACK START GENERATOR
17.11NO. 2 FUEL
OIL3069 Nitrogen Oxides (NOx) 12.53 N
EMERGENCY DIESEL GENERATORS HAVE NOT BEEN REQUIRED TO INSTALL
ADDITIONAL NOX CONTROLS BECAUSE OF INTERMITTENT OPERATION.
BACT‐PSD
LA‐0211 GARYVILLE REFINERY PSD‐LA‐719 12/27/2006EMERGENCY GENERATORS (DOCK & TANK FARM) (21‐08 & 22‐08)
17.11 DIESEL Not Provided Nitrogen Oxides (NOx) 14.06 NUSE OF DIESEL WITH A SULFUR CONTENT OF
15 PPMV OR LESSBACT‐PSD
OH‐0275 PSI ENERGY‐MADISON STATION 14‐04682 8/24/2004EMERGENCY DIESEL GENERATOR, 2
17.11 DIESEL Not Provided Nitrogen Oxides (NOx) Not Provided N BACT‐PSD
ID‐0017POWER COUNTY ADVANCED ENERGY CENTER
P‐2008.0066 2/10/20092 MW EMERGENCY GENERATOR, SRC25
17.11ASTM #1, 2,
DIESEL2682 Nitrogen Oxides (NOx) Not Provided N
GOOD COMBUSTION PRACTICES. EPA CERTIFIED PER NSPS IIII
BACT‐PSD
*SD‐0005 DEER CREEK STATION 28.0505‐PSD 6/29/2010 EMERGENCY GENERATOR 17.11 Distillate Oil 2682 Nitrogen Oxides (NOx) Not Provided N BACT‐PSD
CA‐1213 MOUNTAINVIEW POWER COMPANY LLC SE 04‐01 4/21/2006EMERGENCY POWER IC ENGINE
17.11 DIESEL 2155 Nitrogen Oxides (NOx) Not Provided N BACT‐PSD
WA‐0328BP CHERRY POINT COGENERATION PROJECT
EFSEC/2002‐01 1/11/2005 EMERGENCY GENERATOR 17.11 DIESEL 2012 Nitrogen Oxides (NOx) Not Provided PTHE ENGINE MUST BE NEW AND MUST
SATISFY THE FEDERAL ENGINE STANDARDS OF 40 CFR 89 FOR YEAR OF PURCHASE.
BACT‐PSD
NJ‐0080 HESS NEWARK ENERGY CENTER 08857/BOP110001 11/1/2012 EMERGENCY GENERATOR 17.11 ULSD Not Provided Nitrogen Oxides (NOx) Not Provided N USE ULTRA LOW SULFUR FUEL LAER
NJ‐0079 WOODBRIDGE ENERGY CENTER 18940 ‐ BOP110003 7/25/2012 EMERGENCY GENERATOR 17.11
Ultra Low Sulfur
distillate Diesel
Not Provided Nitrogen Oxides (NOx) Not Provided P USE ULTRA LOW SULFUR FUEL LAER
FL‐0327 ANADARKO ‐ PHEONIX PROSPECT OCS‐EPA‐R4005 6/13/2011 EMERGENCY ENGINE 17.11 DIESEL Not Provided Nitrogen Oxides (NOx) Not Provided P OPERATIONAL RESTRICTION BACT‐PSD*FL‐0328 ENI ‐ HOLY CROSS DRILLING PROJECT OCS‐EPA‐R4007 10/27/2011 EMERGENCY ENGINE 17.11 DIESEL Not Provided Nitrogen Oxides (NOx) Not Provided B GOOD COMBUSTION PRACTICES BACT‐PSD
LA‐0204 PLAQUEMINE PVC PLANT PSD‐LA‐709(M‐1) 2/27/2009 LARGE EMERGENCY ENGINES 17.11 DIESEL Not Provided Nitrogen Oxides (NOx) Not Provided PGOOD COMBUSTION PRACTICES AND
GASEOUS FUEL BURNINGBACT‐PSD

RBLC PSD BACT Determinations ‐ Diesel‐fired Engines (>2,000 hp)
RBLCID FACILITY NAME PERMIT NUMPERMIT ISSUANCE
DATEPROCESS NAME
PROCESS TYPE
PRIMARY FUEL
THROUGHPUT (hp)
POLLUTANTPERMITTED EMISSIONS(g/hp‐hr)
CONTROL METHOD CODE
CONTROL METHOD DESCRIPTIONCASE‐BY‐ CASE
BASIS
IA‐0088 ADM CORN PROCESSING ‐ CEDAR RAPIDS 57‐01‐080 6/29/2007 EMERGENCY GENERATOR 17.11 DIESEL 2012 Particulate Matter (PM) 0.1500 N
NO SPECIFIC CONTROL TECHNOLOGY IS SPECIFED. ENGINE IS REQUIRED TO MEET
LIMITS ESTABLISHED AS BACT (TIER 2 NONROAD). THIS COULD REQUIRE ANY
NUMBER OF CONTROL TECHNOLOGIES AND OPERATIONAL REQ. TO MEET THE BACT
STANDARD.
BACT‐PSD
MN‐0071 FAIRBAULT ENERGY PARK 13100071‐003 6/5/2007 EMERGENCY GENERATOR 17.11NO. 2 FUEL
OIL2347 Particulate Matter (PM) 0.3175 N BACT‐PSD
ID‐0017POWER COUNTY ADVANCED ENERGY CENTER
P‐2008.0066 2/10/20092 MW EMERGENCY GENERATOR, SRC25
17.11ASTM #1, 2,
DIESEL2682 Particulate Matter (PM) Not Provided N
ULSD FUEL, GOOD COMBUSTION PRACTICES, EPA CERTIFIED PER NSPS IIII
BACT‐PSD
*IN‐0158 ST. JOSEPH ENEGRY CENTER, LLC 141‐31003‐00579 12/3/2012EMERGENCY DIESEL GENERATOR
17.11 DIESEL 2012Particulate matter,
filterable < 2.5 µ (FPM2.5)
0.1500 ACOMBUSTION DESIGN CONTROLS AND
USAGE LIMITSBACT‐PSD
NJ‐0080 HESS NEWARK ENERGY CENTER 08857/BOP110001 11/1/2012 EMERGENCY GENERATOR 17.11 ULSD Not ProvidedParticulate matter,
filterable < 2.5 µ (FPM2.5)
Not Provided N USE ULTRA LOW SULFUR FUEL BACT‐PSD
NV‐0050 MGM MIRAGE 825 11/30/2009EMERGENCY GENERATORS ‐ UNITS LX024 AND LX025 AT LUXOR
17.11 DIESEL 2206Particulate matter,
filterable; <10 µ (FPM10)0.0454 P
TURBOCHARGER AND GOOD COMBUSTION PRACTICES
Other Case‐by‐Case
LA‐0219 CREOLE TRAIL LNG IMPORT TERMINAL PSD‐LA‐714 8/15/2007DIESEL EMERGENCY GENERATOR NOS. 1 & 2
17.11 DIESEL 2168Particulate matter,
filterable; <10 µ (FPM10)0.1444 N
GOOD COMBUSTION PRACTICES, GOOD ENGINE DESIGN, AND USE OF LOW SULFUR
AND LOW ASH DIESELBACT‐PSD
OH‐0317 OHIO RIVER CLEAN FUELS, LLC 02‐22896 11/20/2008 EMERGENCY GENERATOR 17.11 DIESEL 2922Particulate matter,
filterable; <10 µ (FPM10)0.1491 P
GOOD COMBUSTION PRACTICES AND GOOD ENGINE DESIGN
BACT‐PSD
*IN‐0158 ST. JOSEPH ENEGRY CENTER, LLC 141‐31003‐00579 12/3/2012EMERGENCY DIESEL GENERATOR
17.11 DIESEL 2012Particulate matter,
filterable; <10 µ (FPM10)0.1500 A
COMBUSTION DESIGN CONTROLS AND USAGE LIMITS
BACT‐PSD
IA‐0088 ADM CORN PROCESSING ‐ CEDAR RAPIDS 57‐01‐080 6/29/2007 EMERGENCY GENERATOR 17.11 DIESEL 2012Particulate matter,
filterable; <10 µ (FPM10)0.1500 N
NO SPECIFIC CONTROL TECHNOLOGY IS SPECIFED. ENGINE IS REQUIRED TO MEET
LIMITS ESTABLISHED AS BACT (TIER 2 NONROAD). THIS COULD REQUIRE ANY
NUMBER OF CONTROL TECHNOLOGIES AND OPERATIONAL REQ. TO MEET THE BACT
STANDARD.
BACT‐PSD
PA‐0271 MERCK & CO. WESTPOINT 46‐0005AB 2/23/2007MOBILE EMERGENCY GENERATOR
17.11 DIESEL Not ProvidedParticulate matter,
filterable; <10 µ (FPM10)0.1600 N
OTHER CASE‐BY‐CASE
MN‐0071 FAIRBAULT ENERGY PARK 13100071‐003 6/5/2007 EMERGENCY GENERATOR 17.11NO. 2 FUEL
OIL2347
Particulate matter, filterable; <10 µ (FPM10)
0.1814 N BACT‐PSD
LA‐0211 GARYVILLE REFINERY PSD‐LA‐719 12/27/2006EMERGENCY GENERATORS (DOCK & TANK FARM) (21‐08 & 22‐08)
17.11 DIESEL Not ProvidedParticulate matter,
filterable; <10 µ (FPM10)0.9979 N
USE OF DIESEL WITH A SULFUR CONTENT OF 15 PPMV OR LESS
BACT‐PSD
ID‐0017POWER COUNTY ADVANCED ENERGY CENTER
P‐2008.0066 2/10/20092 MW EMERGENCY GENERATOR, SRC25
17.11ASTM #1, 2,
DIESEL2682
Particulate matter, filterable; <10 µ (FPM10)
Not Provided NULSD FUEL, GOOD COMBUSTION
PRACTICES, EPA CERTIFIED PER NSPS IIIIBACT‐PSD
NJ‐0080 HESS NEWARK ENERGY CENTER 08857/BOP110001 11/1/2012 EMERGENCY GENERATOR 17.11 ULSD Not ProvidedParticulate matter,
filterable; <10 µ (FPM10)Not Provided N BACT‐PSD
IA‐0105 IOWA FERTILIZER COMPANY 12‐219 10/26/2012 EMERGENCY GENERATOR 17.11 DIESEL 2682Particulate matter, total
< 2.5 µ (TPM2.5)0.1491 P GOOD COMBUSTION PRACTICES BACT‐PSD
*IA‐0106CF INDUSTRIES NITROGEN, LLC ‐ PORT NEAL NITROGEN COMPLEX
PN 13‐037 7/12/2013 EMERGENCY GENERATORS 17.11 DIESEL Not ProvidedParticulate matter, total
< 2.5 µ (TPM2.5)0.1491 P GOOD COMBUSTION PRACTICES BACT‐PSD

RBLC PSD BACT Determinations ‐ Diesel‐fired Engines (>2,000 hp)
RBLCID FACILITY NAME PERMIT NUMPERMIT ISSUANCE
DATEPROCESS NAME
PROCESS TYPE
PRIMARY FUEL
THROUGHPUT (hp)
POLLUTANTPERMITTED EMISSIONS(g/hp‐hr)
CONTROL METHOD CODE
CONTROL METHOD DESCRIPTIONCASE‐BY‐ CASE
BASIS
CA‐1212 PALMDALE HYBRID POWER PROJECT SE 09‐01 10/18/2011 EMERGENCY IC ENGINE 17.11 DIESEL 2683Particulate matter, total
< 2.5 µ (TPM2.5)0.1500 N USE ULTRA LOW SULFUR FUEL BACT‐PSD
CA‐1191 VICTORVILLE 2 HYBRID POWER PROJECT SE 07‐02 3/11/2010 EMERGENCY ENGINE 17.11 DIESEL 2682Particulate matter, total
< 2.5 µ (TPM2.5)0.1500 N
OPERATIONAL RESTRICTION OF 50 HR/YR; USE OF ULTRA LOW SULFUR FUEL NOT TO
EXCEED 15 PPMVDBACT‐PSD
*MI‐0400 WOLVERINE POWER 317‐07 6/29/2011 EMERGENCY GENERATOR 17.11 DIESEL 4000Particulate matter, total
< 2.5 µ (TPM2.5)0.1996 N BACT‐PSD
*IN‐0172 OHIO VALLEY RESOURCES, LLC 147‐32322‐00062 9/25/2013DIESEL‐FIRED EMERGENCY GENERATOR
17.11NO. 2 FUEL
OIL4690
Particulate matter, total < 2.5 µ (TPM2.5)
68.04 P GOOD COMBUSTION PRACTICES BACT‐PSD
NJ‐0079 WOODBRIDGE ENERGY CENTER 18940 ‐ BOP110003 7/25/2012 EMERGENCY GENERATOR 17.11
Ultra Low Sulfur
distillate Diesel
Not ProvidedParticulate matter, total
< 2.5 µ (TPM2.5)Not Provided P USE ULTRA LOW SULFUR FUEL
OTHER CASE‐BY‐CASE
*OH‐0352 OREGON CLEAN ENERGY CENTER P0110840 6/18/2013 EMERGENCY GENERATOR 17.11 DIESEL 3017Particulate matter, total
<10 µ (TPM10)0.1488 N EPA CERTIFIED PER NSPS IIII BACT‐PSD
IA‐0105 IOWA FERTILIZER COMPANY 12‐219 10/26/2012 EMERGENCY GENERATOR 17.11 DIESEL 2682Particulate matter, total
<10 µ (TPM10)0.1491 P GOOD COMBUSTION PRACTICES BACT‐PSD
OK‐0129 CHOUTEAU POWER PLANT 2007‐115‐C(M‐1)PSD 1/23/2009EMERGENCY DIESEL GENERATOR (2200 HP)
17.11LOW
SULFUR DIESEL
2200Particulate matter, total
<10 µ (TPM10)0.1491 N BACT‐PSD
*IA‐0106CF INDUSTRIES NITROGEN, LLC ‐ PORT NEAL NITROGEN COMPLEX
PN 13‐037 7/12/2013 EMERGENCY GENERATORS 17.11 DIESEL Not ProvidedParticulate matter, total
<10 µ (TPM10)0.1491 P GOOD COMBUSTION PRACTICES BACT‐PSD
*IN‐0172 OHIO VALLEY RESOURCES, LLC 147‐32322‐00062 9/25/2013DIESEL‐FIRED EMERGENCY GENERATOR
17.11NO. 2 FUEL
OIL4690
Particulate matter, total <10 µ (TPM10)
0.1500 P GOOD COMBUSTION PRACTICES BACT‐PSD
CA‐1212 PALMDALE HYBRID POWER PROJECT SE 09‐01 10/18/2011 EMERGENCY IC ENGINE 17.11 DIESEL 2683Particulate matter, total
<10 µ (TPM10)0.1500 N USE ULTRA LOW SULFUR FUEL BACT‐PSD
*MI‐0400 WOLVERINE POWER 317‐07 6/29/2011 EMERGENCY GENERATOR 17.11 DIESEL 4000Particulate matter, total
<10 µ (TPM10)0.1996 N BACT‐PSD
FL‐0310 SHADY HILLS GENERATING STATION PSD‐FL‐402 1/12/20092.5 MW EMERGENCY GENERATOR
17.11ULTRA LOW
S OIL3353
Particulate matter, total <10 µ (TPM10)
0.4000 N
FIRING ULSO WITH A MAXIMUM SULFUR CONTENT OF 0.0015% BY WEIGHT AND A MAXIMUM HOURS OF OPERATION OF 500
HOUR/YR.
BACT‐PSD
FL‐0310 SHADY HILLS GENERATING STATION PSD‐FL‐402 1/12/20092.5 MW EMERGENCY GENERATOR
17.11ULTRA LOW
S OIL3353
Particulate matter, total <10 µ (TPM10)
0.4000 N
FIRING ULSO WITH A MAXIMUM SULFUR CONTENT OF 0.0015% BY WEIGHT AND A MAXIMUM HOURS OF OPERATION OF 500
HOUR/YR.
BACT‐PSD
MI‐0389 KARN WEADOCK GENERATING COMPLEX 341‐07 12/29/2009 EMERGENCY GENERATOR 17.11ULTRA LOW SULFUR DIESEL
2682Particulate matter, total
<10 µ (TPM10)Not Provided P
ENGINE DESIGN AND OPERATION. 15 PPM SULFUR FUEL.
BACT‐PSD
NJ‐0079 WOODBRIDGE ENERGY CENTER 18940 ‐ BOP110003 7/25/2012 EMERGENCY GENERATOR 17.11
Ultra Low Sulfur
distillate Diesel
Not ProvidedParticulate matter, total
<10 µ (TPM10)Not Provided P USE ULTRA LOW SULFUR FUEL
OTHER CASE‐BY‐CASE
LA‐0204 PLAQUEMINE PVC PLANT PSD‐LA‐709(M‐1) 2/27/2009 LARGE EMERGENCY ENGINES 17.11 DIESEL Not ProvidedParticulate matter, total
<10 µ (TPM10)Not Provided P
GOOD COMBUSTION PRACTICES AND GASEOUS FUEL BURNING
BACT‐PSD
NV‐0050 MGM MIRAGE 825 11/30/2009EMERGENCY GENERATORS ‐ UNITS LX024 AND LX025 AT LUXOR
17.11 DIESEL 2206Volatile Organic
Compounds (VOC)0.1361 P
TURBOCHARGER AND GOOD COMBUSTION PRACTICES
Other Case‐by‐Case

RBLC PSD BACT Determinations ‐ Diesel‐fired Engines (>2,000 hp)
RBLCID FACILITY NAME PERMIT NUMPERMIT ISSUANCE
DATEPROCESS NAME
PROCESS TYPE
PRIMARY FUEL
THROUGHPUT (hp)
POLLUTANTPERMITTED EMISSIONS(g/hp‐hr)
CONTROL METHOD CODE
CONTROL METHOD DESCRIPTIONCASE‐BY‐ CASE
BASIS
*IN‐0158 ST. JOSEPH ENEGRY CENTER, LLC 141‐31003‐00579 12/3/2012EMERGENCY DIESEL GENERATOR
17.11 DIESEL 2012Volatile Organic
Compounds (VOC)0.2345 A
COMBUSTION DESIGN CONTROLS AND USAGE LIMITS
BACT‐PSD
IA‐0105 IOWA FERTILIZER COMPANY 12‐219 10/26/2012 EMERGENCY GENERATOR 17.11 DIESEL 2682Volatile Organic
Compounds (VOC)0.2983 P GOOD COMBUSTION PRACTICES BACT‐PSD
IA‐0088 ADM CORN PROCESSING ‐ CEDAR RAPIDS 57‐01‐080 6/29/2007 EMERGENCY GENERATOR 17.11 DIESEL 2012Volatile Organic
Compounds (VOC)0.3000 N
NO SPECIFIC CONTROL TECHNOLOGY IS SPECIFED. ENGINE IS REQUIRED TO MEET
LIMITS ESTABLISHED AS BACT (TIER 2 NONROAD). THIS COULD REQUIRE ANY
NUMBER OF CONTROL TECHNOLOGIES AND OPERATIONAL REQ. TO MEET THE BACT
STANDARD.
BACT‐PSD
*IN‐0172 OHIO VALLEY RESOURCES, LLC 147‐32322‐00062 9/25/2013DIESEL‐FIRED EMERGENCY GENERATOR
17.11NO. 2 FUEL
OIL4690
Volatile Organic Compounds (VOC)
0.3100 P GOOD COMBUSTION PRACTICES BACT‐PSD
MN‐0071 FAIRBAULT ENERGY PARK 13100071‐003 6/5/2007 EMERGENCY GENERATOR 17.11NO. 2 FUEL
OIL2347
Volatile Organic Compounds (VOC)
0.3175 N BACT‐PSD
OK‐0129 CHOUTEAU POWER PLANT 2007‐115‐C(M‐1)PSD 1/23/2009EMERGENCY DIESEL GENERATOR (2200 HP)
17.11LOW
SULFUR DIESEL
2200Volatile Organic
Compounds (VOC)0.3196 N GOOD COMBUSTION PRACTICES BACT‐PSD
PA‐0271 MERCK & CO. WESTPOINT 46‐0005AB 2/23/2007MOBILE EMERGENCY GENERATOR
17.11 DIESEL Not ProvidedVolatile Organic
Compounds (VOC)0.3200 N
OTHER CASE‐BY‐CASE
LA‐0219 CREOLE TRAIL LNG IMPORT TERMINAL PSD‐LA‐714 8/15/2007DIESEL EMERGENCY GENERATOR NOS. 1 & 2
17.11 DIESEL 2168Volatile Organic
Compounds (VOC)0.3494 N
GOOD COMBUSTION PRACTICES AND GOOD ENGINE DESIGN
BACT‐PSD
*OH‐0352 OREGON CLEAN ENERGY CENTER P0110840 6/18/2013 EMERGENCY GENERATOR 17.11 DIESEL 3017Volatile Organic
Compounds (VOC)0.5908 N EPA CERTIFIED PER NSPS IIII BACT‐PSD
LA‐0211 GARYVILLE REFINERY PSD‐LA‐719 12/27/2006EMERGENCY GENERATORS (DOCK & TANK FARM) (21‐08 & 22‐08)
17.11 DIESEL Not ProvidedVolatile Organic
Compounds (VOC)1.134 N
USE OF DIESEL WITH A SULFUR CONTENT OF 15 PPMV OR LESS
BACT‐PSD
*IA‐0106CF INDUSTRIES NITROGEN, LLC ‐ PORT NEAL NITROGEN COMPLEX
PN 13‐037 7/12/2013 EMERGENCY GENERATORS 17.11 DIESEL Not ProvidedVolatile Organic
Compounds (VOC)2.983 P GOOD COMBUSTION PRACTICES BACT‐PSD
OH‐0317 OHIO RIVER CLEAN FUELS, LLC 02‐22896 11/20/2008 EMERGENCY GENERATOR 17.11 DIESEL 2922Volatile Organic
Compounds (VOC)4.773 P
GOOD COMBUSTION PRACTICES AND GOOD ENGINE DESIGN
BACT‐PSD
NJ‐0080 HESS NEWARK ENERGY CENTER 08857/BOP110001 11/1/2012 EMERGENCY GENERATOR 17.11 ULSD Not ProvidedVolatile Organic
Compounds (VOC)Not Provided N USE ULTRA LOW SULFUR FUEL LAER
NJ‐0079 WOODBRIDGE ENERGY CENTER 18940 ‐ BOP110003 7/25/2012 EMERGENCY GENERATOR 17.11 ULSD Not ProvidedVolatile Organic
Compounds (VOC)Not Provided P USE ULTRA LOW SULFUR FUEL LAER
*FL‐0328 ENI ‐ HOLY CROSS DRILLING PROJECT OCS‐EPA‐R4007 10/27/2011 EMERGENCY ENGINE 17.11 DIESEL Not ProvidedVolatile Organic
Compounds (VOC)Not Provided B GOOD COMBUSTION PRACTICES BACT‐PSD

RBLC PSD BACT Determinations ‐ Process Flares
RBLCID FACILITY NAME PERMIT NUMPERMIT ISSUANCE
DATEPROCESS NAME
PROCESS TYPE
PRIMARY FUEL
THROUGHPUT POLLUTANTPERMITTED
LIMIT
CONTROL METHOD CODE
CONTROL METHOD DESCRIPTIONCASE‐BY‐CASE
BASIS
*TX‐0638 MONT BELVIEU COMPLEX PSD‐TX‐1286‐GHG 10/12/2012 Flare 19.39Not
ProvidedNot Provided Carbon Dioxide 62494 TONS/YR N BACT‐PSD
AK‐0076 POINT THOMSON PRODUCTION FACILITY AQ1201CPT01 8/20/2012 Combustion (Flares) 19.39 Fuel Gas 35 MMscf/yr Carbon Dioxide Not Provided P Good Combustion Practices BACT‐PSD
*IN‐0166 INDIANA GASIFICATION, LLC T147‐30464‐00060 6/27/2012 Syngas Hydrocarbon Flare 19.39 Syngas 0.27 MMBTU/H Carbon Dioxide Not Provided P FLARE MINIMIZATION PLAN BACT‐PSD
LA‐0257 SABINE PASS LNG TERMINAL PSD‐LA‐703(M3) 12/6/2011 Wet/Dry Gas Flares (4) 19.39 Natural Gas 0.26 MMBTU/HCarbon Dioxide Equivalent
(CO2e)133 TONS/YR P
proper plant operations and maintain the presence of the flame when the gas is
routed to the flareBACT‐PSD
*LA‐0266 EUNICE GAS EXTRACTION PLANT PSD‐LA‐569(M‐1) 5/1/2013Smokeless Flare (14) (EQT 0028)
19.39Not
ProvidedNot Provided
Carbon Dioxide Equivalent (CO2e)
Not Provided P Good combustion practices BACT‐PSD
*LA‐0271 PLAQUEMINE NGL FRACTIONATION PLANT PSD‐LA‐771 5/24/2013 Process Flare (FLARE‐01) 19.39 Waste gas 26 MMBTU/HCarbon Dioxide Equivalent
(CO2e)Not Provided P
Clean burning fuels, proper design and operation, and good combustion
practicesBACT‐PSD
*LA‐0271 PLAQUEMINE NGL FRACTIONATION PLANT PSD‐LA‐771 5/24/2013Emergency Flare (FLARE‐02)
19.39 Natural Gas 2 MMBTU/HCarbon Dioxide Equivalent
(CO2e)Not Provided P
Clean burning fuels, proper design and operation, and good combustion
practicesBACT‐PSD
CA‐1171 BREITBURN ENERGY‐ NEWLOVE LEASE ATC13000 7/17/2009 Horizontal Enclosed Flare 19.39 Field gas 50 MMBTU/H Carbon Monoxide0.0371
LB/MMBTUP Forced draft enclosed flare BACT‐PSD
LA‐0257 SABINE PASS LNG TERMINAL PSD‐LA‐703(M3) 12/6/2011 Wet/Dry Gas Flares (4) 19.39 Natural Gas 0.26 MMBTU/H Carbon Monoxide 0.11 LB/H Pproper plant operations and maintain the presence of the flame when the gas is
routed to the flareBACT‐PSD
AK‐0076 POINT THOMSON PRODUCTION FACILITY AQ1201CPT01 8/20/2012 Combustion (Flares) 19.39 Fuel Gas 35 MMscf/yr Carbon Monoxide0.37
LB/MMBTUN BACT‐PSD
AK‐0078 NORTHSTAR PRODUCTION FACILITY AQ0503CPT07 10/24/2012 Flaring of Fuel gas 19.39 Fuel Gas 25.5 MMscf/yr Carbon Monoxide0.37
LB/MMBTUB
Limit CO emissions to 0.37 lb/MMBtu by using air‐assist, sonic, smokeless flare
technologyBACT‐PSD
*IN‐0166 INDIANA GASIFICATION, LLC T147‐30464‐00060 6/27/2012 Syngas Hydrocarbon Flare 19.39 Syngas 0.27 MMBTU/H Carbon Monoxide 172.4 LB/H PPROPER DESIGN AND OPERATION FLARE
MINIMIZATION PLANBACT‐PSD
CA‐1171 BREITBURN ENERGY‐ NEWLOVE LEASE ATC13000 7/17/2009 Horizontal Enclosed Flare 19.39 Field gas 50 MMBTU/H Nitrogen Oxides (NOx)0.0146
LB/MMBTUP Forced draft enclosed flare. BACT‐PSD
CA‐1187 PETROROCK‐ TUNNELL LEASE ATC‐ 12949‐01 1/24/2012 Enclosed Ground Flare 19.39 Field Gas 17 MMBTU/H Nitrogen Oxides (NOx)0.019
LB/MMBTUP
Burner design, premix, and combustion temperature control
OTHER CASE‐BY‐CASE
LA‐0257 SABINE PASS LNG TERMINAL PSD‐LA‐703(M3) 12/6/2011 Wet/Dry Gas Flares (4) 19.39 Natural Gas 0.26 MMBTU/H Nitrogen Oxides (NOx) 0.03 LB/H Pproper plant operations and maintain the presence of the flame when the gas is
routed to the flareBACT‐PSD
AK‐0076 POINT THOMSON PRODUCTION FACILITY AQ1201CPT01 8/20/2012 Combustion (Flares) 19.39 Fuel Gas 35 MMscf/yr Nitrogen Oxides (NOx)0.068
LB/MMBTUN BACT‐PSD
*IN‐0166 INDIANA GASIFICATION, LLC T147‐30464‐00060 6/27/2012 Syngas Hydrocarbon Flare 19.39 Syngas 0.27 MMBTU/H Nitrogen Oxides (NOx) 43.09 LB/H P FLARING MINIMIZATION PLAN BACT‐PSD
*IN‐0166 INDIANA GASIFICATION, LLC T147‐30464‐00060 6/27/2012 Syngas Hydrocarbon Flare 19.39 Syngas 0.27 MMBTU/HParticulate matter, filterable
(FPM)3.21 LB/H P
PROPER DESIGN AND OPERATION FLARE MINIMIZATION PLAN
BACT‐PSD
LA‐0257 SABINE PASS LNG TERMINAL PSD‐LA‐703(M3) 12/6/2011 Wet/Dry Gas Flares (4) 19.39 Natural Gas 0.26 MMBTU/HParticulate matter, total
(TPM)0.01 LB/H P
proper plant operations and maintain the presence of the flame when the gas is
routed to the flareBACT‐PSD
*IN‐0166 INDIANA GASIFICATION, LLC T147‐30464‐00060 6/27/2012 Syngas Hydrocarbon Flare 19.39 Syngas 0.27 MMBTU/HParticulate matter, total <10
µ (TPM10)3.21 LB/H P
PROPER DESIGN AND OPERATION FLARE MINIMIZATION PLAN
BACT‐PSD
AK‐0076 POINT THOMSON PRODUCTION FACILITY AQ1201CPT01 8/20/2012 Combustion (Flares) 19.39 Fuel Gas 35 MMscf/yrParticulate matter, total <2.5
µ (TPM2.5)0.0264
LB/MMBTUN BACT‐PSD
*IN‐0166 INDIANA GASIFICATION, LLC T147‐30464‐00060 6/27/2012 Syngas Hydrocarbon Flare 19.39 Syngas 0.27 MMBTU/HParticulate matter, total <2.5
µ (TPM2.5)3.01 LB/H P
PROPER DESIGN AND OPERATION FLARE MINIMIZATION PLAN
BACT‐PSD

RBLC PSD BACT Determinations ‐ Process Flares
RBLCID FACILITY NAME PERMIT NUMPERMIT ISSUANCE
DATEPROCESS NAME
PROCESS TYPE
PRIMARY FUEL
THROUGHPUT POLLUTANTPERMITTED
LIMIT
CONTROL METHOD CODE
CONTROL METHOD DESCRIPTIONCASE‐BY‐CASE
BASIS
CA‐1171 BREITBURN ENERGY‐ NEWLOVE LEASE ATC13000 7/17/2009 Horizontal Enclosed Flare 19.39 Field gas 50 MMBTU/HVolatile Organic Compounds
(VOC)0.0013
LB/MMBTUP Forced draft enclosed flare BACT‐PSD
LA‐0257 SABINE PASS LNG TERMINAL PSD‐LA‐703(M3) 12/6/2011 Wet/Dry Gas Flares (4) 19.39 Natural Gas 0.26 MMBTU/HVolatile Organic Compounds
(VOC)0.01 LB/H P
proper plant operations and maintain the presence of the flame when the gas is
routed to the flareBACT‐PSD
CA‐1187 PETROROCK‐ TUNNELL LEASE ATC‐ 12949‐01 1/24/2012 Enclosed Ground Flare 19.39 Field Gas 17 MMBTU/HVolatile Organic Compounds
(VOC)10 ppmvd P
Burner design, premix, and combustion temperature control
OTHER CASE‐BY‐CASE
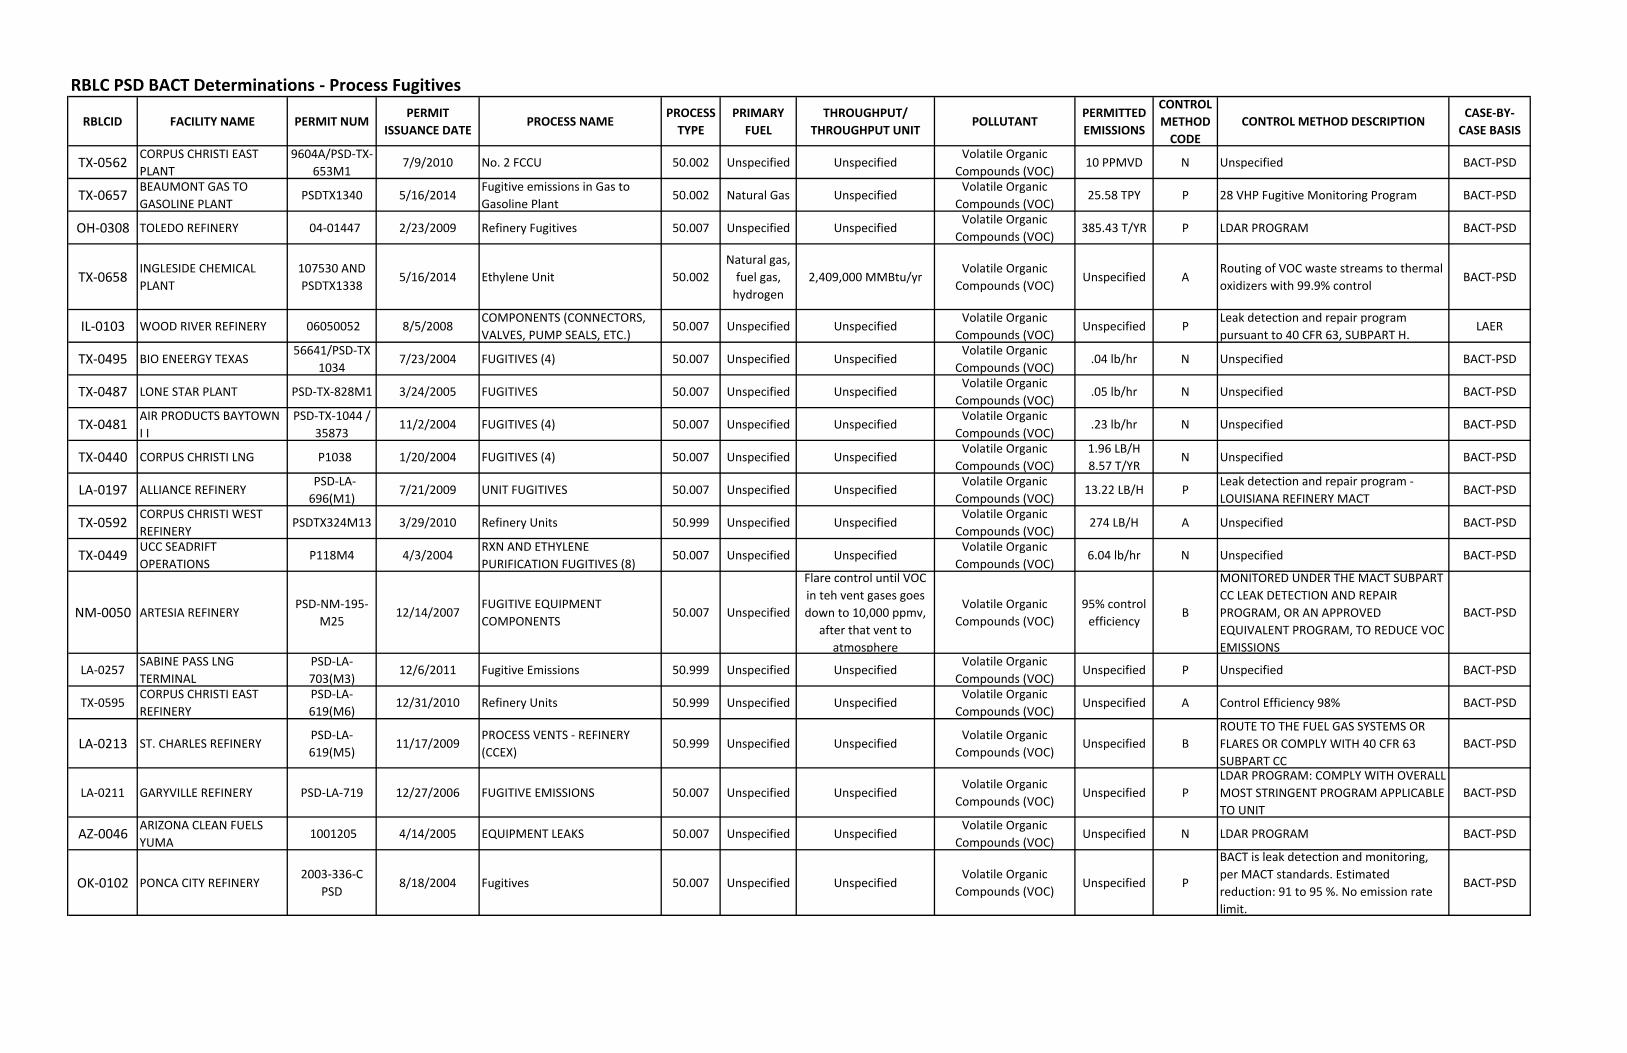
RBLC PSD BACT Determinations ‐ Process Fugitives
RBLCID FACILITY NAME PERMIT NUMPERMIT
ISSUANCE DATEPROCESS NAME
PROCESS TYPE
PRIMARY FUEL
THROUGHPUT/ THROUGHPUT UNIT
POLLUTANTPERMITTED EMISSIONS
CONTROL METHOD CODE
CONTROL METHOD DESCRIPTIONCASE‐BY‐ CASE BASIS
TX‐0562 CORPUS CHRISTI EAST PLANT
9604A/PSD‐TX‐653M1
7/9/2010 No. 2 FCCU 50.002 Unspecified UnspecifiedVolatile Organic Compounds (VOC)
10 PPMVD N Unspecified BACT‐PSD
TX‐0657 BEAUMONT GAS TO GASOLINE PLANT
PSDTX1340 5/16/2014Fugitive emissions in Gas to Gasoline Plant
50.002 Natural Gas UnspecifiedVolatile Organic Compounds (VOC)
25.58 TPY P 28 VHP Fugitive Monitoring Program BACT‐PSD
OH‐0308 TOLEDO REFINERY 04‐01447 2/23/2009 Refinery Fugitives 50.007 Unspecified UnspecifiedVolatile Organic Compounds (VOC)
385.43 T/YR P LDAR PROGRAM BACT‐PSD
TX‐0658INGLESIDE CHEMICAL PLANT
107530 AND PSDTX1338
5/16/2014 Ethylene Unit 50.002Natural gas, fuel gas, hydrogen
2,409,000 MMBtu/yrVolatile Organic Compounds (VOC)
Unspecified ARouting of VOC waste streams to thermal oxidizers with 99.9% control
BACT‐PSD
IL‐0103 WOOD RIVER REFINERY 06050052 8/5/2008COMPONENTS (CONNECTORS, VALVES, PUMP SEALS, ETC.)
50.007 Unspecified UnspecifiedVolatile Organic Compounds (VOC)
Unspecified PLeak detection and repair program pursuant to 40 CFR 63, SUBPART H.
LAER
TX‐0495 BIO ENEERGY TEXAS56641/PSD‐TX
10347/23/2004 FUGITIVES (4) 50.007 Unspecified Unspecified
Volatile Organic Compounds (VOC)
.04 lb/hr N Unspecified BACT‐PSD
TX‐0487 LONE STAR PLANT PSD‐TX‐828M1 3/24/2005 FUGITIVES 50.007 Unspecified UnspecifiedVolatile Organic Compounds (VOC)
.05 lb/hr N Unspecified BACT‐PSD
TX‐0481 AIR PRODUCTS BAYTOWN I I
PSD‐TX‐1044 / 35873
11/2/2004 FUGITIVES (4) 50.007 Unspecified UnspecifiedVolatile Organic Compounds (VOC)
.23 lb/hr N Unspecified BACT‐PSD
TX‐0440 CORPUS CHRISTI LNG P1038 1/20/2004 FUGITIVES (4) 50.007 Unspecified UnspecifiedVolatile Organic Compounds (VOC)
1.96 LB/H 8.57 T/YR
N Unspecified BACT‐PSD
LA‐0197 ALLIANCE REFINERY PSD‐LA‐696(M1)
7/21/2009 UNIT FUGITIVES 50.007 Unspecified UnspecifiedVolatile Organic Compounds (VOC)
13.22 LB/H PLeak detection and repair program ‐ LOUISIANA REFINERY MACT
BACT‐PSD
TX‐0592 CORPUS CHRISTI WEST REFINERY
PSDTX324M13 3/29/2010 Refinery Units 50.999 Unspecified UnspecifiedVolatile Organic Compounds (VOC)
274 LB/H A Unspecified BACT‐PSD
TX‐0449 UCC SEADRIFT OPERATIONS
P118M4 4/3/2004RXN AND ETHYLENE PURIFICATION FUGITIVES (8)
50.007 Unspecified UnspecifiedVolatile Organic Compounds (VOC)
6.04 lb/hr N Unspecified BACT‐PSD
NM‐0050 ARTESIA REFINERYPSD‐NM‐195‐
M2512/14/2007
FUGITIVE EQUIPMENT COMPONENTS
50.007 Unspecified
Flare control until VOC in teh vent gases goes down to 10,000 ppmv,
after that vent to atmosphere
Volatile Organic Compounds (VOC)
95% control efficiency
B
MONITORED UNDER THE MACT SUBPART CC LEAK DETECTION AND REPAIR PROGRAM, OR AN APPROVED EQUIVALENT PROGRAM, TO REDUCE VOC EMISSIONS
BACT‐PSD
LA‐0257SABINE PASS LNG TERMINAL
PSD‐LA‐703(M3)
12/6/2011 Fugitive Emissions 50.999 Unspecified UnspecifiedVolatile Organic Compounds (VOC)
Unspecified P Unspecified BACT‐PSD
TX‐0595CORPUS CHRISTI EAST REFINERY
PSD‐LA‐619(M6)
12/31/2010 Refinery Units 50.999 Unspecified UnspecifiedVolatile Organic Compounds (VOC)
Unspecified A Control Efficiency 98% BACT‐PSD
LA‐0213 ST. CHARLES REFINERYPSD‐LA‐619(M5)
11/17/2009PROCESS VENTS ‐ REFINERY (CCEX)
50.999 Unspecified UnspecifiedVolatile Organic Compounds (VOC)
Unspecified BROUTE TO THE FUEL GAS SYSTEMS OR FLARES OR COMPLY WITH 40 CFR 63 SUBPART CC
BACT‐PSD
LA‐0211 GARYVILLE REFINERY PSD‐LA‐719 12/27/2006 FUGITIVE EMISSIONS 50.007 Unspecified UnspecifiedVolatile Organic Compounds (VOC)
Unspecified PLDAR PROGRAM: COMPLY WITH OVERALL MOST STRINGENT PROGRAM APPLICABLE TO UNIT
BACT‐PSD
AZ‐0046 ARIZONA CLEAN FUELS YUMA
1001205 4/14/2005 EQUIPMENT LEAKS 50.007 Unspecified UnspecifiedVolatile Organic Compounds (VOC)
Unspecified N LDAR PROGRAM BACT‐PSD
OK‐0102 PONCA CITY REFINERY2003‐336‐C
PSD8/18/2004 Fugitives 50.007 Unspecified Unspecified
Volatile Organic Compounds (VOC)
Unspecified P
BACT is leak detection and monitoring, per MACT standards. Estimated reduction: 91 to 95 %. No emission rate limit.
BACT‐PSD

RBLC PSD BACT Determinations ‐ Storage Tanks
RBLCID FACILITY NAME PERMIT NUMPERMIT ISSUANCE
DATEPROCESS NAME
PROCESS
TYPE
PRIMARY
FUEL
TANK SIZE
(GALLONS)POLLUTANT
PERMITTED
LIMIT
CONTROL
METHOD
CODE
CONTROL METHOD DESCRIPTIONCASE‐BY‐CASE
BASIS
IN-0158 ST. JOSEPH ENEGRY CENTER, LLC 141-31003-00579 12/3/2012FIRE PUMP ENGINE ULSD
TANKS42.005 DIESEL 70
Volatile Organic
Compounds (VOC)None Listed P
GOOD COMBUSTION PRACTICE AND FUEL
SPECIFICATIONBACT-PSD
IN-0158 ST. JOSEPH ENEGRY CENTER, LLC 141-31003-00579 12/3/2012EMERGENCY GENERATOR
ULSD TANK42.005 DIESEL 300
Volatile Organic
Compounds (VOC)None Listed P
GOOD COMBUSTION PRACTICE AND FUEL
SPECIFICATIONBACT-PSD
IN-0158 ST. JOSEPH ENEGRY CENTER, LLC 141-31003-00579 12/3/2012EMERGENCY GENERATOR
ULSD TANKS42.005 DIESEL 550
Volatile Organic
Compounds (VOC)None Listed P
GOOD DESIGN AND OPERATING
PRACTICESBACT-PSD
IN-0158 ST. JOSEPH ENEGRY CENTER, LLC 141-31003-00579 12/3/2012 VEHICLE DIESEL TANK 42.005 DIESEL 650Volatile Organic
Compounds (VOC)None Listed P
GOOD COMBUSTION PRACTICE AND FUEL
SPECIFICATIONBACT-PSD
WI-0227PORT WASHINGTON GENERATING
STATION04-RV-175 10/13/2004
FUEL OIL STORAGE TANK
(T01)42.005 DIESEL 2,000
Volatile Organic
Compounds (VOC)0 P
FIXED ROOF TANK WITH SUBMERGED FILL
PIPE. TANK MAY ONLY BE USED TO STORE
DISTILLATE FUEL OIL
BACT-PSD
LA-0203 OAKDALE OSB PLANT PSD-LA-710 6/13/2005 10,000 GAL DIESEL TANK 42.005 DIESEL 10,000Volatile Organic
Compounds (VOC)0 P SUBMERGED FILL PIPE BACT-PSD
OH-0317 OHIO RIVER CLEAN FUELS, LLC 02-22896 11/20/2008 FIXED ROOF TANKS (8) 42.005 DIESEL 3,000,000Volatile Organic
Compounds (VOC)1 P SUBMERGED FILL BACT-PSD
LA-0228BATON ROUGE JUNCTION
FACILITYPSD-LA-741(M1) 11/2/2009
EQT031-EQT035 FIVE
DISTILLATE TANKS (T006-
T010)
42.005 DIESEL 7,560,000Volatile Organic
Compounds (VOC)45 P
SUBMERGED FILL PIPES AND
PRESSURE/VACUUM VENTSBACT-PSD
LA-0237 ST. ROSE TERMINAL PSD-LA-736(M-2) 5/20/2010HEAVY FUEL OIL STORAGE
TANKS (18)42.005 FUEL OIL 4,220,000
Volatile Organic
Compounds (VOC)68 P FIXED ROOF BACT-PSD
IN-0158 ST. JOSEPH ENEGRY CENTER, LLC 141-31003-00579 12/3/2012VEHICLE GASOLINE
DISPENSING TANK42.005 GASOLINE 650
Volatile Organic
Compounds (VOC)None Listed A
SUBMERGED FILL PIPES AND STAGE 1
VAPOR CONTROLBACT-PSD
NV-0050 MGM MIRAGE 825 11/30/2009
GASOLINE STORAGE AND
DISPENSING STATION -
UNIT BE108 AT BELLAGIO
42.003 GASOLINE 3,700Volatile Organic
Compounds (VOC)
3.3 TPY
Including
Dispensing
ASTAGE 1 VAPOR RECOVERY SYSTEM FOR
GASOLINE DELIVERY TO THE TANKOther
LA-0203 OAKDALE OSB PLANT PSD-LA-710 6/13/20055000 GAL GASOLINE TANKS
(2)42.005 GASOLINE 5,000
Volatile Organic
Compounds (VOC)0 P SUBMERGED FILL PIPE BACT-PSD

RBLC PSD BACT Determinations ‐ Fuel Dispensing Operations
RBLCID FACILITY NAME PERMIT NUMPERMIT
ISSUANCE DATEPROCESS NAME
PROCESS
TYPE
PRIMARY
FUEL
THROUGHPUT
(GALLONS/
YEAR)
POLLUTANT
PERMITTED
LIMIT
(LB/1,000 GAL)
CONTROL
METHOD
CODE
CONTROL METHOD DESCRIPTIONCASE‐BY‐CASE
BASIS
NV-0050 MGM MIRAGE 825 11/30/2009GASOLINE STORAGE AND DISPENSING
STATION - UNIT BE108 AT BELLAGIO42.003 GASOLINE 316,800
Volatile Organic Compounds
(VOC)3.3 A
STAGE 1 VAPOR RECOVERY SYSTEM FOR
GASOLINE DELIVERY TO THE TANK AND
STAGE 2 VAPOR CONTROL SYSTEM FOR
GASOLINE DISPENSING
Other
OH-0279DAIMLER CHRYSLER CORPORATION
ASSEMBLY PLANT04-01359 9/2/2004 GASOLINE DISPENSING FACILITY 42.005 GASOLINE 2,500,000
Volatile Organic Compounds
(VOC)2.48 A
SUBMERGED FILL, VAPOR BALANCE OR
VAPOR CONTROL SYSTEMLAER
NV-0047 NELLIS AIR FORCE BASE 114 2/26/2008FUEL TANKS/LOADING RACKS/FUEL
DISPENSING42.005 GASOLINE 3,000,000
Volatile Organic Compounds
(VOC)3.3 B
STAGE 1 AND STAGE 2 VAPOR RECOVERY
SYSTEMS AND LIMIT OF REID VAPOR
PRESSURE TO 10 PSI
Other