Embed Size (px)
Citation preview
ATSB ROAD SAFETY REPORT
July 2006
Deaths of cyclists due to road crashes

ATSB ROAD SAFETY REPORT
July 2006
Deaths of cyclists due to road crashes

– ii –
Published by: Australian Transport Safety Bureau
Postal address: PO Box 967, Civic Square ACT 2608
Office location: 15 Mort Street, Canberra City, Australian Capital Territory
Telephone: 1800 621 372; from overseas + 61 2 6274 6590
Accident and serious incident notification: 1800 011 034 (24 hours)
Facsimile: 02 6274 6474; from overseas + 61 2 6274 6474
E-mail: [email protected]
Internet: www.atsb.gov.au
© Commonwealth of Australia 2006.
This work is copyright. In the interests of enhancing the value of the information contained in this
publication you may copy, download, display, print, reproduce and distribute this material in
unaltered form (retaining this notice). However, copyright in the material obtained from non-
Commonwealth agencies, private individuals or organisations, belongs to those agencies,
individuals or organisations. Where you want to use their material you will need to contact them
directly.
Subject to the provisions of the Copyright Act 1968, you must not make any other use of the
material in this publication unless you have the permission of the Australian Transport Safety
Bureau.
Please direct requests for further information or authorisation to:
Commonwealth Copyright Administration, Copyright Law Branch
Attorney-General’s Department, Robert Garran Offices, National Circuit, Barton ACT 2600
www.ag.gov.au/cca
ISBN and formal report title: see ‘Document retrieval information’ on page iii.
– iii –
DOCUMENT RETRIEVAL INFORMATION
Publication date
July 2006
No. of pages
19
ISBN
0 642 25540 7
ISSN
Publication title
Deaths of cyclists due to road crashes
Prepared by
Australian Transport Safety Bureau
PO Box 967, Civic Square ACT 2608 Australia
www.atsb.gov.au
Abstract
The report gives an overview of the circumstances of road crashes in which cyclists died in the
period 1991 to 2005 and provides more detail for 1996 to 2004, the latest period for which
detailed data were available. It examines the incidence of helmet wearing among cyclist deaths,
the major factors in fatal crashes involving cyclists and the main crash types. Age and gender
distributions, day of week, time of day and speed limit at the crash site are also examined.

– iv –
– v –
THE AUSTRALIAN TRANSPORT SAFETY BUREAU
The Australian Transport Safety Bureau (ATSB) is an operationally independent
multi-modal Bureau within the Australian Government Department of Transport
and Regional Services. ATSB investigations are independent of regulatory, operator
or other external bodies.
The ATSB is responsible for investigating accidents and other transport safety
matters involving civil aviation, marine and rail operations in Australia that fall
within Commonwealth jurisdiction, as well as participating in overseas
investigations involving Australian registered aircraft and ships. A primary concern
is the safety of commercial transport, with particular regard to fare-paying
passenger operations. Accordingly, the ATSB also conducts investigations and
studies of the transport system to identify underlying factors and trends that have
the potential to adversely affect safety.
The ATSB performs its functions in accordance with the provisions of the
Transport Safety Investigation Act 2003 and, where applicable, relevant
international agreements. The object of a safety investigation is to determine the
circumstances to prevent other similar events. The results of these determinations
form the basis for safety action, including recommendations where necessary. As
with equivalent overseas organisations, the ATSB has no power to implement its
recommendations.
It is not the object of an investigation to determine blame or liability. However, it
should be recognised that an investigation report must include factual material of
sufficient weight to support the analysis and findings. That material will at times
contain information reflecting on the performance of individuals and organisations,
and how their actions may have contributed to the outcomes of the matter under
investigation. At all times the ATSB endeavours to balance the use of material that
could imply adverse comment with the need to properly explain what happened,
and why, in a fair and unbiased manner.
Central to the ATSB’s investigation of transport safety matters is the early
identification of safety issues in the transport environment. While the Bureau issues
recommendations to regulatory authorities, industry, or other agencies in order to
address safety issues, its preference is for organisations to make safety
enhancements during the course of an investigation. The Bureau is pleased to report
positive safety action in its final reports rather than make formal recommendations.
Recommendations may be issued in conjunction with ATSB reports or
independently. A safety issue may lead to a number of similar recommendations,
each issued to a different agency.
The ATSB does not have the resources to carry out a full cost-benefit analysis of
each safety recommendation. The cost of a recommendation must be balanced
against its benefits to safety, and transport safety involves the whole community.
Such analysis is a matter for the body to which the recommendation is addressed
(for example, the relevant regulatory authority in aviation, marine or rail in
consultation with the industry).

– vi –
– 1 –
INTRODUCTION
Though there are no comprehensive indicators of the extent of use of bicycles (or
pedal cycles) for transport in Australia, there is some evidence suggesting the
growing popularity of cycling for commuting to work and school and for recreation.
For example, the Exercise, Recreation and Sport Survey results for 2004 show that
cycling is the fourth most popular activity – after walking, aerobics/fitness and
swimming – with a 15 per cent increase in participants since 2001.1 It has also been
reported by Bicycle Industries Australia that the number of bicycles sold in 2005
was 13 per cent greater than the number of motor vehicles sold and that more than a
million bicycles were sold in Australia each year from 2002 to 20052. Anecdotal
evidence suggests that the rising cost of fuel in 2006 has further increased the
popularity of cycling.
Cyclists ride on the road reserve and on cycle paths outside the road reserve. The
‘road reserve’ is the entire width between abutting property boundaries, including
footpaths and cycle paths, where the way is open to the public for travel purposes in
a range of vehicles as a matter of right or custom. This report focuses on the deaths
of cyclists who were riding on the road reserve at the time of the crash, as this is
where road safety regulatory authorities can have an influence and where over 95
per cent of cyclist deaths occur. (Unpublished Australian Bureau of Statistics (ABS)
‘cause of death’ data obtained by the ATSB reveal that fewer than 4 per cent of
cyclist deaths occur in off-road or ‘non-traffic’ locations.)
Two earlier reports by the ATSB on cyclist safety focused on helmet wearing3.
Compulsory helmet wearing was introduced Australia-wide between 1990 and 1992
and both of these earlier reports concluded that bicycle helmets can help prevent
fatal and non-fatal injury of cyclists involved in road crashes. One of the aims of
this report is to examine the incidence of helmet wearing among cyclists killed in
road crashes in more recent years.
Another report by the ATSB in 2004 on cyclist safety, based on data for 2000 and
2001, showed that cyclists account for about 11 per cent of persons seriously
injured in road crashes each year4. More recent serious injury data are presently not
available and this report is therefore limited to fatal crashes only.
Cycling has significant health and environmental benefits for the community, but
cycling on the roads has risks that need to be recognised by cyclists and motorists
alike. By examining the circumstances surrounding fatal crashes involving cyclists,
all road users can learn something useful about sharing the road.
1 The Exercise, Recreation and Sport Survey, available at www.ausport.gov.au, is a joint initiative
of the Australian Sports Commission and state and territory departments of sport and recreation
and was first conducted in 2001.
2 See www.cyclingpromotion.com
3 Federal Office of Road Safety (FORS) Helmet wearing and cyclist safety (FORS, Canberra, 1997)
and ATSB, Bicycle helmets and injury prevention: a formal review (ATSB, Canberra, 2000)
4 ATSB, Cycle safety (ATSB, Canberra, 2004)
– 2 –
Main findings
• From 1996 to 2000, nearly one-third of all male cyclists and nearly half of male
cyclists in the 10 to 19 age group killed in road crashes were not wearing a
helmet. Similarly, nearly one-third of all female cyclists killed in road crashes in
the period were not wearing a helmet. For 2001 to 2004, helmet usage in over
half the cases was unknown, but in the 48 cases where it was known, 30 of the
cyclists were wearing a helmet and 18 were not.
• The most frequently assigned major factor in fatal road crashes involving
cyclists in the period 1996 to 2004 was the failure of cyclists and other road
users to observe each other on the road. For cyclists, their visibility remains a
key safety issue.
• The most common type of crash in which cyclists were fatally injured was the
cyclist being hit from behind by a motor vehicle travelling in the same lane in
the same direction. Cyclists riding on rural roads are particularly at risk of being
run over from behind. From 1996 to 2004, there were at least 58 cases where a
cyclist was run over by a motor vehicle coming from behind. This kind of crash
occurred in urban as well as in rural areas but 38 cases occurred on rural roads,
most during the day.
• The next most common crash type was the cyclist riding from the footway into
an intersection or onto a road and being hit by an oncoming motor vehicle.
Cyclist deaths – an overview
Since the 1990s, cyclist deaths in road crashes have constituted on average between
2 and 3 per cent of the total deaths in road crashes in Australia. In the 1990s, the
number of cyclist deaths ranged from 40 to 80 per year. In the 2000s so far (2000 to
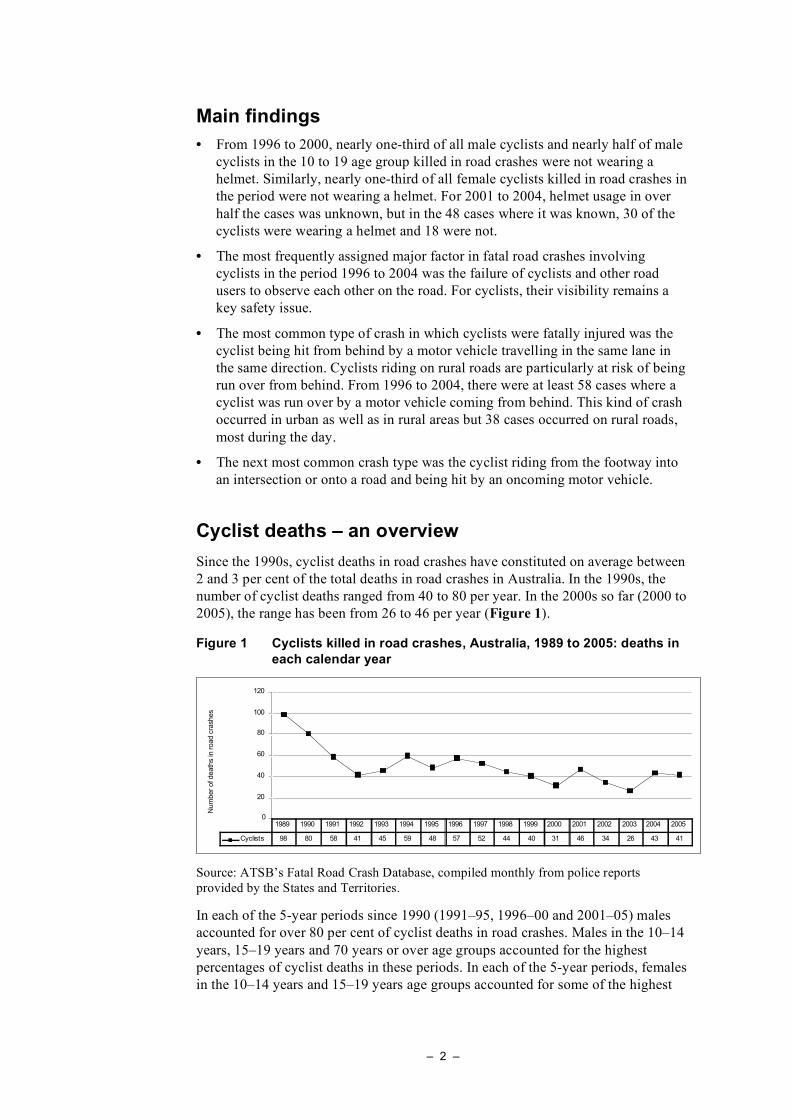
2005), the range has been from 26 to 46 per year (Figure 1).
Figure 1 Cyclists killed in road crashes, Australia, 1989 to 2005: deaths in
each calendar year
0
20
40
60
80
100
120
Num
ber
of death
s in
road c
rashes
Cyclists 98 80 58 41 45 59 48 57 52 44 40 31 46 34 26 43 41
1989 1990 1991 1992 1993 1994 1995 1996 1997 1998 1999 2000 2001 2002 2003 2004 2005
Source: ATSB’s Fatal Road Crash Database, compiled monthly from police reports
provided by the States and Territories.
In each of the 5-year periods since 1990 (1991–95, 1996–00 and 2001–05) males
accounted for over 80 per cent of cyclist deaths in road crashes. Males in the 10–14
years, 15–19 years and 70 years or over age groups accounted for the highest
percentages of cyclist deaths in these periods. In each of the 5-year periods, females
in the 10–14 years and 15–19 years age groups accounted for some of the highest
– 3 –
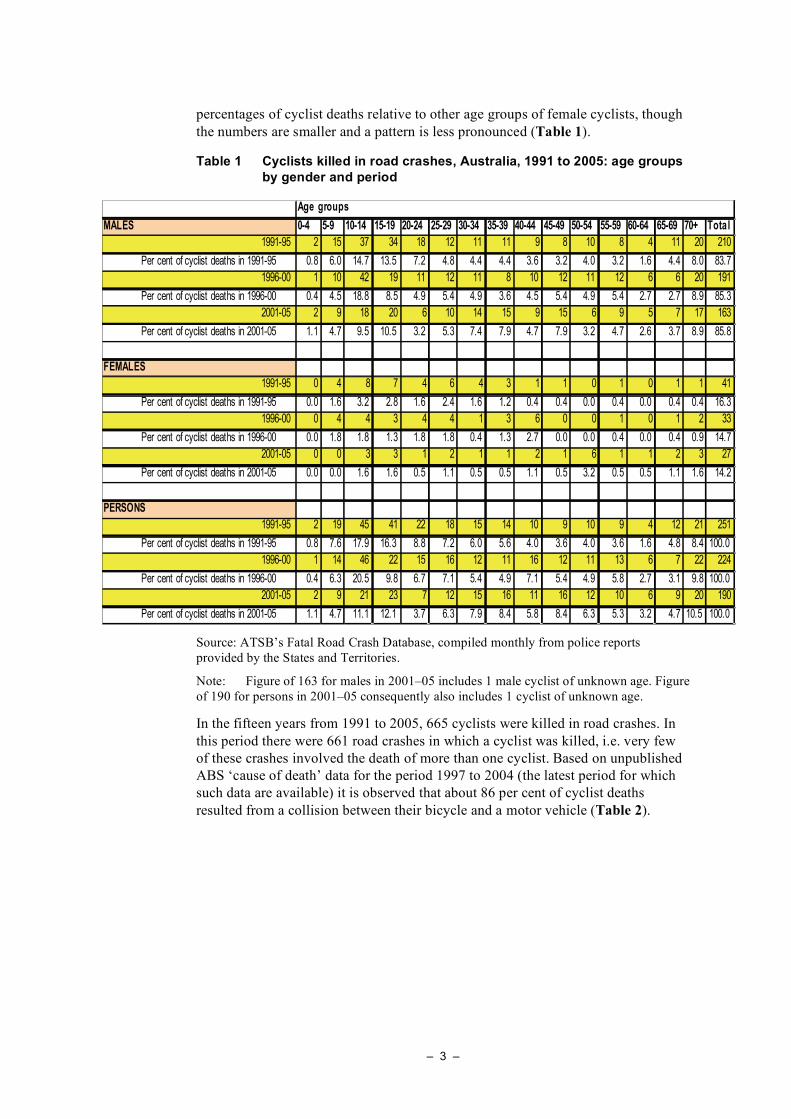
percentages of cyclist deaths relative to other age groups of female cyclists, though
the numbers are smaller and a pattern is less pronounced (Table 1).
Table 1 Cyclists killed in road crashes, Australia, 1991 to 2005: age groups
by gender and period
MALES 0-4 5-9 10-14 15-19 20-24 25-29 30-34 35-39 40-44 45-49 50-54 55-59 60-64 65-69 70+ Total
1991-95 2 15 37 34 18 12 11 11 9 8 10 8 4 11 20 210
Per cent of cyclist deaths in 1991-95 0.8 6.0 14.7 13.5 7.2 4.8 4.4 4.4 3.6 3.2 4.0 3.2 1.6 4.4 8.0 83.7
1996-00 1 10 42 19 11 12 11 8 10 12 11 12 6 6 20 191
Per cent of cyclist deaths in 1996-00 0.4 4.5 18.8 8.5 4.9 5.4 4.9 3.6 4.5 5.4 4.9 5.4 2.7 2.7 8.9 85.3
2001-05 2 9 18 20 6 10 14 15 9 15 6 9 5 7 17 163
Per cent of cyclist deaths in 2001-05 1.1 4.7 9.5 10.5 3.2 5.3 7.4 7.9 4.7 7.9 3.2 4.7 2.6 3.7 8.9 85.8
FEMALES
1991-95 0 4 8 7 4 6 4 3 1 1 0 1 0 1 1 41
Per cent of cyclist deaths in 1991-95 0.0 1.6 3.2 2.8 1.6 2.4 1.6 1.2 0.4 0.4 0.0 0.4 0.0 0.4 0.4 16.3
1996-00 0 4 4 3 4 4 1 3 6 0 0 1 0 1 2 33
Per cent of cyclist deaths in 1996-00 0.0 1.8 1.8 1.3 1.8 1.8 0.4 1.3 2.7 0.0 0.0 0.4 0.0 0.4 0.9 14.7
2001-05 0 0 3 3 1 2 1 1 2 1 6 1 1 2 3 27
Per cent of cyclist deaths in 2001-05 0.0 0.0 1.6 1.6 0.5 1.1 0.5 0.5 1.1 0.5 3.2 0.5 0.5 1.1 1.6 14.2
PERSONS
1991-95 2 19 45 41 22 18 15 14 10 9 10 9 4 12 21 251
Per cent of cyclist deaths in 1991-95 0.8 7.6 17.9 16.3 8.8 7.2 6.0 5.6 4.0 3.6 4.0 3.6 1.6 4.8 8.4 100.0
1996-00 1 14 46 22 15 16 12 11 16 12 11 13 6 7 22 224
Per cent of cyclist deaths in 1996-00 0.4 6.3 20.5 9.8 6.7 7.1 5.4 4.9 7.1 5.4 4.9 5.8 2.7 3.1 9.8 100.0
2001-05 2 9 21 23 7 12 15 16 11 16 12 10 6 9 20 190
Per cent of cyclist deaths in 2001-05 1.1 4.7 11.1 12.1 3.7 6.3 7.9 8.4 5.8 8.4 6.3 5.3 3.2 4.7 10.5 100.0
Age groups
Source: ATSB’s Fatal Road Crash Database, compiled monthly from police reports
provided by the States and Territories.
Note: Figure of 163 for males in 2001–05 includes 1 male cyclist of unknown age. Figure
of 190 for persons in 2001–05 consequently also includes 1 cyclist of unknown age.
In the fifteen years from 1991 to 2005, 665 cyclists were killed in road crashes. In
this period there were 661 road crashes in which a cyclist was killed, i.e. very few
of these crashes involved the death of more than one cyclist. Based on unpublished
ABS ‘cause of death’ data for the period 1997 to 2004 (the latest period for which
such data are available) it is observed that about 86 per cent of cyclist deaths
resulted from a collision between their bicycle and a motor vehicle (Table 2).
– 4 –
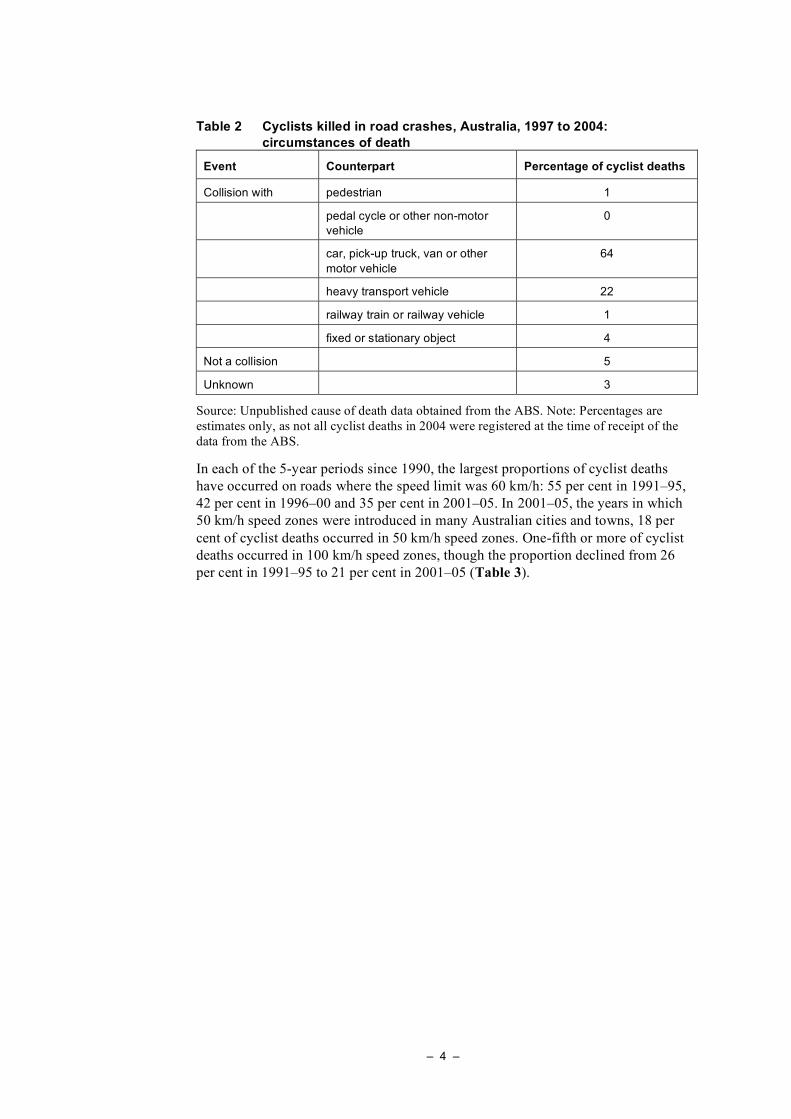
Table 2 Cyclists killed in road crashes, Australia, 1997 to 2004:
circumstances of death
Event Counterpart Percentage of cyclist deaths
Collision with pedestrian 1
pedal cycle or other non-motor
vehicle
0
car, pick-up truck, van or other
motor vehicle
64
heavy transport vehicle 22
railway train or railway vehicle 1
fixed or stationary object 4
Not a collision 5
Unknown 3
Source: Unpublished cause of death data obtained from the ABS. Note: Percentages are
estimates only, as not all cyclist deaths in 2004 were registered at the time of receipt of the
data from the ABS.
In each of the 5-year periods since 1990, the largest proportions of cyclist deaths
have occurred on roads where the speed limit was 60 km/h: 55 per cent in 1991–95,
42 per cent in 1996–00 and 35 per cent in 2001–05. In 2001–05, the years in which
50 km/h speed zones were introduced in many Australian cities and towns, 18 per
cent of cyclist deaths occurred in 50 km/h speed zones. One-fifth or more of cyclist
deaths occurred in 100 km/h speed zones, though the proportion declined from 26
per cent in 1991–95 to 21 per cent in 2001–05 (Table 3).
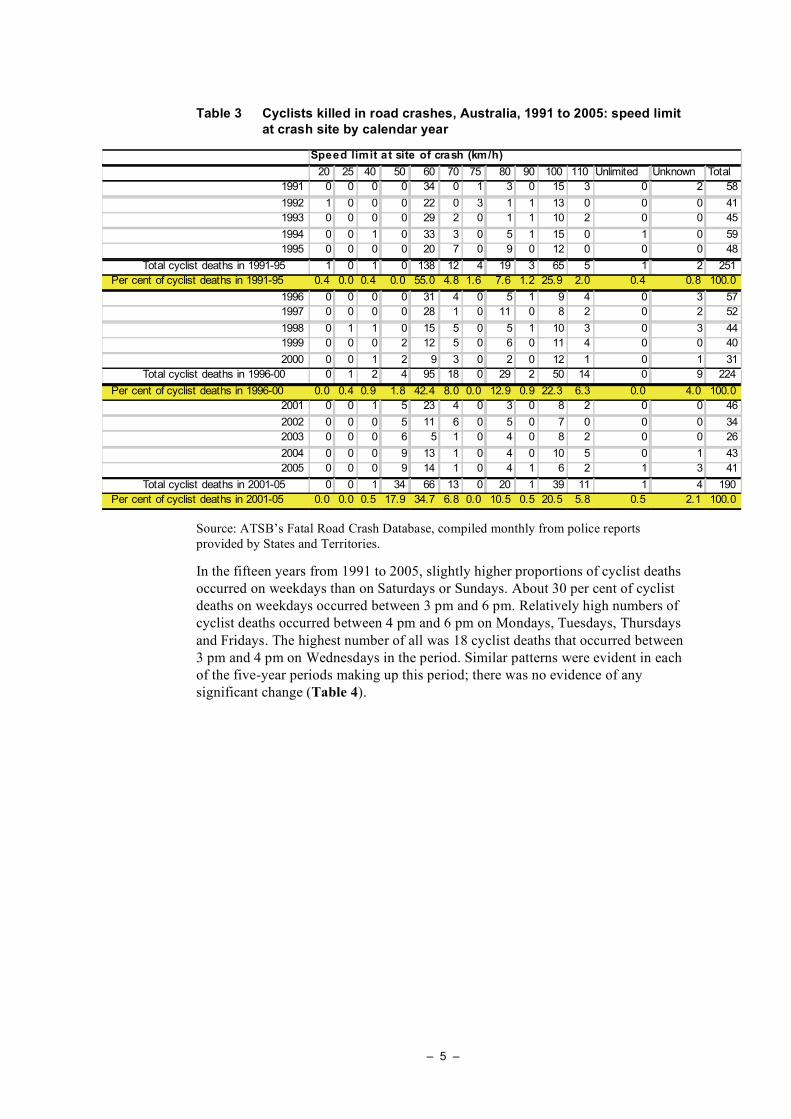
– 5 –
Table 3 Cyclists killed in road crashes, Australia, 1991 to 2005: speed limit
at crash site by calendar year
20 25 40 50 60 70 75 80 90 100 110 Unlimited Unknown Total
1991 0 0 0 0 34 0 1 3 0 15 3 0 2 58
1992 1 0 0 0 22 0 3 1 1 13 0 0 0 41
1993 0 0 0 0 29 2 0 1 1 10 2 0 0 45
1994 0 0 1 0 33 3 0 5 1 15 0 1 0 59
1995 0 0 0 0 20 7 0 9 0 12 0 0 0 48
Total cyclist deaths in 1991-95 1 0 1 0 138 12 4 19 3 65 5 1 2 251
Per cent of cyclist deaths in 1991-95 0.4 0.0 0.4 0.0 55.0 4.8 1.6 7.6 1.2 25.9 2.0 0.4 0.8 100.0
1996 0 0 0 0 31 4 0 5 1 9 4 0 3 57
1997 0 0 0 0 28 1 0 11 0 8 2 0 2 52
1998 0 1 1 0 15 5 0 5 1 10 3 0 3 44
1999 0 0 0 2 12 5 0 6 0 11 4 0 0 40
2000 0 0 1 2 9 3 0 2 0 12 1 0 1 31
Total cyclist deaths in 1996-00 0 1 2 4 95 18 0 29 2 50 14 0 9 224
Per cent of cyclist deaths in 1996-00 0.0 0.4 0.9 1.8 42.4 8.0 0.0 12.9 0.9 22.3 6.3 0.0 4.0 100.0
2001 0 0 1 5 23 4 0 3 0 8 2 0 0 46
2002 0 0 0 5 11 6 0 5 0 7 0 0 0 34
2003 0 0 0 6 5 1 0 4 0 8 2 0 0 26
2004 0 0 0 9 13 1 0 4 0 10 5 0 1 43
2005 0 0 0 9 14 1 0 4 1 6 2 1 3 41
Total cyclist deaths in 2001-05 0 0 1 34 66 13 0 20 1 39 11 1 4 190
Per cent of cyclist deaths in 2001-05 0.0 0.0 0.5 17.9 34.7 6.8 0.0 10.5 0.5 20.5 5.8 0.5 2.1 100.0
Speed limit at site of crash (km/h)
Source: ATSB’s Fatal Road Crash Database, compiled monthly from police reports
provided by States and Territories.
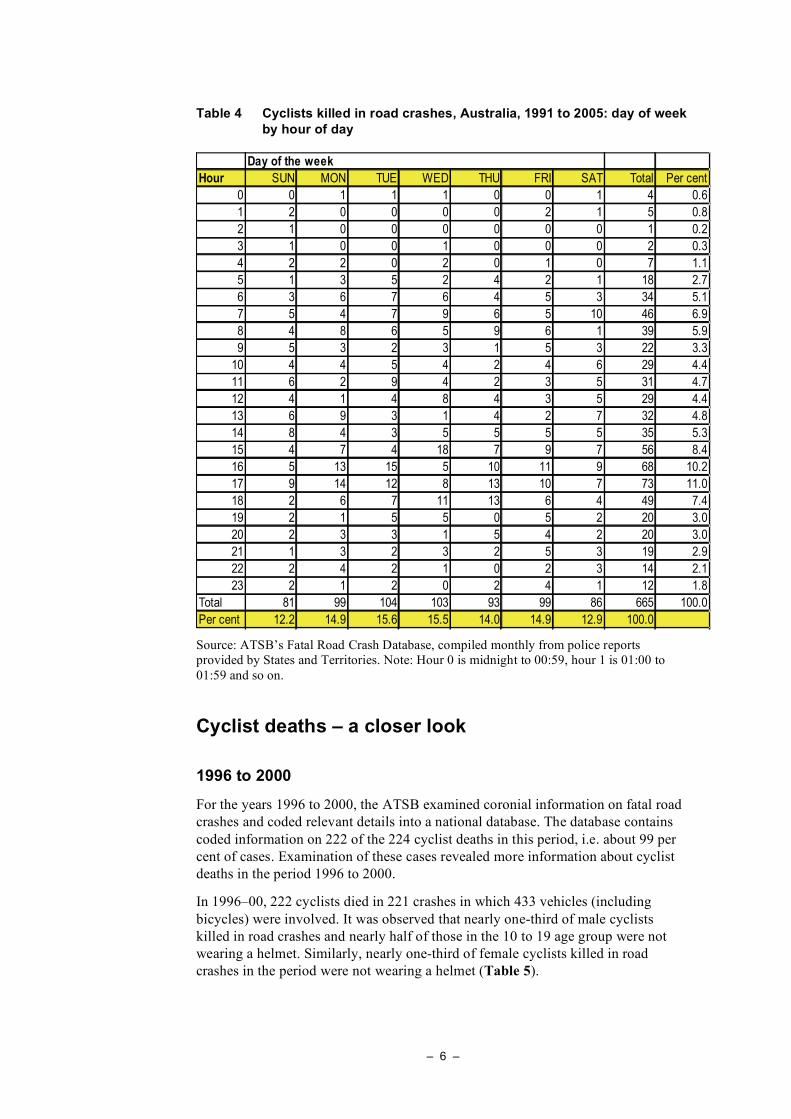
In the fifteen years from 1991 to 2005, slightly higher proportions of cyclist deaths
occurred on weekdays than on Saturdays or Sundays. About 30 per cent of cyclist
deaths on weekdays occurred between 3 pm and 6 pm. Relatively high numbers of
cyclist deaths occurred between 4 pm and 6 pm on Mondays, Tuesdays, Thursdays
and Fridays. The highest number of all was 18 cyclist deaths that occurred between
3 pm and 4 pm on Wednesdays in the period. Similar patterns were evident in each
of the five-year periods making up this period; there was no evidence of any
significant change (Table 4).
– 6 –
Table 4 Cyclists killed in road crashes, Australia, 1991 to 2005: day of week
by hour of day
Hour SUN MON TUE WED THU FRI SAT Total Per cent
0 0 1 1 1 0 0 1 4 0.6
1 2 0 0 0 0 2 1 5 0.8
2 1 0 0 0 0 0 0 1 0.2
3 1 0 0 1 0 0 0 2 0.3
4 2 2 0 2 0 1 0 7 1.1
5 1 3 5 2 4 2 1 18 2.7
6 3 6 7 6 4 5 3 34 5.1
7 5 4 7 9 6 5 10 46 6.9
8 4 8 6 5 9 6 1 39 5.9
9 5 3 2 3 1 5 3 22 3.3
10 4 4 5 4 2 4 6 29 4.4
11 6 2 9 4 2 3 5 31 4.7
12 4 1 4 8 4 3 5 29 4.4
13 6 9 3 1 4 2 7 32 4.8
14 8 4 3 5 5 5 5 35 5.3
15 4 7 4 18 7 9 7 56 8.4
16 5 13 15 5 10 11 9 68 10.2
17 9 14 12 8 13 10 7 73 11.0
18 2 6 7 11 13 6 4 49 7.4
19 2 1 5 5 0 5 2 20 3.0
20 2 3 3 1 5 4 2 20 3.0
21 1 3 2 3 2 5 3 19 2.9
22 2 4 2 1 0 2 3 14 2.1
23 2 1 2 0 2 4 1 12 1.8
Total 81 99 104 103 93 99 86 665 100.0
Per cent 12.2 14.9 15.6 15.5 14.0 14.9 12.9 100.0
Day of the week
Source: ATSB’s Fatal Road Crash Database, compiled monthly from police reports
provided by States and Territories. Note: Hour 0 is midnight to 00:59, hour 1 is 01:00 to
01:59 and so on.
Cyclist deaths – a closer look
1996 to 2000
For the years 1996 to 2000, the ATSB examined coronial information on fatal road
crashes and coded relevant details into a national database. The database contains
coded information on 222 of the 224 cyclist deaths in this period, i.e. about 99 per
cent of cases. Examination of these cases revealed more information about cyclist
deaths in the period 1996 to 2000.
In 1996–00, 222 cyclists died in 221 crashes in which 433 vehicles (including
bicycles) were involved. It was observed that nearly one-third of male cyclists
killed in road crashes and nearly half of those in the 10 to 19 age group were not
wearing a helmet. Similarly, nearly one-third of female cyclists killed in road
crashes in the period were not wearing a helmet (Table 5).
– 7 –
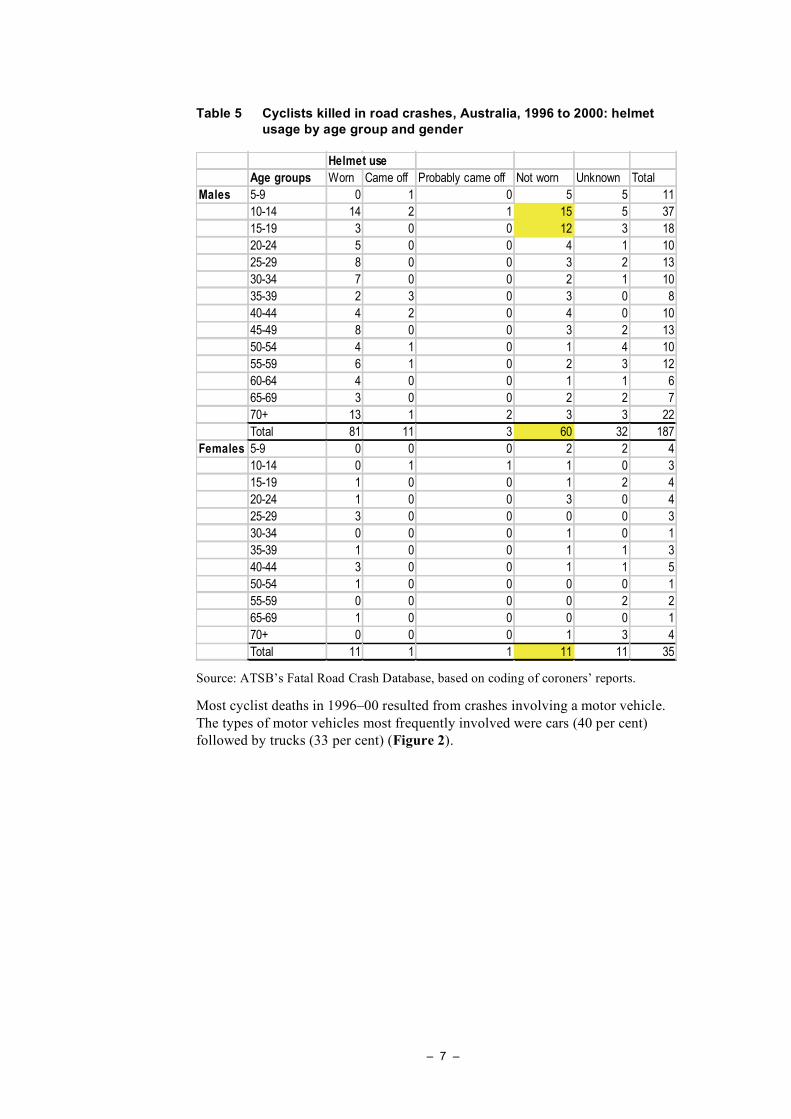
Table 5 Cyclists killed in road crashes, Australia, 1996 to 2000: helmet
usage by age group and gender
Helmet use
Age groups Worn Came off Probably came off Not worn Unknown Total
Males 5-9 0 1 0 5 5 11
10-14 14 2 1 15 5 37
15-19 3 0 0 12 3 18
20-24 5 0 0 4 1 10
25-29 8 0 0 3 2 13
30-34 7 0 0 2 1 10
35-39 2 3 0 3 0 8
40-44 4 2 0 4 0 10
45-49 8 0 0 3 2 13
50-54 4 1 0 1 4 10
55-59 6 1 0 2 3 12
60-64 4 0 0 1 1 6
65-69 3 0 0 2 2 7
70+ 13 1 2 3 3 22
Total 81 11 3 60 32 187
Females 5-9 0 0 0 2 2 4
10-14 0 1 1 1 0 3
15-19 1 0 0 1 2 4
20-24 1 0 0 3 0 4
25-29 3 0 0 0 0 3
30-34 0 0 0 1 0 1
35-39 1 0 0 1 1 3
40-44 3 0 0 1 1 5
50-54 1 0 0 0 0 1
55-59 0 0 0 0 2 2
65-69 1 0 0 0 0 1
70+ 0 0 0 1 3 4
Total 11 1 1 11 11 35 Source: ATSB’s Fatal Road Crash Database, based on coding of coroners’ reports.
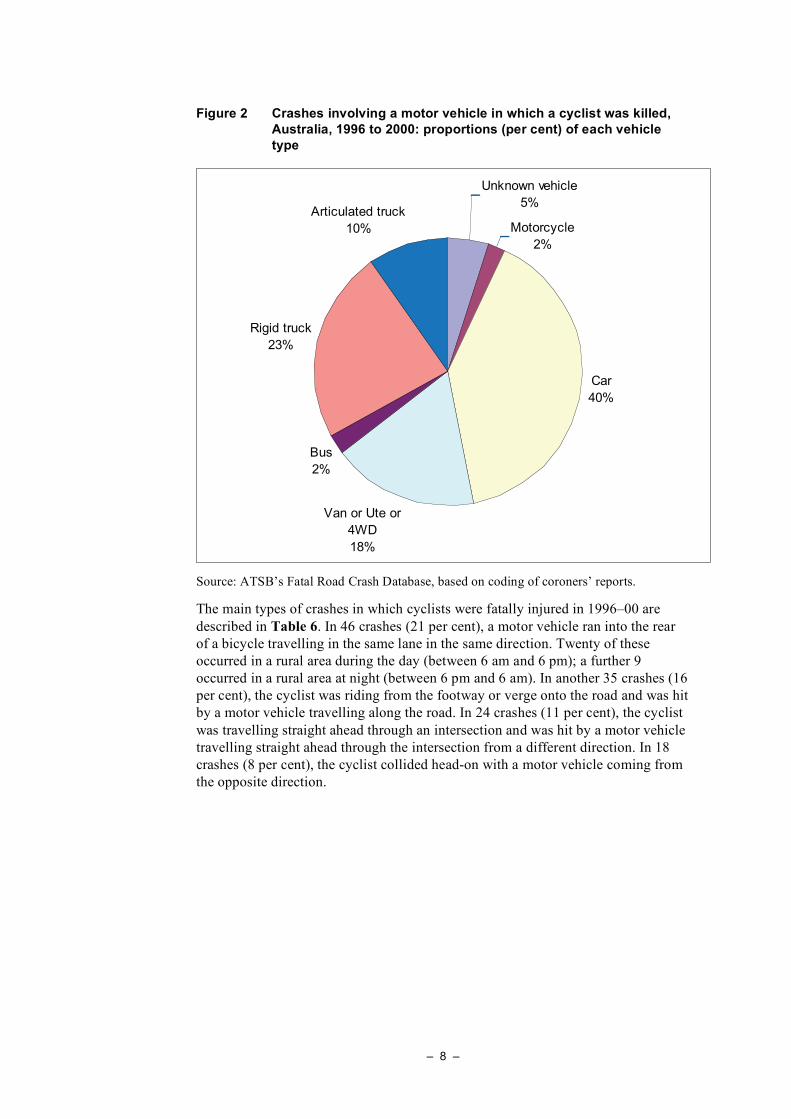
Most cyclist deaths in 1996–00 resulted from crashes involving a motor vehicle.
The types of motor vehicles most frequently involved were cars (40 per cent)
followed by trucks (33 per cent) (Figure 2).
– 8 –
Figure 2 Crashes involving a motor vehicle in which a cyclist was killed,
Australia, 1996 to 2000: proportions (per cent) of each vehicle
type
Unknown vehicle
5%
Motorcycle
2%
Car
40%
Van or Ute or
4WD
18%
Bus
2%
Rigid truck
23%
Articulated truck
10%
Source: ATSB’s Fatal Road Crash Database, based on coding of coroners’ reports.
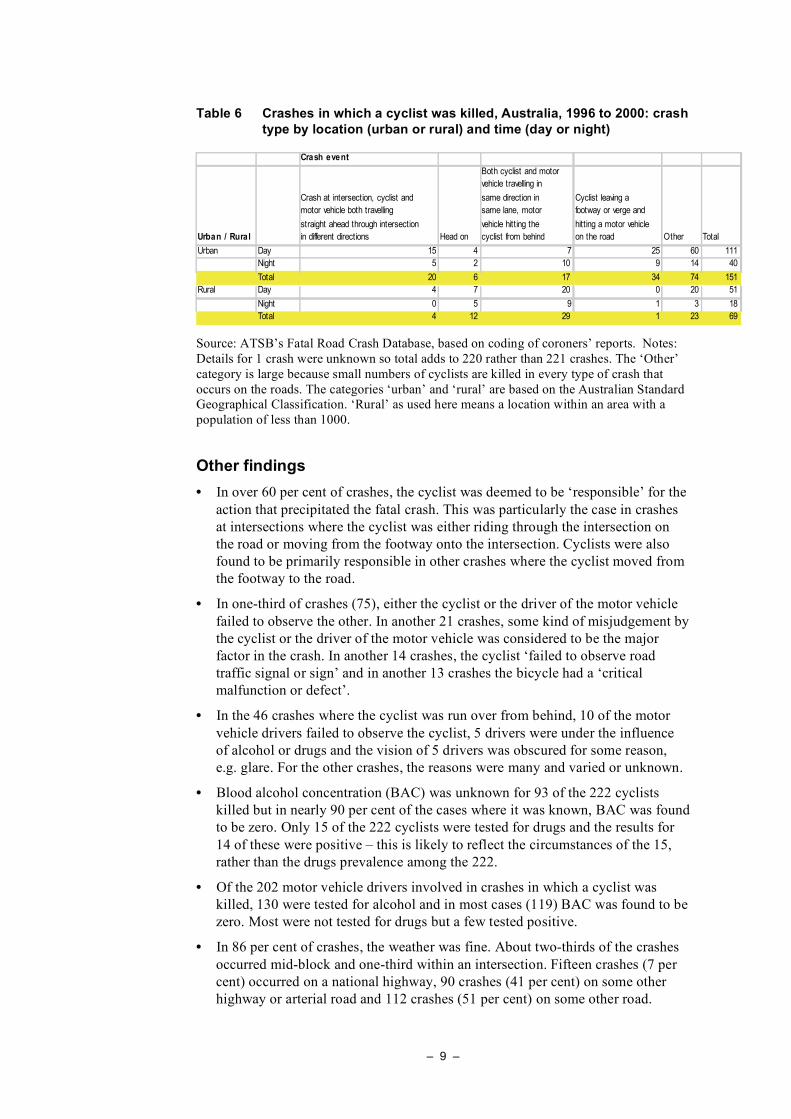
The main types of crashes in which cyclists were fatally injured in 1996–00 are
described in Table 6. In 46 crashes (21 per cent), a motor vehicle ran into the rear
of a bicycle travelling in the same lane in the same direction. Twenty of these
occurred in a rural area during the day (between 6 am and 6 pm); a further 9
occurred in a rural area at night (between 6 pm and 6 am). In another 35 crashes (16
per cent), the cyclist was riding from the footway or verge onto the road and was hit
by a motor vehicle travelling along the road. In 24 crashes (11 per cent), the cyclist
was travelling straight ahead through an intersection and was hit by a motor vehicle
travelling straight ahead through the intersection from a different direction. In 18
crashes (8 per cent), the cyclist collided head-on with a motor vehicle coming from
the opposite direction.
– 9 –
Table 6 Crashes in which a cyclist was killed, Australia, 1996 to 2000: crash
type by location (urban or rural) and time (day or night)
Crash event
Urban / Rural
Crash at intersection, cyclist and
motor vehicle both travelling
straight ahead through intersection
in different directions Head on
Both cyclist and motor
vehicle travelling in
same direction in
same lane, motor
vehicle hitting the
cyclist from behind
Cyclist leaving a
footway or verge and
hitting a motor vehicle
on the road Other Total
Urban Day 15 4 7 25 60 111
Night 5 2 10 9 14 40
Total 20 6 17 34 74 151
Rural Day 4 7 20 0 20 51
Night 0 5 9 1 3 18
Total 4 12 29 1 23 69 Source: ATSB’s Fatal Road Crash Database, based on coding of coroners’ reports. Notes:
Details for 1 crash were unknown so total adds to 220 rather than 221 crashes. The ‘Other’
category is large because small numbers of cyclists are killed in every type of crash that
occurs on the roads. The categories ‘urban’ and ‘rural’ are based on the Australian Standard
Geographical Classification. ‘Rural’ as used here means a location within an area with a
population of less than 1000.
Other findings
• In over 60 per cent of crashes, the cyclist was deemed to be ‘responsible’ for the
action that precipitated the fatal crash. This was particularly the case in crashes
at intersections where the cyclist was either riding through the intersection on
the road or moving from the footway onto the intersection. Cyclists were also
found to be primarily responsible in other crashes where the cyclist moved from
the footway to the road.
• In one-third of crashes (75), either the cyclist or the driver of the motor vehicle
failed to observe the other. In another 21 crashes, some kind of misjudgement by
the cyclist or the driver of the motor vehicle was considered to be the major
factor in the crash. In another 14 crashes, the cyclist ‘failed to observe road
traffic signal or sign’ and in another 13 crashes the bicycle had a ‘critical
malfunction or defect’.
• In the 46 crashes where the cyclist was run over from behind, 10 of the motor
vehicle drivers failed to observe the cyclist, 5 drivers were under the influence
of alcohol or drugs and the vision of 5 drivers was obscured for some reason,
e.g. glare. For the other crashes, the reasons were many and varied or unknown.
• Blood alcohol concentration (BAC) was unknown for 93 of the 222 cyclists
killed but in nearly 90 per cent of the cases where it was known, BAC was found
to be zero. Only 15 of the 222 cyclists were tested for drugs and the results for
14 of these were positive – this is likely to reflect the circumstances of the 15,
rather than the drugs prevalence among the 222.
• Of the 202 motor vehicle drivers involved in crashes in which a cyclist was
killed, 130 were tested for alcohol and in most cases (119) BAC was found to be
zero. Most were not tested for drugs but a few tested positive.
• In 86 per cent of crashes, the weather was fine. About two-thirds of the crashes
occurred mid-block and one-third within an intersection. Fifteen crashes (7 per
cent) occurred on a national highway, 90 crashes (41 per cent) on some other
highway or arterial road and 112 crashes (51 per cent) on some other road.
– 10 –
2001 to 2004
For the period 2001 to 2004, the ATSB undertook an examination of the text of
coroners’ reports on cyclist deaths in road crashes. The ATSB is grateful to the
Victorian Institute of Forensic Medicine for permission to use the National
Coroners Information System (NCIS) for this purpose.5 Descriptions of the
circumstances of 113 of the 149 cyclist deaths in 2001–04 (76 per cent of cases)
were available on the NCIS at the time of this study. Cases were evenly distributed
across all age and gender groups.
Examining the crashes in 2001–04, it was observed that:
• In 65 of the 113 cases, helmet usage was unknown but 30 of the cyclists were
wearing a helmet and 18 were not. About one-third of cyclists wearing a helmet
died of head injuries, while about half of those not wearing a helmet died of
head injuries.
• As in 1996–00, cyclists were killed predominantly in collisions with cars (48 per
cent), followed by trucks (22 per cent, down from 33 per cent in 1996–00) and
vans, utes or 4WDs (16 per cent).
• The crash circumstances were also similar to those in 1996–00. Two important
additional insights were obtained from reading the text descriptions of the
crashes:
– More than two-thirds of the deaths of cyclists aged 5–17 years were the result
of the cyclist failing to give way to oncoming traffic and about half of these
cases occurred at intersections. A typical behaviour for the younger (pre-
teenage) cyclists was to enter the intersection from a footway without
dismounting and without looking.
– Teenage cyclists (13–17 years) on the other hand tended to be killed after
failing to give way after crossing a median strip mid-block or veering sharply
into the path of vehicles trying to overtake them.
• Cases were evenly distributed between rural and urban areas – 57 in a rural area
and 56 in an urban area (an urban area was defined as having a population of
1000 or more).
• Blood alcohol concentration (BAC) was unknown for 59 of the 113 cyclists, but
for nearly 90 per cent of the cyclists where it was known, BAC was found to be
zero. Similarly, the presence of drugs was unknown for 58 cyclists, but for
nearly 90 per cent of cyclists where it was known, no evidence of drugs was
found. Similarly, very few of the motor vehicle drivers involved tested positive
for alcohol or drugs.
• Weather conditions were unknown in 90 of the 113 cases, but most of the
crashes (73) occurred in the day, i.e. between 6 am and 6 pm. There were 23
crashes within an intersection and 25 mid-block, though the location of 43
crashes was unknown.
5 The NCIS provides the full text of police narrative, coroner’s finding, autopsy and toxicology
report for road crash deaths from 2001 onwards. Further details on the NCIS can be obtained at
www.ncis.org.au.

– 11 –
Data for 2001 to 2004 are currently incomplete but will be updated by the ATSB
when more details are available.