Embed Size (px)
Citation preview

DOI: 10.1126/science.1187409, 341 (2010);330 Science
, et al.David E. ShawAtomic-Level Characterization of the Structural Dynamics of Proteins
This copy is for your personal, non-commercial use only.
clicking here.colleagues, clients, or customers by , you can order high-quality copies for yourIf you wish to distribute this article to others
here.following the guidelines
can be obtained byPermission to republish or repurpose articles or portions of articles
): March 27, 2011 www.sciencemag.org (this infomation is current as of
The following resources related to this article are available online at
http://www.sciencemag.org/content/330/6002/341.full.htmlversion of this article at:
including high-resolution figures, can be found in the onlineUpdated information and services,
http://www.sciencemag.org/content/suppl/2010/10/13/330.6002.341.DC1.html can be found at: Supporting Online Material
http://www.sciencemag.org/content/330/6002/341.full.html#relatedfound at:
can berelated to this article A list of selected additional articles on the Science Web sites
http://www.sciencemag.org/content/330/6002/341.full.html#ref-list-1, 14 of which can be accessed free:cites 47 articlesThis article
http://www.sciencemag.org/content/330/6002/341.full.html#related-urls2 articles hosted by HighWire Press; see:cited by This article has been
http://www.sciencemag.org/cgi/collection/biochemBiochemistry
subject collections:This article appears in the following
registered trademark of AAAS. is aScience2010 by the American Association for the Advancement of Science; all rights reserved. The title
CopyrightAmerican Association for the Advancement of Science, 1200 New York Avenue NW, Washington, DC 20005. (print ISSN 0036-8075; online ISSN 1095-9203) is published weekly, except the last week in December, by theScience
on
Mar
ch 2
7, 2
011
ww
w.s
cien
cem
ag.o
rgD
ownl
oade
d fr
om

ligible role for these substances in the regu-lation of cystine stone formation.
Collectively, the AFM and bulk crystalliza-tion behavior for L-cystine suggest that L-CDMEis a viable therapeutic agent for the preventionof L-cystine kidney stones. This approach to stoneprevention uses a potentially benign crystal growthinhibitor at low concentrations rather than drugsthat rely on a chemical reaction with L-cystine(L-cystine–binding thiol drugs), increases in urinealkalinity (which are often accompanied by un-desirable side effects), or dramatic increases inurine volume (which can be unreliable owing topatient nonadherance). The reduction in massyield in the presence of inhibitors is a kinetic ef-fect that maintains a metastable supersaturatedL-cystine concentration, but from a pathologicalperspective this is a sufficient condition for pre-venting stone formation. L-cystine stone formerstypically have urinary L-cystine concentrationsranging from 250 to 1000 mg/liter (equivalentto 1 to 4 mM), which is comparable with theconcentrations we used for the AFM and bulkcrystallization studies. Therefore, L-CDME con-centrations near 2 mg/liter (<0.01 mM), at whichinhibition of L-cystine growth was highly effec-tive, may be adequate for therapeutic effect. Cellculture data, acquired for the purpose of evaluat-ing cystine exodus from lysosomes, show lossof cell viability at approximately 1 mM L-CDME,and studies in rats, performed to measure oxi-dative stress in the brain cortex, demonstratedadverse effects at dosages of approximately 500mg/kg (mass of rat) per day (33–35). Althoughthe pharmacokinetics of L-CDME are not wellknown, on the basis of typical daily urine vol-
umes a L-CDME dose of 10 to 50 mg per day—far below toxic levels but greater than the amountneeded for crystal growth inhibition in vitro—may prove sufficient to achieve adequate L-CDMEconcentrations in urine for crystal growth inhibi-tion in vivo.
References and Notes1. K. Ahmed, P. Dasgupta, M. S. Khan, Postgrad. Med. J.
82, 799 (2006).2. D. J. Dolin, J. R. Asplin, L. Flagel, M. Grasso,
D. S. Goldfarb, J. Endourol. 19, 429 (2005).3. A. Mattoo, D. S. Goldfarb, Semin. Nephrol. 28,
181 (2008).4. O. W. Moe, Lancet 367, 333 (2006).5. G. Becker, Nephrology 12 (suppl. 1), S4 (2007).6. Y. Nakagawa, J. R. Asplin, D. S. Goldfarb, J. H. Parks,
F. L. Coe, J. Urol. 164, 1481 (2000).7. A. C. Hillier, M. D. Ward, Science 263, 1261 (1994).8. M. D. Ward, Chem. Rev. 101, 1697 (2001).9. Materials and methods are available as supporting
material on Science Online.10. S. Dahaoui, V. Pichon-Pesme, J. A. K. Howard, C. Lecomte,
J. Phys. Chem. A 103, 6240 (1999).11. E. K. Girija, S. N. Kalkura, P. Ramasamy, J. Mater. Sci. 6,
617 (1995).12. Y. Fujiki, N. Tokunaga, S. Shinkai, K. Sada, Angew. Chem.
Int. Ed. 45, 4764 (2006).13. B. M. Oughton, P. M. Harrison, Acta Crystallogr.
12, 396 (1959).14. W. A. Tiller, The Science of Crystallization: Microscopic
Phenomena and Defect Generation (Cambridge Univ.Press, Ithaca, NY, 1991).
15. J. P. Sizemore, M. F. Doherty, Cryst. Growth Des. 9,2637 (2009).
16. L. S. Levitt, J. Phys. 49, 696 (1975).17. R. Carta, G. Tola, J. Chem. Eng. Data 41, 414 (1996).18. I. Weissbuch, L. Addadi, L. Leiserowitz, L. Leiserowitz,
Science 253, 637 (1991).19. G. Clydesdale, R. B. Hammond, K. J. Roberts, J. Phys.
Chem. B 107, 4826 (2003).20. I. Weissbuch, M. Lahav, L. Leiserowitz, Cryst. Growth Des.
3, 125 (2003).
21. R. J. Davey et al., J. Chem. Soc. Faraday Trans. 88,3461 (1992).
22. A. S. Michaels, F. W. Tausch Jr., J. Phys. Chem. 65,1730 (1961).
23. R. Buller, M. L. Peterson, O. Almarsson, L. Leiserowitz,Cryst. Growth Des. 2, 553 (2002).
24. I. Solomonov et al., J. Am. Chem. Soc. 129,2615 (2007).
25. Y. C. Liou, A. Tocilj, P. L. Davies, Z. Z. Jia, Nature 406,322 (2000).
26. C. A. Orme et al., Nature 411, 775 (2001).27. A. E. Stephenson et al., Science 322, 724 (2008).28. S. W. Guo, M. D. Ward, J. A. Wesson, Langmuir
18, 4284 (2002).29. T. Jung et al., Langmuir 20, 8587 (2004).30. B. Grohe et al., J. Am. Chem. Soc. 129, 14946 (2007).31. X. Sheng, T. Jung, J. A. Wesson, M. D. Ward, Proc. Natl.
Acad. Sci. U.S.A. 102, 267 (2005).32. M. O. Chaney, L. K. Steinrauf, Acta Crystallogr. B
30, 711 (1974).33. A. Kessler et al., Neurochem. Res. 33, 737 (2008).34. M. J. Wilmer et al., Pediatr. Res. 62, 151 (2007).35. J. W. Foreman, M. A. Bowring, J. Lee, B. States, S. Segal,
Metabolism 36, 1185 (1987).36. This work was supported primarily by NIH (NIDDK
R01-DK068551) and the NYU Molecular Design Institute.The authors also acknowledge support from the Officeof Rare Disease Research (1U54DK083908-01) and theAdvanced Photon Source, ChemMatCARS Sector 15,which is principally supported by NSF/U.S. Departmentof Energy (DOE) (NSF/DOE; CHE-0535644). The authorsthank C. Hu, M. Li, Y.-S. Chen, and G. Kowach fortechnical assistance and B. Kahr for helpful discussions.
Supporting Online Materialwww.sciencemag.org/cgi/content/full/330/6002/337/DC1Materials and MethodsFigs. S1 to S10Table S1ReferencesMovies S1 to S3
7 May 2010; accepted 13 August 201010.1126/science.1191968
Atomic-Level Characterizationof the Structural Dynamics of ProteinsDavid E. Shaw,1,2* Paul Maragakis,1† Kresten Lindorff-Larsen,1† Stefano Piana,1†Ron O. Dror,1 Michael P. Eastwood,1 Joseph A. Bank,1 John M. Jumper,1 John K. Salmon,1Yibing Shan,1 Willy Wriggers1
Molecular dynamics (MD) simulations are widely used to study protein motions at an atomiclevel of detail, but they have been limited to time scales shorter than those of many biologicallycritical conformational changes. We examined two fundamental processes in proteindynamics—protein folding and conformational change within the folded state—by means ofextremely long all-atom MD simulations conducted on a special-purpose machine. Equilibriumsimulations of a WW protein domain captured multiple folding and unfolding events thatconsistently follow a well-defined folding pathway; separate simulations of the protein’s constituentsubstructures shed light on possible determinants of this pathway. A 1-millisecond simulationof the folded protein BPTI reveals a small number of structurally distinct conformational stateswhose reversible interconversion is slower than local relaxations within those states by a factorof more than 1000.
Many biological processes involve func-tionally important changes in the three-dimensional structures of proteins.
Conformational changes associated with protein
folding (1), signal transduction (2), the catalyticcycles of enzymes (3), and the operation of mo-lecular machines and motor proteins (4) ofteninvolve transitions among two or more structur-
ally distinct states. These states are often charac-terized as “basins” separated by barriers on an“energy landscape” (5).
Substantial progress has been made, usingboth experimental (1, 6) and computational (7, 8)techniques, in characterizing conformational basinsand theways that proteinsmovewithin and amongthem. It has proven difficult, however, to structur-ally characterize sparsely populated or disorderedstates and to elucidate the “basin-hopping” mech-anisms involved in the interconversion of variousstates.
All-atom molecular dynamics (MD) simula-tions are designed to provide a high-resolutionview of the motions of biological macromole-cules (9), producing continuous trajectories withthe potential to connect static structural snap-shots generated from experimental data. Compu-tational constraints, however, have limited such
1D. E. Shaw Research, 120 West 45th Street, New York, NY10036, USA. 2Center for Computational Biology and Bioinfor-matics, Columbia University, New York, NY 10032, USA.
*To whom correspondence should be addressed. E-mail:[email protected]†These authors contributed equally to this work.
www.sciencemag.org SCIENCE VOL 330 15 OCTOBER 2010 341
RESEARCH ARTICLES
on
Mar
ch 2
7, 2
011
ww
w.s
cien
cem
ag.o
rgD
ownl
oade
d fr
om
simulations to ~1 ms of simulated biologicaltime. [The longest previously published all-atomMD simulation of a protein, at 10 ms, requiredmore than 3 months of supercomputer time(10).] This has limited the usefulness of MD, asmany biological processes involve conforma-tional changes that take place on time scalesbetween 10 ms and 1 ms.
To access such time scales, we designed andconstructed a special-purpose machine, calledAnton (11), that greatly accelerates the executionof such simulations, producing continuous trajec-tories as much as 1 ms in length. This has allowednew insight into two fundamental processes inprotein dynamics: protein folding and the inter-conversion among distinct structural states of afolded protein.
Specifically, we have been able to formulate adetailed description of the folding of a WW do-main (12) as well as the folded-state dynamicsof bovine pancreatic trypsin inhibitor (BPTI), aworkhorse in the study of protein dynamics [andthe subject of the first protein MD simulation(13) and of pioneering computational studies ofprotein folding (14)]. Our choice of biologicalsystems was motivated in part by the fact that aconsiderable amount of experimental data isavailable for both of these proteins, providingus with various ways to test the reliability of oursimulations.
Folding of a WW domain. WWdomains aresmall, independently folding protein domainsthat bind to proline-rich sequences. The topologyof WW domains is characterized by two b hair-pins, which form a three-stranded b sheet (15).Mutational analyses of the folding of WW do-mains show that the rate-limiting step in the fold-ing reaction involves the formation of the firsthairpin (16–18). This information facilitated theoriginal design of the fastest-foldingWW domainreported to date, FiP35 (12), which folds in 14 ms.
FiP35 has several features that make it at-tractive as a model system for use in computa-tional studies of protein folding. A great dealof experimental data is available for this system(12, 16, 17), and previous attempts to charac-terize its folding mechanism through explicit-solvent simulations have been largely unsuccessful(10, 19). It has been suggested that WW do-mains such as FiP35 fold through multiple dis-tinct routes that differ in the order of formation ofthe individual hairpins (20–22), but this has notbeen conclusively demonstrated. It has also beenspeculated that the mutations involved in thedesign of FiP35may have shifted the rate-limitingstep relative to that of the Pin1 WW domain,which formed the basis for its design. Finally, ithas been suggested (12) that the fast folding ofFiP35 may be close to the downhill regime, withonly a small (<3kBT) free-energy barrier. Manyof the unresolved questions surrounding the fold-ing of FiP35 raise issues central to the process ofprotein folding more generally, and we believedthey might be amenable to investigation usingvery long atomistic simulations.
Folding FiP35 and villin to experimentalresolution using the same force field. We firstran a simulation at 337 K, a temperature at whichFiP35 should be predominantly folded. The pro-tein was initially configured in a fully extendedstate and was observed to fold to a stable confor-mation with a backbone root-mean-squared de-viation (RMSD) of ~1Å from the crystal structure(15) (Fig. 1B). A previous attempt to fold FiP35computationally, using a 10-ms explicit solventsimulation (10), did not converge to the nativestate, and subsequent work (19) provided evi-dence that this was attributable to deficiencies inthe force field. Our successful folding simulationwas based on a modified version of the Amberff99SB force field (23).
One potential concern in simulating the fold-ing of an all-b protein is the possibility that theforce field used might tend to overstabilize bsheets, thus “assisting” the folding process in anonphysical manner. The force field we used,however, also folded a variant of the villinheadpiece C-terminal fragment, a small all-aprotein (24), to within an RMSD of ~1 Å fromthe crystal structure. (These results cannot betaken as evidence that the same force field wouldnecessarily succeed in folding other proteins.)
Reversible folding and unfolding in anequilibrium simulation of FiP35. In the hope ofobserving a number of folding and unfoldingevents under equilibrium conditions, we then rantwo independent 100-msMD simulations of FiP35at a temperature (395 K) approximating the pro-tein’s in silico melting temperature. [The in silicomelting temperature was estimated using a replicaexchange metadynamics simulation (25) and is~40 K higher than the experimental melting tem-perature.] In each of the two equilibrium simu-lations, FiP35 underwent multiple folding andunfolding transitions, for a total of 15 events in thetwo simulations (Fig. 2A). We found the foldingtime, as calculated from the average waiting timein the unfolded state, to be 10 T 3 ms, in relativelyclose agreement with the experimental foldingtime [14 ms (12)]. The population of the foldedstate in the simulations was 60%.
In our simulations, a well-defined sequenceof events leads from the disordered, unfolded
state to the native state: In all folding transi-tions, formation of the tip of the first hairpin isfollowed by formation of the entire first hair-pin, then by formation of the second hairpin,and finally by consolidation of the hydrophobiccore (Fig. 2B, top). Unfolding transitions followthe reverse pattern. Thus, the folding mecha-nism of FiP35 appears to be dominated by asingle pathway, with any flux through alternativepathways being small. This is in contrast withrecent studies of WW domains (20–22)—usingsimulations shorter than the folding time—whichfound structurally heterogeneous dynamics withmultiple parallel pathways connecting foldedand unfolded states.
To explain why FiP35 folds along a single,dominant route, we performed reversible foldingsimulations of peptides corresponding to the twohairpins of FiP35. Both the first and second hair-pin, in isolation, fold to the structure found in thefull WW domain, with similar time constants(1.2 T 0.1 ms and 0.86 T 0.06 ms for hairpins 1 and2, respectively). The two hairpins, however, dif-fer substantially in their stabilities, with the pop-ulation of the folded state being 25% and 4% forthe first and second hairpins, respectively. Thus,the order in which the individual hairpins formduring folding of the full WW domain mirrorstheir intrinsic thermodynamic stabilities, with theslower but more stable hairpin 1 forming first.We suspect that the alternative pathway in whichthe second hairpin forms first may not be sub-stantially utilized because of the relatively largedifference in stability between the two hairpins(~1.5 kcal mol−1). Indeed, experiments haveshown that variations in substructure stabilitiescan cause substantial shifts in folding pathways(26, 27), as have computational studies in thecontext of the diffusion-collision model for pro-tein folding (28).
Our simulations show that both hairpins alsoform with similar rate constants in the context ofthe fullWWdomain. The first hairpin forms witha time constant of 5 T 1 ms, slower than in isola-tion by a factor of 4; such a slowdown is greaterthan expected for a simple hydrodynamic drag.To determine its origin, we performed simula-tions in which we systematically added residues
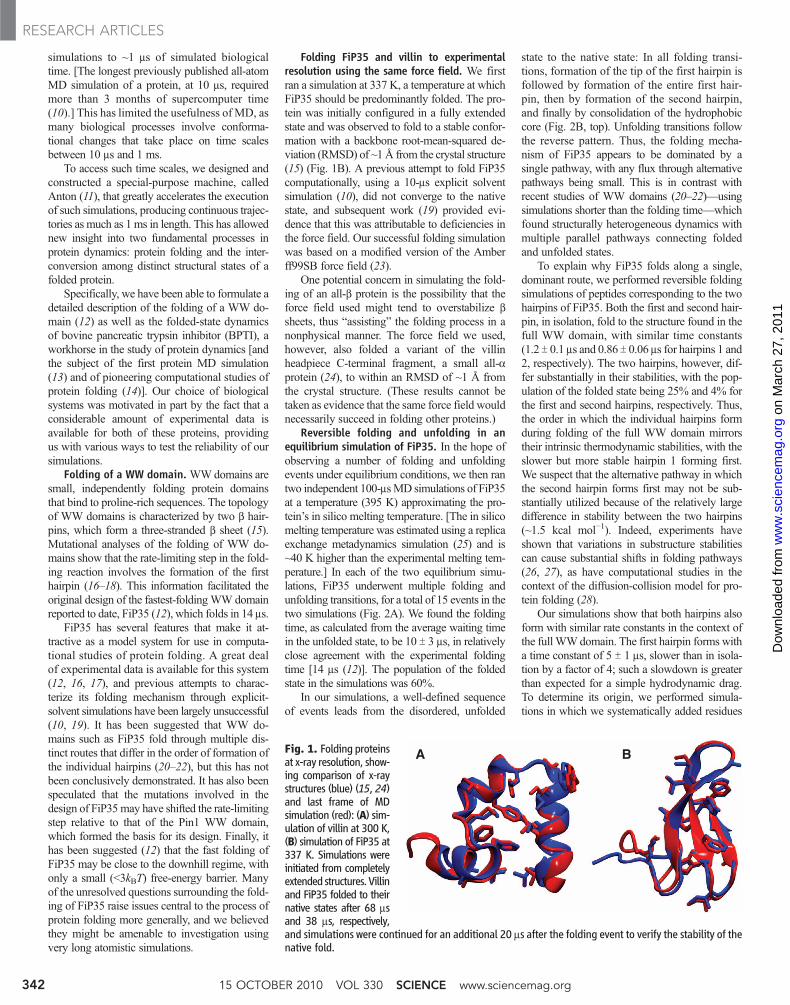
Fig. 1. Folding proteinsat x-ray resolution, show-ing comparison of x-raystructures (blue) (15, 24)and last frame of MDsimulation (red): (A) sim-ulation of villin at 300 K,(B) simulation of FiP35 at337 K. Simulations wereinitiated from completelyextended structures. Villinand FiP35 folded to theirnative states after 68 msand 38 ms, respectively,and simulations were continued for an additional 20 ms after the folding event to verify the stability of thenative fold.
A B
15 OCTOBER 2010 VOL 330 SCIENCE www.sciencemag.org342
RESEARCH ARTICLES
on
Mar
ch 2
7, 2
011
ww
w.s
cien
cem
ag.o
rgD
ownl
oade
d fr
om

in silico, three at a time, to the two ends of thehairpin (25). Adding 12 C-terminal residues re-sulted in a slowdown by a factor of 2. There wasno change in the folding rate upon adding the firstthree N-terminal residues (residues 1 to 3), butthe addition of residues 4 to 6 slowed hairpin for-mation by a factor of 2. Thus, approximately halfof the observed slowdown is determined by theaddition of just a few residues.
Characterizing the transition state for folding.MD simulations can in principle provide detailedinsight into all steps of the protein-folding path-way. Experiments, however, are generally limitedto the characterization of stable states and rate-limiting transition states. To facilitate comparisonwith experiment, we determined the transition statein our simulations.We used a previously described
variational approach (29) to find an optimizedreaction coordinate that separates the transitionstate from the stable folded and unfolded basins(25). To validate the resulting transition-state en-semble (TSE, Fig. 2C), we calculated the com-mitment probability (Pfold), the probability thatsimulations initiated from a given structure willfold before unfolding. For each of 101 structuressampled at random from the TSE, we ran foursimulations until either the folded or unfoldedstate was reached, requiring in total an additional151 ms of simulation.
The distribution of Pfold obtained with thisapproach peaked at 0.5, closely resembling thebinomial distribution expected for an ideal TSE(Fig. 2D), thus validating the reaction coordi-nate and the TSE. The average commitment time
observed in the simulations initiated from thetransition-state region is relatively long (0.36 msand 0.40 ms for folding and unfolding, respec-tively), suggestive of a diffusional process over aflat free-energy barrier. Inspection of the TSEshows that formation of the first hairpin, but notthe second, is part of the rate-limiting step. Wenote also that the time constant of formation ofthe first hairpin determined above (5 T 1 ms) ishalf of that for folding (10 T 3 ms), consistent withour finding that formation of this hairpin is rate-limiting in folding. (The factor of 2 difference intime constants arises from the 50% probability offolding from the TSE.)
The most important experimental strategy forinferring the structural properties of the TSE isthe protein engineering method, in which folding
0
5
10
RM
SD
to n
ativ
e (Å
)
Time (µs)
0
5
10
1.2 1.3 1.4Time (µs)
2
4
6
8
10
RM
SD
to n
ativ
e (Å
)
89 89.2 89.4 89.6 89.8 90Time (µs)
0 0.25 0.5 0.75 1Pfold
0
0.1
0.2
0.3
0.4
Fra
ctio
n of
obs
erva
tions
5 10 15 20 25 30 35Residue number
-1
-0.5
0
0.5
1
1.5
2
va
lue
A B
EC D
0 10 20 30 40 50 60 70 80 90 100
φ
Fig. 2. Reversible folding simulation of FiP35. (A) RMSD time series of twoindependent 100-ms simulations of FiP35 initiated from an extended state.RMSD with respect to the x-ray structure (15) was calculated for the Ca atoms ofresidues 4 to 32. A total of eight folding and seven unfolding events can beobserved within the two simulations. (B) Representative sequence of eventsleading to folding (left) and unfolding (right). RMSD to the x-ray structure wascalculated for different regions of the protein, namely the tip of hairpin1 (residues 12 to 18, blue), the entire hairpin 1 (residues 8 to 22, green), hairpin2 (residues 19 to 30, orange), and the full protein (residues 2 to 33, red).Analyses of the individual transitions reveal a consistent sequence of eventsleading to folding (upper panel): The tip of hairpin 1 forms first, followed byhairpin 1, followed by hairpin 2, followed by the rest of the protein. The reverse
sequence of events is observed in unfolding transitions. (C) Representativemembers of the transition-state ensemble reveal that the first, but not second,hairpin is structured in the TSE for folding. The transition-state ensemble wasidentified from equilibrium simulations using a previously described procedure(29), and representative structures were superimposed using Theseus software.(D) Commitment probability (Pfold) distribution of the TSE as calculated from 101structures, using four simulations for each structure. The observed distribution ofPfold (red) is compared with the binomial distribution expected for a true TSE(black). (E) Comparison of experimental and calculated f values. Two sets of fvalues (red and green) were calculated independently from the two simulationsand are compared to the experimental values (black) obtained for wild-type Pin1WW domain (17). Error bars in (D) and (E) correspond to T1 SEM.
www.sciencemag.org SCIENCE VOL 330 15 OCTOBER 2010 343
RESEARCH ARTICLES
on
Mar
ch 2
7, 2
011
ww
w.s
cien
cem
ag.o
rgD
ownl
oade
d fr
om

and unfolding rates are measured for a series ofmutants. The results are typically presented asf values (30). A f value of ~1 suggests that theinteractions formed by a residue in the nativestate are also present in the TSE, whereas a valueclose to zero indicates that the native-state inter-actions are not present in the TSE. Commonly,f values are calculated from simulation by ap-proximating the mutational free-energy changesfrom the fraction of native side-chain contactslost upon mutation (31). We used this approachto calculate f values for side chains and a free-energy perturbation approach (25) for the back-bone, and compared the results to experimentalmeasurements in a related WW domain (Fig.2E) (17). The values obtained confirm the ob-servation that the first hairpin is essentially fullyformed in the TSE, whereas the second hairpinonly makes a fraction of the contacts found in thenative state.
Although the agreement between simulationand experiment (Fig. 2E) is encouraging, it mayalso be somewhat fortuitous, as the number ofatomic contacts is only a rough approximationfor the free energy (32). We thus also calcu-lated f values directly from the folding andunfolding rates obtained from reversible fold-ing simulations of mutant proteins (33, 34) andcompared these results to f values calculatedby applying the contact approximation to theTSE for FiP35.
We chose to study the effects of six mutationsthat we expected to have different effects on thefolding and unfolding rates (Fig. 2E). Ser13 →Ala, located in the tip of the first hairpin, andArg11 → Ala, located in the central b strand, areexpected to have high f values; Tyr19→ Leu andPhe21→ Leu, both located in the central b strand,are expected to have intermediate f values; andLeu4 → Ala and Trp8 → Phe, located in thehydrophobic core, are expected to have low fvalues.
All six mutants folded reversibly to the na-tive state, albeit with different rates and stabil-ities (Table 1). For most mutants, the changesin stability upon mutation were in good agree-ment with experimental data. Most of the fvalues calculated from the folding and unfold-ing rates were in reasonable agreement with themagnitude calculated from the TSE of FiP35(Table 1), although our results support the no-tion that individual f values are best interpretedqualitatively (35, 36).
A notable exception is the Arg11 → Ala mu-tation, whose low f value calculated from thefolding kinetics (0.2) is substantially smaller thanthe high value expected from the contact ap-proximation (0.8). Although the reasons for thisdiscrepancy remain unclear, our results overallsupport the use of experimentally derived f valuesto infer the structural properties of the TSE, withthe caveat that the contact approximation may failin individual cases (35); all the experimental fvalues should thus be considered simultaneouslywhen inferring the overall structural properties for
a TSE (31). Finally, we note that all mutant pro-teins fold via the same overall pathway as FiP35,although some of the mutations appear to cause anoticeable Hammond-like shift in the structure ofthe TSE (fig. S4).
It is perhaps worth noting that these simu-lations may also provide a computational goldstandard for future studies exploring the accuracyand efficiency of methods for the prediction ofmutational free-energy differences and foldingrates.
FiP35 folds across a small free-energy bar-rier. We determined the free-energy profileand position-dependent diffusion constant alongthe optimized reaction coordinate (25). We foundthat the free-energy barrier for folding is small(1.6 kcal mol−1 or ~2kBT), consistent with thesuggestion that FiP35 is an incipient downhillfolder (12). The transition-state region is broadand flat (Fig. 3A), helping to explain the longcommitment time observed in the Pfold analysis.Langevin simulations on the free-energy profile(Fig. 3B) approximate well the folding dynamicsobserved in the MD simulations, and we arethus able to use this kinetic model to simulate atemperature-jump experiment (25). In addition tothe slow phase associated with folding, we ob-served a fast “molecular” phase whose amplitudeand time constant depend on both the size of thetemperature jump and the spectroscopic probeused (25). Such features are spectroscopic indi-cations of protein folding across a low free-
energy barrier, and they support the notion thatexperimental studies of fast-folding proteins mightbe used to probe directly the spectroscopic prop-erties of the TSE (37).
It has been argued that the fast molecularphase provides an estimate of the time scale fortransition paths in folding of FiP35 (37). Thevalue obtained in these experiments (≤0.7 ms) isin agreement with theoretical estimates (0.3 ms)as well as with the upper bound (200 ms) obtaineddirectly through single-molecule experiments (6).These values also agree with the average tran-sition path time observed in our equilibrium sim-ulations (0.4 T 0.1 ms). Thus, a range of differenttechniques (simulation, theory, ensemble, andsingle-molecule experiments) provide indepen-dent evidence for transition path times for proteinfolding on the order of 1 ms.
Native-state dynamics of BPTI. Dynamicchanges in protein structure typically occur notonly during but also after the folding process.The 58-residue protein BPTI was the subject ofthe first nuclear magnetic resonance (NMR)experiments of the internal motions of proteins(38). NMR studies showed that on time scalesranging from nanoseconds to milliseconds, sev-eral internal water molecules exchange with thebulk (39, 40), a number of aromatic rings rotate(38, 41), and a disulfide bridge isomerizes (42, 43).We used a 1-ms MD simulation at a temperatureof 300 K to reproduce and interpret the kineticsof folded BPTI.
Table 1. Computational f-value analysis of FiP35. In columns 2 and 3, the f values for six selectedmutants, calculated from the folding and unfolding rates obtained from reversible folding simulations,are compared with the values estimated from a contact approximation. In columns 4 and 5, the calculatedfree-energy changes upon mutation are compared to the values measured experimentally at the meltingtemperature of the hPin1 WW domain (49).
Mutationf Value DDGmut (kcal mol−1)
MD Contact approx. MD (±SEM) Experiment
Leu4 → Ala −0.6 −0.1 0.5 (0.4) 1.5Trp8 → Phe −0.1 0.4 1.6 (0.4) 1.8Arg11 → Ala 0.2 0.8 1.8 (0.5) 1.7Ser13 → Ala 1.1 0.9 0.4 (0.5) n/aTyr19 → Leu 0.3 0.7 1.1 (0.4) 1.1Phe21 → Leu 0.4 0.5 2.4 (0.5) 1.4
Fig. 3. Folding kineticsacross a low energy barrier.(A) Free-energy profile alongan optimized reaction coor-dinate. The profile exhibitstwo minima, centered at 0.1and 0.7, corresponding to thefolded and unfolded basins,respectively. The folding andunfolding free-energy bar-riers are 2kBT and 3.5kBT,respectively. (B) Langevin sim-ulation of WW folding in aone-dimensional model. Thesimulation was based on the one-dimensional free-energy profile in (A) and a position-dependentdiffusion coefficient, both derived from the MD simulation data.
0 2Free energy (kBT) Time (µs)
0
0.2
0.4
0.6
0.8
Rea
ctio
n co
ordi
nate
0 20 40 60 80 100
A B
1 3
15 OCTOBER 2010 VOL 330 SCIENCE www.sciencemag.org344
RESEARCH ARTICLES
on
Mar
ch 2
7, 2
011
ww
w.s
cien
cem
ag.o
rgD
ownl
oade
d fr
om

Our simulation of BPTI transitioned re-versibly among a small number of structurallydistinct long-lived states (Fig. 4A) of lifetimesranging from 6 to 26 ms. The two most pop-ulated states in the simulation, which togetheraccounted for 82% of the trajectory, are sup-ported by experimental data. The average struc-ture of the “crystallographic” state, which wasoccupied 27% of the time in our simulation, hadan RMSD (between nonsymmetric heavy atomsof residues 4 to 54) of only 0.8 Å from thecrystal structure (44). The most populated state(occupied 56% of the time) exhibits a left-handedconformation of the disulfide bridge betweenCys14 and Cys38, which has been previously sug-gested by NMR experiments (42, 43). The im-balance in populations between simulation andexperiment represents an error in the confor-mational free-energy difference of just a fewtimes the thermal energy, which falls withinthe expected accuracy range of the force fieldrepresentation.
In addition to the two states anticipated byprevious experiments, the systematic analysis ofthe dynamics provides evidence for the existenceof at least three additional states. In some, theexposed surface area of BPTI was large, as theconformation displayed an additional water-filled
cavity or even a pore; in others, the small N-terminal helix unfolded.
Separation of time scales in protein dynamics.As part of our analysis of the native-state dy-namics of BPTI, we performed dynamical con-tent calculations, derived from the autocorrelationof bond orientations over a very wide (and pre-viously inaccessible) range of time lags, to quan-tify the structural relaxation occurring on differenttime scales and the persistence of various struc-tural features (25). These analyses revealed a dis-tinct separation of time scales: Hopping amongconformational basins occurs on time scales onthe order of 10 ms, whereas motions within theindividual basins occur on a time scale that isfaster by several orders of magnitude. Substan-tially less dynamical content is measured withinthe wide gap that lies between these two timescales (Fig. 4B).
This separation of time scales, a hallmark ofbarrier-crossing dynamics (5), allowed us to par-tition the trajectory into distinct long-lived states(color-coded in Fig. 4A) using a new kinetic clus-tering scheme, which was designed to retain im-portant aspects of the long–time scale behaviorobserved in the MD simulation (25).
We found that the fast relaxations, which ex-tend up to the 10-ns time scale, originate primar-
ily from side-chain motions, whereas the slowrelaxations—corresponding to hops betweenwell-separated basins—originate almost exclusivelyfrom backbone motions (Fig. 4B). Apart fromlow-amplitude vibrations with frequencies severalorders of magnitude higher than those of con-formational state transitions, bond orientationswithin the backbone exhibit little variation withina given state; motion is “frozen out” not only atthe level of the protein’s global structure, but at alocal level within the polypeptide chain. Sidechains, on the other hand, experience large fluc-tuations on the nanosecond time scale; these fluc-tuations, however, are nearly identical in allconformational states, leading to the absence ofa long–time scale signature in the side-chain dy-namical content. These findings provide a unify-ing model, encompassing an extremely widerange of time scales, that integrates the previouslyestablished picture of “liquid-like” side chainsattached to a “solid backbone” (45, 46) with thecommon observation of distinct conformationalstates (2, 3).
The transition path time for conformationaltransitions was generally at least several hundrednanoseconds (25). This time—which might, ifanything, tend to increase with protein size—serves as a lower bound for the lifetime of indi-
Fig. 4. Native-state dynamics of BPTI.(A) All-residue backbone RMSD fromthe crystal structure with PDB ID 5PTI(44). Each point shows themedian valuein a window of 50 ns. The color of thedata points denotes cluster member-ship. [See (25) for PDB files represent-ative of each of the five most-visitedstates in the 1-ms simulation of BPTI,together with a more detailed analysisof the local structural features that bestdiscriminate each state from the others.](B) Dynamical content of the P2 internalcorrelation functions (25) and its de-composition into side-chain and back-bone contributions. The peak near 28 psresults from the relaxation of the sidechains within a conformation, whereasthe peak around 10 ms results from therelaxation of the backbone during jumpsbetween states. The cartoon shows thefractional contribution of each residueto the decay of the average internal cor-relation function between lag times of10 ns and 20 ms. (C) Crystal structure ofBPTI, highlighting the aromatics thatrotate slowly in purple and those thatrotate quickly in orange, with represent-ative structures from each of the fouradditional conformations observed inthe simulation. (D) Survival probabilitydistributions for each of the four internalwater molecules of BPTI. The arrow at14 ms marks the lifetime of the slowestwaters, as determined from a double-exponential fit of the tail of the W122survival times.
A
B
C
D
Log10 of survival time (s)
W111W112W113W122Fit
Log 1
0 of
sur
viva
l pro
babi
lity
−2
−3
−4
−5
−1
0
−6−9
Ave
rage
dyn
amic
al c
onte
nt
0.06
0.04
0.02
−9 −6−12Log10 of lag time (s)
All bonds
Side chain
Backbone
4%
6%
2%
0 0.2 0.4 0.6 0.8 1
Simulated time (ms)
1
2
3
Bac
kbon
e R
MS
D fr
om n
ativ
e (Å
)
www.sciencemag.org SCIENCE VOL 330 15 OCTOBER 2010 345
RESEARCH ARTICLES
on
Mar
ch 2
7, 2
011
ww
w.s
cien
cem
ag.o
rgD
ownl
oade
d fr
om

vidual conformational states. Even for a proteinas small as BPTI, this lower bound is more thanan order of magnitude larger than the time scaleof intrabasin side-chain motions. This observa-tion suggests that a distinct separation of timescales, with a region of reduced dynamical ac-tivity in the interval between those time regimes,is likely to be a common feature of the dynamicsof folded proteins.
Local probes that report on large-scale con-formational change. Seven of the eight aromaticrings of BPTI rotated in the simulation (25)with rates that generally agree with experiment(38, 41). We found that the rings that rotatedslowly in the simulation were all located in theportion of the protein that did not change duringhops between basins (purple side chains in Fig.4C). In contrast, the rings that rotated quickly inthe simulation were located in the portion of theprotein that changed in the different conforma-tional states (orange side chains in Fig. 4C) (25).
In agreement with experiment (40), the sim-ulation displayed three distinct behaviors for thefour internal water molecules (Fig. 4D), withW111 exchanging very rapidly with the solvent,W112 and W113 exchanging on a slower timescale, and W122 exchanging even more slowly.The tail of the survival probability of W122displays single-exponential decay with a lifetimeof 14 ms, suggesting that the longest-lived watershave a single escape mechanism. The bindingevents of the eight longest-lived instances ofW122 (each bound for more than 9 ms) all oc-curred while the simulation was in the “crystal-lographic” state. Accordingly, the lifetime of thisstate in the simulation (25 ms) is longer than thelifetime of W122 (14 ms). The lifetime of thelongest-lived waters may thus provide an exper-imentally measurable lower bound on the life-time of the protein conformation that most tightlybinds to that water.
The water escape path lasted only a few pico-seconds. Before the escape, a small pocket openedon the protein surface that allowed a single watermolecule to form a hydrogen bond with W122;W122 took the place of that hydrogen-bondedwater, and a transient empty cavity was createdinside the protein. The wide contrast between thelifetime of W122 and the duration of its exit andentry pathways suggests that ligand entry andescape can proceed without the need for long-lived intermediate conformations; thus, bindingand escape events can be considerably faster thanthe lifetime of the ligand.
Transition path times for conformationalchanges. Conformational changes such as thosedescribed here for FiP35 and BPTI differ fromsimpler chemical reactions in that the formeroccur on a rough free-energy landscape charac-terized by many local minima. The roughness ofthe landscape manifests itself in a substantial slow-down of conformational changes and in a kineticpreexponential factor, k0, that is many orders ofmagnitude larger than the value expected for ele-mentary reactions in small molecules. Using the
folding rate and barrier height we obtained forFiP35, we estimate the preexponential factor tobe ~1 ms−1. A related quantity is the averagetransition-path time ⟨tTP⟩ (i.e., the time requiredfor the actual conformational change to occur).This value is also expected to be sensitive to thelandscape roughness. We obtained a ⟨tTP⟩ value of0.4 ms for the folding reaction of FiP35 and 0.3 msfor the conformational changes observed in BPTI.
Indirect estimates for k0 and ⟨tTP⟩ have pre-viously been proposed on the basis of theory andexperiment (6, 12, 24, 37, 47, 48), but thesefundamental quantities have proven difficult tomeasure. The microsecond time scales associatedwith these constants are not only in generalagreement with previous estimates, but also closeto the observed time scales for conformationalchanges in FiP35 and BPTI, thus strengtheningthe notion that landscape roughness is a majordeterminant of the rates for conformationaltransitions in biological macromolecules.
Conclusions. The specialized machine wedeveloped has allowed us to perform continuous,all-atom molecular dynamics simulations ofproteins in an explicitly represented solvent en-vironment over periods as much as 100 timeslonger than was previously feasible. Compari-son of the results of these simulations with ex-perimental measurements provides evidencefor the non-obvious finding that existing forcefields are capable of realistically describing ofthe structure and dynamics of proteins overeven these extended time scales. More generally,our findings suggest that very long moleculardynamics simulations can serve as a powerfultool for elucidating the atomic-level behaviorof proteins on a biologically critical but previ-ously inaccessible time scale.
References and Notes1. A. Mittermaier, L. E. Kay, Science 312, 224 (2006).2. A. K. Gardino et al., Cell 139, 1109 (2009).3. J. P. Abrahams, A. G. W. Leslie, R. Lutter, J. E. Walker,
Nature 370, 621 (1994).4. H. Noji, R. Yasuda, M. Yoshida, K. Kinosita Jr., Nature
386, 299 (1997).5. H. Frauenfelder, S. G. Sligar, P. G. Wolynes, Science 254,
1598 (1991).6. H. S. Chung, J. M. Louis, W. A. Eaton, Proc. Natl. Acad.
Sci. U.S.A. 106, 11837 (2009).7. H. Lei, Y. Duan, Curr. Opin. Struct. Biol. 17, 187 (2007).8. C. D. Snow, H. Nguyen, V. S. Pande, M. Gruebele, Nature
420, 102 (2002).9. J. L. Klepeis, K. Lindorff-Larsen, R. O. Dror, D. E. Shaw,
Curr. Opin. Struct. Biol. 19, 120 (2009).10. P. L. Freddolino, F. Liu, M. Gruebele, K. Schulten,
Biophys. J. 94, L75 (2008).11. D. E. Shaw et al., Millisecond-scale molecular
dynamics simulations on Anton. In Proceedings of theACM/IEEE Conference on Supercomputing (SC09)(ACM Press, New York, 2009).
12. F. Liu et al., Proc. Natl. Acad. Sci. U.S.A. 105,2369 (2008).
13. J. A. McCammon, B. R. Gelin, M. Karplus, Nature 267,585 (1977).
14. M. Levitt, A. Warshel, Nature 253, 694 (1975).15. M. Jäger et al., Proc. Natl. Acad. Sci. U.S.A. 103,
10648 (2006).16. S. Deechongkit et al., Nature 430, 101 (2004).17. M. Jäger, H. Nguyen, J. C. Crane, J. W. Kelly,
M. Gruebele, J. Mol. Biol. 311, 373 (2001).
18. M. Petrovich, A. L. Jonsson, N. Ferguson, V. Daggett,A. R. Fersht, J. Mol. Biol. 360, 865 (2006).
19. P. L. Freddolino, S. Park, B. Roux, K. Schulten,Biophys. J. 96, 3772 (2009).
20. F. Noé, C. Schütte, E. Vanden-Eijnden, L. Reich,T. R. Weikl, Proc. Natl. Acad. Sci. U.S.A. 106,19011 (2009).
21. D. L. Ensign, V. S. Pande, Biophys. J. 96, L53 (2009).22. J. Juraszek, P. G. Bolhuis, Biophys. J. 98, 646 (2010).23. K. Lindorff-Larsen et al., Proteins Struct. Funct.
Bioinform. 78, 1950 (2010).24. J. Kubelka, T. K. Chiu, D. R. Davies, W. A. Eaton,
J. Hofrichter, J. Mol. Biol. 359, 546 (2006).25. See supporting material on Science Online.26. S. Gianni et al., Proc. Natl. Acad. Sci. U.S.A. 100,
13286 (2003).27. E. L. McCallister, E. Alm, D. Baker, Nat. Struct. Biol.
7, 669 (2000).28. M. Karplus, D. L. Weaver, Protein Sci. 3, 650 (1994).29. R. B. Best, G. Hummer, Proc. Natl. Acad. Sci. U.S.A. 102,
6732 (2005).30. A. Matouschek, J. T. Kellis Jr., L. Serrano, A. R. Fersht,
Nature 340, 122 (1989).31. M. Vendruscolo, E. Paci, C. M. Dobson, M. Karplus,
Nature 409, 641 (2001).32. E. Cota, S. J. Hamill, S. B. Fowler, J. Clarke, J. Mol. Biol.
302, 713 (2000).33. H. Nymeyer, N. D. Socci, J. N. Onuchic, Proc. Natl. Acad.
Sci. U.S.A. 97, 634 (2000).34. G. Settanni, F. Rao, A. Caflisch, Proc. Natl. Acad. Sci.
U.S.A. 102, 628 (2005).35. C. D. Geierhaas, X. Salvatella, J. Clarke, M. Vendruscolo,
Protein Eng. Des. Sel. 21, 215 (2008).36. A. R. Fersht, S. Sato, Proc. Natl. Acad. Sci. U.S.A. 101,
7976 (2004).37. F. Liu, M. Nakaema, M. Gruebele, J. Chem. Phys. 131,
195101 (2009).38. K. Wüthrich, G. Wagner, FEBS Lett. 50, 265 (1975).39. G. Otting, E. Liepinsh, K. Wüthrich, Science 254,
974 (1991).40. E. Persson, B. Halle, J. Am. Chem. Soc. 130, 1774
(2008).41. G. Wagner, D. Brühwiler, K. Wüthrich, J. Mol. Biol. 196,
227 (1987).42. G. Otting, E. Liepinsh, K. Wüthrich, Biochemistry 32,
3571 (1993).43. M. J. Grey, C. Wang, A. G. Palmer 3rd, J. Am. Chem. Soc.
125, 14324 (2003).44. A. Wlodawer, J. Walter, R. Huber, L. Sjölin, J. Mol. Biol.
180, 301 (1984).45. Y. Zhou, D. Vitkup, M. Karplus, J. Mol. Biol. 285,
1371 (1999).46. K. Lindorff-Larsen, R. B. Best, M. A. DePristo,
C. M. Dobson, M. Vendruscolo, Nature 433, 128(2005).
47. S. Chakrapani, A. Auerbach, Proc. Natl. Acad. Sci. U.S.A.102, 87 (2005).
48. J. Kubelka, J. Hofrichter, W. A. Eaton, Curr. Opin. Struct.Biol. 14, 76 (2004).
49. M. Jäger, M. Dendle, J. W. Kelly, Protein Sci. 18,1806 (2009).
50. We are very grateful to all members of the Antonhardware and software teams, without whom thiswork would not have been possible. We thank G. Hummerfor providing us with the software to calculateposition-dependent diffusion constants, A. Pan forhelpful suggestions, T. Tu for assisting with trajectoryanalysis, A. Philippsen for helping with the BPTIrenderings, K. Mackenzie for monitoring and supportingthe BPTI simulation, and R. Kastleman and J. McGradyfor editorial assistance.
Supporting Online Materialwww.sciencemag.org/cgi/content/full/330/6002/341/DC1Materials and MethodsFigs. S1 to S14Tables S1 to S3PDB files S1 to S5
22 January 2010; accepted 31 August 201010.1126/science.1187409
15 OCTOBER 2010 VOL 330 SCIENCE www.sciencemag.org346
RESEARCH ARTICLES
on
Mar
ch 2
7, 2
011
ww
w.s
cien
cem
ag.o
rgD
ownl
oade
d fr
om