Embed Size (px)
Citation preview

National Aeronautics and Space Administration
www.nasa.gov
ATM Technology Demonstration 1(ATD-1)
EcoDemonstrator ASTAR Guided Arrival Research (EAGAR)
Roy RoperProject OutbriefJanuary 29, 2015
1

Sequence of Events Leading to EAGAR
In Spring 2013, high level NASA and Boeing management were seeking opportunities to collaborate on a flight test activity involving the ecoDemonstrator.
The Airspace Systems Program Office identified FIM as a viable candidate.
ATD‐1 accepted the challenge.
Work began in July for a December 2013 flight test.
2

Objectives
Conduct a rapid collaborative development effort with Boeing to equip the 2013 ecoDemonstrator test aircraft (B787‐800) with an ASTAR‐based airborne spacing tool.
Conduct a flight test to demonstrate precision spacing between two aircraft with the aid of NASA’s ASTAR algorithm.
3

Minimum Success Criteria
ATD‐1: Successful rapid collaboration between NASA and Boeing
4
YES
YES
FIM operation: Both Target and FIM aircraft fly from initial waypoint to FAF without interruption (vectors, etc).
Was it feasible in the real world?
Was the software robust and perform as expected?
FIM software: Continuous progression to achieve assigned spacing goal behind Target aircraft.

“Stretch” Success Criteria
Demonstrate consistent final spacing within +/‐5 seconds at the FIM termination point.
5
Run # Delivery Accuracy1 ‐7.52 1.53 1.44 25 ‐3.5
Std. Dev. 4.16Range 9.5

Flight Test Approach
Equip the ecoDemostrator with the ASTAR‐based application hosted on a laptop PC
Conduct an arrival sequence and connect to a published approach procedure into a dedicated test airport
Target and Ownship aircraft fly on the same route from TOD to runway:• Start 100‐120 miles from runway; line up with ATC help
• Arrival procedure is typed into the FMS, approach is loaded, then full route connected together
• Locate target, enter clearance, and initiate test
6

The Plan / The Reality
Lab Testing for software integration / Occurred at four locations
Ground Testing aboard the airplane to ensure laptop is receiving required data / ~7 hours over two days
4 meetings with Air Traffic Control supported by Boeing Flight Test Analysis and Flight Test Operations / Many more, but mostly without Analysis or Ops
2 hours of concurrent testing to monitor the system in flight / 8 hours in the air, no NASA personnel taking part
6 hours of dedicated flight time over 2 days, ~6 runs / ~6 hours, 1 day, 5 runs
7
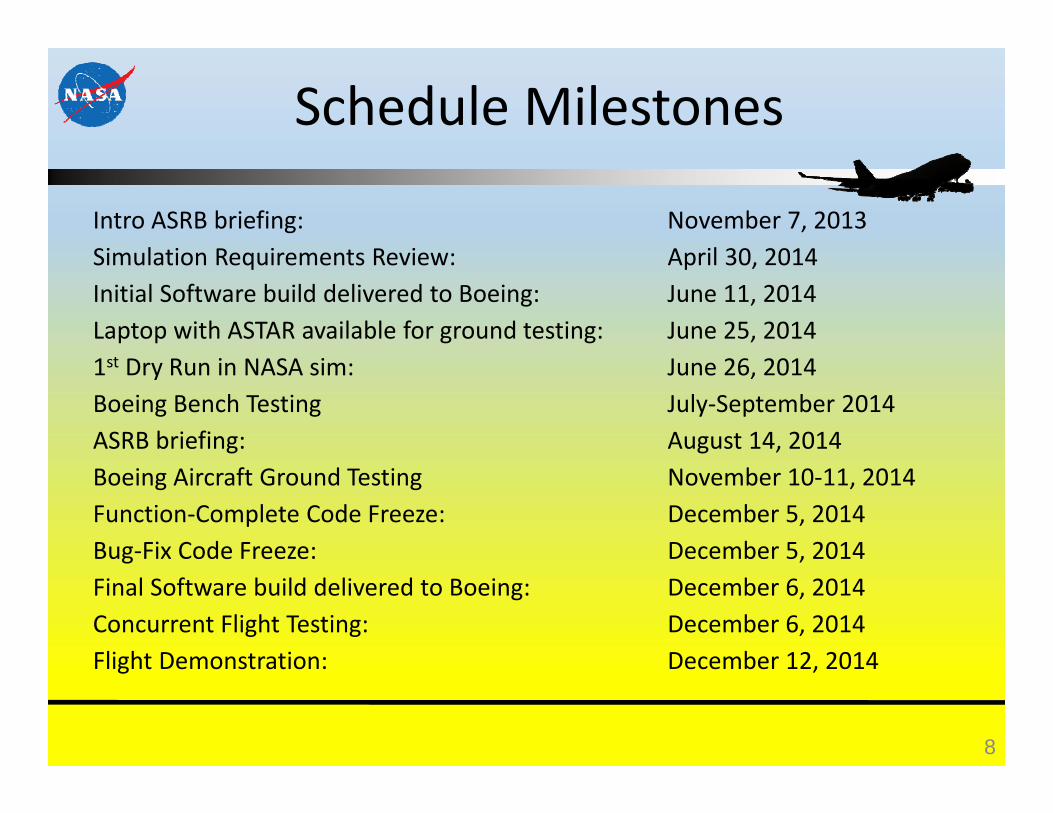
Schedule Milestones
Intro ASRB briefing: November 7, 2013Simulation Requirements Review: April 30, 2014Initial Software build delivered to Boeing: June 11, 2014Laptop with ASTAR available for ground testing: June 25, 20141st Dry Run in NASA sim: June 26, 2014Boeing Bench Testing July‐September 2014ASRB briefing: August 14, 2014Boeing Aircraft Ground Testing November 10‐11, 2014 Function‐Complete Code Freeze: December 5, 2014Bug‐Fix Code Freeze: December 5, 2014Final Software build delivered to Boeing: December 6, 2014Concurrent Flight Testing: December 6, 2014Flight Demonstration: December 12, 2014
8

Participants
NASA• Laptop Operator• Developers supporting flight• Ground observers within FAA ATC facilities
Boeing• Developer and Flight Test Engineers supporting the flight• Test Pilots (2 B787 & 1 T‐38)
FAA• Seattle Center and Grant County Approach Air Traffic Controllers
9

Target Aircraft Search
10
Alaska Airlines B737NG ASTOR Simulated Model FAA Global Express 5000
T‐33 T‐38

Airport Search
It took several months to settle on an airport• Seattle, WA – KSEA• Phoenix, AZ – KPHX• Moses Lakes, WA – KMWH• Denver, CO – KDEN• Glasgow, MT – KGGW
11

Avionics Architecture Overview
12
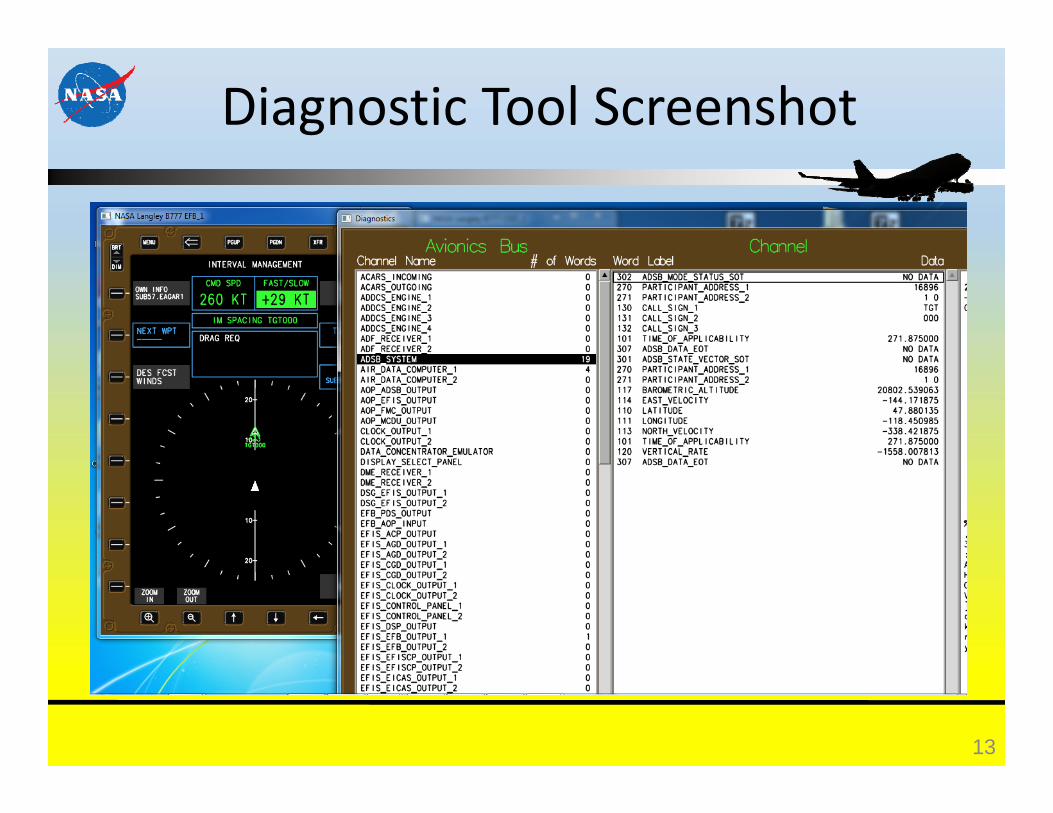
Diagnostic Tool Screenshot
13

Scheduling and Spacing Technologies
Flight Deck‐based Interval Management
ASTAR Ver. 12
Build: EAGAR_14_5_2014DEC05R‐PARTS.exe
Navigation Database Cycle 201412
14

Demo Arrival Location
15

Full Route Structure
16

17
Concurrent Testing Route Structure
Test location dependent on weather
Development team built routes to cover all areas
Location was decided the morning of test (over ocean)
Olympia Arrival built, tested, and e‐mailed up while still flying

18
First FIM

Dec. 6 Concurrent Testing
19
IM Ops conducted over 64 nmi (7713 nmi from Rwy)~20 minutes

Dec. 6 Concurrent Testing
20
‐30
‐20
‐10
0
10
20
30
200
210
220
230
240
250
260
500 520 540 560 580 600 620 640 660 680 700
Time‐error (sec)
Speeds (kt)
Run Time (sec)
Ownship speeds and time‐error
ProfileCas
CmdEnd
CAS
RTE
24 sec to speed change
16 sec to speed change
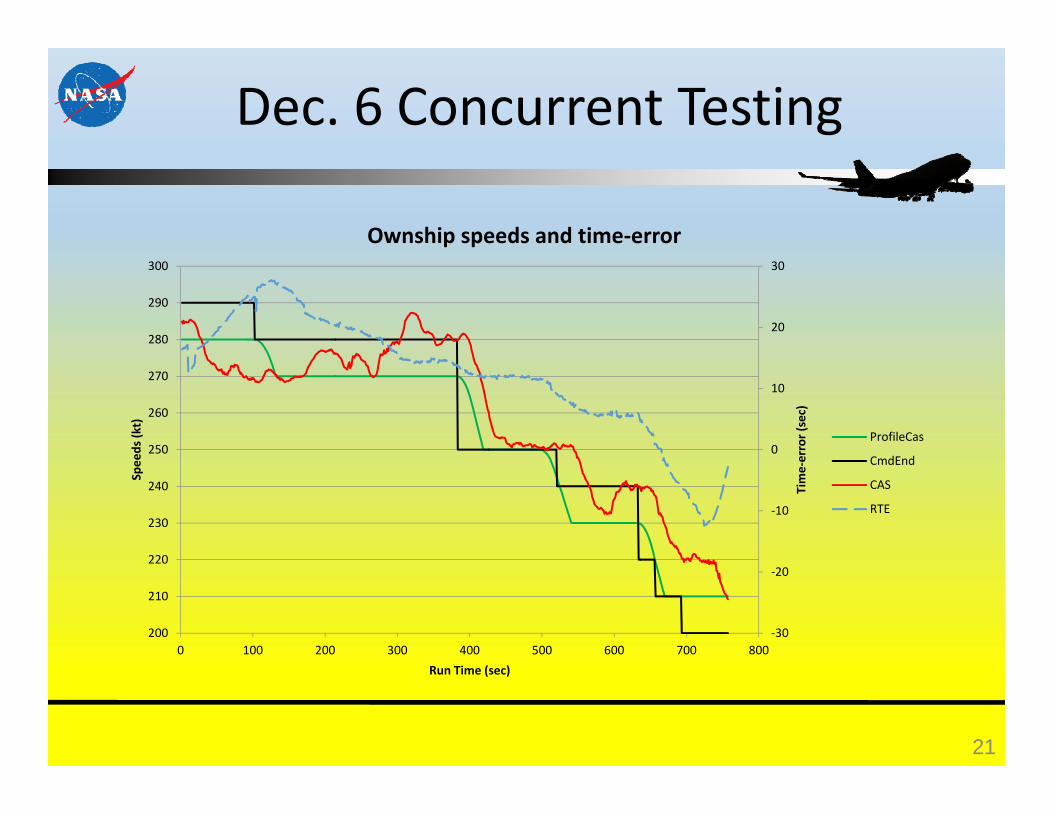
Dec. 6 Concurrent Testing
21
‐30
‐20
‐10
0
10
20
30
200
210
220
230
240
250
260
270
280
290
300
0 100 200 300 400 500 600 700 800
Time‐error (sec)
Speeds (kt)
Run Time (sec)
Ownship speeds and time‐error
ProfileCas
CmdEnd
CAS
RTE
EAGARDemonstration
Flight
22

Flight Demonstration Materials
Flight Test Plan and Communication Protocol packet
Boeing Flight test plan
Controller Briefing Packet
Pilot Flight Test Cards
Briefing packet for ground observers at FAA ATC facilities
23

Test Setup
VHF radio frequency required to enable communication between the airplane and chase
Flight Interphone jacks and headsets at participant locations on B787
Ethernet connections from the cockpit to the ASTAR laptop
115 volt/60 Hz power available at all workstations
All laptops adhered to workstations with Velcro
All participants properly briefed
24

Test Requirements
Contiguous US – flight testing
Daylight only, VMC
See and Avoid – 14CFR 91.113(b)
Sparsely populated area or over water only
Coordinate with applicable ARTCC in advance. Stay under ATC control, or pre‐coordinated agreements.
Below FL180, local altimeter setting used by both aircraft
25

Test Sequence
• Depart KBFI and fly test profile into KMWH to the FAF
Schedule: Run 1 / T‐38 refuel / Run 2‐4 / T‐38 refuel / Run 5
• Upon conclusion of demonstration, return to KBFI.
26
Run # Initial Speed Initial Altitude Arrival T‐38 Arrival B787 In‐Trail Distance1 280 FL220 SUBDY SUBDY 13 nm2 280 FL220 KNOCK KNOCK 16 nm3 280 FL220 SUBDY SUBDY 10 nm4 280 FL220 SUBDY KNOCK5 280 FL220 SUBDY KNOCK
Initial fixes at same time (7.5 nm)
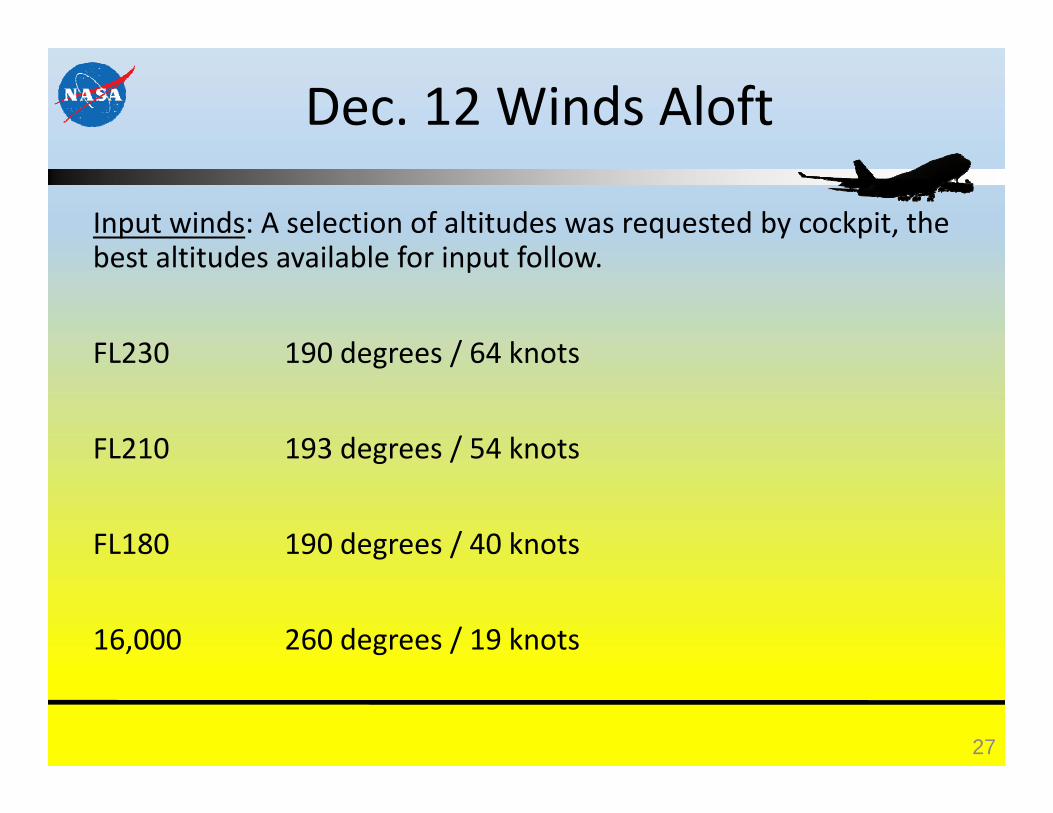
Dec. 12 Winds Aloft
Input winds: A selection of altitudes was requested by cockpit, the best altitudes available for input follow.
FL230 190 degrees / 64 knots
FL210 193 degrees / 54 knots
FL180 190 degrees / 40 knots
16,000 260 degrees / 19 knots
27

Input Speeds to ASTAR
Run Cruise Speeds Descent Speeds1 0.65 Mach / 280 knots 0.62 Mach / 270 knots2 0.76 Mach / 340 knots 0.62 Mach / 270 knots3 0.64 Mach 0.62 Mach / 280 knots4 0.65 Mach / 300 knots 0.62 Mach / 280 knots5 0.65 Mach 0.62 Mach / 280 knots
28

Weather at Grant County Airport
Initial METAR at KMWH 7000’ OVC
ATIS for KMWH (During Run 2): Calm, 10 miles visibility, 8500 OVC, Temp 6, Dewpoint 4, Altimeter 29.73.
Icing at 10,000 ft.
AIRMET in the vicinity with wind shear
29
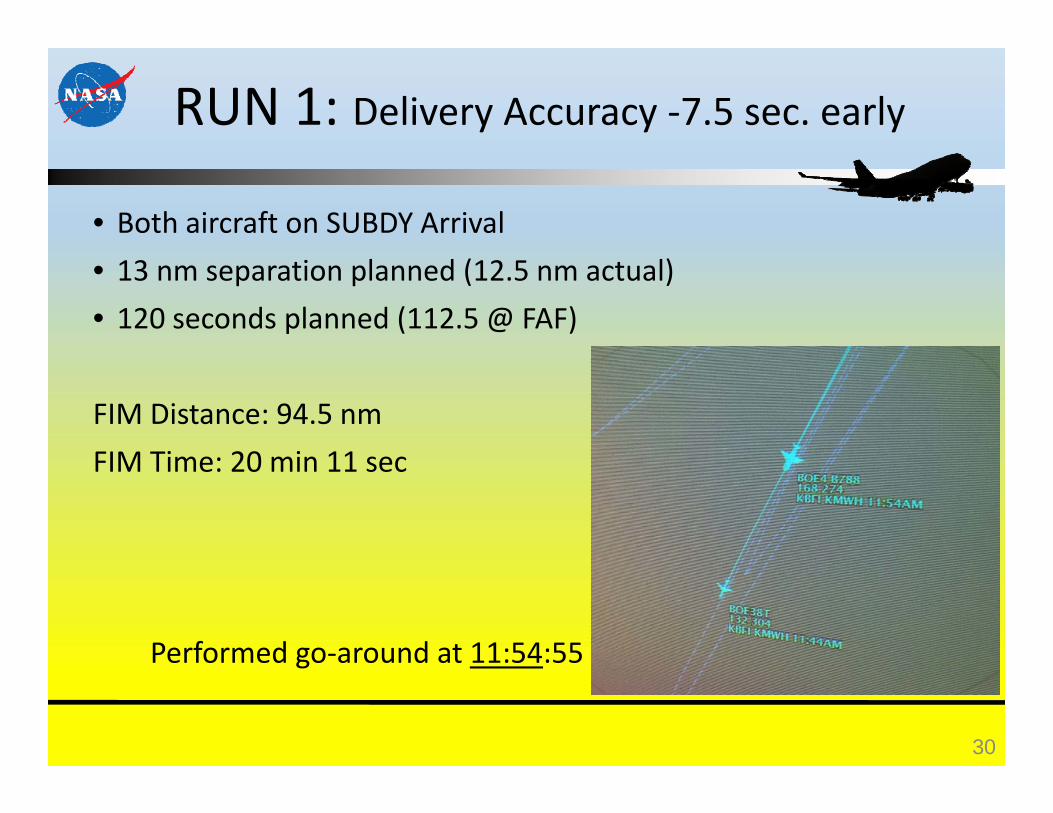
RUN 1: Delivery Accuracy ‐7.5 sec. early
• Both aircraft on SUBDY Arrival• 13 nm separation planned (12.5 nm actual)• 120 seconds planned (112.5 @ FAF)
FIM Distance: 94.5 nmFIM Time: 20 min 11 sec
Performed go‐around at 11:54:55
30

Run 1 Profile
31

Run 1
• 3 speed inversions• 13 speed commands (1 command/1 min. 33 sec)• B787 performed a go‐around b/c T‐38 was on runway
32
Grant County International Airport, Moses Lakes, WA

Run 1: Joining SUBDY Arrival
33

Run 1: Turn at UPBOB
34

Run 1: Turn to Final
35
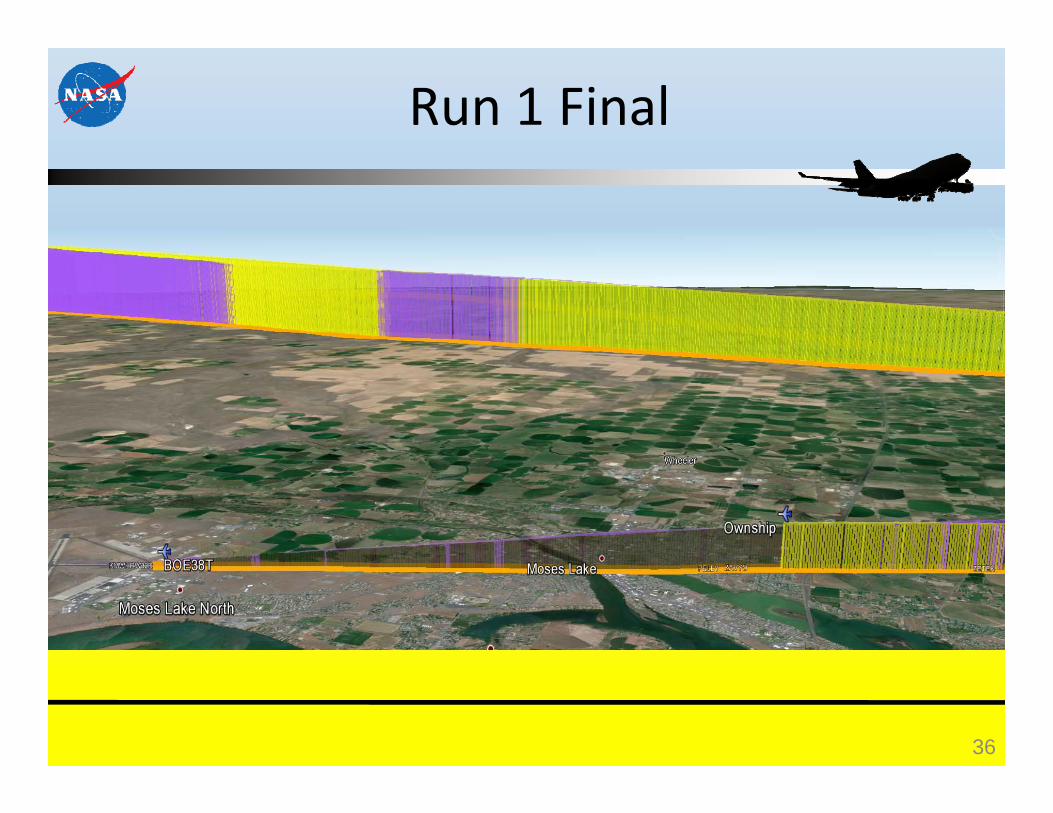
Run 1 Final
36

Run 2: Delivery Accuracy +1.5 sec. late
• Both aircraft on KNOCK Arrival• 16 nm separation planned (24.12 nm actual)• 120 seconds planned, 150 sec. actual (151.5 @ FAF)
37
FIM Distance: 89.9 nm
FIM Time: 17 min 54 sec

Run 2
• 3 speed inversions• 14 speed commands (1 command / 1 min. 17 sec.)
38
Ownship departs ahead of T‐38 and holds, but gets disoriented for the initial setup. T‐38 performs a teardrop entry.
Causes ownship to get behind schedule, maintains 340 kts. airspeed to try to make up the distance.

Run 3 & 3A
39

Run 3
Poor setup prior to run
• ASTAR on ~8 min. with no pairing
• OWNSHIP OFF PATH message
• Cockpit stated B787 was on path
• Paired 8 sec. prior to shutdown
• 6.14 nm separation at shutdown
40

Run 3A: Delivery Accuracy +1.4 sec. late
• Both aircraft on SUBDY Arrival• 10 nm separation planned (6.23 nm actual)• 120 seconds planned,(121.4 sec @ FAF)
FIM Distance: 43.78 nmFIM Time: 10 min 48 sec
41

Run 3A
42

Run 3A
• 1 speed inversion• 7 speed commands (1 command / 1 min. 17 sec.)• Forecast winds were not entered on this run due to time constraints
43

Run 4: Delivery Accuracy +2.0 sec. late
• T‐38 Target on SUBDY Arrival, B787 Ownship on KNOCK Arrival• 7.5 nm separation planned with concurrent arrival at IAFs• Poor initial setup• 1.63 nm along route separation• 120 seconds planned(122 @ FAF)
FIM Distance: 71.59 nmFIM Time: 17 min 40 sec
44

Run 4
45

Run 4
46

Run 4
47

Run 4
48
About where we achieved 3 nm spacing

Run 4
49
Unpaired for 5 seconds, right here

Run 4
50
• 4 speed inversions• 13 speed commands (1 command / 1 min. 26 sec.)

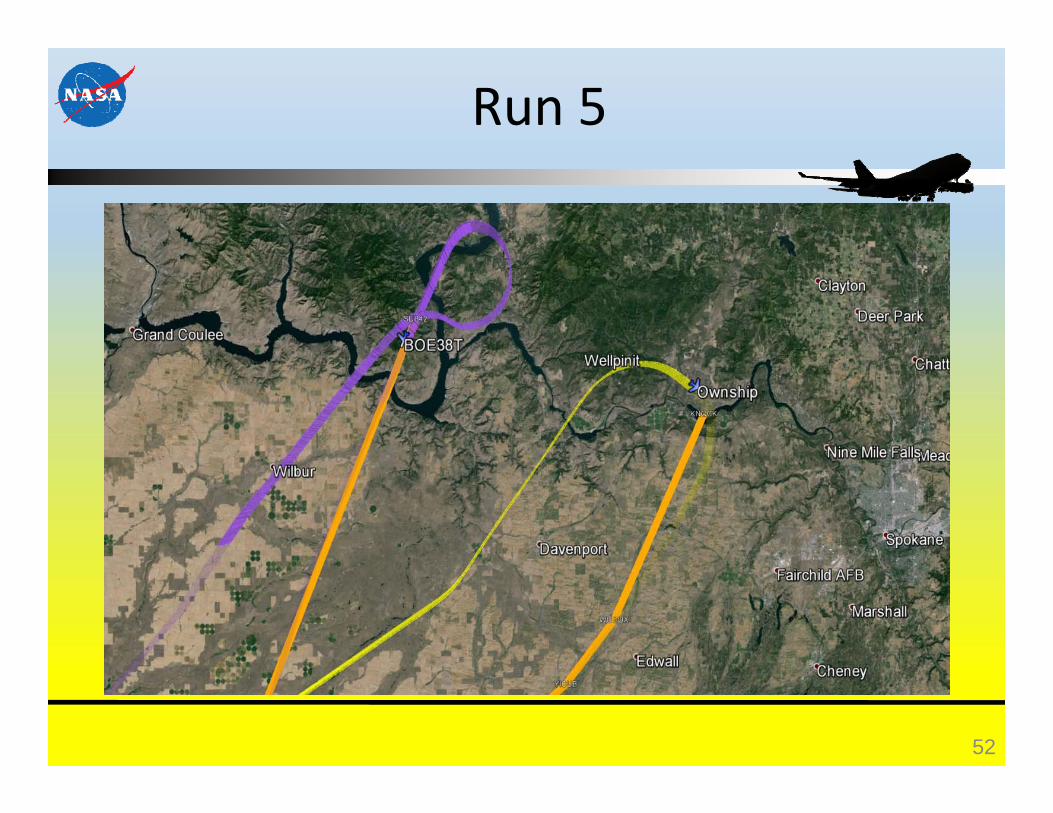
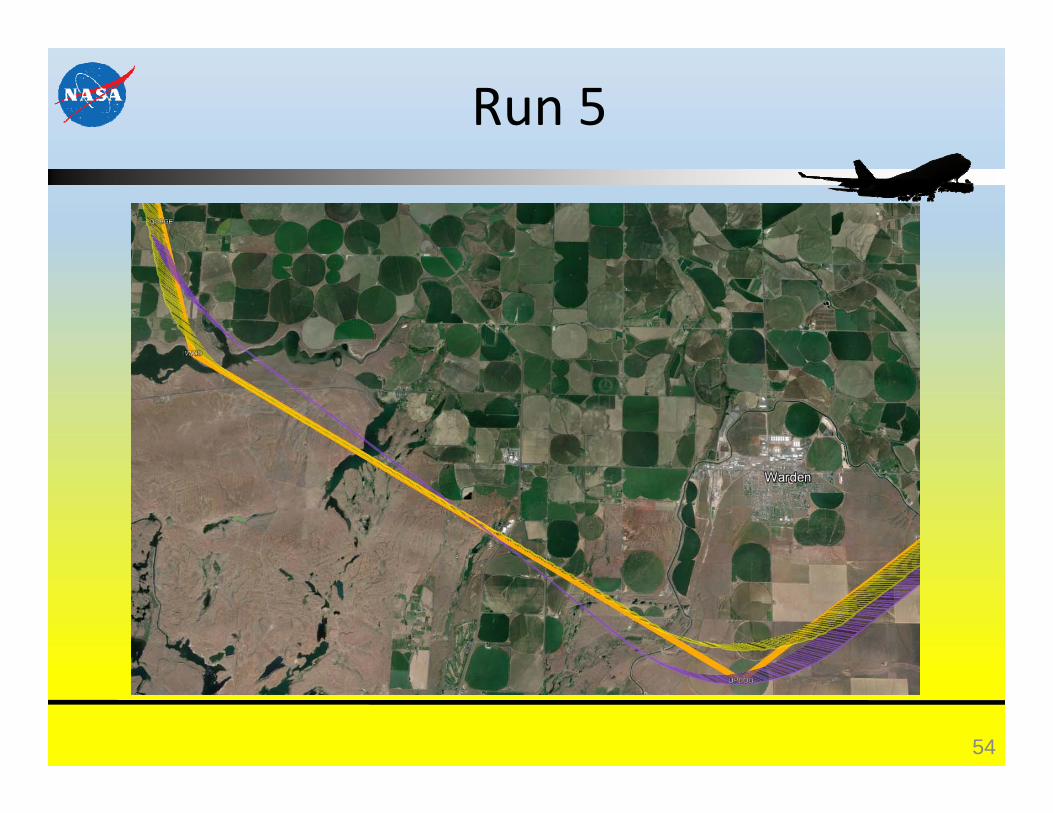
Run 5: Delivery Accuracy ‐3.5 sec. early
• T‐38 Target on SUBDY Arrival, B787 Ownship on KNOCK Arrival• 7.5 nm separation planned with concurrent arrival at IAFs• 10.83 nm along route separation• 120 seconds planned(116.5 @FAF)
FIM Distance: 85.88 nmFIM Time: 18 min 33 sec
51
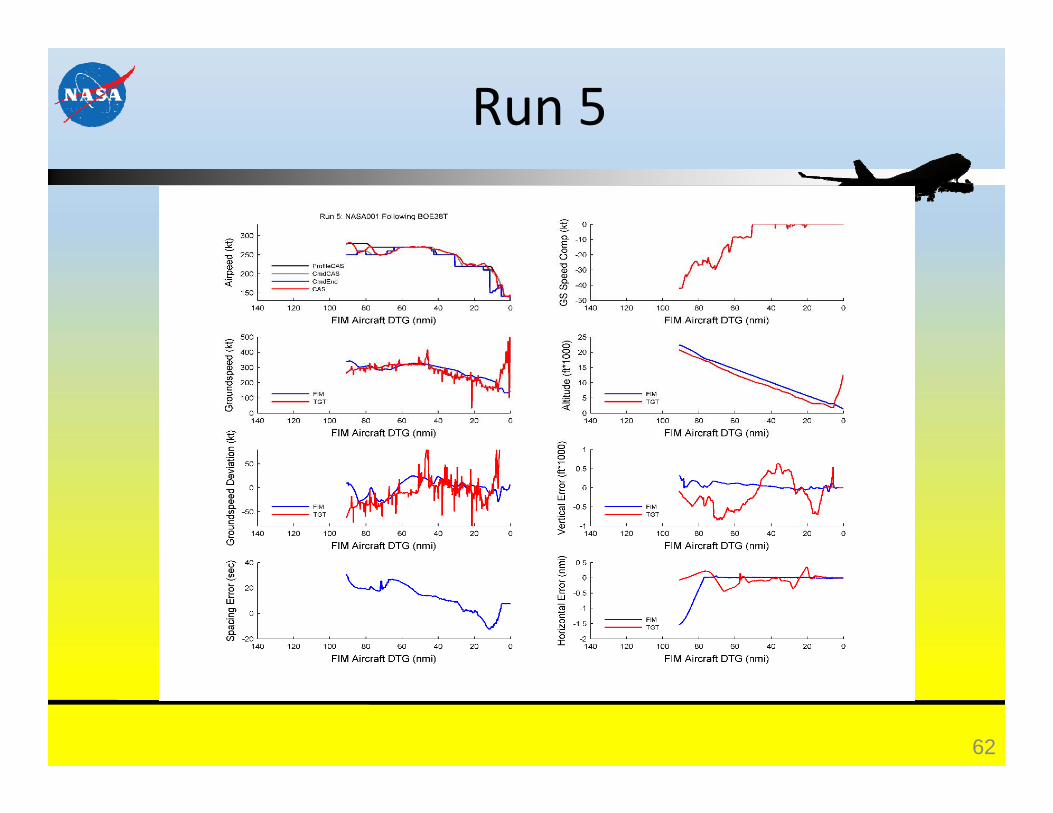
Run 5
52

Run 5
53
Run 5
54

Run 5
55
• 3 speed inversions• 14 speed commands (1 command / 1 min. 20 sec.)
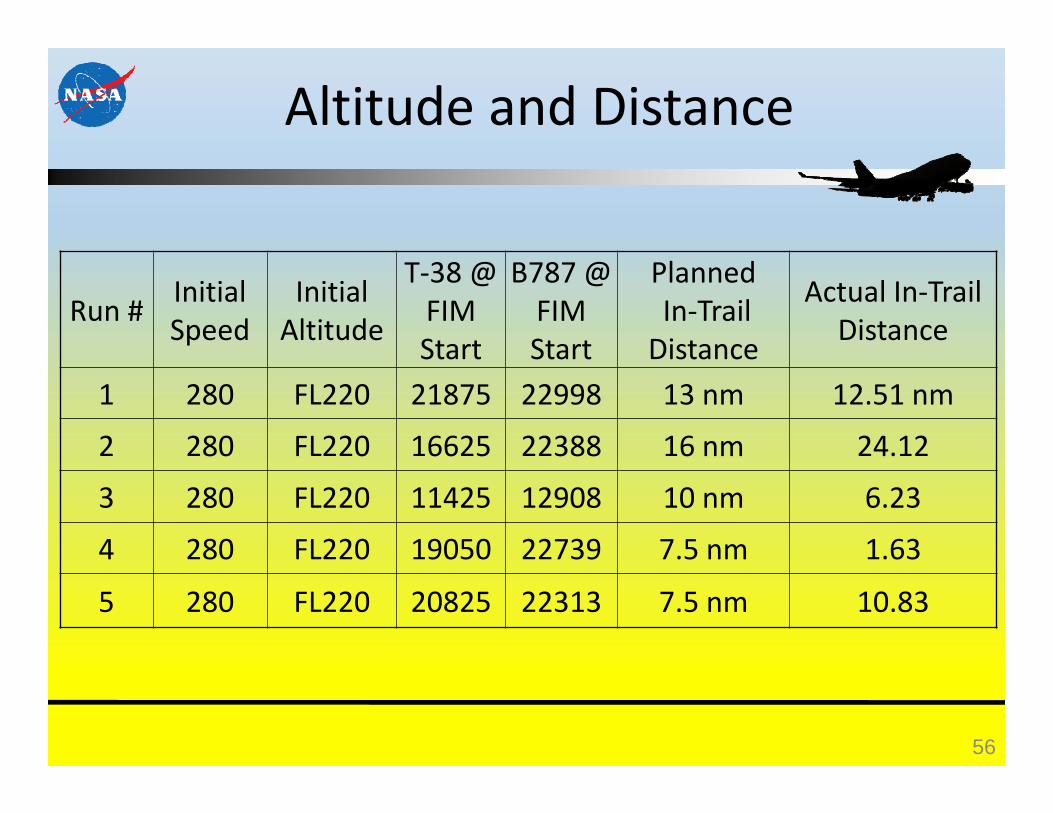
Altitude and Distance
56
Run # Initial Speed
Initial Altitude
T‐38 @FIM Start
B787 @ FIM Start
PlannedIn‐Trail Distance
Actual In‐Trail Distance
1 280 FL220 21875 22998 13 nm 12.51 nm
2 280 FL220 16625 22388 16 nm 24.12
3 280 FL220 11425 12908 10 nm 6.23
4 280 FL220 19050 22739 7.5 nm 1.63
5 280 FL220 20825 22313 7.5 nm 10.83

FIM Distance
57
Run # FIM Distance1 94.52 89.93 43.84 71.65 85.9
Average 77.14
• Objective was to get between 80‐100 nm of data

Run 1
58

Run 2
59

Run 3A
60

Run 4
61
Run 5
62

Altitude
63
SUBDY Arrival
Dual RouteKNOCK Arrival

Groundspeed 1
64
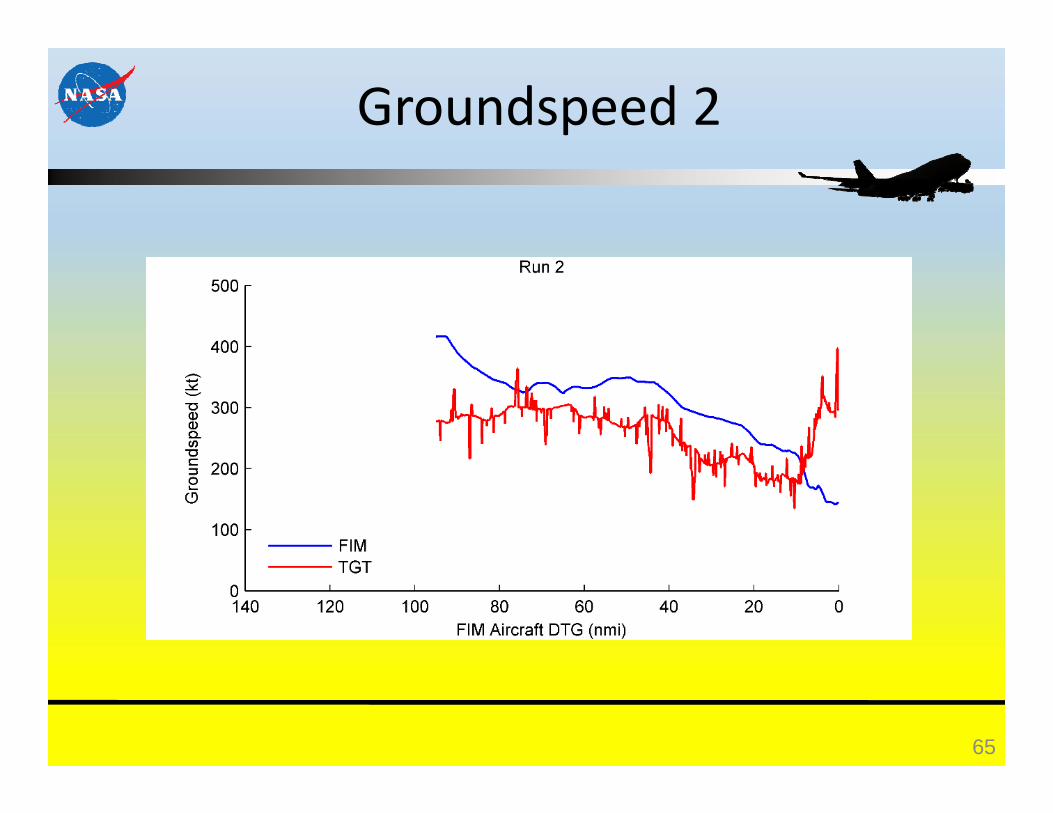
Groundspeed 2
65

Groundspeed 3
66

Groundspeed 4
67

Groundspeed 5
68

Groundspeed Deviation 1
69

Airspeed 1
70

Spacing Error 1
71

Groundspeed Deviation 2
72

Airspeed 2
73

Spacing Error 2
74
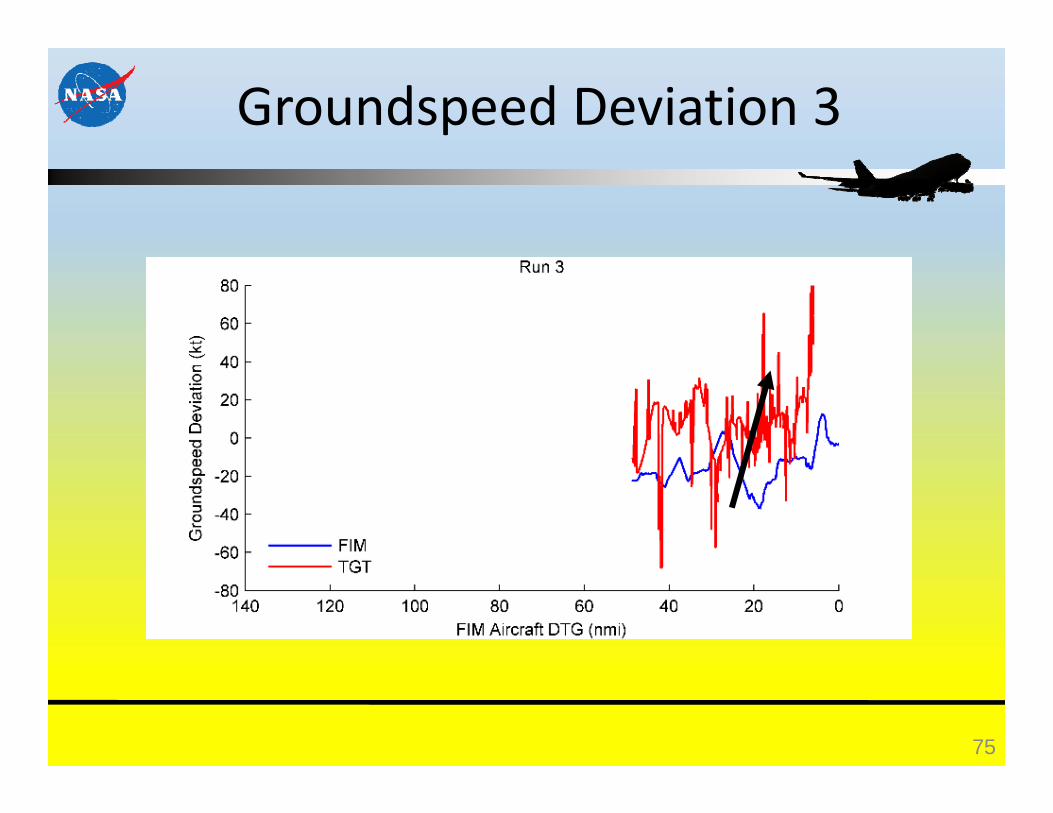
Groundspeed Deviation 3
75

Vertical Track Error 3
76
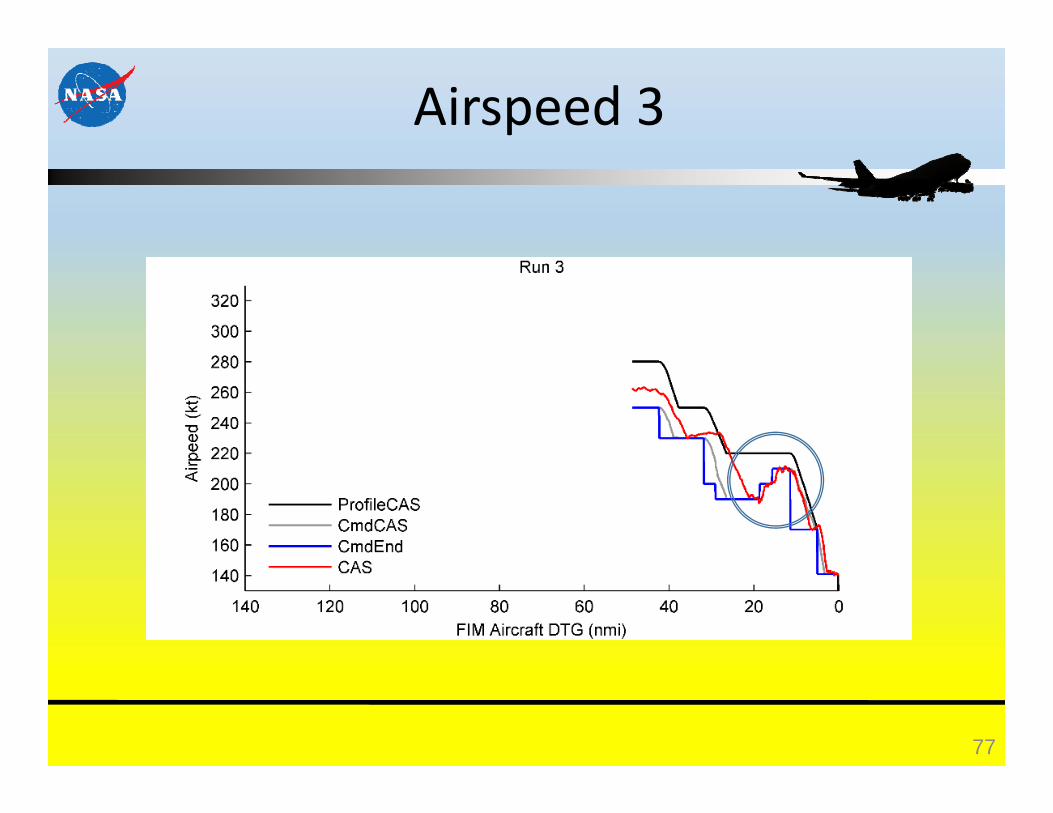
Airspeed 3
77

Spacing Error 3
78

Groundspeed Deviation 4
79

Airspeed 4
80
ADS‐B / ISS failure
ADS‐B / ISS failure

Spacing Error 4
81
ADS‐B / ISS failure

Groundspeed Deviation 5
82

Airspeed 5
83

Spacing Error 5
84

Vertical Track Error 1
85
“Cleared SUBDY descent down to 5000”
Pilot: "Stuck at 5000 until Clearance"

Vertical Track Error 2
86

Vertical Track Error 4
87

Vertical Track Error 5
88

Horizontal Track Error 1
89

Horizontal Track Error 2
90

Horizontal Track Error 3
91

Horizontal Track Error 4
92

Horizontal Track Error 5
93

Test Issues
• ADS‐B was experimental and circuit breaker had to be reset just prior to testing (day of concurrent testing)
• Floating point issue with the Rockwell ISS unit• Cmd speeds on inbound track sometimes below landing airspeed limitation for B787 (155 CMD v. 165 Stall for config.)
• T‐38 fuel limited: Shortcut the route and time he had available to fly – affected aircraft positioning and decision making
• T‐38 was vertically challenged to dodge icing and stay within the algorithm performance
• Winds aloft were not given until in the air.• In‐trail distances ranged 22.6 nm instead of 8.5 nm (We went almost three times the planned in‐trail distance range – FIM can handle slop.)
94

Test Issues
• Substitute pilots the day of the demonstration.• Pilots have no reference to perform FIM, no training – compare to simulation testing in RAPTOR/CA 5.3.
• T‐38 performed teardrop entries, B787 didn’t• T‐38 was GPS limited: Entered MWH, not KMWH to prevent flight plan termination. No time/ability to re‐input everything.
• ATC re‐input new flight plans after every run ‐ High workload.• Other conversations on a single party line meant waiting to issue speed commands, sometimes 20‐30 seconds.
• B787 overly aggressive with the speed brakes on initial run, then under aggressive on subsequent runs.
• Simulation studies designed the simulated aircraft to fly route to the runway. Unintended consequence: No summary log if the aircraft doesn’t land.
95

Safety Issues
• Fuel leak in one of the wings, while being fixed a second leak was discovered. Boeing suggested they would fly off the gas in the other wing and central tank. (not discussed in prebrief)
• Icing along route using an aircraft not equipped with deice• 1 out of 2 radios lost at startup on T‐38 – Pilot could either communicate with ATC or the B787, but not both. He decided if he declared it, the test would get cancelled.
• Resulted in ATC confusion, because T‐38 was communicating when not expected. (B787 was communications leader)
• B787 was eager to get to same frequency with T‐38 because it was the only way either could know what the other a/c was doing (or else T‐38 had to leave ATC frequency)
96

Lessons Learned
• Key logging for the Flight Test Gateway output (when we check to see where aircraft are located in reference to us)
‐Allows for a point of reference• Streamline route building, testing, and packaging• Realtime .kmz graphics on Google Earth• Color coordination on the .kmz files to recognize On/Activate/Execute periods graphically
• Large database for queries to pull in different data sets• Training – Better pilot understanding of FIM and test setup. If one does teardrop, then “follow the leader”.
• Summary logs without Weight‐on‐Wheels
97

Lessons Learned
• We have all the ADS‐B data for other aircraft while we flew.
• We can build new custom routes that allow us to FIM behind them in simulation and further verify our software and algorithm.
98

Lessons Learned
• ASTAR In/Out data • ERAM displays from Seattle Center• Boeing providing flight deck display videos and timestamp• Analysis meeting scheduled Friday, Jan. 30, 2015 to discuss gathered data
99

100