Embed Size (px)
Citation preview
121
10
Comparative a pplications in fl ow c ytometry
Alaa Saad
Flow cytometry is a technology for measuring optical and fl uorescence characteristics of cells in a suspen-sion of a heterogeneous mixture of cells. Today ’ s fl ow cytometer was originally developed as a microscopic based device in the middle of the last century. At the same time, Wallace Coulter introduced the use of elec-trodes to measure the electric conductance of cells in a suspension through a tiny orifi ce. This lead to the introduction of the fi rst commercial cell counters in 1960.
Commercial cytometers with increasing sensitivity, complexity, computerisation and practicality appeared during the late 1970s such as Cytofl uorograph (Ortho), FACS - III and FACStarPLUS (Becton - Dickinson), Spectrum III (Ortho), EPICS (Coulter) etc. The need for a fair degree of expertise combined with the instrumentation costs and complexity, limited the early use of fl ow cytometry to research laborato-ries and specialised clinical institutes. Flow cytometry rapidly gained a wide range of clinical applications including the integration of fl ow cytometry tech-niques into routine hematology analysers.
Commercial availability of monoclonal antibodies initially limited the use of fl ow cytometry in various animal species. However, the utilisation of fl ow cytom-etry in veterinary research and clinical studies has increased, including applications in hematology, immunology, sperm quality and sorting, chromosome karyotyping and dairy science.
Atlas of Comparative Diagnostic and Experimental Hematology, Second Edition. Clifford Smith, Alfred Jarecki.© 2011 Blackwell Publishing Ltd. Published 2011 by Blackwell Publishing Ltd.
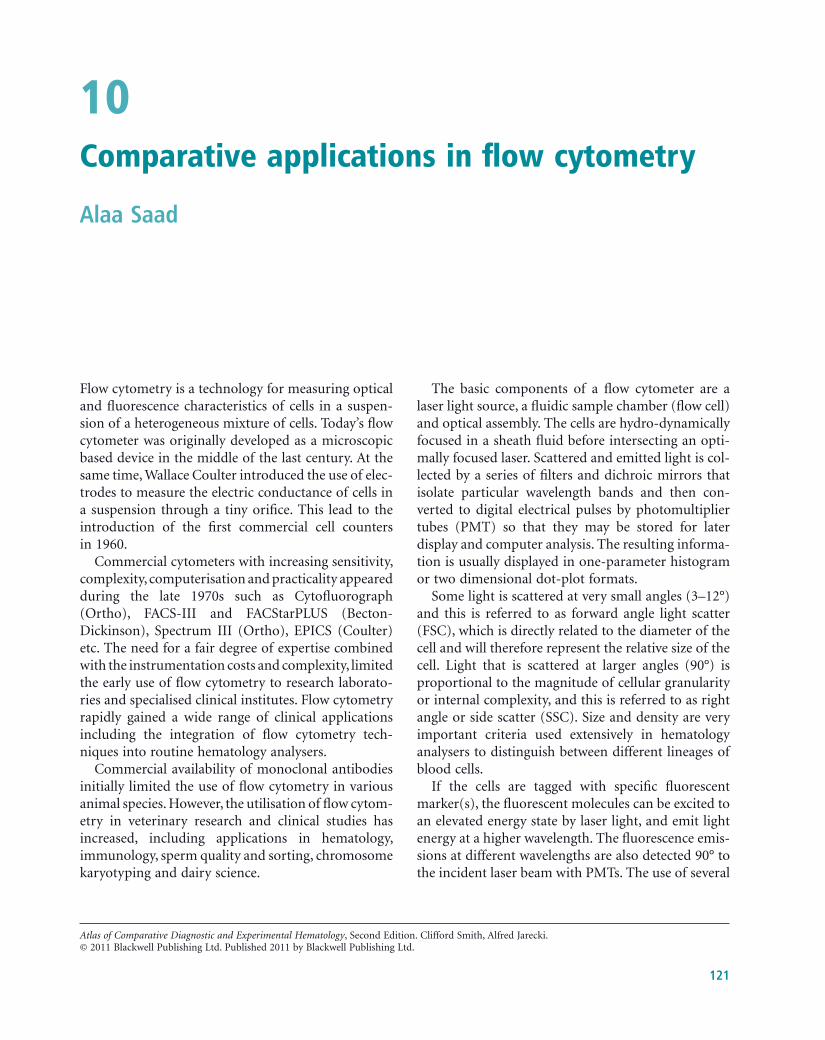
The basic components of a fl ow cytometer are a laser light source, a fl uidic sample chamber (fl ow cell) and optical assembly. The cells are hydro - dynamically focused in a sheath fl uid before intersecting an opti-mally focused laser. Scattered and emitted light is col-lected by a series of fi lters and dichroic mirrors that isolate particular wavelength bands and then con-verted to digital electrical pulses by photomultiplier tubes (PMT) so that they may be stored for later display and computer analysis. The resulting informa-tion is usually displayed in one - parameter histogram or two dimensional dot - plot formats.
Some light is scattered at very small angles (3 – 12 ° ) and this is referred to as forward angle light scatter (FSC), which is directly related to the diameter of the cell and will therefore represent the relative size of the cell. Light that is scattered at larger angles (90 ° ) is proportional to the magnitude of cellular granularity or internal complexity, and this is referred to as right angle or side scatter (SSC). Size and density are very important criteria used extensively in hematology analysers to distinguish between different lineages of blood cells.
If the cells are tagged with specifi c fl uorescent marker(s), the fl uorescent molecules can be excited to an elevated energy state by laser light, and emit light energy at a higher wavelength. The fl uorescence emis-sions at different wavelengths are also detected 90 ° to the incident laser beam with PMTs. The use of several
122 Atlas of Comparative Diagnostic and Experimental Hematology
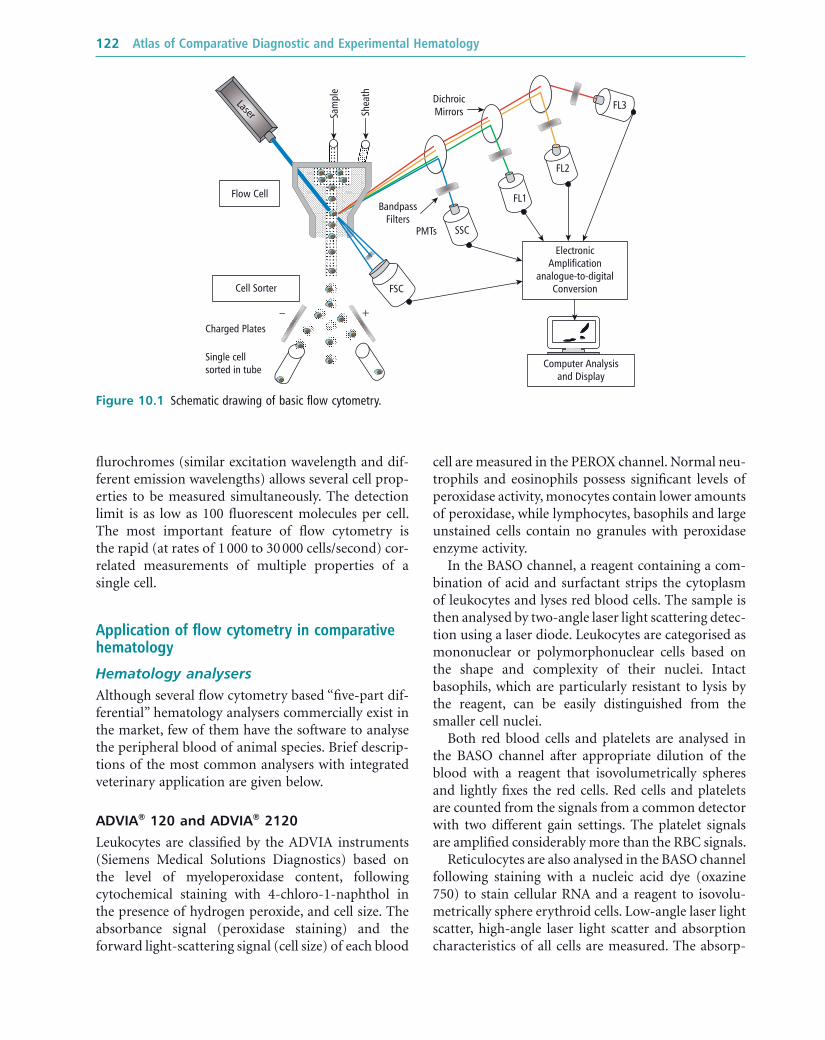
cell are measured in the PEROX channel. Normal neu-trophils and eosinophils possess signifi cant levels of peroxidase activity, monocytes contain lower amounts of peroxidase, while lymphocytes, basophils and large unstained cells contain no granules with peroxidase enzyme activity.
In the BASO channel, a reagent containing a com-bination of acid and surfactant strips the cytoplasm of leukocytes and lyses red blood cells. The sample is then analysed by two - angle laser light scattering detec-tion using a laser diode. Leukocytes are categorised as mononuclear or polymorphonuclear cells based on the shape and complexity of their nuclei. Intact basophils, which are particularly resistant to lysis by the reagent, can be easily distinguished from the smaller cell nuclei.
Both red blood cells and platelets are analysed in the BASO channel after appropriate dilution of the blood with a reagent that isovolumetrically spheres and lightly fi xes the red cells. Red cells and platelets are counted from the signals from a common detector with two different gain settings. The platelet signals are amplifi ed considerably more than the RBC signals.
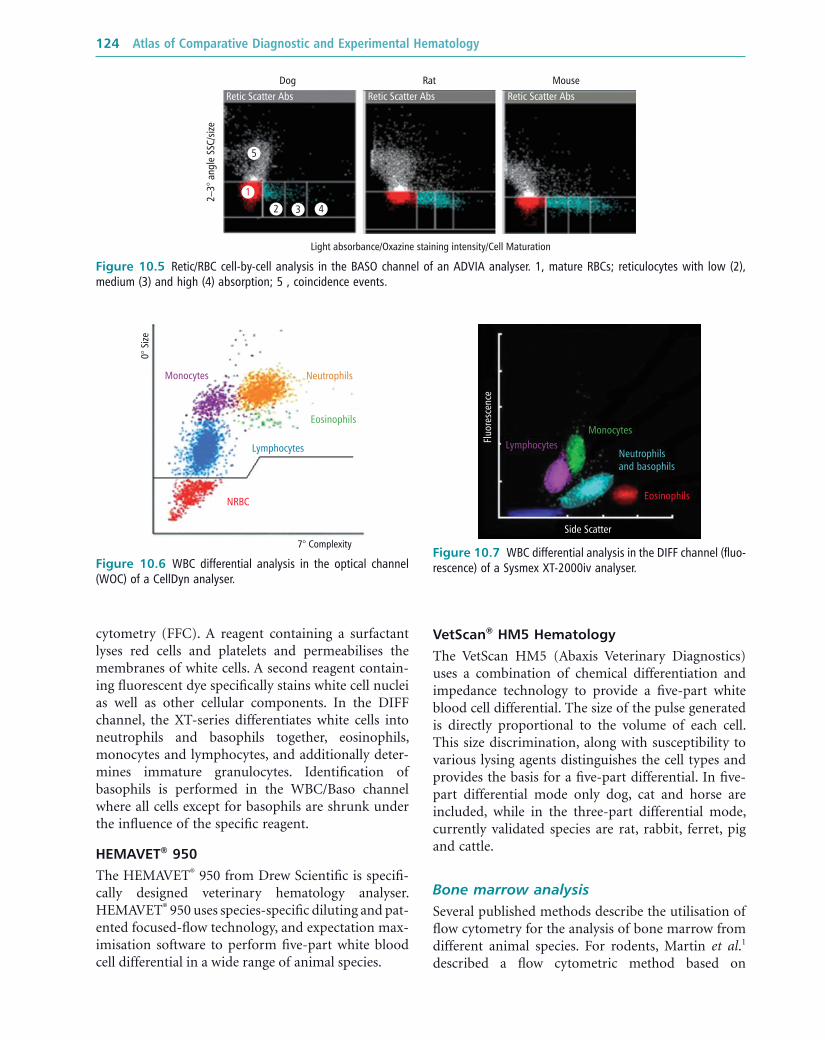
Reticulocytes are also analysed in the BASO channel following staining with a nucleic acid dye (oxazine 750) to stain cellular RNA and a reagent to isovolu-metrically sphere erythroid cells. Low - angle laser light scatter, high - angle laser light scatter and absorption characteristics of all cells are measured. The absorp-
fl urochromes (similar excitation wavelength and dif-ferent emission wavelengths) allows several cell prop-erties to be measured simultaneously. The detection limit is as low as 100 fl uorescent molecules per cell. The most important feature of fl ow cytometry is the rapid (at rates of 1 000 to 30 000 cells/second) cor-related measurements of multiple properties of a single cell.
Application of fl ow c ytometry in c omparative h ematology
Hematology a nalysers Although several fl ow cytometry based “ fi ve - part dif-ferential ” hematology analysers commercially exist in the market, few of them have the software to analyse the peripheral blood of animal species. Brief descrip-tions of the most common analysers with integrated veterinary application are given below.
ADVIA ® 120 and ADVIA ® 2120
Leukocytes are classifi ed by the ADVIA instruments (Siemens Medical Solutions Diagnostics) based on the level of myeloperoxidase content, following cytochemical staining with 4 - chloro - 1 - naphthol in the presence of hydrogen peroxide, and cell size. The absorbance signal (peroxidase staining) and the forward light - scattering signal (cell size) of each blood
Figure 10.1 Schematic drawing of basic fl ow cytometry.
Flow Cell
DichroicMirrors
BandpassFilters
PMTs SSC
FSC
ElectronicAmplification
analogue-to-digitalConversion
Computer Analysisand Display
FL1
FL2
FL3
Sam
ple
Shea
th
Laser
Cell Sorter
Charged Plates
– +
Single cellsorted in tube
Comparative Applications in Flow Cytometry 123
Figure 10.2 WBC differential analysis in the PEROX channel of an ADVIA analyser. 1, large unstained cells; 2, monocytes; 3, lym-phocytes; 4, noise; 5, neutrophils; 6, platelet clumps; 7, eosinophils.
Light absorbance/Peroxidase staining intensity
FCS/
size
1 1 155
52 2
2
Dog Rat Mouse
Perox Perox Perox
7 773 3 3
66
6
4 4 4
Figure 10.3 WBC differential analysis in the BASO channel of an ADVIA analyser. 1, mononuclear cells; 2, polymorphonuclear cells; 3, basophils.
2–3°
ang
le S
SC/s
ize
5–15° angle SSC/nuclear configuration
Dog Rat MouseBaso Baso Baso
1 2
3
Figure 10.4 RBC cell - by - cell analysis in the BASO channel of an ADVIA analyser. 1, normochromic normocytic; 2, hypochromic mac-rocytic; 3, hypochromic normocytic; 4, hypochromic microcytic; 5, normochromic microcytic; 6, normochromic macrocytic; 7, hyperchro-mic microcytic; 8, hyperchromic microcytic; 9, hyperchromic macrocytic.
RBC
volu
me
Hemoglobin concentration
Dog Rat Mouse
RBC V/HC RBC V/HC RBC V/HC
1
2
3
4 5
6 9
7
S
tion data are used to classify each cell as a reticulocyte or mature red blood cell based on its RNA content.
CellDyn 3500
The CellDyn 3500 hematology analyser (Abbott Diagnostics) employs dual technologies to provide the basis for a fi ve - part white blood cell differential. Multi - angle polarized scatter separation (MAPSS) provides
the primary white blood cell count and differential analysis, while the impedance channel provides addi-tional information on the presence of fragile lym-phocytes and hypotonically resistant red blood cells.
Sysmex XT - 2000iv
Leukocyte differential analysis is performed on the Sysmex XT instrument using fl uorescence fl ow
124 Atlas of Comparative Diagnostic and Experimental Hematology
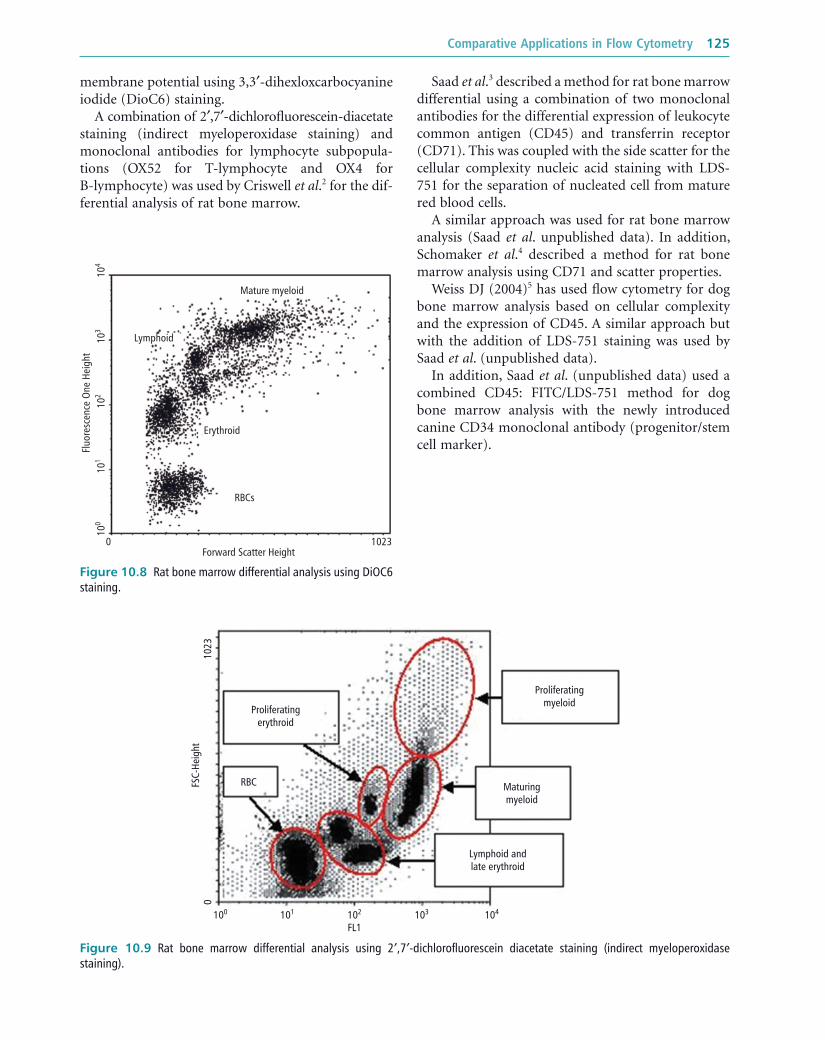
Figure 10.6 WBC differential analysis in the optical channel (WOC) of a CellDyn analyser.
7° Complexity
0° S
ize
Lymphocytes
NRBC
Eosinophils
Monocytes Neutrophils
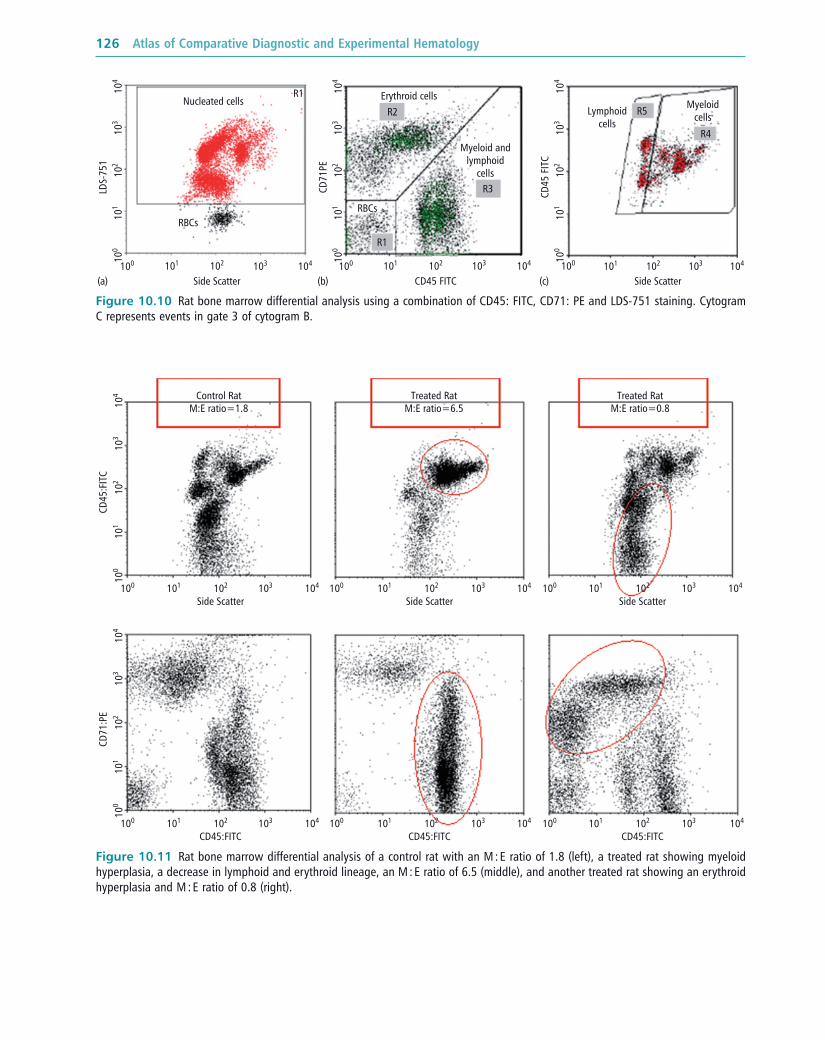
Figure 10.7 WBC differential analysis in the DIFF channel (fl uo-rescence) of a Sysmex XT - 2000iv analyser.
Side Scatter
Fluo
resc
ence
Lymphocytes
Eosinophils
Monocytes
Neutrophilsand basophils
Figure 10.5 Retic/RBC cell - by - cell analysis in the BASO channel of an ADVIA analyser. 1, mature RBCs; reticulocytes with low (2), medium (3) and high (4) absorption; 5 , coincidence events.
2–3°
ang
le S
SC/s
ize
Light absorbance/Oxazine staining intensity/Cell Maturation
Dog Rat MouseRetic Scatter Abs Retic Scatter Abs Retic Scatter Abs
1
2 3 4
5
cytometry (FFC). A reagent containing a surfactant lyses red cells and platelets and permeabilises the membranes of white cells. A second reagent contain-ing fl uorescent dye specifi cally stains white cell nuclei as well as other cellular components. In the DIFF channel, the XT - series differentiates white cells into neutrophils and basophils together, eosinophils, monocytes and lymphocytes, and additionally deter-mines immature granulocytes. Identifi cation of basophils is performed in the WBC/Baso channel where all cells except for basophils are shrunk under the infl uence of the specifi c reagent.
HEMAVET ® 950
The HEMAVET ® 950 from Drew Scientifi c is specifi -cally designed veterinary hematology analyser. HEMAVET ® 950 uses species - specifi c diluting and pat-ented focused - fl ow technology, and expectation max-imisation software to perform fi ve - part white blood cell differential in a wide range of animal species.
VetScan ® HM 5 Hematology
The VetScan HM5 (Abaxis Veterinary Diagnostics) uses a combination of chemical differentiation and impedance technology to provide a fi ve - part white blood cell differential. The size of the pulse generated is directly proportional to the volume of each cell. This size discrimination, along with susceptibility to various lysing agents distinguishes the cell types and provides the basis for a fi ve - part differential. In fi ve - part differential mode only dog, cat and horse are included, while in the three - part differential mode, currently validated species are rat, rabbit, ferret, pig and cattle.
Bone m arrow a nalysis Several published methods describe the utilisation of fl ow cytometry for the analysis of bone marrow from different animal species. For rodents, Martin et al . 1 described a fl ow cytometric method based on
Comparative Applications in Flow Cytometry 125
Figure 10.8 Rat bone marrow differential analysis using DiOC6 staining.
Forward Scatter Height
RBCs
Erythroid
Lymphoid
Mature myeloid
Fluo
resc
ence
One
Hei
ght
0
100
101
102
103
104
1023
Figure 10.9 Rat bone marrow differential analysis using 2 ′ ,7 ′ - dichlorofl uorescein diacetate staining (indirect myeloperoxidase staining).
RBC
Proliferatingerythroid
Lymphoid andlate erythroid
Maturingmyeloid
Proliferatingmyeloid
0
100 101 102
FL1
FSC-
Heig
ht
103 104
1023
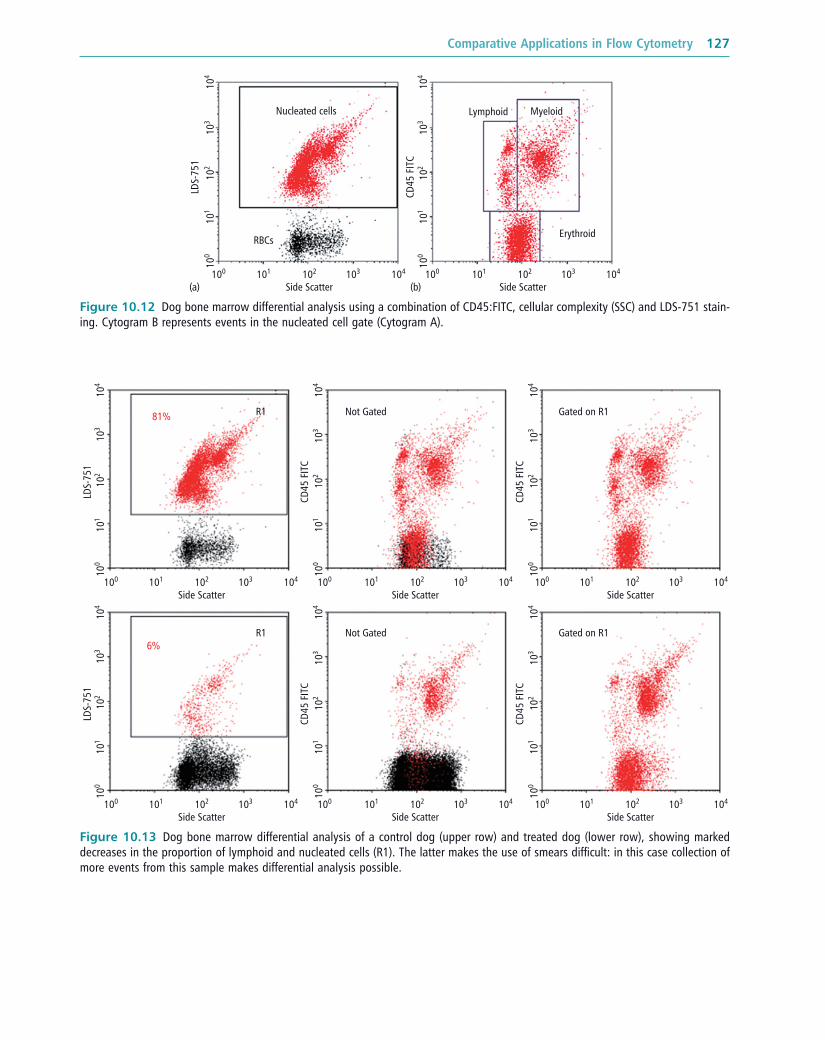
Saad et al . 3 described a method for rat bone marrow differential using a combination of two monoclonal antibodies for the differential expression of leukocyte common antigen (CD45) and transferrin receptor (CD71). This was coupled with the side scatter for the cellular complexity nucleic acid staining with LDS - 751 for the separation of nucleated cell from mature red blood cells.
A similar approach was used for rat bone marrow analysis (Saad et al . unpublished data). In addition, Schomaker et al . 4 described a method for rat bone marrow analysis using CD71 and scatter properties.
Weiss DJ (2004) 5 has used fl ow cytometry for dog bone marrow analysis based on cellular complexity and the expression of CD45. A similar approach but with the addition of LDS - 751 staining was used by Saad et al . (unpublished data).
In addition, Saad et al . (unpublished data) used a combined CD45: FITC/LDS - 751 method for dog bone marrow analysis with the newly introduced canine CD34 monoclonal antibody (progenitor/stem cell marker).
membrane potential using 3,3 ′ - dihexloxcarbocyanine iodide (DioC6) staining.
A combination of 2 ′ ,7 ′ - dichlorofl uorescein - diacetate staining (indirect myeloperoxidase staining) and monoclonal antibodies for lymphocyte subpopula-tions (OX52 for T - lymphocyte and OX4 for B - lymphocyte) was used by Criswell et al . 2 for the dif-ferential analysis of rat bone marrow.
126 Atlas of Comparative Diagnostic and Experimental Hematology
Figure 10.11 Rat bone marrow differential analysis of a control rat with an M : E ratio of 1.8 (left), a treated rat showing myeloid hyperplasia, a decrease in lymphoid and erythroid lineage, an M : E ratio of 6.5 (middle), and another treated rat showing an erythroid hyperplasia and M : E ratio of 0.8 (right).
Side Scatter
Control RatM:E ratio=1.8
Treated RatM:E ratio=6.5
Treated RatM:E ratio=0.8
100 101 102 103 104
Side Scatter100 101 102 103 104
Side Scatter100 101 102 103 104
CD45:FITC100 101 102 103 104
CD45:FITC100 101 102 103 104
CD45:FITC100 101 102 103 104
CD71
:PE
CD45
:FIT
C10
010
110
210
310
410
010
110
210
310
4
Figure 10.10 Rat bone marrow differential analysis using a combination of CD45: FITC, CD71: PE and LDS - 751 staining. Cytogram C represents events in gate 3 of cytogram B.
RBCsRBCs
Nucleated cells Erythroid cellsR1
R2
R3
R5
R4Myeloid and
lymphoidcells
MyeloidcellsLymphoid
cells
R1
Side Scatter100 101 102 103 104
CD45 FITC
CD45
FIT
C
100 101 102 103 104
Side Scatter(c)(b)(a)100 101 102 103 10410
010
110
210
310
4
CD71
PE10
010
110
210
310
4
LDS-
751
100
101
102
103
104
Comparative Applications in Flow Cytometry 127
Figure 10.12 Dog bone marrow differential analysis using a combination of CD45:FITC, cellular complexity (SSC) and LDS - 751 stain-ing. Cytogram B represents events in the nucleated cell gate (Cytogram A).
Side Scatter
RBCs
Nucleated cells Lymphoid Myeloid
Erythroid
100
(a) (b)101 102 103 104
Side Scatter100 101 102 103 104
CD45
FIT
C10
010
110
210
310
4
LDS-
751
100
101
102
103
104
Figure 10.13 Dog bone marrow differential analysis of a control dog (upper row) and treated dog (lower row), showing marked decreases in the proportion of lymphoid and nucleated cells (R1). The latter makes the use of smears diffi cult: in this case collection of more events from this sample makes differential analysis possible.
Side Scatter100 101 102 103
R1 Not Gated Gated on R1
R16%
81%
Not Gated Gated on R1
104
Side Scatter100 101 102 103 104
CD45
FIT
C10
010
110
210
310
4
Side Scatter100 101 102 103 104
CD45
FIT
C10
010
110
210
310
4
LDS-
751
100
101
102
103
104
Side Scatter100 101 102 103 104
Side Scatter100 101 102 103 104
CD45
FIT
C10
010
110
210
310
4
Side Scatter100 101 102 103 104
CD45
FIT
C10
010
110
210
310
4
LDS-
751
100
101
102
103
104

128 Atlas of Comparative Diagnostic and Experimental Hematology
Figure 10.14 Dog bone marrow differential analysis using a combination of CD45:FITC, cellular complexity (SSC), and LDS - 751 stain-ing and CD34:PE.
SSC-Height
R4
100 101 102 103 104
SSC-Height100 101 102 103 104
LDS
CD34
PE
100
101
102
103
104
100
101
102
103
104
Reticulocyte a nalysis Reticulocyte count in peripheral blood is a sensitive indirect indicator of bone marrow erythropoietic activity. Manual counting of reticulocytes by micro-scope is time consuming and associated with high degree of variation. Reticulocyte count analysis is inte-grated into the majority of hematology analysers. Fully automated reticulocyte analysis offers advantages rela-tive to microscope - based scoring, including a greater number of cells analysed, much faster analysis times, less variation and a greater degree of objectivity. Reticulocytes are identifi ed by hematology analysers using staining with methylene blue (part of Abbott and Beckman Coulter instruments), oxazine (Siemens ADVIA 120 and 2120), or fl uorescent dyes such as thia-zole orange (ABX), auramine O (Sysmex), CD4K530 (Abbott) or coriphosphine O (Beckman Coulter).
Figure 10.15 Reticulocyte analysis using thiazole orange staining and fl ow cytometry. FSC-H
RBCs
Platelets
100 101 102 103 104 FL1-H
Reticulocytes
Gm: 37.28CV: 21.04Md: 40.68[61–255] 1026 (3.8%)
...1
100 101 102 103 104
SSC-
H
Even
ts0
1024
100
101
102
103
104
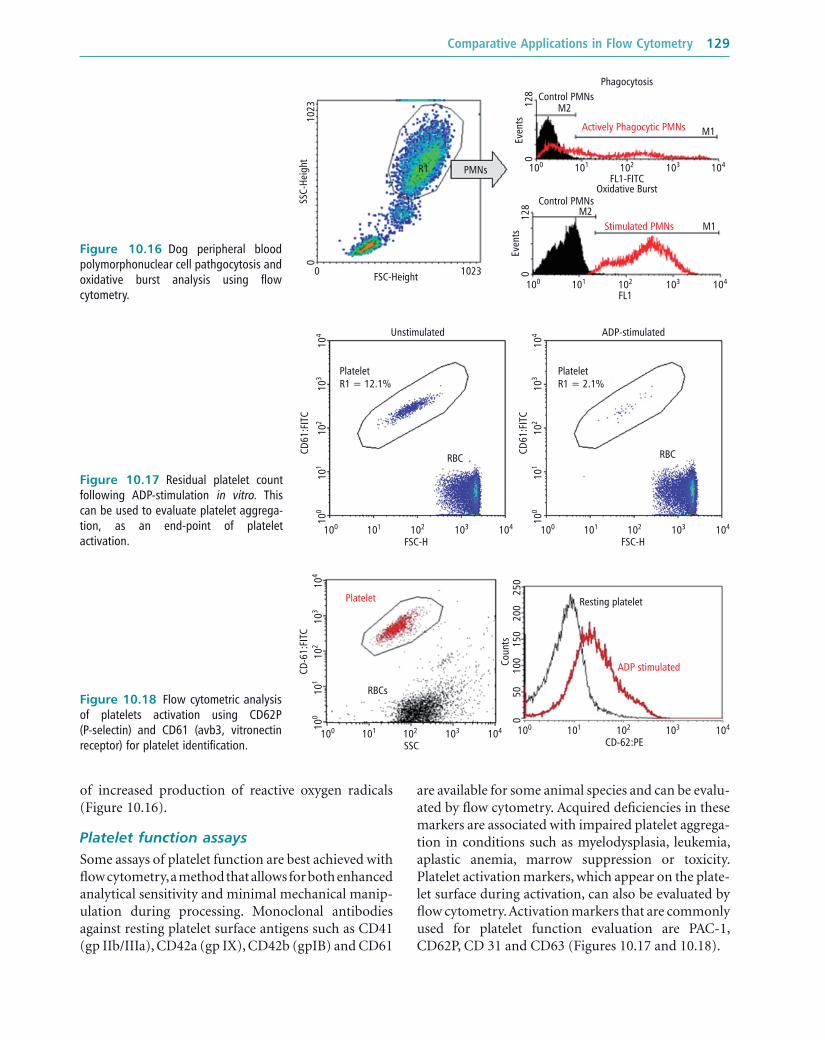
Assessment of neutrophil function Flow cytometry has been employed for the assess-ment of various functional assays of neutrophils including oxidative burst, phagocytosis, degranula-tion and activation markers. Flow cytometric methods for the analysis of neutrophils and monocytes/mac-rophage phagocytosis and oxidative burst in different animal species have been described in several publica-tions 6, 7, 8 .
The amount of fl uorescence of phagocytic cell pop-ulations was measured by fl ow cytometry following incubation of PMNs with fl uorescent conjugated bac-teria (Figure 10.16 ), yeasts, zymosan particles or latex beads. Assessment of oxidative burst can indirectly be evaluated by the measurement of the transformation of non - fl uorescent probes (dihydrorhodamine 123) into fl uorescent ones (Rhodamine 123) as a function
Comparative Applications in Flow Cytometry 129
Figure 10.16 Dog peripheral blood polymorphonuclear cell pathgocytosis and oxidative burst analysis using fl ow cytometry.
FSC-Height
100 101 102
FL1-FITC
Stimulated PMNs
Actively Phagocytic PMNs
Oxidative Burst
PhagocytosisControl PMNs
Control PMNsM2
M2
M1
M1
103 104
100 101 102
FL1103 104
SSC-
Heig
ht
Even
ts0
128
Even
ts0
128
010
23
0 1023
R1 PMNs
Figure 10.17 Residual platelet count following ADP - stimulation in vitro . This can be used to evaluate platelet aggrega-tion, as an end - point of platelet activation. FSC-H
RBC RBC
ADP-stimulatedUnstimulated
PlateletR1 = 12.1%
PlateletR1 = 2.1%
100 101 102 103 104
FSC-H100 101 102 103 104
CD61
:FIT
C
100
101
102
103
104
CD61
:FIT
C10
010
110
210
310
4
of increased production of reactive oxygen radicals (Figure 10.16 ).
Platelet function assays Some assays of platelet function are best achieved with fl ow cytometry, a method that allows for both enhanced analytical sensitivity and minimal mechanical manip-ulation during processing. Monoclonal antibodies against resting platelet surface antigens such as CD41 (gp IIb/IIIa), CD42a (gp IX), CD42b (gpIB) and CD61
are available for some animal species and can be evalu-ated by fl ow cytometry. Acquired defi ciencies in these markers are associated with impaired platelet aggrega-tion in conditions such as myelodysplasia, leukemia, aplastic anemia, marrow suppression or toxicity. Platelet activation markers, which appear on the plate-let surface during activation, can also be evaluated by fl ow cytometry. Activation markers that are commonly used for platelet function evaluation are PAC - 1, CD62P, CD 31 and CD63 (Figures 10.17 and 10.18 ).
Figure 10.18 Flow cytometric analysis of platelets activation using CD62P (P - selectin) and CD61 (avb3, vitronectin receptor) for platelet identifi cation. SSC
RBCs
Resting platelet
ADP stimulated
Platelet
100 101 102 103 104
CD-62:PE100 101 102 103 104
CD-6
1:FI
TC
Coun
ts
100 0
5010
015
020
025
0
101
102
103
104
130 Atlas of Comparative Diagnostic and Experimental Hematology
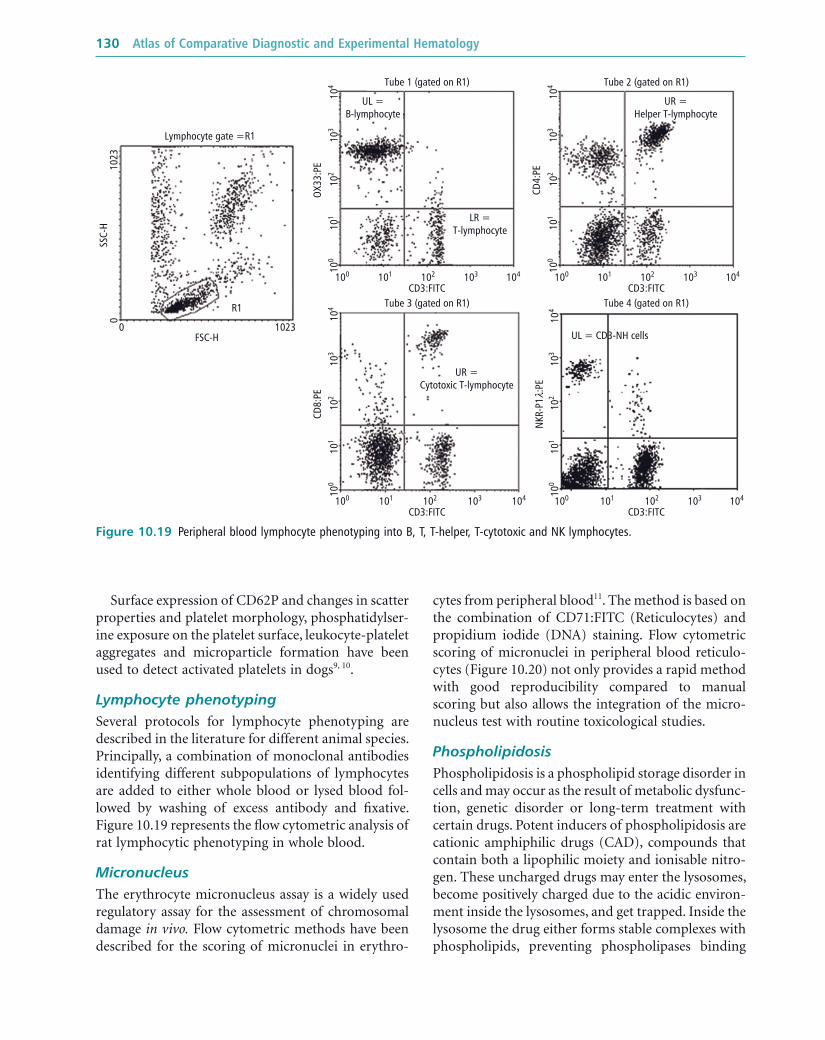
Figure 10.19 Peripheral blood lymphocyte phenotyping into B, T, T - helper, T - cytotoxic and NK lymphocytes.
CD3:FITC
Tube 1 (gated on R1) Tube 2 (gated on R1)
Tube 3 (gated on R1) Tube 4 (gated on R1)
UL =B-lymphocyte
UL = CD3-NH cells
UR =Helper T-lymphocyte
Lymphocyte gate =R1
R1
FSC-H10230
1023
0SS
C-H
UR =Cytotoxic T-lymphocyte
LR =T-lymphocyte
100 101 102 103 104
OX33
:PE
100
101
102
103
104
CD3:FITC100 101 102 103 104
CD4:
PE
100
101
102
103
104
CD3:FITC100 101 102 103 104
CD8:
PE
100
101
102
103
104
CD3:FITC100 101 102 103 104
NKR
-P1l
:PE
100
101
102
103
104
Surface expression of CD62P and changes in scatter properties and platelet morphology, phosphatidylser-ine exposure on the platelet surface, leukocyte - platelet aggregates and microparticle formation have been used to detect activated platelets in dogs 9, 10 .
Lymphocyte phenotyping Several protocols for lymphocyte phenotyping are described in the literature for different animal species. Principally, a combination of monoclonal antibodies identifying different subpopulations of lymphocytes are added to either whole blood or lysed blood fol-lowed by washing of excess antibody and fi xative. Figure 10.19 represents the fl ow cytometric analysis of rat lymphocytic phenotyping in whole blood.
Micronucleus The erythrocyte micronucleus assay is a widely used regulatory assay for the assessment of chromosomal damage in vivo. Flow cytometric methods have been described for the scoring of micronuclei in erythro-
cytes from peripheral blood 11 . The method is based on the combination of CD71:FITC (Reticulocytes) and propidium iodide (DNA) staining. Flow cytometric scoring of micronuclei in peripheral blood reticulo-cytes (Figure 10.20 ) not only provides a rapid method with good reproducibility compared to manual scoring but also allows the integration of the micro-nucleus test with routine toxicological studies.
Phospholipidosis Phospholipidosis is a phospholipid storage disorder in cells and may occur as the result of metabolic dysfunc-tion, genetic disorder or long - term treatment with certain drugs. Potent inducers of phospholipidosis are cationic amphiphilic drugs (CAD), compounds that contain both a lipophilic moiety and ionisable nitro-gen. These uncharged drugs may enter the lysosomes, become positively charged due to the acidic environ-ment inside the lysosomes, and get trapped. Inside the lysosome the drug either forms stable complexes with phospholipids, preventing phospholipases binding
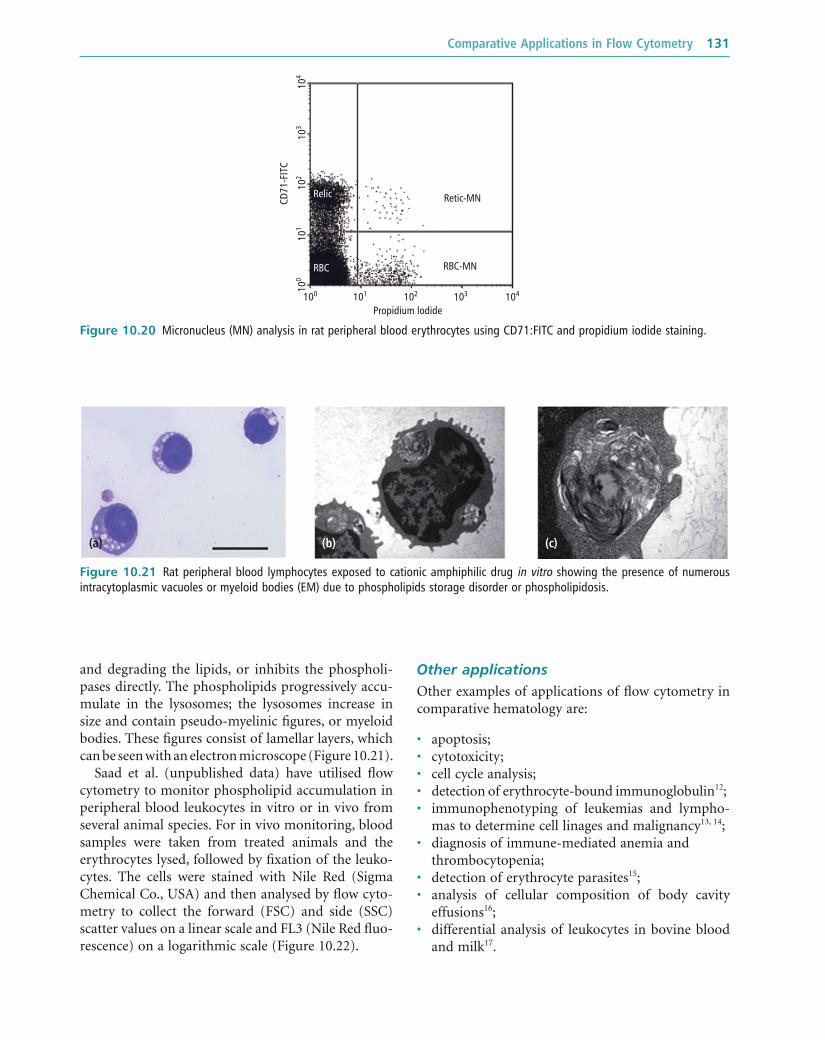
Comparative Applications in Flow Cytometry 131
Figure 10.21 Rat peripheral blood lymphocytes exposed to cationic amphiphilic drug in vitro showing the presence of numerous intracytoplasmic vacuoles or myeloid bodies (EM) due to phospholipids storage disorder or phospholipidosis.
(a) (b) (c)
Figure 10.20 Micronucleus (MN) analysis in rat peripheral blood erythrocytes using CD71:FITC and propidium iodide staining.
Propidium lodide
Retic-MN
RBC-MNRBC
Relic
100 101 102 103 104CD
71-F
ITC
100
101
102
103
104
and degrading the lipids, or inhibits the phospholi-pases directly. The phospholipids progressively accu-mulate in the lysosomes; the lysosomes increase in size and contain pseudo - myelinic fi gures, or myeloid bodies. These fi gures consist of lamellar layers, which can be seen with an electron microscope (Figure 10.21 ).
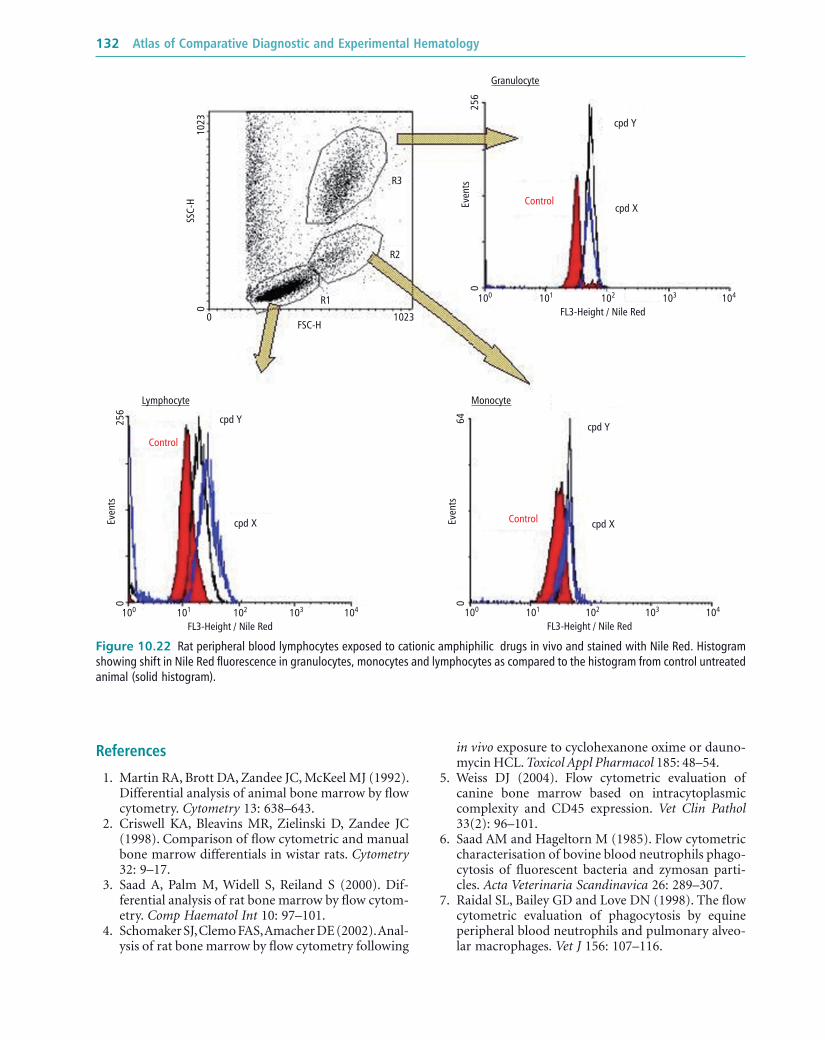
Saad et al. (unpublished data) have utilised fl ow cytometry to monitor phospholipid accumulation in peripheral blood leukocytes in vitro or in vivo from several animal species. For in vivo monitoring, blood samples were taken from treated animals and the erythrocytes lysed, followed by fi xation of the leuko-cytes. The cells were stained with Nile Red (Sigma Chemical Co., USA) and then analysed by fl ow cyto-metry to collect the forward (FSC) and side (SSC) scatter values on a linear scale and FL3 (Nile Red fl uo-rescence) on a logarithmic scale (Figure 10.22 ).
Other a pplications Other examples of applications of fl ow cytometry in comparative hematology are:
• apoptosis; • cytotoxicity; • cell cycle analysis; • detection of erythrocyte - bound immunoglobulin 12 ; • immunophenotyping of leukemias and lympho-
mas to determine cell linages and malignancy 13, 14 ; • diagnosis of immune - mediated anemia and
thrombocytopenia; • detection of erythrocyte parasites 15 ; • analysis of cellular composition of body cavity
effusions 16 ; • differential analysis of leukocytes in bovine blood
and milk 17 .
132 Atlas of Comparative Diagnostic and Experimental Hematology
Figure 10.22 Rat peripheral blood lymphocytes exposed to cationic amphiphilic drugs in vivo and stained with Nile Red. Histogram showing shift in Nile Red fl uorescence in granulocytes, monocytes and lymphocytes as compared to the histogram from control untreated animal (solid histogram).
R3
R2
R1
1023
100 101 102
FL3-Height / Nile Red
cpd X
cpd X
Control
Control
Control
cpd Y
cpd Y
cpd X
cpd Y
Granulocyte
MonocyteLymphocyte
103 104
100 101 102
FL3-Height / Nile Red103 104100 101 102
FL3-Height / Nile Red103 104
0FSC-H
1023
256
0
256
0 064
0SS
C-H Ev
ents
Even
ts
Even
ts
References
1. Martin RA , Brott DA , Zandee JC , McKeel MJ ( 1992 ). Differential analysis of animal bone marrow by fl ow cytometry . Cytometry 13 : 638 – 643 .
2. Criswell KA , Bleavins MR , Zielinski D , Zandee JC ( 1998 ). Comparison of fl ow cytometric and manual bone marrow differentials in wistar rats . Cytometry 32 : 9 – 17 .
3. Saad A , Palm M , Widell S , Reiland S ( 2000 ). Dif-ferential analysis of rat bone marrow by fl ow cytom-etry . Comp Haematol Int 10 : 97 – 101 .
4. Schomaker SJ , Clemo FAS , Amacher DE ( 2002 ). Anal-ysis of rat bone marrow by fl ow cytometry following
in vivo exposure to cyclohexanone oxime or dauno-mycin HCL . Toxicol Appl Pharmacol 185 : 48 – 54 .
5. Weiss DJ ( 2004 ). Flow cytometric evaluation of canine bone marrow based on intracytoplasmic complexity and CD45 expression . Vet Clin Pathol 33 ( 2 ): 96 – 101 .
6. Saad AM and Hageltorn M ( 1985 ). Flow cytometric characterisation of bovine blood neutrophils phago-cytosis of fl uorescent bacteria and zymosan parti-cles . Acta Veterinaria Scandinavica 26 : 289 – 307 .
7. Raidal SL , Bailey GD and Love DN ( 1998 ). The fl ow cytometric evaluation of phagocytosis by equine peripheral blood neutrophils and pulmonary alveo-lar macrophages . Vet J 156 : 107 – 116 .
Comparative Applications in Flow Cytometry 133
8. Eickhoff S , Mironowa L , Carlson R , Liebold W , Tipold A ( 2004 ). Measurement of phagocytosis and oxidative burst of canine neutrophils: high variation in healthy dogs . Veterinary Immunology and Immu-nopathology 101 : 109 – 121 .
9. Wills Tb , Wardrop KJ , Meyers KM ( 2006 ). Detection of activated platelets in canine blood by use of fl ow cytometry . Am J Vet Res 67 ( 1 ): 56 – 63 .
10. Moritz A , Walcheck BK , Wiess DJ ( 2003 ). Flow cyto-metric detection of activated platelets in the dog . Vet Clin Pathol 32 ( 1 ): 6 – 12 .
11. Dertinger SD , Bishop ME , McNamee JP , Hajashi M , Suzuki T , Asano N , Nakajima M , Saito J , Moore M , Torous D , MacGregor JT ( 2006 ). Flow cytometric analysis of micronuclei in peripheral blood reti-culocytes: Intra - and interlaboratory comparison with microscopic scoring . Toxicological Sciences 1 : 83 – 91 .
12. Kucinskiene G , Schuberth HJ , Leibold W , Pieskus J ( 2005 ). Flow cytometric evaluation of bound IgG on erythrocytes of anaemic dogs . Vet J 169 : 303 – 307 .
13. Weiss DJ ( 2001 ). Flow cytometric and immuno-phenotypic evaluation of acute lymphocytic leuke-mia in dog bone marrow . J Vet Int Med 15 : 589 – 594 .
14. Tarrant JM , Stokol T , Blue JT , McDonough SP , Farrell P ( 2001 ). Diagnosis of chronic myelogenous leukae-mia in a dog using morphologic, cytochemical, and fl ow cytometric techniques . Vet Clin Pathol 30 : 19 – 24 .
15. Wyatt CR , Goff W , Davis WC ( 1991 ). A fl ow cyto-metric method for assessing viability of intraeryth-rocytic haemoparasites . J Immunol Methods 140 : 23 – 30 .
16. Moritz A , Bauer N ( 2005 ). Flow cytometric analysis of effusions in dogs and cats with the automated haematology analyser ADVIA 120 . Vet Rec 156 ( 21 ): 674 – 678 .
17. Saad AM , Ö stensson K ( 1990 ). Flow cytofl uoromet-ric studies on the alteration of leukocyte populations in blood and milk during endotoxin - induced mas-titis in cows . Am J Vet Res 51 : 1603 – 1607 .