Embed Size (px)
Citation preview
www.pwc.com/ca DRAFT
Atlantic Industrial Minerals Inc. Market Assessment for Glencoe Limestone Project
Prepared for Atlantic Industrial Minerals Inc. as at: February _, 2014

Contents
1. Executive Summary 1
1.1 Introduction 1
1.2 Market Assessment 2
1.3 Findings 3
2. Introduction 6
2.1 Introduction 6
2.2 Scope of work 6
2.3 Report Limitations 6
3. Review of the site 7
3.1 Introduction 7
3.2 Operations 7
4. Cement Demand in the U.S. 8
4.1 Introduction 8
4.2 Cement Demand 8
5. Cement Supply in the U.S. 10
5.1 Introduction 10
5.2 John Kline Database 10
5.3 Existing Domestic Cement Supply 10
5.4 Forecast Domestic Cement Supply 11
5.5 Forecast Domestic Cement Supply for Eastern U.S. 12
6. Imported Cement Supply 15
6.1 Historic Data 15
6.2 Forecast Data 16
7. New Cement Projects and Closures 17
7.1 New Projects 17
7.2 Plant Closures 18
8. Pricing 19
8.1 Current and Historic Pricing 19
8.2 Forecast Pricing 20

© 2014 PricewaterhouseCoopers LLP, an Ontario limited liability partnership. All rights reserved.
PwC refers to the Canadian member firm, and may sometimes refer to the PwC network. Each member firm is a separate legal entity. Please see www.pwc.com/structure for further details.
9. Transportation 21
10. Cement Regulations 22
10.1Introduction 22
10.2Environmental Protection Agency 22
11. Capital Cost and Cost per Ton 23
11.1Capital 23
11.2Cost per Ton 23
Appendices
Appendix A Glencoe Property Appendix B Western Cape Breton, NS Appendix C U.S. Demographic Trends Appendix D U.S. Economic Trends Appendix E U.S. Infrastructure Trends Appendix F Eastern U.S. Cement Demand Appendix G Top 5 Cement Companies in U.S. Appendix H Cement Plant Locations in Canada and U.S. Appendix I Eastern U.S. Cement Plant Locations Appendix J Eastern U.S. Supply and Demand by State Appendix K Eastern U.S. Terminals

1 PwC
1. Executive Summary
1.1 Introduction Atlantic Industrial Minerals Inc. (“AIM”) wholly owned subsidiary, Glencoe Resources Inc., owns a limestone property in Cape Breton, Nova Scotia (“NS”). The estimated limestone reserves at the property are reported at 500 million metric tons with a 43-101 resource estimate currently underway and targeted to be completed by the end of 2013. The property is commonly referred to as the Glencoe Limestone Property (“Glencoe”). AIM is considering the development of the Glencoe property into a full scale cement production facility which is intended to produce approximately 2 million metrics tons of cement annually. It is anticipated all of the cement products would be moved through a terminal in the Strait of Canso to strategic locations through the eastern seaboard of the United States. In this regard, AIM has engaged PricewaterhouseCoopers LLP (“we”, “us” or “PwC”) to complete a limited scope market assessment (“the Assessment”) of both the demand and supply of cement in North America, and more specifically along the Eastern Seaboard of the United States (“U.S.”). AIM has also requested that we review transportation options for the project with potential delivery points in the U.S. This assessment is to assist management in determining if the current and future demand for cement will outstrip the current and forecasted supply of cement being or projected to be produced in Eastern United States. PwC is also assisting AIM in the preparation of materials such that they may contact investors to source financing for the Glencoe project. To date, AIM has had contact with FC Stone of New York and other confidential investors. We understand that the Assessment may be used in discussions with potential investors to provide them with an overview of the current market conditions.
The Glencoe site is located on the island of Cape Breton, NS and comprises approximately 1,296 hectares of property in the southwest portion of the island, as can be seen below with the location of Point A from a Google Map search.

2 PwC
Based on discussions with various stakeholders associated with the Glencoe project, we understand the property has a limestone resource estimated at 500 million metric tons, as well as argillaceous materials, an abundance of other required material such as slate deposits and gypsum that can be sourced locally to allow full-scale production of cement. The annual volume of cement to be produced and shipped could be 2 million metric tons (“MMT”) of cement related products annually. This number may change and will ultimately be determined by end customer requirements.
Our limited scope market assessment included the following:
Discussion and use of reports and a cement supplier database as prepared by John Kline of John Kline Consulting, a subcontractor of AIM “John Kline”);
Review of current and forecasted cement industry in the United States (“U.S.”) as prepared by the Portland Cement Association indicating cement supply;
Discussions with groups that may be involved in the transportation of cement and/or clinker from Glencoe to a marine terminal situated in the Strait of Canso and to specific ports along the Eastern US;
Review of publically available information pertaining to the cement industry;
Review of current and forecasted cement industry in the United States as prepared by IBISWorld Inc.; and
Review of general economic forecasts pertaining to population growth and construction in the Eastern U.S.
When considering the Eastern Seaboard of the U.S. (“Eastern U.S.”), we included the following states for consideration:
Connecticut Delaware District of Columbia Florida Georgia Maine Maryland Massachusetts New Hampshire New Jersey New York North Carolina Pennsylvania Rhode Island South Carolina Vermont Virginia
1.2 Market Assessment The Assessment we have completed contains commentary and support related to the following areas:
List of all existing cement manufacturing facilities in North America including: location, approximate age, ownership, estimate of remaining reserves (where the information is available), annual capacity versus production of cement, type of cement produced and other pertinent details (the initial database was provided to PwC by John Kline);
List of “known” (as in existing permit to construct or has been announced) new cement manufacturing facilities slated to commence operations and close in 2013, and in the near future with the same relevant details as noted above for existing facilities;
Estimate of the total capacity versus actual production of the existing cement manufacturers for North America and Eastern U.S. for cement;
Summary of demand for cement in North America and the Eastern U.S.;
Summary of the price per ton for cement sold into various cities along the Eastern U.S., including stability of prices and historical trends;
Summary of the current North American cement industry providing historical information on demand and supply, estimate of future growth, projections (where information is available) for the next 10 years of the

3 PwC
supply, demand and prices, including major items related to the industry, outlining any new regulations or proposed government regulations that may impact the industry; and
Work with management, stakeholders and potential partners, such as Mr. Gregory Isenor and representatives for B.I.D. Bulk Material Handling Systems, Canada Steamship Lines and Cape Breton and Central Nova Scotia Railway Genesee and Wyoming Canada Inc. to determine the estimated cost of transportation, on a per ton basis, from Glencoe to the marine terminal in Point Tupper, NS, and from the marine terminal to various cities (as agreed to) along the Eastern U.S.
In determining the forecast for cement consumption in the U.S., we reviewed materials as prepared by PCA and IBISWorld. Both of these organizations focused on key drivers for the industry, which include:
Population growth;
Infrastructure;
Economic growth; and
Environmental considerations.
1.3 Findings We have organized our Findings in accordance with the focal points of the Assessment. The summary information can be seen as follows.
Supply and Demand
Our Assessment identifies that based on the Information there will be an increase in the demand for cement within the Eastern U.S. starting around the 2015 timeframe and significantly increasing through to 2035. Based on the Information it would also appear as though the domestic supply of cement within the Eastern U.S. will not be sufficient to meet the increased demand.
Demand will continue to grow based primarily on population increase and a corresponding increase in housing construction and supporting infrastructure. The PCA, projects a large and growing amount of pent up demand in these sectors. The PCA is forecasting that in 2020 there will be a gap in the supply and demand for cement in the U.S. of 27.8MMT. This gap is expected to grow to 77.6MMT in 2035. When considering the Eastern U.S., demand is expected to increase to 26.4MMT in 2015 and reach 48.1MMT in 2035.

4 PwC
The historic supply and demand for cement in the U.S. and specific to the Eastern US can be seen in the following charts:
Source: Portland Cement Association Market Intelligence Long-Term Cement Outlook, July 10, 2012
Source: Portland Cement Association Market Intelligence Long-Term Cement Outlook, July 10, 2012
Several cement plant projects have been announced along the Eastern U.S. Lafarge, Ravena, NY plant will modernize but will only replace its existing capacity. Titan Cement has a permit to build a new cement plant in North Carolina. Holcim has announced an upgrade of their Hagerstown, MD facility. Argos ha a permit for a new kiln line at their Harleyville, SC plant. None of these projects are in a construction phase.
(50,000)
-
50,000
100,000
150,000
200,000
2010 2015 2020 2025 2030 2035
US Cement Supply and Demand (000's of Metric Tons)
Total Cement Consumption
Domestic Cement Supply
Gap / (Oversupply)
(20,000)
(10,000)
-
10,000
20,000
30,000
40,000
50,000
60,000
2010 2015 2020 2025 2030 2035
Eastern US Cement Demand and Domestic Supply
(000's Metric Tons)
Eastern US Demand
Eastern US Supply
Supply Gap

5 PwC
Imports
With no readily identifiable cement or limestone quarry operations planned along the Eastern U.S., the supply gap forecasted will have to be filled by imports. We are aware of a project in Quebec that is currently under development that has the potential to ship 2MMT per year of cement into Eastern U.S. This project is further discussed later in the Assessment report. Based on the information found, imports into the U.S. may come from Caribbean countries, Columbia, European countries and Asia.
The cement industry in the U.S. peaked during the mid-2000’s, during this time there was a gap in the U.S. cement market between domestic supply and demand of approximately 33.4MMT in 2006. This supply gap was filled by imports from various countries in Europe, Asia, North America and South America, essentially globally.
This supply gap was filled by imports from various countries, including Canada. With only a few identifiable projects along the Eastern U.S. it is clear that a future supply gap will exists.
Pricing
There are several possible means to market cement. The majority of cement sales are to ready mix concrete companies, some of which are vertically integrated with cement companies. One marketing strategy would be to align with a vertically integrated cement company that does not have cement production in the area. Another strategy could be to seek out independent suppliers who do not wish to purchase cement from their competitors.
In determining the potential price for the sale of cement there would be one of two scenarios for AIM, the first would be selling on an open market and the second would be selling directly to an existing cement company. The purchasing of cement tends to be built on long-term relationships that buyers and suppliers have built within the industry. In general supply agreements tend to be one year in length and the larger industry participants will use multiple suppliers to ensure competitive prices are attained.
Currently cement is being sold to end users at a price of $110.88 per ton. Since January 2008 the selling price for cement has increased by 9.5%.
Transportation
When considering the Glencoe project, the cost of transporting cement products from the site to a marine terminal located in Point Tupper, NS and then in turned shipped into the U.S. will be a key factor in the project’s success. Transportation costs can be as much as a third of the overall cost and therefor the logistics of moving the cement products to market must be done extremely efficiently. To date we have had discussions with industry participants that could be partners from a railway, road and conveyor system perspective. None of these discussions have resulted in potential problems in getting the product to market. When considering road versus rail options from Glencoe to Point Tupper further analysis would have to be done in relation to the transportation rates and the potential capital costs for AIM on a railway operation.
There is existing infrastructure in place within close proximity to Glencoe that could be utilize, specifically, there is a marine terminal located in Point Tupper, NS which is owned by Georgia Pacific. The terminal is currently inactive but has the capacity to move in excess of 2 MMTS of product annually. Further discussions and negotiations will be required to determine if the terminal is suitable to move cement, what modifications may be required to the facilities and the annual lease cost.
The bulk of all product shipment is in the form of cement; very little clinker is shipped into the U.S. and in the small cases where it does happen there is a clinker grinder on site when product is unloaded. The market is such that purchasers of cement product want it to be bought in a cement powder such that it can be used immediately.
6 PwC
2. Introduction
2.1 Introduction AIM has identified the Glencoe site as one with potential to ship limestone, lime, cement and/or cement related products to customers along the Eastern U.S. The production plan currently considers that the Glencoe site can produce 2MMT of cement annually or 3MMT of limestone. Final volumes for production will be determined by customer requirements. The product would be shipped from the mine site to a marine terminal in Point Tupper, NS for transportation to various ports along the Eastern U.S. The product could be shipped as limestone, or if produced further, as cement or clinker. Clinker is an intermediate product that can be ground close to the customer, thus reducing transportation costs.
The purpose of the Assessment is to determine whether there is a market demand for imported cement into the Eastern U.S., what the current supply is for cement for the region and the potential methods of shipping. We have also included an analysis on U.S. Government regulations that could have an impact on this market.
We understand that AIM may use the Assessment to help in the evaluation of Glencoe and the construction and operation of a cement/clinker manufacturing plant on site. We also understand that AIM may use this report in discussions on-going with various potential stakeholders and investors for the Glencoe project.
2.2 Scope of work Our approach to this assignment was to conduct a limited scope market assessment for both the supply and demand of cement in the U.S., and more specifically, the Eastern U.S. and a review of transportation options for the movement of product. We were also asked to explore historical and forecasted pricing for cement, logistics and regulations for the industry.
2.3 Report Limitations PwC has relied upon the completeness, accuracy and fair presentation of all of the information, data, advice, opinions or representations obtained from public sources, AIM and other stakeholders associated with the Glencoe project, collectively, the “Information”. The findings in the Assessment are conditional upon such completeness, accuracy and fair presentation of the Information. PwC has not verified independently the completeness, accuracy and fair presentation of the Information. We are providing no opinion, attestation or other form of assurance with respect to our work and we did not verify or audit the information provide to us, unless specifically identified in the Assessment.
PwC reserves the right at its discretion to withdraw or make revisions to the Assessment should PwC be made aware of facts existing at the date of the report that were not known to PwC when it prepared the Assessment. The conclusions and recommendations are given as of the date hereof and PwC is under no obligation to advise any person of any change or matter brought to its attention after such date, which would affect the findings and conclusions, and PwC reserves the right to change or withdraw the Assessment.

7 PwC
3. Review of the site
3.1 Introduction
The Glencoe property contains a large limestone deposit in Cape Breton, NS. The property and adjacent lands can
be seen in Appendix A. The adjacent Georgia Pacific Gypsum facility (“GP”) may factor into future operations for
AIM and discussions with GP are pending. The GP site may contain infrastructure that is operational and could be
utilized by AIM.
3.2 Operations There are numerous factors to consider when exploring what the operations at Glencoe could look like. In general, there will be a mining operation to extract the product, transportation to a crusher, material fed into a clinker plant, potential cement grinding on site and transportation of product to a port. Based on input from John Kline, each of these phases presents different options for consideration as outlined below:
Phase Option 1 Option 2 Option 3 Option 4 Comments
Extraction Open face quarry Underground quarry
Drill & blast Continuous miner
Visibility, noise and capital costs would be factors
Transport to Crusher
Haul via truck to fixed crusher
Utilize a mobile crusher
Conveyor system Combination of truck and conveyor
Capital expenditure would be key factor
Crusher Location
Close to quarry Close to plant Existing gypsum crusher
Mobile Crusher Logistics will determine location
Clinker Plant Location
In quarry area Near road On existing gypsum property
At the port Environmental factors and capital cost to be considered
Cement Grinding
Ship clinker only, thus grind at port
Grind at clinker plant on Glencoe site
Grind clinker at import terminal
Ship limestone Could be determined by end customers and shipping costs
Transport to Port
Limestone by truck or rail
Clinker by Truck or rail
Cement by truck or rail
Combination of truck and rail
Have to consider conveyors and hoppers for loading and unloading
Appendix B shows the western portion of Cape Breton and Eastern Nova Scotia and the local infrastructure. There are existing rail line, the Trans-Canada Highway and the Strait Super Port, all in close proximity to the Glencoe operation. Initial estimates are that the existing rail line would be within 11 kilometers of the site. As Appendix B shows, the Trans-Canada Highway runs adjacent to the Glencoe site and the existing Georgia Pacific Gypsum Mine.

8 PwC
4. Cement Demand in the U.S.
4.1 Introduction
To compile information pertaining to the cement demand in the U.S. and Eastern U.S. we relied upon the
following:
Portland Cement Association Long-Term Cement Outlook, July 10, 2012 (“PCA”);
IBISWorld Inc. Industry Report 32371 Cement Manufacturing in the U.S. (“IBIS”);
Waterborne Cement and Clinker Movement in the Americas by Ad Lighthart Cement Distribution Consultants, September 14, 2010 (“Cement Consultants”); and
Information obtained through conversations with various stakeholders and advisors for the Glencoe project.
Based on data from PCA and IBIS, cement consumption in the U.S. is typically driven by the following three factors:
1. Demographic and population changes, as seen in Appendix C;
2. Economic trends that impact per capita consumption, as seen in Appendix D; and
3. Structural and infrastructure improvements as seen in Appendix E.
4.2 Cement Demand An overview of historic demand for cement in the U.S. and a forecast through 2035 can be seen in the following table1
Long-Term Cement Demand (000’s of Metric Tons)
Total United States 2005 2010 2015 2020 2025 2030 2035
Total Cement Demand 127,830 70,298 102,503 126,606 144,154 161,789 181,555
Source: Portland Cement Association Market Intelligence Long-Term Cement Outlook, July 10, 2012
As can be seen from the table, demand for cement bottomed out in 2010. The large decrease from 2005 to 2010 can be attributed to the economic downturn in the U.S. and its impact on structural and infrastructure spending, both privately and through various government agencies.
Appendices C, D and E outline the reasons that both PCA and IBIS are forecasting an increase in demand for cement by 2015. Based on PwC’s review of the three indicators for cement demand, we feel that the forecasted amounts appear to be reasonable.
1 PCA

9 PwC
When considering the factors that are driving cement demand in the U.S. as a whole, these factors should be considered2:
83% of the population growth in the U.S. will be in the southern and western regions;
Along the Eastern U.S., the largest population growth from 2010 through 2035 will come in Florida (67.4%), North Carolina (43.5%), Georgia (34.0%) and Virginia (31.6%);
Energy prices and efficiency will also drive demand. Increases in the price of oil may make concrete look more attractive than asphalt for various infrastructure projects;
Concrete is also seen as more energy efficient in terms of construction materials for homes and buildings and increased environmental awareness could see concrete more commonly used for buildings and structures;
Concrete is seen as more robust and improves durability and resilience of structures in the face of climate change;
Construction of new energy sources such as nuclear and hydro-electricity would result in increased use for cement in their construction; and
Shale gas production to date has caused an increase in cement demand for areas impacted by this
development; the Marcells Field in Pennsylvania is a good example of this.
As stated in their report, the projections used by PCA are conservative in nature and could prove to be on the lower side when considering long term demand. We feel that based on the uncertainty around economic recovery in the U.S. conservative estimates should be used when considering cement demand in the U.S.
When considering the AIM operation and potential destinations for cement, we have reviewed the historic demand for cement along the Eastern U.S. Appendix F reflects this information. For purposes of the Assessment, we have assumed that AIM would ship product into New York, NY, Baltimore, MD and/or Jacksonville, FL.
Overall, the historic and forecast information shown in Appendix F can be seen as follows:
Source: Portland Cement Association Market Intelligence Long-Term Cement Outlook, July 10, 2012
2 PCA and IBIS
-
10,000
20,000
30,000
40,000
50,000
60,000
1995 2000 2005 2010 2015 2020 2025 2030 2035
Eastern U.S. Cement Demand (MMT)
10 PwC
5. Cement Supply in the U.S.
5.1 Introduction
To compile information pertaining to the domestic and import cement supply and ports capable of accepting
cement imports in the U.S. and Eastern U.S., we relied upon the following:
John Kline;
Portland Cement Association Long-Term Cement Outlook, July 10, 2012 (“PCA”);
IBISWorld Inc. Industry Report 32371 Cement Manufacturing in the U.S. (“IBIS”); and
Waterborne Cement and Clinker Movement in the Americas by Ad Lighthart Cement Distribution Consultants, September 14, 2010 (Cement Consultant”).
The information provided to us by John Kline and his database of cement plants (the “Database”), presented the most detailed representation of the existing cement supply facilities in the U.S. The Database considered existing kiln facilities as well as those that have been shut down. The facilities that have been shut down may or may not come back on line, and based on environmental factors, we have assumed that they will remain inactive.
5.2 John Kline Database To validate the Database, we reviewed the number of cement plants shown in North America by the PCA Member list included in the PCA website and Database. This review proved to be accurate and, as such, we can conclude that for the purposes of the Assessment, reliance on the Database is valid.
The Database was primarily based on PCA information from 2010 with updates based on John Kline’s personal knowledge of the industry for 2012. It should also be noted that the Database uses U.S. Geological Survey (“U.S.GS”) data on cement production level by state to calculate utilization factor by plant.
The Database includes all operating gray cement manufacturing facilities in the United States and Canada. The database does not include the 3 white cement plants (Lehigh – York, Lehigh – Waco, Federal White – Woodstock), nor does it include information for the 2 cement plants in Puerto Rico (Essroc – San Juan and Cemex – Ponce).
5.3 Existing Domestic Cement Supply For the purpose of the Assessment, PwC focused on the cement plants identified in the Database located along the Eastern U.S. We grouped these facilities by State, and included comparative statistics for North America.
In 2008 in the U.S., the cement industry was comprised of 30 producers operating more than 167 kilns with clinker capacity of 92 MMT, and cement capacity of 99 MMT3. The cement industry is in a mature stage and is highly saturated. As a result the number of cement industry companies remains fairly constant. Cement manufacturers conduct strategic acquisitions and consolidate operations to gain market share4.
3 www.cement.org, Portland Cement Association, The Monitor, Flash Report Overview Impact of Existing and Proposed Regulatory Standards on Domestic Cement Capacity, January 2011, page 9. 4 www.ibisworld.com , Cement Manufacturing in the U.S. June 2013, page 11.

11 PwC
Vertical integration between cement manufacturing and upstream quarrying and downstream concrete product manufacturing is a very important characteristic for the industry5. As cement manufacturers have vertical integration, each operator is less influenced by the actions of other companies6. Currently, the top 5 companies in the industry account for 77.3% of industry revenue. An outline of the top 5 companies can be seen in Appendix G.
In determining the plant capacity, the Database considers PCA data on capacity of the plant and U.S.GS data to calculate utilization factor for cement plants. The 2012 utilization was calculated based on applying the clinker increase per state grouping used by U.S.GS to all plants within that state grouping.
The Cement industry is challenged by high costs of transportation, hence companies avoid transporting the final product or its raw material inputs over long distances via road. Rail and water freight are much more economical means of transportation. Cement plants, as a general rule, are located close to raw material supplies (quarries), key end markets for downstream construction and concrete products, and bulk transportation hubs.7
Based on our review of IBIS, there are 4 regions for the cement industry in the U.S.:
1. West accounting for 15.7% of total establishments in the U.S. with primary driver California state;
2. Great Lakes region with 14.8% of industry establishments in 2013 driven by housing market and export to Canada.
3. Southeast region with 24.4% of industry establishments and primary driver Florida state;
4. Mid-Atlantic region with 14.7% of industry facilities, and servicing commercial building markets of New York City, Philadelphia, Baltimore and New Jersey.
In the Database, the Eastern U.S. has 31 plants out of 127 in North America, representing 24.4% of the total number of plants. These plants have a production capacity of 26.5 MMT out of 118 MMT for all of North America, representing 22.5% of the industry production capacity. Details of cement locations throughout Canada and the U.S. can be seen in Appendix H.
5.4 Forecast Domestic Cement Supply An overview of historic and existing domestic cement supply in the U.S., and a forecast through 2035, can be seen in the following table8.
Long-Term Domestic Cement Supply (000’s of Metric Tons)
Total United States 2010 2015 2020 2025 2030 2035
Domestic Cement Supply 101,216 102,596 102,130 102,870 103,517 103,979
Source: Portland Cement Association Market Intelligence Long-Term Cement Outlook, July 10, 2012
The domestic cement supply in the U.S. is expected to remain flat after 2020. There are several factors to be considered when reflecting upon the domestic cement supply in the U.S.:
The proportion of temporary closures that may become permanent;
The rate at which existing kilns are retired;
5 www.ibisworld.com , Cement Manufacturing in the U.S. June 2013, page 19. 6 www.ibisworld.com , Cement Manufacturing in the U.S. June 2013, page 15 7 www.ibisworld.com , Cement Manufacturing in the U.S. June 2013, page 18 8 PCA

12 PwC
The timing of new regulations for the industry;
Overall probability of completion for postponed expansion projects as a result of the economic downturn in the U.S.; and
Potential changes in specifications in the U.S. which may allow for the increased use of limestone and inorganic materials, such as slag and flyash, in the production of cement.
Based on PCA estimates, by 2015 and beyond in the U.S., Portland cement capacity is expected to reach approximately 107 MMT. PCA estimates are based on planned clinker capacity expansions and assumptions regarding continued retirement of older wet kilns. PCA assumes no new capacity is added beyond announced plans. Portland cement supply can also increase due to changes in U.S. specifications allowing for increased use of limestone. PCA estimates that total additions to cement will increase from 7.5% to 10%, which will add 2 MMT to the cement supply by 20259.
The Cement industry has been gradually phasing out wet kiln clinker capacity, and for the past 10 years, clinker capacity was reduced approximately 1 MMT annually. This reduction has accelerated in recent years and PCA assumes total wet kiln clinker capacity will decline to 2.7 MMT in 2020, compared to 12 MMT in 200710.
When taking into consideration PCA estimates for capacity expansion, changes in specification standards for additions to cement, and structural shut down of wet kilns, clinker capacity is expected to be approximately 97 MMT in 2015, and 95 MMT in 2025, or cement capacity of 102.6MMT by 2015 and 104.0MMT by 202511. Based on these projections it would appear that there are no significant increases in domestic supply, despite a widening supply and demand gap.
5.5 Forecast Domestic Cement Supply for Eastern U.S. Based on AIM’s focus on the Eastern U.S., we have also reviewed the Database specific to cement supply along the Eastern U.S. In considering forecasts for this region and the current supply, we have assumed that market conditions for the U.S. as a whole will apply to the Eastern U.S. More importantly, we have assumed there will be little to no plant expansion or new limestone quarries in the Eastern U.S. for the foreseeable future. Section 6 of the report addresses potential new projects that could have an impact on domestic cement supply.
The majority of Eastern U.S. cement plants are located in Florida (9 plants in operation) and Pennsylvania (6 plants in operation), representing 55% of cement production capacity in the Eastern U.S. Other states that have cement production plants are New York and South Carolina – 3 plants, Georgia and Maryland – 2 plants, and Virginia and Maine – 1 plant. Details for the Eastern U.S. plants are their locations can be seen at Appendix I.
9 www.cement.org, Portland Cement Association, The Monitor, Flash Report Overview Impact of Existing and Proposed Regulatory Standards on Domestic Cement Capacity, January 2011, page 9. 10 www.cement.org, Portland Cement Association, The Monitor, Flash Report Overview Impact of Existing and Proposed Regulatory Standards on Domestic Cement Capacity, January 2011, page 9. 11 www.cement.org, Portland Cement Association, The Monitor, Flash Report Overview Impact of Existing and Proposed Regulatory Standards on Domestic Cement Capacity, January 2011, page 10.

13 PwC
The locations of the cement plants in the Eastern U.S. can be seen as follows:
Source: Source: Database of Cement Plants, Prepared by John Kline, Spreadsheet tab "GIS + Photos".

14 PwC
Based on the Database, we are assuming the current supply along the Eastern U.S. will remain consistent at 26.46MMT per year. A summary of the current supply by state and the corresponding demand for 2010 and 2015 can be seen in Appendix J. The table shows a potential gap in demand and supply for this region of 10MMT by 2020. If we assume that growth for the region will remain in line with what is shown in Appendix F, the supply gap grows to 27.5MMT by 2035.
(20,000)
(10,000)
-
10,000
20,000
30,000
40,000
50,000
60,000
2010 2015 2020 2025 2030 2035
Eastern U.S. Cement Demand and Domestic Supply (MMT)
Eastern US Demand
Eastern US Supply
Supply Gap
15 PwC
6. Imported Cement Supply
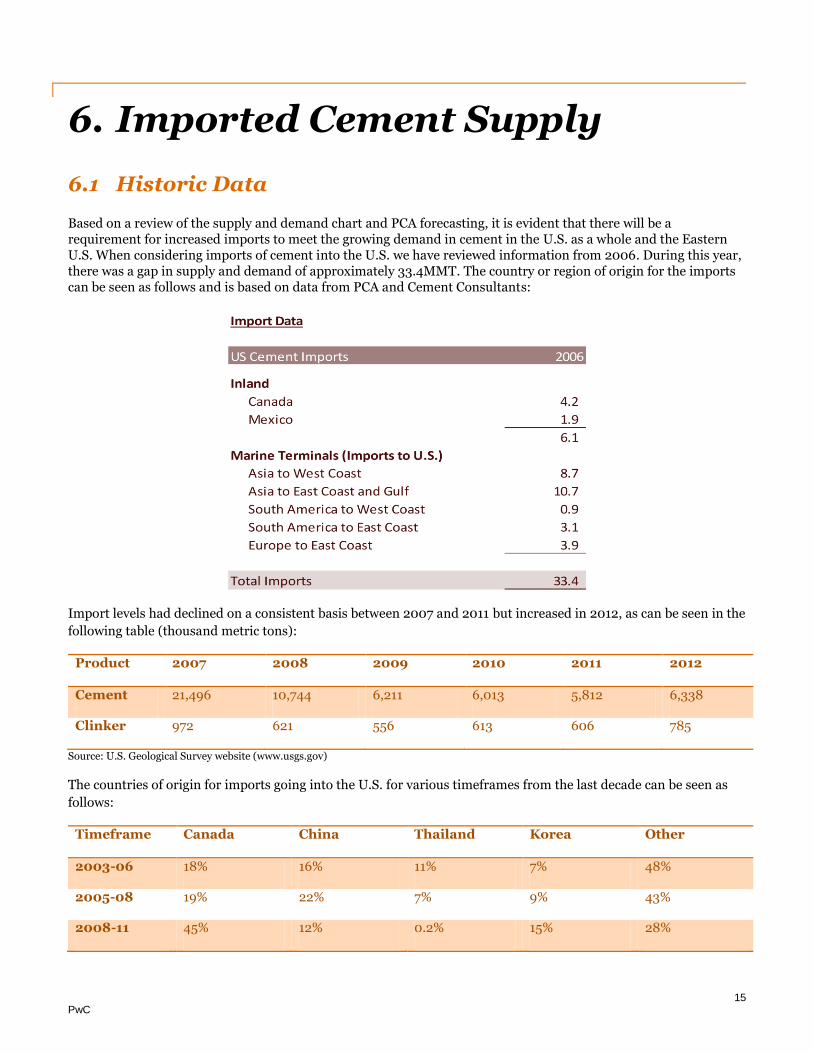
6.1 Historic Data Based on a review of the supply and demand chart and PCA forecasting, it is evident that there will be a requirement for increased imports to meet the growing demand in cement in the U.S. as a whole and the Eastern U.S. When considering imports of cement into the U.S. we have reviewed information from 2006. During this year, there was a gap in supply and demand of approximately 33.4MMT. The country or region of origin for the imports can be seen as follows and is based on data from PCA and Cement Consultants:
Import levels had declined on a consistent basis between 2007 and 2011 but increased in 2012, as can be seen in the
following table (thousand metric tons):
Product 2007 2008 2009 2010 2011 2012
Cement 21,496 10,744 6,211 6,013 5,812 6,338
Clinker 972 621 556 613 606 785
Source: U.S. Geological Survey website (www.usgs.gov)
The countries of origin for imports going into the U.S. for various timeframes from the last decade can be seen as
follows:
Timeframe Canada China Thailand Korea Other
2003-06 18% 16% 11% 7% 48%
2005-08 19% 22% 7% 9% 43%
2008-11 45% 12% 0.2% 15% 28%

16 PwC
6.2 Forecast Data
Based on the supply and demand information that we have reviewed to date, it would appear as though the
33.4MMT gap in supply and demand will occur again sometime between 2020 and 2025.
The majority of the large players in the U.S. cement industry utilize their own trading houses to purchase cement
on a global market. The trading houses would also negotiate shipping for the movement of the cement. Most import
facilities along the Eastern U.S. receive bulk cement from smaller pneumatic vessels versus the larger bulk type
ships. Most cement facilities were built over 20 years ago before larger vessels played a role in the movement of
cement.
We have not undertaken to review detailed global cement supply and the potential countries for imported cement
when there is a supply gap. In discussion with various stakeholders for AIM, we have been informed the most likely
countries that would be looking to export cement to the Eastern U.S. would be Columbia, Spain, Italy, and Greece.
Imports from Columbia would land in the Florida and Georgia area, while imports from European countries could
land at any point along the Eastern U.S. When comparing the viability of AIM versus companies located in the
above noted countries, there are several points of consideration:
Political stability and the ability to supply end customers with a consistent and steady supply of cement on a year round basis;
Economic recovery in European countries and the potential for increased demand within a company’s domestic operation;
Ongoing restructuring of the cement industry in the Mediterranean countries (many plant closing already announced in Spain and Italy, Greece will likely follow); and
Economic recovery or expansion in Mediterranean based countries within Europe and Northern Africa and the potential impact on European supply.
As outlined earlier in the Assessment, we have assumed that imports into the U.S. would land in New York, Baltimore and/or Jacksonville. A review of the Cement Consultant report shows that import terminals along the Eastern U.S. are wholly owned by existing cement companies. This would lead us to believe that, either, an arrangement would have to be made between AIM and another cement company to land product along the Eastern U.S., or that AIM would need to lease/construct their own terminal(s). Appendix K shows a map of facilities along the Eastern U.S. as of 2010. Appendix K also indicates that receiving facilities vary in terms of the product they handle. Some of the facilities contain clinker grinding plants and others contain a terminal capable of receiving ocean going bulk vessels. Based on input from Canada Steamship Lines, it is assumed that if the product shipped is cement or clinker, the receiving facility would have to be enclosed to shield the processed product from moisture, as this would impact the product quality.

17 PwC
7. New Cement Projects and Closures
7.1 New Projects When considering the viability of the Glencoe project, potential stakeholders will give consideration to other potential cement production projects that are currently underway. We relied on input from John Kline to identify recent market entrants and potential projects that he was aware of through industry contacts and also knowledge obtained from the recent IEEE convention. The three potential projects or events in Eastern North America that John Kline felt should be considered are outlined below.
McInnis Cement
A review of the company’s website, www.mcinniscement.com, provided us with publicly available information pertaining to the McInnis Cement project, (“McInnis”). This project is located in Port-Daniel-Gascons, PQ Canada and previously was referred to as the Cimbec project. In December 2011, the Beaudier Group purchased Cimbec. The Beaudier Group is associated with Bombardier and BRP and is the majority shareholder in those companies.
McInnis has hired key industry personnel to form a management team and to assist with planning and having operations in place with a projected start date of 2015. McInnis has a permit to produce 1MMT of cement per year and is focusing on updating the permit for 2MMT. Investment in the project is forecasted to be $1 billion. The limestone deposit is located along the St. Lawrence River and would require the construction of a marine terminal for shipping purposes. The construction of import terminals in the U.S., is included in the project’s estimated cost of $1 billion.
A review of other publicly available information shows that the site contains a limestone deposit of 450MMT. The project could create up to 600 jobs during construction and indirect employment for 400 people once the project begins12.
Holcim, Hagerstown, MD
Holcim has recently settled a dispute with the U.S. EPA over issues pertaining to the Hagerstown facility. As part of the resolution, Holcim will either have to install additional environmental controls or upgrade/modernize the facility. Holcim is currently evaluating modernization options for the facility.
Argos, Harleyville, SC
Argos has a permit to construct a new kiln line at their Harleyville plant in South Carolina. The company is currently installing a new vertical cement mill as part of that project and to keep their permit open.
Titan, Castle Haines, NC
Titan America, a subsidiary of the Greek parent company, has a permit to build a new cement plant on a brown field site in Castle Haines, NC. The project has been delayed due to the economic downturn in the U.S.
12 www.theconcreteproducer.com/cement/mcinnis-cement-promotes-1-billion-plant.aspx.

18 PwC
Lafarge, Ravena, NY
Located in Ravena (NY), this existing facility has received an 18 month extension on a planned modernization project. The project will replace existing wet kiln capacity with a modern kiln; no capacity increase is foreseen as a result of this project.
7.2 Plant Closures According to PCA, recent permanent plant closures in the U.S. are13:
According to PCA, there were 7 permanent plant closures and many more plants furloughed, with an estimated annual capacity of approximately 4 MMT during 2008 – 2011. The plants were closed permanently due to cyclical demand conditions coupled with expectation of slow recovery and the likely prospect of tight emission standards14. PCA estimates there will be further closure of 18 plants with 11 MMT of clinker capacity following the enforcement of EPA emission standards for National Emissions Standards for Hazardous Air Pollutants (“NESHAP”) in 2015, and Commercial and Industrial Solid Waste Incinerators (“CISWI”) in 201815.
13 www.cement.org, Portland Cement Association, The Monitor, Flash Report Overview Impact of Existing and Proposed Regulatory Standards on Domestic Cement Capacity, January 2011, page 26. 14 www.cement.org, Portland Cement Association, The Monitor, Flash Report Overview Impact of Existing and Proposed Regulatory Standards on Domestic Cement Capacity, January 2011, page 26. 15 www.cement.org, Portland Cement Association, The Monitor, Flash Report Overview Impact of Existing and Proposed Regulatory Standards on Domestic Cement Capacity, January 2011, page 4.

19 PwC
8. Pricing
8.1 Current and Historic Pricing For current building material costs the price for cement in October 2013, is $110.88 per ton, this is a drop of 0.2% from September 2013 and 2.0% higher than October 201216. Data from the enr.com site comprises construction material costs for builders in 20 cities across the U.S. from 1913 through 2013 and represent the price that cement suppliers charge builders for their product. The following table represents the price per ton for Portland cement in the 20 cities where data is collected17, cities along the Eastern U.S. are in bold and shown with an asterisk *:
City Price per ton City Price per ton
Atlanta 108.56 Kansas City 103.50 Baltimore* 160.00 Los Angeles 107.00 Birmingham 109.00 Minneapolis 126.50 Boston* 110.00 New Orleans 107.82 Chicago 111.55 New York* 107.00 Cincinnati 104.40 Philadelphia* 108.00 Cleveland 118.50 Pittsburgh 95.00 Dallas 110.15 St. Louis 111.50 Denver 106.65 San Francisco 107.00 Detroit 102.00 Seattle 104.29
The price in Baltimore is significantly higher than the other cities along the Eastern U.S., additional data would be required to understand the increase in Portland cement prices in Baltimore versus Boston, New York and Philadelphia. It would appear as though the average for the Eastern U.S. is in line with the overall average for the 20 cities.
A review of historic data contained on the enr.com website shows the following average prices for Portland cement in the 20 cities indicated:
Soure:bnr.com
16 http://enr.construction.com/economics/current_costs/ 17 http://enr.construction.com/engineering/pdf/economics/2013/ENR10072013CE_WK1.pdf
94
96
98
100
102
104
106
108
110
112
J-0
8
J-0
8
N-0
8
A-0
9
S-0
9
F-1
0
J-1
0
D-1
0
M-1
1
O-1
1
M-1
2
A-1
2
J-1
3
J-1
3
Cement Price Per Ton
Price Per Ton

20 PwC
8.2 Forecast Pricing There are many factors that could impact the price of cement and the forecasted price of cement. The key factor will be the demand for cement in the U.S. pending the economic recovery and the availability of product domestically or via imports.
The increasing cost of environmental protection is also a factor in increasing costs and several U.S. domestic producers are passing some or all of these costs on to their customers.

21 PwC
9. Transportation
We have had discussions with representatives from rail lines and trucking companies in Cape Breton, NS to understand the potential costs to move product from Glencoe to Point Tupper, NS. The intent of our Assessment is not to determine a rail versus road option, more so to get a high level understanding of the potential costs per tonne to move the product and potential capital investment required.
In an effort to determine what the potential landed costs would be to the Eastern U.S. we had initial conversations with Canada Steamship Lines. Subsequent to our meeting we were informed that Canada Steamship Lines did not have a vessel available for the shipment of clinker or cement from Point Tupper, NS.
As the due diligence continues for Glencoe, further analysis and negations will be required to determine shipping costs to deliver the product to market. We understand that there are various shippers with the capability to move either limestone, clinker or cement to customers along the Eastern U.S. from Point Tupper, NS. Appendix B shows the infrastructure in place between Glencoe and Point Tupper, NS.
22 PwC
10. Cement Regulations 10.1 Introduction The cement industry in the U.S. is subject to various government regulations that address product standards, safety standards in production, environmental regulations, access to limestone, gypsum and aggregate quarry resources, zoning of land use and the transport of chemicals and effluent. “All cement marketed in the U.S. must conform to U.S. standards classifications. Most manufacturers are required to have quality accreditation ISO 9002. Standards to which manufacturers must comply cover the uniformity of cement strength and the methods for sampling and testing cements and additives”18.
Environmental regulations relate to quantity and composition of plant emissions into the atmosphere. Specific impacts are:
The U.S. Environmental Protection Agency (“EPA”) is in the process of proposing changes to the Clean Air Act standards, which directly impact cement manufacturers. These regulations are still under discussion at the federal level, but stricter limits are expected industry wide19.
According to the U.S. Department of Commerce, the cement industry invests 3.8% of the value of its shipments in pollution abatement, compared with about 0.7% for the manufacturing sector as a whole20.
PCA cement manufacturing trade group, whose members are majority of U.S. cement manufacturers, stated that the new EPA’s regulations would cost the industry $3.4 billion over a three year period. Later and newer regulations all have compliance dates over a five year period and will substantially increase production costs21.
10.2 Environmental Protection Agency The U.S. cement industry is currently faced with 7 different existing or proposed EPA standards as determined by PCA22:
National Ambient Air Quality Standards (NAAQS)-Currently effective;
Greenhouse gas reporting-Currently effective;
New Source Performance Standards (NSPS)- recently revised and currently effective;
Clean Air Act Tailoring Rule -Currently effective;
CO2 has now been named a pollutant to be regulated by the U.S. EPA. Although regulations have not been set as of yet;
National Emission Standards for Hazardous Air Pollutants (NESHAP)-Currently effective, with compliance required in 2013 changed now to 2015;
New standards for Commercial and Industrial Solid Waste Incinerators (CISWI)-Proposed and compliance to be effective in 2015; and
Fly Ash determination as a hazardous waste-Proposed and assumed to be effective in 2015.
18 www.ibisworld.com , Cement Manufacturing in the U.S. June 2013, pages 32-33. 19 www.ibisworld.com , Cement Manufacturing in the U.S. June 2013, pages 32-33. 20 www.ibisworld.com , Cement Manufacturing in the U.S. June 2013, pages 32-33. 21 www.ibisworld.com , Cement Manufacturing in the US June 2013, pages 32-33. 22 www.cement.org, Portland Cement Association, The Monitor, Flash Report Overview Impact of Existing and Proposed Regulatory Standards on Domestic Cement Capacity, January 2011, page 1.

23 PwC
11. Capital Cost and Cost per Ton
11.1 Capital In order to build estimates relating to the capital costs associated with the Glencoe project and the estimated cost per ton, we had discussions with representatives from the following groups:
B.I.D. Ltd – bulk material handling including conveyors and loading silos;
Cape Breton & Central Nova Scotia Railway – rail lines costs and estimates for rail car inventory;
John Kline of John Kline Consulting; and
Mr. Bill Kerr of W.J. Kerr Business Consultants Ltd. – logistics knowledge for cement industry.
At this point, there are certain aspects of the operation that have not been fully reviewed and, as such, the capital costs and logistics involved in moving limestone from a quarry to end product for furtherance to customers could take on any number of scenarios. The cost estimates we have been provided with thus far are extremely high level and should be considered as “directional” at this point.
As can be seen in Appendix L, we estimated that initial capital cost requirements for Glencoe could be in the range of $500 million. There are potential synergies that may arise through the course of completing further due diligence in relation to Glencoe. These synergies may arise through existing facilities at a gypsum mine and/or at the Port where product may be shipped from.
11.2 Cost per Ton In estimating the potential cost per ton to produce clinker or cement we took the following factors into consideration:
1. The cost per ton to mine and process the limestone;
2. Rail and or road transportation; and
3. Shipping.

24 PwC
As mentioned previously in our Assessment we have had discussions with various groups concerning the potential costs to manufacture and move the product to market. The following table was provided by John Kline based on his knowledge of the industry and the Glencoe site. These figures are preliminary estimates and further due diligence would be required to determine more accurate operating cost estimates.
Operating costs (approximate) Per Ton Variable Costs
Raw Materials $6.00 Power $9.00 Fuel $10.00 Subtotal $25.00
Fixed Costs Labor $10.00 Maintenance $10.00 Other $5.00 Subtotal $25.00 Total $50.00

Appendix A


Appendix B

IA NEX:ANLAtlantic Industrial Minerals
Local
Cape Breton,Nova Scotia,
Eastern Canada

Appendix C

Appendix C
PopulationPopulation growth will trigger the need for more houses to be built, more schools and commercial
buildings as well as facilities for health care. The United States population is expected to grow by nearly
78 million by 2035. Bureau of Census (BOC) projects the population to be roughly 390 million by 2035. In
the 25 years before the great recessions, cement consumption grew by 55 MMT, estimating 18 MMT of
that was attributed to population growth.
Residential Housing: According to the BOC, in 2009 it was estimated that the total stock of homes was
129 Million unites. PCA expects the housing stock to reach 163 million units by 2035.

Public Highways: The number of licensed drivers increased by 56 million between 1980 and 2010, and
the number of vehicles on the road increased by 89 million. The number of vehicle miles travelled
increased 95% within this time period. By 2035, the driving age population will increase by 62 million
from 2010. Road congestion levels will increase substantially as a result. According to the Urban Mobility
Report, congestion levels on Unite States highways and roads nearly quadrupled between 1982 and 2010.
Assuming constant congestion levels through 2034, PCA estimates nearly 2.3 million lane miles of
capacity must be added to maintain present congestion conditions.

Appendix D

Appendix D
Economic Trends
Economic growth usually leads to growth in per capita cement consumption. PCA estimates per capital
cement consumption growth of 0.6% for every one percent increase in real GDP growth. PCA assumes a
2.3% long term economic growth, a 110 basis point discount from historic trends.
Consumer Spending: Consumer spending accounts for more than two out of every three dollars of
economic activity generated by the United States economy. Spending habits among consumers change as
they age. Early on in a consumers career spending often exceeds income. During the ages of 46-54,
consumer spending acidity typically peaks. By the mid-50s, consumer spending remains relatively strong,
but increasingly more attention is placed on savings and retirement planning and less emphasis on
consumption. During retirement years, consumer spending declines on a significant and sustained basis-
consistent with age. The 80 million baby boomers are getting older and currently 17% of baby boomers
have reached retirement age. By 2015, 36% of baby boomers will be at or exceed the retirement age.
.
Government Deficits: PCA expects United States economic growth will slow in comparison to past long
term levels due to the aging population, higher energy costs and potential regulations. This implies that
federal and state revenue growth will slow. State expenditures on Medicare already account for the largest
share of the state budget expenditures. Coupled with the aging baby boomers, rising health care costs, this
suggests a burden on the state and federal budgets, which will grow dramatically during the forecast
horizon.

Appendix E

Appendix E
Structural and Infrastructure
Population and economic growth will play significant roles in determining long term cement
consumption. This does not take into consideration structural changes in the economy and construction
markets and their potential impacts on cement.
Energy Prices: Is considered to be one of the most important long term structural changes impacting
cement consumption costs. While the increase will moderate economic growth and increase the cost of
cement production, it could also result in an improvement in concrete’s competitive pricing position
relative to asphalt and steel. Energy Information Agency (EIA) expects oil prices to reach $155 dollars per
barrel in 2025, and $200 per barrel in 2035.
Nuclear Energy: Nuclear Regulatory Commission (NRC) stated that 19 permits for the construction of
nuclear plants are currently under review. A typical two gigawatt plant on average consumes 200,000
tons of cement. The first nuclear reactor construction in 30 years has begun in Georgia. Site preparation is
also underway for two additional reactors in South Carolina. If construction occurs on all applications
under review, this will translate into 4 million metric tons of cement. According to the World Power
Association, the United States could require as much as 180 gigawatts of nuclear power by 2035. This
implies that 90 nuclear power plants could be constructed.
Competitive Pricing: Rising oil prices imply higher asphalt paving costs. Crude oil refineries in the United
States are moving to produce more light crude products such as gasoline as these products have higher
margins, resulting in less heavy crude products (which have a low margin) such as asphalt. As a result of
this trend the paving costs now favor concrete paved roads. In FY 2009, concrete paved roads enjoyed a
$65,000 cost advantage over asphalt paved roads.

Appendix F

Portland Cement Association Appendix F
Long-Term Cement Demand (000's of Metric Tons)
Growth CAGR
Cement Consumption 1995 2000 2005 2010 2015 2020 2025 2030 2035 2015-2035 2015-2035
Connecticut 620 853 818 479 699 797 814 898 991 292 1.8%
Delaware 232 174 226 178 227 236 234 242 252 25 0.5%
District of Columbia 108 179 206 109 188 171 161 153 148 (40) -1.2%
Florida 6,237 8,284 12,219 3,697 6,947 10,345 12,361 14,624 17,251 10,304 4.7%
Georgia 3,261 3,737 4,752 1,801 3,311 4,564 5,376 6,186 7,018 3,707 3.8%
Maine 215 226 354 187 286 303 326 339 352 66 1.0%
Maryland 1,171 1,421 1,659 933 1,371 1,462 1,677 1,886 2,125 754 2.2%
Massachusetts 1,062 1,603 1,263 688 1,098 1,216 1,237 1,345 1,463 365 1.4%
New Hampshire 263 274 370 193 289 343 358 377 400 111 1.6%
New Jersey 1,466 1,990 2,057 1,162 1,510 1,874 2,124 2,355 2,605 1,095 2.8%
New York 2,422 3,185 3,152 2,375 3,090 3,174 3,524 3,864 4,245 1,155 1.6%
North Carolina 2,492 3,082 3,252 1,706 2,689 4,051 4,516 5,137 5,840 3,151 4.0%
Pennsylvania 2,930 3,501 3,438 2,484 3,428 3,743 4,117 4,469 4,849 1,421 1.7%
Rhode Island 120 158 191 94 147 154 175 186 192 45 1.3%
South Carolina 1,143 1,453 1,944 993 1,408 1,778 2,034 2,302 2,607 1,199 3.1%
Vermont 108 149 155 104 141 159 179 196 213 72 2.1%
Virginia 1,894 2,371 2,869 1,444 2,262 2,438 2,755 3,075 3,449 1,187 2.1%
Eastern US Demand 25,744 32,640 38,925 18,627 29,091 36,808 41,968 47,634 54,000 24,909

Appendix G

Appendix GMain Companies in US Cement Market
Owners.
PCA notes that large multinational companies dominate ownership of the United States cement
industry. In the report prepared by IBIS, it is noted the cement industry has significant concentration
of ownership, with the five largest companies (Lafarge North America, HeidelbergCement, Cemex,
Holcim and Texas Industries) accounting for three-quarters of industry revenue. The largest players
in cement manufacturing are vertically integrated with downstream concrete manufacturing and
wholesaling operations. All top 5 companies, except Texas Industries are foreign-owned with
substantial global cement operations1. Information for each company follows as was reviewed in the
IBIS report:
Lafarge North America (LNA), Industry Brand Names Lafarge North America Inc.
Market share: 19.0%.
Subsidiary of the French global building products giant Lafarge SA, which operates in 78
countries and is the world’s largest cement producer.
LNA largest supplier in North America of cement and other building materials. Vertically
integrated company.
Headquarter outside of Washington DC.
Employs around 10,000 people across US and Canada.
Operates 10 cement plants and 2 grinding plants in the U.S, and 7 cement plants and 2 grinding
plants in Canada. Total production capacity of plants is 19.2 MMT.
HeidelbergCement AG, Industry Brand Names Lehigh Cement
Market share: 17.4%.
Subsidiary of Germany-based HeidelberCement, which is global leader in manufacturing cement
and other building materials, and operates in 40 countries.
HeidelbergCement entered US market after acquiring Lehigh Cement Company in 1977, and
Canadian Lehigh’s operation in 1993.
Leigh Cement Companies operate 8 ray cement and 2 white cement plants in US, and 2 gray
cement plants in Canada.
Cemex SA de CV, Industry Brand Names Southdown, Cemex, RMC Pacific Materials
Market share: 17.1%.
Subsidiary of Mexico-based Cemex, founded in 1906. Cemex grew from small and regional
cement firm to top global supplier of cement, concrete and aggregate.
Cemex entered US market after acquiring Rinker company.
In US, operates 13 cement plants, and 5 plants that are jointly owned with Ready Mix USA, with
total production capacity of 17.1 MMT of cement per year.
1www.ibisworld.com , Cement Manufacturing in the US June 2013, page 4.

Holcim Inc, Industry Brand Names Holman Inc.
Market share: 14.1%.
Wholly-owned subsidiary of Switzerland-based Holcim Group, one of the world’s leading
suppliers of cement, concrete and aggregate, with operations in 70 countries. Operates as
vertically integrated manufacturer.
Holcim significantly expanded operations in US market with acquisition of Aggregate Industries
in 2005. Holcim entered Canada cement market with acquisition of St. Lawrence Cement
company in 2007.
Operates 17 cement and grinding plants in North America, with production capacity of 22 MMT
in 2012.
Texas Industries Inc.
Market share: 9.7%.
Operates in southwestern U.S. primarily in Texas and California with manufacturing of cement,
concrete and aggregates.
Texas Industries Inc. has 82 manufacturing facilities in six states.
Other companies
Market share: 22.7%.
Consist of smaller manufacturers that serve regional and local markets.

Appendix H

Appendix HList of Cement Plants Grouped by Region Included in the Database of Cement PlantsPrepared by John Kline
Region State/Province
Totalnumber ofplants
Total Number ofKilns Operating inthe Plant
Kiln Capacities,Thousand MetricTons
Canada Ontario 6 7 7,081
Quebec 4 8 3,248
British Columbia 3 3 2,581
Alberta 2 3 2,368
Nova Scotia 1 2 506
Canada Total 16 23 15,784
USA Eastern Seaboard Pennsylvania 9 14 5,954
Florida 9 10 8,652
New York 4 4 2,838
South Carolina 3 3 3,747
Georgia 2 1 775
Maryland 2 2 2,599
Virginia 1 1 1,169
Maine 1 1 729
USA Eastern Seaboard Total 31 36 26,463
USA Rest Texas 11 19 11,600
California 10 11 12,393
Alabama 5 5 5,396
Missouri 5 5 9,044
Illinois 4 8 3,110
Michigan 4 6 3,417
Indiana 4 8 3,315
Arizona 3 6 2,998
Oklahoma 3 7 1,730
Kansas 3 5 2,884
Washington 3 2 1,056
Iowa 3 4 2,621
Colorado 3 3 2,957
Utah 2 2 1,546
Tennessee 2 2 1,500
Montana 2 2 579
Ohio 2 3 1,048
Mississippi 1 1 414
Idaho 1 1 -
South Dakota 1 3 840
West Virginia 1 1 1,600
Nevada 1 2 452
Wyoming 1 2 573
New Mexico 1 2 432
Oregon 1 1 894
Arkansas 1 1 1,309
Kentucky 1 1 1,407
Nebraska 1 2 870
USA Rest Total 80 115 75,985
Grand Total 127 174 118,232Source: Database of Cement Plants, prepared by John Kline, Spreadsheet tab "Basic information".

Appendix I

Appendix IList of Eastern Seaboard Cement Plants Included in the Databaseof Cement Plants Prepared by John Kline.
Plantnumber Status State Group Company Name City
KilnCapacities,ThousandMetric Tons
Numberof KilnsOperatingin thePlant
1 Operating Florida Titan Titan America Medley 1,785 1
2 Operating Florida Vulcan Vulcan Materials Co. Newberry 1,489 2
3 Operating Florida Cemex Cemex Brooksville S 1,418 2
4 Operating Florida Cemex Cemex Miami 991 1
5 Operating Florida Independent American Cement Company Sumterville 917 1
6 Operating Florida VotorantimSuwannee AmericanCement Branford 799 1
7 Operating Pennsylvania ItalCimenti ESSROC Cement Corp Nazareth 1,280 1
8 Operating Pennsylvania Heidelberger Lehigh Cement Company Fleetwood 1,066 2
9 Operating Pennsylvania Valdederas Giant Cement Holding, Inc. Bath 949 1
10 Operating Pennsylvania Buzzi Buzzi Unicem, Inc. Stockertown 855 2
11 Operating Pennsylvania Lafarge Lafarge North America Inc. Whitehall 702 2
12 Operating Pennsylvania IndependentArmstrong Cement &Supply Corp. Cabot 264 2
13 Operating Pennsylvania Heidelberger Lehigh Cement Company York 112 1
14 Operating South Carolina Holcim Holcim (US) Inc. Holly Hill 1,860 1
15 Operating South Carolina Argos Argos US Harleyville 978 1
16 Operating South Carolina Valdederas Giant Cement Holding, Inc. Harleyville 909 1
17 Operating New York Lafarge Lafarge North America Inc. Ravena 1,680 2
18 Operating New York Heidelberger Lehigh Cement Company Glens Falls 586 1
19 Operating Maryland Heidelberger Lehigh Cement Company Union Bridge 2,087 1
20 Operating Maryland Holcim Holcim (US) Inc. Hagerstown 512 1
21 Operating Virginia Titan Titan America Troutville 1,169 1
22 Operating Maine Valdederas Giant Cement Holding, Inc. Thomaston 729 1
23 Operating Georgia Cemex Cemex Clinchfield 775 1
24 Closed Florida Cemex Cemex Brooksville N 1,253 2
25 Closed Florida Vulcan Vulcan Materials Co. Palmetto - 0
26 Closed Florida Vulcan Vulcan Materials Co. Tampa - 0
27 Closed Pennsylvania Cemex Cemex Wampum 726 3
28 Closed Pennsylvania ItalCimenti ESSROC Cement Corp Nazareth - 0
29 Closed New York Holcim Holcim (US) Inc. Catskill 572 1
30 Closed New York Heidelberger Lehigh Cement Company Catskill - 0
31 Closed Georgia Argos Argos US Atlanta - 0
Grand Total 26,463 36
Source: Database of Cement Plants, Prepared by John Kline, Spreadsheet tabs "Basic information and Kilns".

Appendix J

Portland Cement Association Appendix J
Long-Term Cement Demand (000's of Metric Tons)
Supply Variance
Eastern Seaboard US 2010 2015 2013 2015 vs Supply
Connecticut 479 699 - 699
Delaware 178 227 - 227
District of Columbia 109 188 - 188
Florida 3,697 6,947 8,652 (1,705)
Georgia 1,801 3,311 775 2,536
Maine 187 286 729 (443)
Maryland 933 1,371 2,599 (1,228)
Massachusetts 688 1,098 - 1,098
New Hampshire 193 289 - 289
New Jersey 1,162 1,510 - 1,510
New York 2,375 3,090 2,838 252
North Carolina 1,706 2,689 - 2,689
Pennsylvania 2,484 3,428 5,954 (2,526)
Rhode Island 94 147 - 147
South Carolina 993 1,408 3,747 (2,339)
Vermont 104 141 - 141
Virginia 1,444 2,262 1,169 1,093
Total 18,627 29,091 26,463 2,628
Note: Supply figures include plants that are currently closed
Demand

Appendix K

REGIONAL OVERVIEW THE US AND CANADIAN NORTH EAST COAST
WATERBORNE CEMENT AND CLINKER MOVEMENTS IN THE AMERICAS
Coastal distribution by:•Dragon (Valderivas) from Thomaston•Holcim from Missisauga, Catskill•Lafarge from Bath, Ravena
Holcim, Corner Brook
Dragon (Coastal) BostonHolcim, Everett
Holcim, ProvidenceLehigh, Providence
Dragon, Newington
Holcim, Foxtrap
Holcim, Argentia
Beton Provincial, Quebec
Titan, NorfolkItalcimenti, Newport NewsLafarge, NorfolkLehigh, NorfolkGiant (Valderivas) Chesapeake
Holcim, Baltimore
Riverside (Silvi), BristolHolcim, Camden (Slag)
Lafarge, Baltimore
Holcim, Mississauga
Lafarge, Ravena
Holcim Catskill
Holcim, QueensLafarge, BrooklynLehigh, BrooklynnTitan, NewarkNYC (Quadrozzi), BrooklynNew Terminal, Staten Island
2006 – (?)2010 – 0,15 mt (?)
2006 – 1,2 mt (Greece, Venezuela, Norway)2010 – 0,25 mt (Greece)
2006 – 1,0 mt (Canada, China, Venezuela)2010 – 0 mt
2006 – 1,6 mt (Thailand, Bulgaria, France)2010 – 0,15 mt (Korea)
Lafarge, BathDragon, Tomaston
Plant with waterside loading facilities
Grinding plants
Terminals
2006 – 3,8 mt2010 – 0,55 mt
Total (imports only)

Exports to Panama2010
WATERBORNE CEMENT AND CLINKER MOVEMENTS IN THE AMERICAS
REGIONAL OVERVIEW THE US SOUTH EAST COAST
Exporting plants or plant on waterside
Grinding plants
Terminals Cemex, WilmingtonArgos, Wilmington
Lafarge, CharlestonHolcim, Georgetown
Lehigh, JacksonvilleLafarge, Jacksonville
Cemex, Port EvergladesLehigh Port Everglades
Argos, Savannah
Cemex, Port CanaveralLehigh, Port Canaveral
Hanson (Heidelberger), Port Canaveral (slag)
Florida Sun, Fort Pierce
Cemex, West Palm Beach
Titan, Pensuco
Vulcan, Port ManateeEastern Cement, Port Manatee
Vulcan, TampaTitan, tampaCemex, TampaLehigh, TampaCementir, Tampa
Cemex, Pensacola
South Coast Cement,Galveston
BuzziNew Orleans (slag)
Holcim (domestic only), Theodore
Southern Concrete, Mobile
Holcim, ReserveHouston Cement 1Houston Cement 2
Cemex, HoustonArgos, Houston
Lehigh, Corpus Cristi
2006 – 0,95 mt(Colombia, Greece)2010 – 0,1 mt (Colombia)
2006 – 0,1 mt (Colombia)2010 – 0,2 mt (Colombia)
2006 – 2,3 mt (China, Denmark, Mexico, Sweden, Turkey, Venezuela)2010 – 0,1 mt (?)
2006 – 3,3 mt (Brazil, China, Colombia, Denmark, Greece, Taiwan, Venezuela)2010 – 0,1 mt (Colombia, Denmark)
2006 – 5,4 mt (China, Colombia, KoreaEgypt, Peru, Taiwan, Spain)2010 – 0 mt
2006 – 3,1 mt (China, Colombia, GreeceKorea, Peru, Thailand)2010 – 0,3 mt (Colombia, Korea)
Exports to Jamaica2010
Vulcan, Tampa (Slag)
2006 – 16,2 mt2010 – 0,8 mt
Total

Appendix L

Atlantic Industrial Minerals Inc. Appendix L
Capital Investment Estimates
Capital Estimated Cost Source of Estimate Notes
Conveyors 8,500,000$ B.I.D. Ltd. Overland conveyors at the mine site and/or kiln, estimate 1 km @ $8,500 per meter
Silos 1,500,000 B.I.D. Ltd. Loading for truck or train movement to port
Conveyors 4,250,000 B.I.D. Ltd. Conveyors to move product from train or truck to ship at port
Rail line 20,000,000 Cape Breton & Central Nova Scotia Railway 11 kms of new rail line to move product from plant to existing rail line
Rail cars 4,000,000 Cape Breton & Central Nova Scotia Railway 200 used hopper rail cars at a cost of $20,000 per car
Processing Facilities 600,000,000 John Kline Estimated costs for a 2MMT per year operation
638,250,000$
Contingency (15%) 95,737,500
Estimated Cost 733,987,500.00$