Embed Size (px)
Citation preview

ATL-SOFT-2003-007ATL-COM-MUON-2003-012
Version 2.02 October 2003
Track Reconstruction
in the ATLAS Muon Spectrometer
with MOORE
D. Adams�, K. Assamagan
�, M. Biglietti
�, G. Carlino
�, G. Cataldi
�, F. Conventi
�, A. Farilla
�, Y. Fisyak
�,
S. Goldfarb�, E. Gorini
�, T. Lagouri
�, K. Mair
�, L. Merola
�, A. Nairz
�, A. Poppleton
�, M. Primavera
�, S.
Rosati�, J. Shank
�, S. Spagnolo
�, L. Spogli
�, G. Stavropoulos
, M. Verducci
�, T. Wenaus
�.
Brookhaven National Laboratory (BNL),
�INFN and University of Napoli ”Federico II” ,
�INFN and
University of Lecce,
INFN and University of RomaTre ”E. Amaldi” ,�
University of Michigan,�
AristotleUniversity of Thessalonki, � European Organization for Nuclear Research (CERN),
�Boston University,
�INFN - Laboratori Nazionali di Frascati,
�U.C.Berkeley.
Abstract
MOORE (Muon Object Oriented REconstruction) is a software package for track reconstructionin the ATLAS Muon Spectrometer, developed in C++ in the ATHENA framework according to mod-ern Object Oriented design principles.
This paper describes the MOORE structure and the reconstruction steps, including all the devel-opments that led recently to the use of MOORE in the reconstruction of Data Challenge events, bothfor physics studies and for a first estimation of its performance as Event Filter, in preparation for theHigh Level Trigger Technical Design Report. Efficiency and resolution as a function of both � and���
have been estimated with samples of single muons of fixed���
in the range 3 GeV to 1 TeV. Pre-liminary results from test beam application (H8 setup) and from reconstruction of simulated �������and � ��������� are also shown.

1 Introduction
Events with high momentum muons in the final state are among the most promising and robust sig-nature of ”new physics” at LHC. The ATLAS Muon Spectrometer [1] has been designed to achievemomentum measurement with high efficiency and good resolution over a wide range of transversemomentum, pseudorapidity and azimuthal angle, while simultaneously providing stand-alone trig-gering capability. Momentum measurement is performed via the magnetic deflection of muon tracksin a system of three large superconducting air-core toroid magnets instrumented with trigger cham-bers and high precision tracking chambers (see Figures 1 and 2) . The magnet configuration providesa field that is mostly orthogonal to the muon trajectories, while minimizing the degradation of reso-lution due to multiple scattering.
Over most of the pseudorapidity range, a precision measurement of the track coordinates in theprincipal bending direction of the magnetic field is provided by Monitored Drift Tubes (MDTs). Atlarge pseudorapidity ( ��������� ������� � ) and close to the interaction point, Cathode Strips Chambers(CSCs) with higher granularity are used to sustain the demanding rate and background conditions.
Trigger signals are provided by Resistive Plate Chambers (RPCs) in the barrel region ( � ������ ��� ) and by Thin Gap Chambers (TGCs) in the region� ������� ���������� . The trigger chambers
provide a ”second-coordinate” of muon tracks, orthogonal to the coordinate provided by the precisionchambers, in a direction approximately parallel to the magnetic field lines, allowing reconstructionof tracks in three dimensions. All muon detectors are arranged in three layers at different radii in thebarrel and at different z positions in the endcaps.
The MOORE design was driven by the goal of performing track reconstruction in a highly mod-ular way, with the highest possible efficiency in all the pseudorapidity range covered by the MuonSpectrometer and with the best possible resolution needed for muon identification in ATLAS.
Detailed studies performed with the FORTRAN program, Muonbox, for the Physics TechnicalDesign Report [2] have indeed shown the capability of the Muon spectrometer to reconstruct muontracks with an efficiency ����� % for
� � � � � GeV in nearly the entire pseudorapidity range andthat the momentum resolution is better than 5% over 80% of the phase space for a wide range of
� �(roughly from 10 to 300 GeV).
The MOORE structure is modular with a set of algorithms based on data objects that can be sharedby different types of algorithms. It was designed to take full advantage of the ATLAS ATHENAoffline framework and, in particular, adhere to the separation of data-like objects from algorithm-like objects. Thanks to its modularity, it could be very easily adapted both as Event Filter in theHigh Level Trigger environment and for the reconstruction of test beam data. For the track fit itselfMOORE relies on the package developed for the Inner Detector (iPatRec) [3]. The performances onsingle muon events and on physics channels have been estimated both for track reconstruction onlyin the Muon Spectrometer with MOORE and extrapolating the track to the vertex with the packageMUID (Muon Identification) [4].
1

2
4
6
8
10
12 m
00
Radiation shield
MDT chambers
End-captoroid
Barrel toroid coil
Thin gap chambers
Cathode strip chambers
Resistive plate chambers
14161820 21012 468 m
Figure 1: Side view of one quadrant of the muon spectrometer.
End-captoroid
Barrel toroidcoils
Calorimeters
MDT chambersResistive plate chambers
Inner detector
Figure 2: Transverse view of the spectrometer.
2

2 The MOORE Pattern Recognition and Track Reconstruction Ap-proach
2.1 MOORE Structure
In the ATLAS offline software package hierarchy, MOORE is a container of three packages: Moo-Event, MooAlgs, and MooStatistics. The software is organized so that classes defining data objectsare clearly separated from classes implementing the reconstruction algorithms. The only link be-tween algorithms are the data objects: packages are organized in such a way that algorithms dependon data objects but data objects do not depend on algorithms. Figure 3 shows a schematic view of thestructure of the MOORE packages:
PhiSegmentContainer
MooMakeRoads
MooStatistics
MooSummary
MooMakeNtupleKINE
MooMakeNtuple
MooMakePhiSegments
RPC/TGC digits
MooMakeCrudeRZSegments MDT/CSC digits
MooEventMooAlgs
MooRoadContainer
MooTrackContainer
MooMakeTracks
CrudeCscSegmentContainer
CrudeMdtSegmentContainer
Ntuples, log files
Figure 3: A schematic view of the MOORE structure.
� MooEvent defines the data objects used by MOORE. Four groups of data objects can be dis-tinguished:
1. Hit data objects: These are objects which are produced after a local reconstruction ineach detector technology by converting the Raw Data Objects to quantities ready to beused by the track fitter. For example, in the MDTs a hit is produced after convertingthe TDC time measurement to a space coordinate. In the CSCs the hit is produced afterapplying the appropriate clusterization methods to the digits. Four classes are imple-mented, MooMdtHit, MooCscHit, MooRpcHit, MooTgcHit, one for each detector tech-nology. All of them inherit from MooMuonHit, which carries the common informationto all four detector-specific classes. The CSC clusterization is performed by a separatepackage (MuonDetRec) whose output is stored in the Transient Data Store to be accessedby MOORE [ see Appendix 8.1 for more detailed CSC clusterization].
3

2. Segment data objects: This kind of objects is produced after a local pattern recognitionat the detector module level. For example MooCscSegments are produced locally in oneCSC detector module, and represent the segment of the track which crossed that specificmodule (equivalently for MooMdtSegment). MooCscSegment and MooMdtSegment in-herit from MooRZSegment which carries the common information to those two detector-specific classes. RZSegmentCombination implements a data object which represents acombination of various MooRZSegments. A PhiSegment represents a track segment in thex-y plane.
3. Track data objects: MooiPatTrack is the data object which describes a reconstructed track(see 2.2 for more details). MooiPatTrack inherits from iPatTrack [3] and adds to it MuonSpectrometer specific variables.
4. Container data objects: These are objects that contain the data objects of the previous twogroups. The container objects are stored in the Transient Data Stored (TDS) to be usedby the MOORE algorithms or by other analysis algorithms (PhiSegmentContainer, Crude-CscSegmentContainer, CrudeMdtSegmentContainer, MooRoadContainer, MooTrackCon-tainer).
� MooAlgs. Two kind of algorithmic classes can be found (explained in more detail in 2.2):
1. ATHENA Top-algorithms which perform the basic reconstruction steps (MooMakePhi-Segments, MooMakeCrudeRZSegments, MooMakeRoads, MooMakeTracks). Each algo-rithm retrieves, from the TDS, data objects created by the previous module and buildsdata objects that are recorded again in the TDS and are available for the algorithm thatfollows.
2. ATHENA Services and Utility classes. These are utility classes which are used by theprevious ATHENA Top-algorithm classes. They are implemented either as ATHENA Ser-vices (MooMdtDigitToHitSvc, MooMdtSegmentMaker), or as normal classes which haveto be instantiated every time they are needed (MooHisto, MooLineFitter, MooTrackPuri-fier, MooTrackSelector, RZSegmentCombinationMaker, MooiPatTrackConstructor, MooiPat-Fitter, MooUtilities).
� MooStatistics is a collection of modules to fill blocks of variables in the combined reconstruc-tion ntuple. In particular the MooMakeNtupleKINE fills the kinematic variables, at generatorlevel, of the muons in Monte Carlo events and MooMakeNtuple adds entries corresponding tothe reconstructed tracks (MooMakeNtuple, MooMakeNtupleKINE).
2.2 MOORE Pattern Recognition and Track Reconstruction Algorithms
2.2.1 ATHENA Top-algorithms
All the classes of this kind implement the three standard ATHENA methods, initialize, execute andfinalize.
In the initialize method (called once per run) the magnetic field map and the information concern-ing the description of the detectors (both the geometry and the materials) are loaded. The magneticfield map is loaded through an ATHENA service, while the description of the detector geometry isavailable through the package MuonDetDescr [5], which accesses the basic parameters defined in the
4

AMDB database [6], either from the ZEBRA banks or from ASCII file or, in the future, from theNOVA database. A standard ATHENA service providing the detailed description of the dead materialnot associated to the detectors (toroids, vessels, etc) is not yet available. We have therefore developeda tool to parametrize such material in order to treat it properly in the track fit (see Section 3).
In the finalize method (called once per run) a message is printed notifying the user that the corre-sponding algorithm has been executed successfully.
In the execute method (called once per event) the corresponding algorithm is implemented. Foreach event, Muon digit collections from RPCs, TGCs, MDTs and CSCs are retrieved from the TDS.Starting from release 5.2.0 (January 2003) MOORE uses the New Event Data Model [7]. Severalparameters used in each algorithm can be changed at run-time via JobOptions file (see Appendix8.2), thus allowing for a flexible control of the running conditions.
� MooMakePhiSegments. In MOORE, the pattern recognition starts by building the track in thex-y plane. The bending power of the toroidal magnetic field in the x-y plane is negligiblealmost everywhere in the detector, so a track can be approximated as a straight line. Startingfrom the RPC/TGC/CSC
�-strips we build PhiSegments, which are essentially vectors of digits
measuring the�
-coordinate. A�
-histogram is filled with all the measured coordinates, usingthe histogramming method described in MooHisto in 2.2.2. Measurements from a muon tracktend to populate the same
�-bin, so a PhiSegment is built by collecting digits from a bin which
has a number of entries above a defined threshold (JobOptions parameter phi histo thr).
� MooMakeCrudeRZSegments. The tracks which cross the ATLAS Muon Spectrometer bend onthe RZ-plane (perpedicular to the x-y plane). In this plane it is not possible to apply a his-togramming method, like in the x-y plane, over the whole detector. Nevertheless, locally inevery detector module (MDT or CSC) a ”crude” pattern recognition can be applied assumingthe tracks to be straight lines and approximating the measurements of that detector in a ”crude”way. For example, segments within one MDT module are reconstructed as straight lines, us-ing the tube radii to approximate the hit positions. The histogramming method described inMooHisto in 2.2.2 is used to fill a histogram with the � -coordinate of the tube centers. A his-togram is produced for each MDT module with fired tubes in an event. Digits belonging tobins with number of entries above a given threshold (JobOptions parameter theta histo thr) aregrouped into a ”crude” RZ-segment (either MDT or CSC). These segments are expected to be”refined” by the later phases of the pattern recognition.
� MooMakeRoads The next step in the pattern recognition process of MOORE is the reconstruc-tion of the tracks in the MuonSpectrometer layers which provide trigger measurements. Moo-MakeRoads loops over all PhiSegments, produced by MooMakePhiSegments. For each PhiSeg-ment, it then loops over all the ”crude” RZ-segments produced by MooMakeCrudeRZSegments.For each ”crude” RZ-segment, which is in the vicinity of the chambers that produced thePhiSegment, performs the pattern recognition process which is explained in MooMdtSegment-Maker of 2.2.2, and creates ”fine” RZ-segments. RZSegmentCombinationMaker follows (see2.2.2), and creates combinations of these ”fine” RZ-segments. With the help of the MooiPat-TrackConstructor (see 2.2.2), the hits, which form the PhiSegment under investigation, andthose forming the ”fine” RZ-segment are combined to a ”road”, which is a MooiPatTrack ob-ject. If a road contains hits from at least two muon layers it is fitted with MooiPatFitter and isaccepted if the fit is succesful ( ��� ����� � ���� assigned in the JobOptions file). A road contain-
5

ing hits from only one layer is accepted without fitting it. One-layer roads are merged if near in� and
�. The merged road is accepted if fitted successfully, otherwise the two one-layer roads
are kept for further processing.
� MooMakeTracks This is the last phase of the pattern recognition and reconstruction procedurewhich produces the final reconstructed tracks to be used for analysis. The tracks producedby MOORE are MooiPatTrack objects, with their parameters expressed at their first measuredpoint in terms of perigee parameters, namely: ��� , � � , � , ��� � ,
����� �( see Appendix 8.3 for a
definition of these parameters). MooMakeTracks loops over all the roads, produced by MooMa-keRoads, and by following a procedure very similar to MooMakeRoads, assigns to each roadthe hits from layers without trigger chambers (e.g. BIL). After having assigned hits from allthe muon layers in a track, the method described in Section 3 is applied, which allocates scat-tering centers along each track, thus allowing the track fit to take into account energy loss andCoulomb scattering effects. The last step in MooMakeTracks is trying to reject, from a track,hits with high residuals, if any. The rejection of the hits contributing to the � � above a giventhreshold allows one to purge the track of hits that are either incorrectly assigned to the trackin the pattern recognition procedure, or are affected by a large uncertainty in the measured driftdistance, leading to a spoiled local spatial resolution.
2.2.2 ATHENA Services and Utility Classes
� MooHisto is a histogramming class, which can construct a histogram from its bin width, max-imum and minimum values. A histogram created in this way has the form of a map as definedin the Standard C++ Library (std::map) [8] with its key-element being the bin number and itsvalue-element being a vector as defined in the Standard C++ Library (std::vector) [8] of theobjects filling that bin. At filling time the contents of the bin, corresponding to the value ofthe input object, are incremented by adding the object to the corresponding vector. To avoidbinning effects the contents of the adjacent bins are also incremented. The class implementsalso methods to find the bins of a histogram with a number of entries above a given threshold.
� MooMdtDigitToHitSvc is an ATHENA service to convert a MDT time measurement into a driftdistance, applying corrections for the propagation time along the wire, the time of flight and theLorentz angle. The r-t relation, currently implemented, is a linear one for all the MDT tubes. Itwill be replaced by a realistic r-t relation when data, simulated with such a kind of r-t relation,will be provided.
� MooLineFitter is fitting a straight line to a vector of MooMdtHits on a plane perpedicular to theMDT tubes. This class was originally developed within the AMBER package [9] and it wasextended to work on endcap MDT chambers.
� MooMdtSegmentMaker contains the algorithm, used by MOORE, to perform pattern-recognitionlocally in one MDT module. For each pair of MDT hits (one in each multilayer), the four tan-gential lines are found (see Figure 4 ). A segment is then built adding one by one all the hitshaving a residual distance from the line smaller than a given cut. The selected MDT hits arefitted with MooLineFitter and the segment is kept if it is successfully fitted, it has a number ofhits above a cut and points to the interaction vertex.
6

� RZSegmentCombinationMaker takes a vector of RZSegments (Mdt or CscSegments) and con-structs RZSegmentCombinations, taking care that the combination contains only one segmentfrom a specific chamber.
� MooiPatTrackConstructor includes methods which transform a set of hits to a MooiPatTrack.
� MooiPatFitter is an interface to the iPatFitter [3] classes, needed to fit MooiPatTracks.
� MooTrackSelector implements methods that choose between two MooiPatTracks with commonhits, according to various criteria (number of hits, fit-quality, etc.).
� MooTrackPurifier implements the method for rejecting hits with high � � contribution to a track,as explained in MooMakeTracks of 2.2.1.
� MooUtilities includes methods to find the common (or different) hits between two MooiPat-Tracks.
Figure 4: Pattern recognition in the MDTs.
2.3 Track Propagation to the Vertex and Combination with the Inner Detector Re-construction
The reconstructed objects produced by MOORE are tracks whose parameters are expressed at the firstmeasured point inside the Muon Spectrometer. A full event reconstruction requires the extrapolationof the track parameters to the vertex. To accomplish this task the MuonIdentification (MUID) packageis used. It is a C++/Object-Oriented package, working within the ATHENA framework.
The purpose of MUID consists in combining tracks found in the Muon Spectrometer with thecorresponding Inner Detector track, reconstructed by the iPatRec package [3], taking into accountthe calorimeter information, in order to provide the best estimate of the kinematic parameters of themuons at their production vertex.
The first step is the extrapolation of tracks from the Muon Spectrometer to the vertex region, inorder to have a set of track parameters comparable to those from the Inner Detector reconstruction. Inthis step, MUID accesses to the MOORE track and propagates it through the magnetic field in order
7

to obtain the track parameters and their associated covariance matrix at the point of closest approachto the beam intersection. The multiple scattering in the Calorimeters is parametrized with a set ofscattering planes; the muon energy loss is evaluated either from the calorimeters measurements orfrom a parametrization as a function of � and the muon momentum. This first step allows one to useMOORE plus MUID as a standalone package for the Muon reconstruction and is referred as MUIDStandAlone mode.
In the next step, Inner Detector and Muon tracks are matched by forming a � � with five degreesof freedom from the parameter differences and summed covariance. A combined fit is performed forall combinations with a � � probability above a certain cut. When no match satisfies this criterion, acombined fit is attempted for the best match within the road around the muon track. Tracks are com-bined using hits from the two subdetectors which were found and used separately by the standalonereconstruction programs. All the matches to the Inner Detector giving a satisfactory combined fitare retained as identified muons. In the following results obtained using this method are referred asMUID Combined mode.
3 Treatment of the Inert Material in the Track Fit
3.1 Fit Refinements
The tracks successfully reconstructed undergo a final processing step which aims at refining the de-termination of the track parameters. This is accomplished by taking into account in a second fit theeffects of multiple scattering and energy loss along the track and by rejecting the hits with largeresiduals, if any.
The rejection of the hits contributing to the � � above a given threshold allows one to clean up thetrack from hits that are either incorrectly assigned to the track in the pattern recognition procedure,or affected by a large uncertainty in the measured drift distance, leading to a spoiled local spatialresolution. The hit rejection can be performed only after a proper evaluation of all the uncertaintiesaffecting the track reconstruction.
Although the air core structure of the toroidal magnetic field has been designed to minimize thematerial traversed by the muons and, hence, the degradation of momentum resolution, the magnetcoils, the vacuum vessels, the material of the muon detectors, various supporting and stiffening struc-tures represent local high density regions in the muon spectrometer where multiple scattering andenergy loss are not negligible. The impact of the material in the tracking performances is clearlyshown by the distributions of the pulls on the track parameters that deviate from expected valueswhen inert material is neglected in the track fit.
Ideally, these effects should be accounted in the fit on the basis of the actual trajectory of eachmuon. In fact, one could follow the trajectory and allow for kinks in the track and energy lossprecisely, and only in the case of the impact of the muon with a relevant amount of inert material. Thefit package, iPatRec, has the built-in flexibility to assign to the track special hits, called “scatterers”,which are defined by a position in space, a thickness, expressed in terms of number of radiationlengths and a loss of energy. At the location of each scatterer the fitting procedure determines thescattering angle, in three dimensions, which best accommodates the measurements along the track,according to the ����� assigned to the scattering center. At the same time, the momentum is correctedfor the energy lost in the material described by the scatterer. This allows one to account for thematerial crossed by the track at the cost of two extra free parameters (the director cosines of the
8

scattering angle) per scattering center. The procedure, however, requires a detailed description ofall the active and inert material in the spectrometer. The geometry model currently implemented inATHENA describes the size, shape, position and materials of all the detectors but it does not yetprovide a description of the magnet system and of the supporting structures.
3.2 Description of the Inert Material
An approximated treatment of the inert material can be obtained by parameterizing the amount ofmaterial on the muon path in terms of the properties relevant from the point of view of the tracking:i.e. thickness crossed in units of radiation lengths and ���
���� . In order to correct the bias in the track
reconstruction, the parametrization must be defined on a grid of granularity, in ��� � ��� ( � beingthe path length), adequate to follow the main structures in the distribution of the material in the muonspectrometer. The pulls of the track parameters can be used as a monitor of the correctness of the ma-terial parametrization. The procedure is based on the balance of accuracy and average performancesand implies an iterative optimization of the parametrization and, possibly, of the segmentation of thematerial map. It should be pointed out, moreover, that this data driven approach will provide a tool tocross check the accurate modeling of the materials in the apparatus when real data will be available.
A first implementation of the parametrization of the inert material is available in MOORE sincerelease 6.0.4. It is based on a grid �� � �� consisting of 1152 bins in the barrel region and 504 bins ineach endcap. The segmentation in
�follows the eight-fold structure of the toroid (figure 5 left): 8 bins
cover the large sectors, where the material distribution is rather uniform; 8 smaller bins correspond tothe regions of the barrel toroid coils; finally 16 bins cover the regions in the small sectors in betweenthe coils and the adjacent large sectors on both sides. The segmentation in � is uniform in � ��� � in thebarrel with 12 bins overall and it follows roughly the arrangement of detectors and materials in theendcaps (figure right 5).
Figure 5: Segmentation in�
(left) and in � in the endcaps (right).
Finally, three regions are distinguished along the trajectory path, the first going from the outeredge of the calorimeter to the end of the innermost layer of the muon spectrometer; here the secondregion starts and extends up to the end of the middle layer of muon chambers; the last region extendsfrom this point to the end of the outer layer of the spectrometer. For a typical track crossing all three
9

stations, 5 scattering centers are added to the track; they are located at the entrance of each layer andat the exit of the inner and of the middle layer. The first two share evenly the total average materialthickness, expressed in terms of number of radiation lengths (and therefore indicated with � � � in thefollowing) and the total energy loss estimated for the bin � ����������� � ��������� � � ������ , where the ���������� and� �������� bins are chosen according to the track parameters at the entrance of the muon spectrometer. Thethird and fourth scatterers share the amount of material assigned to the bin � ����������� � ����������� ����������and the last scatterer accounts for the material in the outer section of the same � � � � bin.
The average � � � and energy loss in each bin of the map have been estimated by means of utilitiesof Muonbox [10]. This package relies upon an internal description of the geometry of inert and activematerials based on the AMDB database [6]. Therefore, it is possible to follow any track in the spec-trometer and record the points where inert material, of a given thickness and composition, is crossed.The energy loss depends on the muon momentum; a suitable approximation, at the energies involvedin ATLAS, consists of a constant term, �"!�# , and a term proportional to the muon total momentum,with coefficient �$!�% . The average � � �� �"!&# and �$!�% in the bins of the map have been computed bypropagating a large sample of high momentum muon tracks in the spectrometer, adding for each trackall the contributions belonging to a given bin and averaging over the sample.
In fig.6 the distributions of the pulls on the track curvature obtained after refitting the tracks withscattering centers assigned according to the parametrization of the inert material are compared withthe pulls obtained when only the material of the muon detectors, available from the geometry servicein ATHENA, is taken into account in the scattering centers. Although the parametrization is not yetoptimized a relevant improvement in the quality of the fit is achieved. The distributions of the track
1/PT Pull - 6 GeV - η< 1
IDEntriesMeanRMS
500 6610
-0.1962 2.866
50.51 / 18Constant 295.5Mean 0.2497Sigma 1.134
With Material Map
Without MaterialMap
0
50
100
150
200
250
300
350
-10 -8 -6 -4 -2 0 2 4 6 8 10
1/PT Pull - 20 GeV - η< 1
IDEntriesMeanRMS
500 6925
-0.3752E-01 2.154
34.17 / 18Constant 406.4Mean 0.6588E-01Sigma 1.100
With Material Map
Without MaterialMap
0
50
100
150
200
250
300
350
400
450
-10 -8 -6 -4 -2 0 2 4 6 8 10
Figure 6: Pulls of the track curvature for muons with� �('*),+ ��- (left) and
� �(' � � + ��- (right).The black histogram, the statistics and the Gaussian fit parameters refer to a track fit including multi-ple scattering and energy loss effects as described in the parametrization of the inert materials in thespectrometer; the red histogram are obtained on the same event sample by taking into account in thefit only the effects of the material in the muon detectors.
parameter pulls, binned according to the segmentation of the parametrization, deviate from a normalbehavior at low momenta in specific regions of the muon spectrometer, indicating the need to optimizethe estimated average � ��� and energy loss. Figures 7 and 8 show a few examples of pull parameters.
10

Figure 7: The mean (top) and the sigma (bottom) of a Gaussian fit to the pull distributions for theparameter ��# (transverse distance of closest approach) on a sample of muons with
� � ' � ��� + ��- inthe barrel, selected according to the
�of the track. 8 sectors, corresponing to the 8-fold structure of
the barrel toroid, are distinguished and numbered in order of increasing�
. In each sector the differentmarkers identify the regions labelled A, B1, C, B2 in fig. 5 (stars for A, circles for B1, crosses for C,dots for B2).
Figure 8: The mean (top) and the sigma (bottom) of a Gaussian fit to the pull distributions for theparameter
�on a sample of muons with
� � ' ) + � - , selected according to the � � � of the track (12slices of equal size cover the barrel �
� � � � � � � � � � � ); slice 1 to 6 cover the half barrel at � � �(the numbering increases with increasing � ) and slices 7 to 12 cover the half barrel at � � � . Trackstraversing different
�sectors are grouped together but selected according to the region in the sector:
(stars for A, circles for B1, crosses for C, dots for B2, labelling according to fig. 5).
11

4 MOORE Performance
4.1 Single Muon Events
The performance of MOORE reconstruction has been extensively tested with single muon samplesof fixed transverse momentum simulated for the Data Challenge 1. In order to test the robustnessof the code nearly
� � �
events, in the energy range from 3 GeV up to 1 TeV, have been successfullyprocessed.
On smaller data samples (20000 events for each energy point) the full reconstruction chain hasbeen executed, namely:
� the reconstruction in the Muon Spectrometer alone (MOORE)
� the extrapolation to the vertex of the track found in the Muon Spectrometer (MUID Standalone)
� the reconstruction in the Inner Detector (iPatRec)
� the combination of the track found in the Muon Spectrometer and in the Inner Detector (MUIDCombined)
Most of the plots shown in this section have been made in the four cases just described. The globalefficiency as a function of
� �is shown in figure 9.
0
0.25
0.5
0.75
1
1 10 102
103
iPatMooreMuid StandAloneMuid Combined
Muon pT (GeV/c)
Effic
ienc
y
|η|< 2.5
Figure 9: Global efficiency as a function of� �
for MOORE, MUID Standalone, iPatRec and MUIDCombined.
The efficiency as a function of � is shown in figure 10 for 6 GeV muons and for 20 GeV muons.The decrease of the efficiency for � � � , expecially in the case of low
� �muons, is due to known
problems in the simulation of the CSC digitization and to a preliminary clusterization procedure inthe reconstruction which still requires optimization. These problems should be solved in the nextmajor ATLAS software release.
The efficiency is rather uniform in the�
coordinate, as shown in figure 11.The resolution on
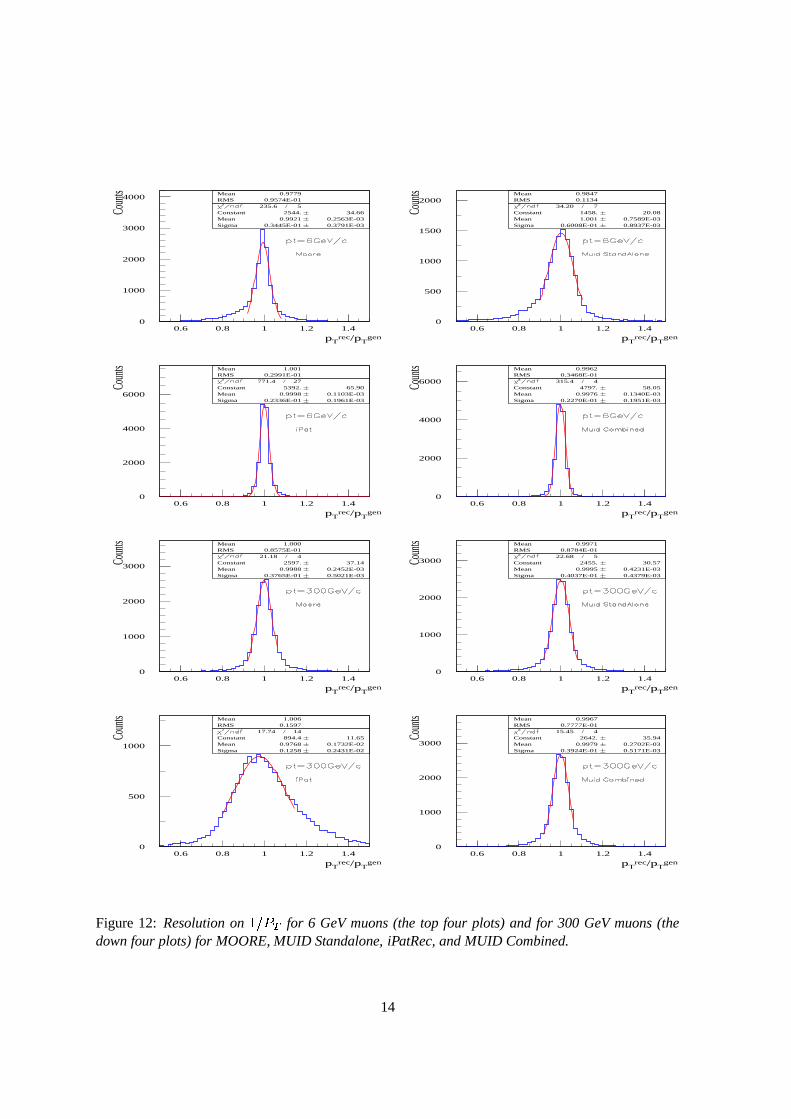
� � � �for 6 GeV muons and for 300 GeV muons is shown in figure 12.
12

0.25
0.5
0.75
1
0.5 1 1.5 2 2.5
MooreMuid StandAloneMuid Comb
iPat
|η|
Eff
icie
ncy
Pt=6 GeV/c
0.25
0.5
0.75
1
0.5 1 1.5 2 2.5
MooreMuid StandAloneMuid Comb
iPat
|η|
Eff
icie
ncy
Pt=20 GeV/c
Figure 10: Efficiency as a function of � for 6 GeV muons (left) and for 20 GeV muons (right).
0.2
0.4
0.6
0.8
1
0 2 4 6
MooreMuid StandAloneMuid Combined
φ
Effic
ienc
y
pT = 50 GeV/c
Figure 11: Efficiency as a function of�
for 50 GeV muons.
13
0
1000
2000
3000
4000
0.6 0.8 1 1.2 1.4
MeanRMS
0.9779 0.9574E-01
235.6 / 5Constant 2544. 34.66Mean 0.9921 0.2563E-03Sigma 0.3445E-01 0.3791E-03
pTrec/pT
gen
Coun
ts
0
500
1000
1500
2000
0.6 0.8 1 1.2 1.4
MeanRMS
0.9847 0.1134
34.20 / 7Constant 1458. 20.08Mean 1.001 0.7589E-03Sigma 0.6008E-01 0.8937E-03
pTrec/pT
gen
Coun
ts
0
2000
4000
6000
0.6 0.8 1 1.2 1.4
MeanRMS
1.001 0.2991E-01
771.4 / 27Constant 5392. 65.90Mean 0.9998 0.1103E-03Sigma 0.2336E-01 0.1961E-03
pTrec/pT
gen
Coun
ts
0
2000
4000
6000
0.6 0.8 1 1.2 1.4
MeanRMS
0.9962 0.3468E-01
315.4 / 4Constant 4797. 58.05Mean 0.9976 0.1340E-03Sigma 0.2270E-01 0.1951E-03
pTrec/pT
gen
Coun
ts
0
1000
2000
3000
0.6 0.8 1 1.2 1.4
MeanRMS
1.000 0.8575E-01
21.18 / 4Constant 2597. 37.14Mean 0.9988 0.2452E-03Sigma 0.3765E-01 0.5021E-03
pTrec/pT
gen
Coun
ts
0
1000
2000
3000
0.6 0.8 1 1.2 1.4
MeanRMS
0.9971 0.8784E-01
22.68 / 5Constant 2455. 30.57Mean 0.9995 0.4231E-03Sigma 0.4037E-01 0.4379E-03
pTrec/pT
gen
Coun
ts
0
500
1000
0.6 0.8 1 1.2 1.4
MeanRMS
1.006 0.1597
17.74 / 14Constant 894.4 11.65Mean 0.9768 0.1732E-02Sigma 0.1258 0.2431E-02
pTrec/pT
gen
Coun
ts
0
1000
2000
3000
0.6 0.8 1 1.2 1.4
MeanRMS
0.9967 0.7777E-01
15.45 / 4Constant 2642. 35.94Mean 0.9979 0.2702E-03Sigma 0.3924E-01 0.5171E-03
pTrec/pT
gen
Coun
ts
Figure 12: Resolution on� � � �
for 6 GeV muons (the top four plots) and for 300 GeV muons (thedown four plots) for MOORE, MUID Standalone, iPatRec, and MUID Combined.
14

The global resolution on� � � �
as a function of� �
is shown in figure 13. The resolution on� � � �
as a function of � for 6 GeV muons and for 20 GeV muons is shown in figure 14.
0
0.1
0.2
0.3
1 10 102
103
MooreMuid StandaloneiPatMuid Combined
Muon pT (GeV/c)
p T reso
lutio
n
Figure 13: Global resolution on� � � �
as a function of� �
: at low momenta the resolution is domi-nated by the Inner Detector while at high momenta it is dominated by the Muon Spectrometer.
0
0.05
0.1
0.15
0 1 2
MooreMuid StandaloneiPatMuid Combined
|η|
p T r
esol
utio
n
0
0.02
0.04
0.06
0.08
0.1
0 1 2
MooreMuid StandaloneiPatMuid Combined
|η|
p T r
esol
utio
n
Figure 14: Resolution on� � � �
as a function of � for 6 GeV muons (left) and for 20 GeV muons(right).
The worsening of the resolution in the region� ��� � � � � � � , especially for low energy muons,
is due to the shape of the magnetic field, which is highly inhomogeneous in the transition region.An optimization of the steps in the track fit in this region, which should improve the reconstructionefficiency, is not yet implemented.
The resolution on� � � �
as a function of�
for 6 GeV muons and for 100 GeV muons is shown infigure 15.
15

0
0.02
0.04
0.06
0.08
0.1
0 2 4 6
MooreMuid StandaloneiPatMuid Combined
φ
p T reso
lutio
n
0
0.02
0.04
0.06
0.08
0.1
0 2 4 6
MooreMuid StandaloneiPatMuid Combined
φ
p T reso
lutio
nFigure 15: Resolution on
� � � �as a function of
�for 6 GeV muons (left) and for 100 GeV muons
(right).
The distribution of the pulls of� � � �
for 20 GeV muons is shown in figure 16.
0
2000
4000
-20 -10 0 10 20
IDEntriesMeanRMS
20020 15562
-0.4002 3.961
16.01 / 3Constant 3162. 39.53Mean -0.1096 0.1716E-01Sigma 1.598 0.1859E-01
1/pT Pull
Coun
ts
0
2000
4000
-20 -10 0 10 20
IDEntriesMeanRMS
30020 15618
-0.4282 2.659
59.81 / 3Constant 3304. 40.32Mean -0.7965E-01 0.1370E-01Sigma 1.284 0.1467E-01
1/pT Pull
Coun
ts
0
2000
4000
6000
-20 -10 0 10 20
IDEntriesMeanRMS
40020 16594 0.1386E-01
1.178 164.7 / 24
Constant 4909. 49.61Mean 0.6013E-02 0.8355E-02Sigma 1.068 0.6792E-02
1/pT Pull
Coun
ts
0
2000
4000
-20 -10 0 10 20
IDEntriesMeanRMS
50020 15621
-0.3609 2.148
68.18 / 4Constant 3498. 39.98Mean -0.1335 0.1235E-01Sigma 1.315 0.1229E-01
1/pT Pull
Coun
ts
Figure 16: Distribution of the pulls of� � ���
for 20 GeV muons.
The distribution of the pulls of� � � �
vs � for 5 GeV muons and for 20 GeV muons is shown infigure 17.
16

Figure 17: Distribution of the pulls of� � ���
for 5 GeV muons (left) and for 20 GeV muons (right).
All the distributions in this section show a rather good agreement with the performance obtainedwith Muonbox and STACO for the Physics Technical Design Report [2].
The timing performance of MOORE and MUID Standalone (in optimized mode) have been eval-uated on a 2.4 GHz, 1GB (RAM memory), 512 kB (Cache memory) machine with samples of singlemuon events of fixed p
�. The execution time is rather flat on the whole p
�range, and when averaged
on the entire � range, it never exceeds 100ms per event. Figure 18 shows the distribution of the exe-cution time for 20 GeV and 300 GeV muons. The average execution time obtained when 95
�of the
events is retained, descarding the 5�
of events with the longest execution time, is shown in Table 1.
1
10
10 2
10 3
0 1000 2000 3000 4000
MeanRMSUDFLWOVFLWALLCHAN
79.19 72.58 0.000 2.000 1966.
Time (msec)
Cou
nts
pT = 20 GeV/c
1
10
10 2
10 3
0 1000 2000 3000 4000
MeanRMSUDFLWOVFLWALLCHAN
126.9 279.3 0.000 29.00 2009.
Time (msec)
Cou
nts
pT = 300 GeV/c
(a) (b)
Figure 18: Distribution of the execution time for 20 GeV (a) and 300 GeV (b) muons in the whole �range.
17

Sample (GeV/c) Time (msec)Average (rms)
8 82 (42)20 66 (26)50 65 (29)
100 74 (37)300 83 (64)
Table 1: Average time execution for MOORE plus MUID Stadalone when 95% of the events isretained, discarding the 5% of events with the longest execution time.
The average execution time as a function of p�
and for the three cases (only barrel, only endcaps,barrel+endcaps) is shown in figure 19, for events reconstructed within 1 second, corresponding to
� � � �of the whole sample.
A more detailed description of the MOORE timing can be found in [11].
0
50
100
150
200
10 102
|η| > 1All |η||η| <1
Tmax < 1 sec
Muon pT (Gev/c)
Mea
n Ti
me (
mse
c)
Figure 19: Average execution time as a function of p�
for events reconstructed within 1 second( � � � �
of the whole sample).
18

4.2 Single Muon Events with Background
The effect of the presence of the background generated by the radiation in the cavern on the re-construction with MOORE has been studied by using single muon simulated samples with
� � '� ��� + � - , produced for the Data Challenge 1. As soon as simulated data sets are available, the anal-ysis will be performed on samples with different
� �values, in order to understand the dependence
of the results on the muon energy. The single muon events have been reconstructed in the MuonSpectrometer alone in three different conditions:
� a) no pile-up was superimposed in the event;
� b) a pile-up corresponding to the amount of background estimated to be present in the cavernat high luminosity � ' � ��� � � ����� ��� % (“nominal” pile-up) was superimposed in the event;
� c) a pile-up corresponding to 2 times the nominal one (“safety factor 2” pile-up) was superim-posed in the event;
� d) a pile-up corresponding to 5 times the nominal one (“safety factor 5” pile-up) was superim-posed in the event.
In Fig. 20 and in Fig. 21 the total number of Phi hits on RPC and the number of segments in Phireconstructed by the pattern recognition in the event are shown for the four cases a), b) c) and d), as anexample of the different levels of the detector occupancy and of the increased degree of complexityfor the tracking.
Figure 20: Total number of Phi hits on RPC in events with no pile-up (upper left), nominal pile-up(upper right), safety factor 2 pile-up (lower left), safety factor 5 pile-up (lower right).
19

Figure 21: Total number of segments reconstructed in Phi in events with no pile-up (upper left),nominal pile-up (upper right), safety factor 2 pile-up (lower left), safety factor 5 pile-up (lower right).
Although the track multiplicity per event (only events in � ��� � ��� have been considered) increaseswith the background level (see Fig. 22), suitable quality requirements allow one to identify the recon-structed track corresponding to the simulated muon.
Figure 22: Reconstructed track multiplicity in events with no pile-up (upper left), nominal pile-up(upper right), safety factor 2 pile-up (lower left), safety factor 5 pile-up (lower right).
20

For this track, the � � , the average number of associated hits, both on trigger and precision cham-bers, and the momentum resolution is not drammaticaly deteriorated by the background presence.This can be observed in Fig. 23, where the fit of the resolution on
� ��� �in the four cases provides
similar results on the width of the “core” distributions.
Figure 23:� ��� �
resolution of the identified muon track in events with no pile-up (upper left), nominalpile-up (upper right), safety factor 2 pile-up (lower left), safety factor 5 pile-up (lower right).
The single muon efficiency has been evaluated by imposing different cuts on the number of stan-dard deviation ( � ) of the
������������ �� distribution, and results are shown in Fig. 24, from which one
observes a few percent loss of efficiency when a cut at 3 � , 5 � or 10 � is applied, suggesting that thepopulation of the longer tails in the distribution increases with the background. Efficiency is mainlylost because of tracks that fail the MOORE reconstruction. In some cases (increasing with the back-ground and � � � �
of the events rejected by the cut on� �
resolution), the track identification selecteda wrong segment, while there was another segment in the event with a reconstructed
� �within 3 � .
This suggests that for these cases, additional information from the extrapolation to the vertex (MUIDStandalone) could aid recognition of the muon.
21

Figure 24: Single muon reconstruction efficiency as a function of the cut on the number of � ’s of� ��� ���� � ��� .
4.3 Z � ���
The very precise measurement of the Z Boson mass performed at e � e � colliders and the copiousproduction of Z � ��� events in ATLAS provide a powerful tool to set the absolute momentum scaleof the muon spectrometer.
Thanks to the abundant production of Z bosons (about 30000 events per day at low luminosity),from the known Z mass we will be able to measure other particle masses with high precision and havea cross-check between the different subdetectors, allowing the calculation of systematic uncertaintiesand reducing them as much as possible.
We have processed, with ATLAS Software Release 6.0.2, 5000 Z � ��� events simulated for theData Challenge 1.
The Z invariant mass has been evaluated with the reconstruction performed only in the MuonSpectrometer with MOORE (no extrapolation to the vertex, see figure 25, top plot) and combining thereconstruction in the Inner Detector and in the Muon Spectrometer with MUID (see figure 25, downplot). No kinematics cuts were applied to the single muons. A Gaussian fit to the mass distributionobtained with MUID gives �
' ��� �GeV.
22

22.51 / 13Constant 406.1Mean 84.45Sigma 4.259
Invariant Mass (GeV)
Num
ber o
f Eve
nts
6.197 / 7Constant 494.0Mean 90.62Sigma 2.862
Invariant Mass (GeV)
Num
ber o
f Eve
nts
0
50
100
150
200
250
300
350
400
450
500
0 20 40 60 80 100 120 140 160
0
100
200
300
400
500
600
0 20 40 60 80 100 120 140 160
Figure 25: Z Invariant mass obtained with MOORE (top plot) and with MUID (down plot).
4.4 H � �������
The Standard Model (SM) Higgs boson decay H � � � � � ������� for m � =130 GeV has beenstudied using the MOORE and MUID reconstruction software in ATLAS Software Release 6.0.3.These events (50 K) were produced for the Data Challenge 1. The Higgs to 4 muons events weregenerated with release 5.3.0 and afterwards fully simulated with release 6.0.2.[12]. The applied eventselection is according to the Physics TDR event selection [2]. The signal reconstruction proceeds byselecting four muons which pass the muon identification criteria followed by the following kinematiccuts:
� Two muons with p� � � � GeV and � ��� � ��� � are required for trigger
� Two additional muons with p� � � GeV and � �� � ��� � are required
� One pair of muons of opposite charge is required to have an invariant mass in a window aroundthe Z mass, defined as m �
�m % � .
� The other pair of muons is required to have an invariant mass above a certain threshold definedas m � � threshold.
The optimised values of the m % � window and of the m �� threshold used for the Higgs-boson mass of
130 GeV are 15 GeV and 20 GeV. Furthermore, in this Higgs analysis [13] the kinematic constraintof the Z mass is used, and this improved the mass resolution by about 20%: a Z mass constraint isapplied if the mass of the muon pair is inside a window of
�6 GeV around the nominal Z-mass. When
only the Muon System is used (MUID Standalone) the Higgs mass resolution is � =2.46 GeV. Thecombination of the Muon System and Inner Detector measurements (MUID Combined) improves themass resolution to � =1.60 GeV. The reconstructed mass distribution for the 130 GeV Higgs decays
23

using MUID Standalone and MUID Combined is shown in figure 26 (a) and (b) respectively 1. Themass resolution with MUID Combined is improved w.r.t. MUID Standalone by about 35
�.
Figure 26: Higgs invariant mass obtained with MUID Standalone (left) and MUID Combined (right).
4.5 Visualization with ATLANTIS
ATLANTIS is an event visualization program based on the ALEPH event display ”DALI” and usesData Oriented Projections. It is written entirely in JAVA. Its primary goal is to facilitate the visualinvestigation and physical understanding of complete ATLAS events, but it is also useful for devel-oping reconstruction and analysis algorithms, for use as an online event display and for displayingevents from test beams. ATLANTIS currently visualizes the following data:
� 3D silicon points, silicon strip clusters and TRT straws
� Simulated tracks, neutral particles and vertexes
� Reconstructed tracks (iPatRec, xKalman, MOORE)
� Hit-to-track associations (kine, iPatRec only)
� Reconstructed secondary vertexes
� LAr, TILE, HEC and FCAL calorimeter cells and clusters
To display an event with ATLANTIS it is necessary to generate an xml file during event recon-struction using the JiveXML ATHENA package. JiveXML runs inside either TestRelease or RecEx-Common and must be selected via the jobOptions file. In figure 27, the decay � ������� ����� �
' ��� �GeV) is shown.
1The two plots of figure 26 have been presented by E.Meoni at the Higgs Meeting held on June 25��� , 2003. See reference[13] for more details
24

Documentation about ATLANTIS and JiveXML can be found in [14].
Figure 27: ATLANTIS visualization of the decay � ������������� �' ��� � GeV) in X/Y projection (top)
and � /Z projection (down).
5 MOORE as Event Filter in the High Level Trigger Environment
In the present architecture of the ATLAS High Level Trigger (HLT) [15], at the Event Filter (EF) levela reduction of the trigger rate from � 2 KHz to � 200 Hz must be achieved. Algorithms running in theEF can access the full event and must accomplish their task with a latency of � 1 second. A detaileddescription of the MOORE implementation for the EF and of its performance can be found in [11],here we will only report the most relevant concepts for a basic understanding. Offline algorithmsoperating at the EF level must have the possibility to be executed in two different modes [16]:
� in general purpose (or wrapped) mode, where the reconstruction is performed on the wholedetector, as done in the offline environment;
� in seeded mode, where, through the Region Selector [17], the algorithms access only the digitscoming from a given Region of Interest.
In the second case, once the digits in a given Region of Interest are available, the reconstructionproceeds exactly as in the offline environment.
At the EF level the Region of Interest found by the LVL2 algorithms (muFast) should be used.
25

However at the time this note has been written only the Region of Interest found by LVL1 wasavailable and has been used. The performances of MOORE, when executed in seeded mode, aresimilar to the ones of the offline version described in Section 4, as can be seen in figure 28 for the
� �resolution.
MooreMuid Standalone
|η|< 1.05
Muon pT (GeV/c)
p T reso
lutio
n
0
0.025
0.05
0.075
0.1
1 10 102
103
Figure 28: Resolution on� �
as a function of the generated� �
in+ � - obtained with MOORE and
with MUID standalone (seeded mode). (blue: MOORE reconstruction, red: MOORE plus MUIDstandalone).
Since the LVL1 output is presently restricted only to the barrel, the performances of MOORE inseeded mode have been tested only in that region, while the performances in the wrapped mode havebeen evaluated in the whole pseudorapidity range. A detailed description of the MOORE timing, bothin wrapped and seeded mode, can be found in [11].
6 Reconstruction of Test Beam Data with MOORE
Important feedback is provided to the MOORE algorithms by their use in the reconstruction of realdata collected at the Muon Test Beam in the H8 area. A detailed description of the test beam setup forthe year 2002 can be found, for example, in [18]. The barrel setup reproduces in full scale an MRODof the spectrometer with six chambers, two for each station. The endcap setup reproduces a sector ofthe spectrometer endcap with four of the six MROD chambers fully operational.
The ATHENA package MuonTestBeam has been developed to prepare the test beam data recon-struction with MOORE in the ATHENA framework. The package consists of a conversion service todecode H8-DAQ data and build digits in the new Muon Event Data Model, a set of services provid-ing access to conditions data (e.g. electronic mappings, calibrations), and a set of algorithms for theanalysis of the data. This last set of algorithms includes the possibility of filling one or more ntuples(using the ATHENA Combined Ntuple framework) for data analysis.
In addition, the package MuonAsciiDetDescrSource has been developed to initialize the detectordescription from the AMDB ASCII files used to describe the geometry of the H8 setup. The packageprovides decoders, one for each technology, capable to initialize the ATHENA MuonDetDescrMan-ager from these ASCII files.
26

An example of a spectrum of TDC counts obtained from an MDT tube is shown in Figure 29. Thegas mixture used is Ar-C02 93%-7%; as can be seen from the drift time spectrum this gas mixtureleads to a very non-linear relation between the drift distance and the drift time measured by the TDC.
0
100
200
300
400
500
400 600 800 1000 1200 1400 1600TDC counts
Even
ts
Figure 29: TDC counts distribution from a single MDT channel. The non-uniformity of the distri-bution is due to the highly non-linear r-t relation typical of the gas mixture (2002 Muon Test Beamsetup).
First tests of the reconstruction of test beam data with MOORE, were performed on the datacollected during the Summer of 2002. During this data taking period only MDT chambers wereinstalled in H8. The first reconstruction step consists of building “CrudeRZSegments” in each MDTstation. A straight line fit through the drift circles belonging to the crude segments is then performed,to reconstruct track segments in each of the three stations. For this purpose, the MOORE algorithmicclasses MooMdtSegmentMaker and MooLineFitter are used. The segments can be used for analyzingthe chamber alignment, for checks of the calibration parameters, and for the preparation of the globaltrack reconstruction via MOORE algorithms. An example of the results of the segment fit is shownin Figures 30 and 31. To perform the fits, the calibration constants obtained using the H8 MDTcalibration package Calib [19] were used.
A global track fit can be performed making use of the full MOORE reconstruction chain, asdescribed in the previous sections. First preliminary tests were performed on 2002 data, by creatingfake RPC or TGC digits to reconstruct crude
�segments as first reconstruction step, even in absence
of RPC and TGC detectors. The H8 setup for the year 2003 data taking foresees the presence of RPCand TGC chambers along with MDT chambers; this will allow a complete test of the MOORE patternrecognition and track fit, on real data.
The location of the MuonTestBeam package in the ATLAS offline CVS repository is:offline/MuonSpectrometer/MuonTestBeam.
27

0
500
1000
1500
2000
2500
-0.1 -0.075 -0.05 -0.025 0 0.025 0.05 0.075 0.1Fit residual (cm)
-0.15
-0.1
-0.05
0
0.05
0.1
0.15
0 100 200 300 400 500 600 700Drift Time (ns)
Res
idua
l (cm
)
(a) (b)
Figure 30: Figure (a) shows the distribution of the fit residuals for track segments fitted on a BILchamber. Figure (b) shows the residuals value as a function of the drift time (2002 Muon Test Beamsetup).
0
50
100
150
200
250
300
0.2 0.22 0.24 0.26 0.28 0.3 0.32tan(θ)
0
50
100
150
200
250
300
350
0.2 0.22 0.24 0.26 0.28 0.3 0.32tan(θ)
(a) (b)
Figure 31: Figure (a) shows the angle of the track segment reconstructed in the BIL station, while (b)shows the track segment angle on the BOL station (2002 Muon Test Beam setup).
28

7 Conclusions and Outlook
The MOORE package performs track reconstruction in the Muon Spectrometer both at offline andonline levels, as Event Filter in the High Level Trigger framework. Reconstruction performanceshave been tested both with simulated events from Data Challenge 1 and with real data from theH8 test beam setup. Results obtained so far, both for simulated single muon events and for somephysics channels, are in good agreement with those obtained with Muonbox for the Physics TDR.With MOORE it is possible to estimate, for the first time, the performances of the complete “MuonVertical Slice” (LV1/LV2/LV3) in the High Level Trigger framework. The MOORE modular designis well suited for having more than one reconstruction algorithm implemented for easy comparison.An alternative reconstruction method, based on Kalman filter technique, is indeed presently underdevelopment.
29

8 Appendices
8.1 CSC Clusterization
In the inner part of the ATLAS muon spectrometer, cathode strip chambers (CSC) are used in theforward region ( � ' � – ��� � ) to withstand the high hit rates. The CSC are multi-wire proportionalchambers with a segmented cathode strip readout. The MDT and the CSC measure track coordinatesin the bending plane with high precisions. The CSC are equipped with sets of orthogonal cathodestrips which provide information on the non-bending coordinate. The precision coordinate is obtainedby measuring the induced charge on the segmented cathode (cathode strips) by the avalanche on theanode wires. The CSC come with two types of modules; two identical modules form a chamber.The internal structure of a module consist of four wire planes with four orthogonal sets of cathodestrips. Further details on the internal and external structures of the CSC modules and their layout inthe ATLAS muon spectrometer can be found in [1].
8.1.1 Clusterization Algorithms
Before being used in track reconstruction by MOORE, the CSC digits are processed by dedicated clus-terization algorithm whose output is stored in the Transient Data Store to be accessed by MOORE.Several algorithms have been employed in test beam to determine the track position in the CSC. Thesealgorithms use different combinations of charges on the strips (clusters) to infer the track coordinates:
� A weighted center of gravity algorithm where the cluster position is given as the chargeweighted mean of the positions of a few strips around a strip with the highest charge. Thismethod does not work at high rates because of its strong sensitivity to anode-cathode cross-talk [20].
� A Gaussian fit method where the cluster position is obtained as the mean of the Gaussian fitto the charge distribution in the cluster. This method too does not work very well in high ratesituations [20].
� A ratio algorithm first determines the position of the strip with the highest charge in the clus-ter. Then this position is corrected by a function which depends on the ratio of the chargedifferences between highest charge and the charges of the strips adjacent to highest. The cor-recting function is obtained from test beam data. This method is shown to be stable in high rateenvironments [20].
� A combined fit algorithm which uses a double Gaussian fit to charge distribution. The widthsof the two Gaussian functions are fixed to their values determined in test beam. First, singleGaussian fits are performed to the right and to the left of the strip with the highest charge todetermine the input parameters of the combined fit. A single Gaussian fit is also carried out andone or two possible clusters are found by comparing the results of the combined fit to that ofthe single Gaussian fit [20].
Only strips with charges above the noise level are used in the clusterization algorithms. The noiselevel has been studied in test beam and is a user adjustable parameter of the clusterization algorithms.
30

The determination of the cluster sizes and their positions is done on each of the four planes of thecathode strips which measure the precision coordinate in a CSC module.
8.1.2 Software Organization of the Clusterization Algorithms
The CSC clusterization algorithms can be found in the ATLAS CVS repository under MuonSpec-trometer/MuonDetRec/. At the time of this writing, three sub-packages are stored under the con-tainer package MuonDetRec.
� MuonDetCluster: The cluster class for the CSC (CscCluster) is located here. This is a dataclass of a CSC cluster which is a list of the CSC digits that make that cluster, the local positionof the cluster obtained from the clusterization methods described above, the error on this po-sition, and the identifier of the cluster (this is the identifier of the strip with the highest chargein the list). Classes for the weighted average and the combined fitting clusterization methodsare also implemented in this package. Eventually, similar classes for RPC and TGC will beimplemented in this package.
� CcsClusterization: this package contains an ATHENA algorithm to do the CSC clusterization.It retrieves the container of CSC digits from the Transient Data Store, does the clusterization,and stores the list of clusters in the Transient Data Store where they are picked up duringreconstruction. The algorithm has a job option file where the clusterization method can beselected and the noise level on the CSC strips can be changed. Thus far, only the weightedaverage and the combined fitting algorithms are implemented. The default noise level of 75000electron equivalent charge has been determined in test beam.
� MuonDetPosition: This sub-package contains a class to calculate the positions of MDT tube,CSC, RPC, TGC strip and TGC wire gang positions in the global reference frame. It also cal-culates the positions of detector elements. The identifier of the detector element or of the tube,strip or gang is passed to the muon detector description package which knows how to determinelocal positions and how to apply the transformation matrices to derive the global positions. Forthe CSC clusterization, the local cluster positions obtained from the clusterization methods de-scribed above, are passed to the MuonDetPosition class for the calculation of the correspondingglobal positions.
31

8.2 JobOptions Parameters
The location of the MOORE package in the ATLAS offline CVS repository is:offline/MuonSpectrometer/MOORE.
The instructions on how to install and run MOORE can be found on the MOORE Web Page [21].
PARAMETER DESCRIPTIONprint level general output level threshold (0-4)
phi histo thr threshold for accepting the contents of a bin in phi-histogramsphi histo bin phi-histogram bin widththeta histo thr threshold for accepting the contents of a bin in theta-histogramstheta histo bin theta-histogram bin width
segment histo thr threshold for accepting the contents of a bin in segments-histogramssegment histo bin segment-histogram bin width
min mdt minimum number of MDT digit in a RZSegmentlight speed speed of light (in cm/ns)
signal speed speed of signal propagation along the wire(in speed of light units)drift velocity drift velocity used in simulation (in cm/ns)lorentz angle Lorentz angle
mdt resolution MDT resolution (in microns)mdt resolution wire MDT resolution close to the wire (in microns)mdt resolution cut distance from wire below which the mdt resolution wire appliesmdt cottheta cut cut in CotTheta for MDT segments
delta ray cut delta ray cut (in cm)trigger digits cut number of strip/gang widths for a z str
two mult cut minimum number of digits for a 2-multilayer MDTSegmentone mult cut minimum number of digits for an 1-multilayer MDTSegment
chi2 cut chi2 cut for fitted track candidate
Table 2: JobOption Parameters
32

8.3 Description of the MOORE Ntuple
The standard MOORE output consists of a column-wise ntuple, resident in a file and with a loca-tion and identifier in this file which can all be defined via jobOptions by calling ATHENA services.Defaults are : “ntuple.hbook” and “CBNT/222” for, respectively, filename and path/ntuple identifier:
NTupleSvc.Output = ”FILE1 DATAFILE=’ntuple.hbook’ OPT=’NEW”’ ;CBNT Athena.NtupleLocID=”/FILE1/CBNT/222”;The blocks of variables to be filled in this ATHENA “combined” ntuple can be selected in the
jobOptions file. The present default is:CBNT Athena.Members = ”CBNT EventInfo”, ”MooMakeNtupleKINE”, ”MooMakeNtuple”;which produces a standard output including the following blocks:
� EVENT (this block contains general event information);
� KINE (for each generated muon, this block contains the “true” kinematic parameters given atdifferent points along the track trajectory);
� RECO (this block contains relevant variables describing each reconstructed track).
In the KINE block, the maximum number of particles per event to be written in the ntuple (whichdoes not correspond to different generated muons, since the same muon enters more than once in thentuple) can be defined in the jobOptions via:
MooMakeNtupleKINE.maxNumberofKINE=50;while the maximum number of reconstructed track segments per event can be set by:MooiPatNtuple.maxNumberofRECO=500;The meaning of each variable in the standard ntuple is described below in Table 3.“Non standard” MOORE output ntuples, containing additional variables for performing dedicated
studies (e.g. in the case of using the parametrization of the inert material), are produced by official orprivate versions of the code, but for the moment have not be considered here.
33
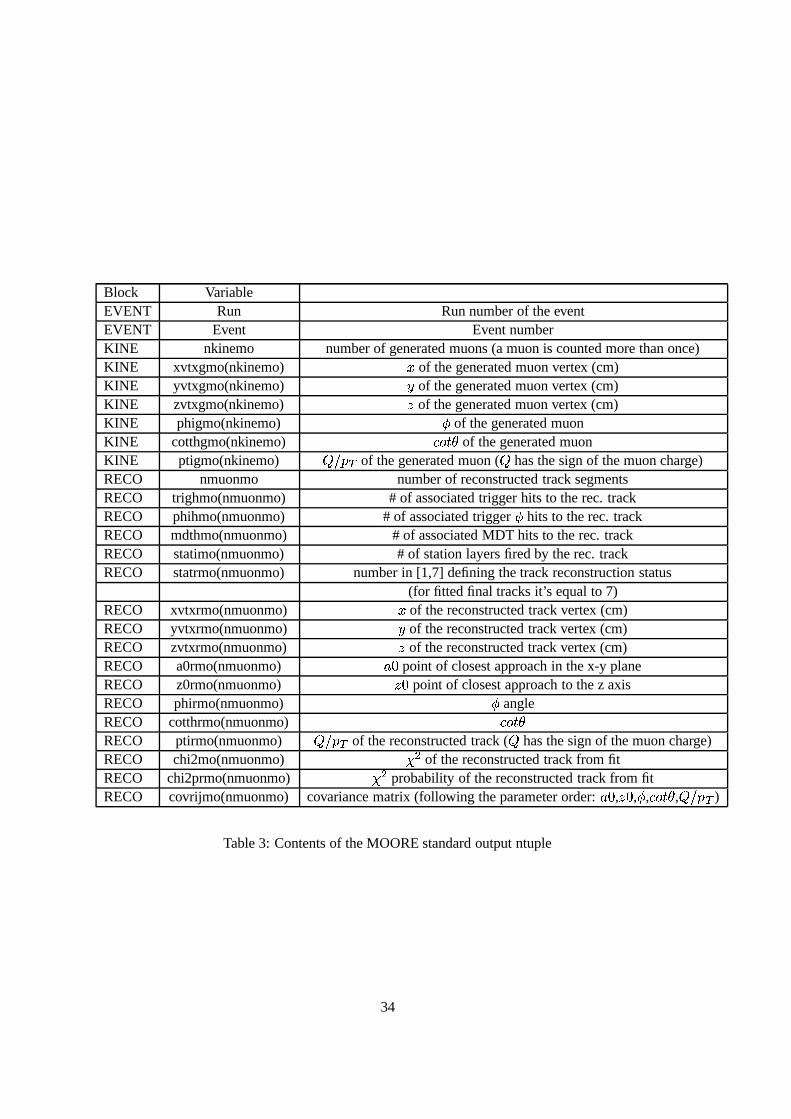
Block VariableEVENT Run Run number of the eventEVENT Event Event numberKINE nkinemo number of generated muons (a muon is counted more than once)KINE xvtxgmo(nkinemo) � of the generated muon vertex (cm)KINE yvtxgmo(nkinemo) � of the generated muon vertex (cm)KINE zvtxgmo(nkinemo) � of the generated muon vertex (cm)KINE phigmo(nkinemo)
�of the generated muon
KINE cotthgmo(nkinemo) � � � of the generated muonKINE ptigmo(nkinemo)
� ��� �of the generated muon (
�has the sign of the muon charge)
RECO nmuonmo number of reconstructed track segmentsRECO trighmo(nmuonmo) # of associated trigger hits to the rec. trackRECO phihmo(nmuonmo) # of associated trigger
�hits to the rec. track
RECO mdthmo(nmuonmo) # of associated MDT hits to the rec. trackRECO statimo(nmuonmo) # of station layers fired by the rec. trackRECO statrmo(nmuonmo) number in [1,7] defining the track reconstruction status
(for fitted final tracks it’s equal to 7)RECO xvtxrmo(nmuonmo) � of the reconstructed track vertex (cm)RECO yvtxrmo(nmuonmo) � of the reconstructed track vertex (cm)RECO zvtxrmo(nmuonmo) � of the reconstructed track vertex (cm)RECO a0rmo(nmuonmo) ��� point of closest approach in the x-y planeRECO z0rmo(nmuonmo) � � point of closest approach to the z axisRECO phirmo(nmuonmo)
�angle
RECO cotthrmo(nmuonmo) � � �RECO ptirmo(nmuonmo)
� ��� �of the reconstructed track (
�has the sign of the muon charge)
RECO chi2mo(nmuonmo) � � of the reconstructed track from fitRECO chi2prmo(nmuonmo) � � probability of the reconstructed track from fitRECO covrijmo(nmuonmo) covariance matrix (following the parameter order: ��� , � � , � , � � � ,
� ��� �)
Table 3: Contents of the MOORE standard output ntuple
34

References
[1] ATLAS Muon Collaboration,ATLAS Muon Spectrometer Technical Design Report, CERN/LHCC 97-22, May 1997
[2] TDR, ATLAS Detector and Physics Performance Technical Design Report, CERN/LHCC 99-14,25 May 1999
[3] iPatRec Web Page,� ��� � � � � ��� ��� � � � � � � � ��� ��� � ��� � +���� �� ��������� � � ��������� �� � � � �� � ���� �� �� ��� � � � � ;R.Clifft, A.Poppleton, IPATREC: inner detector pattern-recognition and track-fitting,ATL-SOFT-94-009; ATO-PN-9.- 14 Jun 1994
[4] MUID Web Page ,� ��� � ��� � � � ����� � � � �� � � �
� ���� � �! � � � � � � ��� � � � � �[5] MuonDetDescription Web Page,
� ��� � � � � �� � � � � � � � ��� � � � � ��� � � � �� � � � � � �"� #� ��� � � � � � � � � � � � �� �� �� � � � � � � � � � �
[6] AMDB Web Page,� ��� � � � � ��� ��� � � � � � � � ��� ��� � ��� � +���� �� �! �� � ���$ �&% �' � ��� �
��� � � � �� � � � � � � �[7] Event Data Model,
� ��� � � � � �� � � � � � � � ��� � � � � ��� � � � �� � � � � � �"� #� ��� � � � � � � � � � ���( �� �
[8] B.Stroustrup, The C++ Programming Language, Addison-Wesley, New Jersey, 1998
[9] P.J.Hendriks, ATLAS Muon Reconstruction from a C++ Perspective, Ph.D. Thesis
[10] MuonBox Web Page� ��� � � � � ��� ��� � � � � � � � ��� ��� � ��� � +���� �� �! �� � � � � ��� � � � � � �! � � � � � � � � �
[11] D. Adams et al. “MOORE as Event Filter in the ATLAS High Level Trigger”, ATL-COM-DAQ-2003-020, ATL-SOFT-2003-008.
[12] E.Meoni, L.Goossens, A. Nairz, E.Richter-Was The medium size fully simulated samples filteredfor 4 particle level muons (part I), ATL-COM-PHYS-2003-018, 2 may 2003.
[13] L.La Rotonda, F.Cerutti, E.MeoniSearch for � � � � : studies with Atlfast-Athenahttp://agenda.cern.ch/askArchive.php?base=agendacateg=a031321id=a031321s1t4/transparencies
[14] ATLANTIS Web Page,� ��� � � � � � � ��� � � �� �� �
[15] ATLAS collaboration: “ATLAS High-Level Triggers, DAQ and DCS Technical Proposal”,CERN/LHCC 2000-17, 2000.
[16] The PESA Software Group (ed. Markus Elsing), “Analysis and Conceptual Design of the HLTSelection Software”, ATLAS-TDAQ-2002-004.
35

[17] S. Armstrong, S. Brandt, A.G. Mello, “RegionSelector for ATLAS HLT”, talks given in the HLTPESA Core Software meetings, August 2002-February 2003.
[18] System test of the ATLAS muon spectrometer in the H8 test area: program for the year 2002, T.Alexopoulos et al., ATL-COM-MUON-2002-007
[19] Calib: a package for MDT calibration studies- User Manual, P. Bagnaia et al., ATL-COM-MUON-2002-004
[20] A. Gordeev et al., ATLAS Internal note ATL-MUON-2000-005, (2000).
[21] � ��� � ��� � � � ��� � � � � �� � � �� ��� �� � � � � � � �! �� � �
� � �! �� � �� � � � ��� � � � � �
36


![EINSTEIN, SCIASCIA, MAJORANA, AMALDI E IL RAPPORTO TRA ... docs... · and E.Amaldi et al.], since many special meetings did recently return to it, while celebrating the centenary](https://img.dokumen.tips/doc/110x75/5e3e79946388f95afe5aad4f/einstein-sciascia-majorana-amaldi-e-il-rapporto-tra-docs-and-eamaldi.jpg)


![Osprey - Campaign 007 - Alexander 334-323BC[Osprey Campaign 007]](https://img.dokumen.tips/doc/110x75/547e40aab4af9f50568b456f/osprey-campaign-007-alexander-334-323bcosprey-campaign-007.jpg)
![007[Papermodels@Emule] [GPM 007] - Me 109E-4 Tropical](https://img.dokumen.tips/doc/110x75/577cc6811a28aba7119e6fc0/007papermodelsemule-gpm-007-me-109e-4-tropical.jpg)


