Embed Size (px)
Citation preview

© AtKisson 2014www.atkisson.com
AtKisson’s Compass & Accelerator Methodology for interdisciplinary climate risk
reduction project managementThursday 4 December 2014
Robert Steele – Systainability Asia
Senior Associate - AtKisson Group
Disaster Risk Management for Sustainable Development (DRM-SD) Capacity Building
© AtKisson 2014www.atkisson.com
Current And Past Clients Include:
Levi Strauss & Co. • Ernst & Young • Nike • Baltic 21 (the 11 nations of Northern Europe) • European Sustainable Development Network
• Brother, Inc. (Japan) • Earth Charter International • Swedish SIDA’s Advanced International Training Programs • United Nations Division
for Sustainable Development Egyptian National Competitiveness Council • Government of Singapore • Greater New Orleans, Inc. • SEIYU
(Japan) • SERDP - Strategic Environmental Research & Development Program (US Government) • Seliger Forum 2010 (Russia) •
Sustainable Fashion Academy • States of Queensland, Victoria, NSW, and South Australia • Stockholm County • Sustainable Seattle •
Heinz Endowments • Toyota • UNEP • UNDP • Nile Basin Initiative • Bank of Indonesia • Volvo Cars
A global network dedicated tosustainability strategy learning, and inspiration
Global Affiliate and Associate Network
© AtKisson, Inc., 2014 www.atkisson.com

© AtKisson 2014www.atkisson.com
Tools, Methods and Processes
to Support Sustainable Development
The AtKisson Sustainability ACCELERATOR Toolkit
Compass Pyramid Amoeba StrateSphere

© AtKisson 2014www.atkisson.com
Goal of the Accelerator toolkit
To engage more and more people, to make more change for sustainability, more effectively, and more quickly.
© AtKisson 2014www.atkisson.com
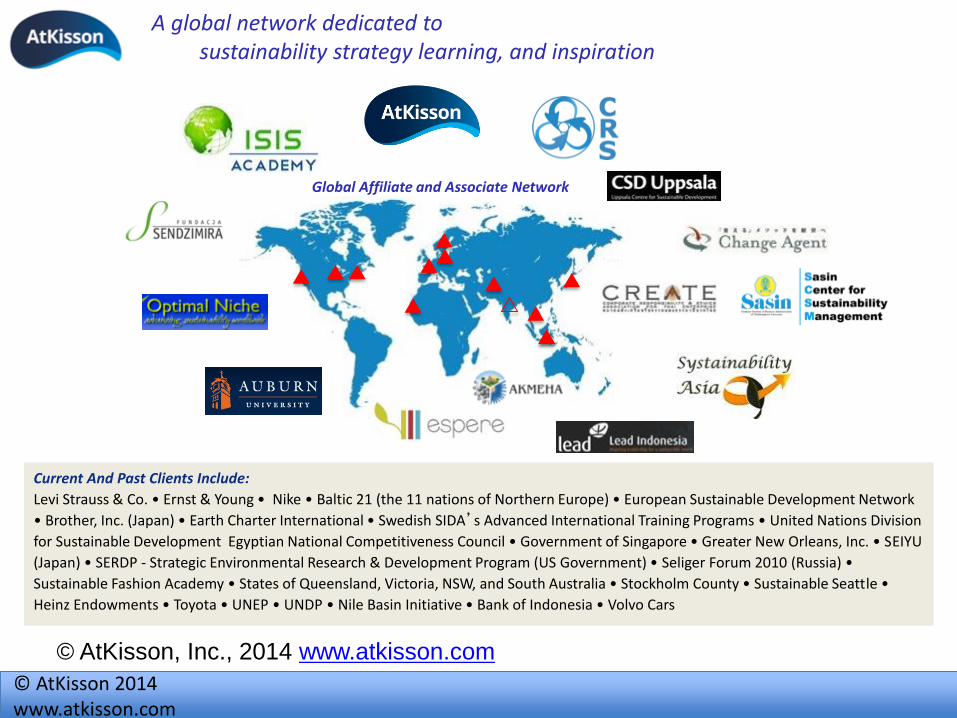
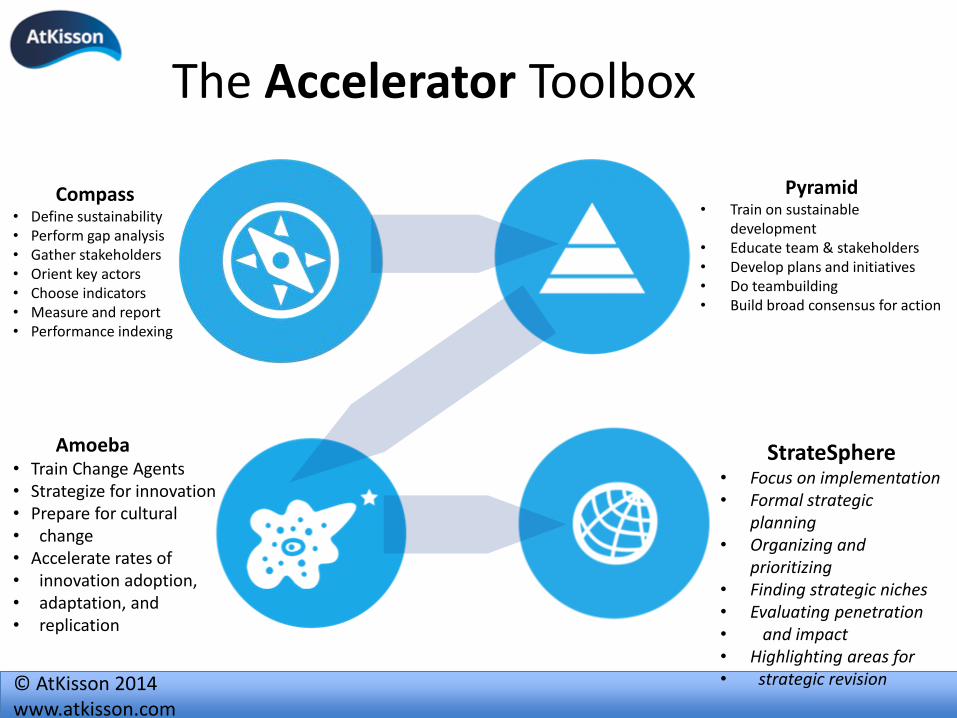
The Accelerator Toolbox
Compass• Define sustainability• Perform gap analysis• Gather stakeholders• Orient key actors• Choose indicators• Measure and report• Performance indexing
Pyramid• Train on sustainable
development• Educate team & stakeholders• Develop plans and initiatives• Do teambuilding• Build broad consensus for action
Amoeba• Train Change Agents• Strategize for innovation• Prepare for cultural• change• Accelerate rates of • innovation adoption,• adaptation, and • replication
StrateSphere• Focus on implementation• Formal strategic
planning• Organizing and
prioritizing• Finding strategic niches• Evaluating penetration• and impact• Highlighting areas for • strategic revision

© AtKisson 2014www.atkisson.com
The Foundational Tool . . The Compass
An Orientation, assessment, planning and collaborative action tool for sustainability and transformation

© AtKisson 2014www.atkisson.com
Assist organisations to do all of the following…
Create better understanding of sustainability
Create a sustainability vision
Manage stakeholders in a sustainability process
Create or manage a set of sustainability indicators
Create an Overall Sustainability Index
Assess the sustainability profile of a company
COMPASS is the foundation of the toolkit

© AtKisson 2014www.atkisson.com
An open and adaptable framework … with guidance on general principles
• The Sustainability Compass is designed to accommodate many kinds of differences: cultural, sectorial, geographic, etc.
• It is also designed to interface well with other common frameworks (e.g. GRI, ISO 26000)
• However, built into the Compass approach a set of core guiding principles about sustainability.

© AtKisson 2014www.atkisson.com
Nature
Society
Wellbeing Economy
The “Economy” Principle: Human societies, communities, and
organizations need functioning economies to provide for their needs
and to support their aspirations.
The “Society Principle”: Social systems should be organized in ways that
promote equity, fairness, resilience, and opportunity for all.
The “Wellbeing Principle”: Human beings have a right to be to be safe, to have access to healthcare, and
to have the opportunity for self-expression, self-development, and a
good quality of life.
The Compass PrinciplesThe “Nature” Principle:
The physical and biological limits of Earth’s ecological systems must be
respected.
Built into the Compass approach is a set of core guiding principles about
sustainability

© AtKisson 2014www.atkisson.com
The “Integration Principle”: All four dimensions of the Sustainability Compass are interconnected in a web of cause-and-effect relationships. They are
interdependent on each other.
• The Compass approach is grounded in the science of system dynamics and in general understanding of how complex systems behave.
• In recognition of this principle, governance and management systems should strive to achieve optimal results across all four Compass Points in an integrated way.

© AtKisson 2014www.atkisson.com
The Compass Points in Practice➤N = Nature =
Environmental impact, resource use, waste, ecosystems and habitat, water, energy, climate change
➤E = Economy =Production, consumption, employment and work, money, investment, debt, business, innovation
➤S = Society =Governance, equity, transparency, security, culture, institutional management, levels of trust
➤W = Wellbeing =Health, education, self-expression, happiness, relationships, family, creativity, quality of life
It helps us think about issues from many different perspectives

© AtKisson 2014www.atkisson.com
Action
Strategy
Innovation
Systems Analysis
Indicators and Information
Understanding Systems
Understanding Sustainability
The Sustainable Development Planning & Action Cycle
Monitoring and
Adaptation
Defining Your Vision, Goals, and Framework
INDICATORS: Assess where you are, and where you are headed
SYSTEMS: Figure out why you are headed there, and where you can effectively change direction
INNOVATION: Identify what changes to make for sustainability
STRATEGY: Plan how to succeed in making change
Then commit to ...
1
2
3
4
5
6
7
89
© AtKisson 2014www.atkisson.com
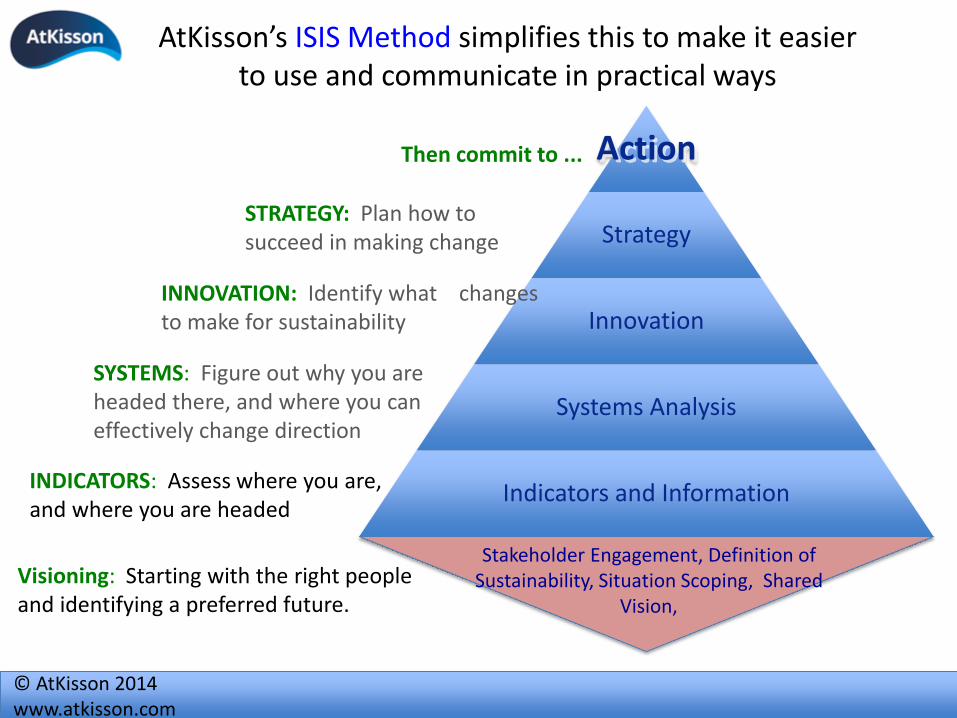
AtKisson’s ISIS Method simplifies this to make it easier to use and communicate in practical ways
INDICATORS: Assess where you are, and where you are headed
Action
Strategy
Innovation
Systems Analysis
Indicators and Information
SYSTEMS: Figure out why you are headed there, and where you can effectively change direction
STRATEGY: Plan how to succeed in making change
INNOVATION: Identify what changes to make for sustainability
Then commit to ...
Stakeholder Engagement, Definition of Sustainability, Situation Scoping, Shared
Vision,
Visioning: Starting with the right people and identifying a preferred future.

© AtKisson 2014www.atkisson.com
Intent of the ISIS Method:
• Guide and orient you throughout the sustainability action cycle
• Help you integrate other tools and processes in a coherent sequence
• Accelerate the process by providing a sharable road map
• Focus efforts at the points of greatest impact and leverage
© AtKisson 2014www.atkisson.com
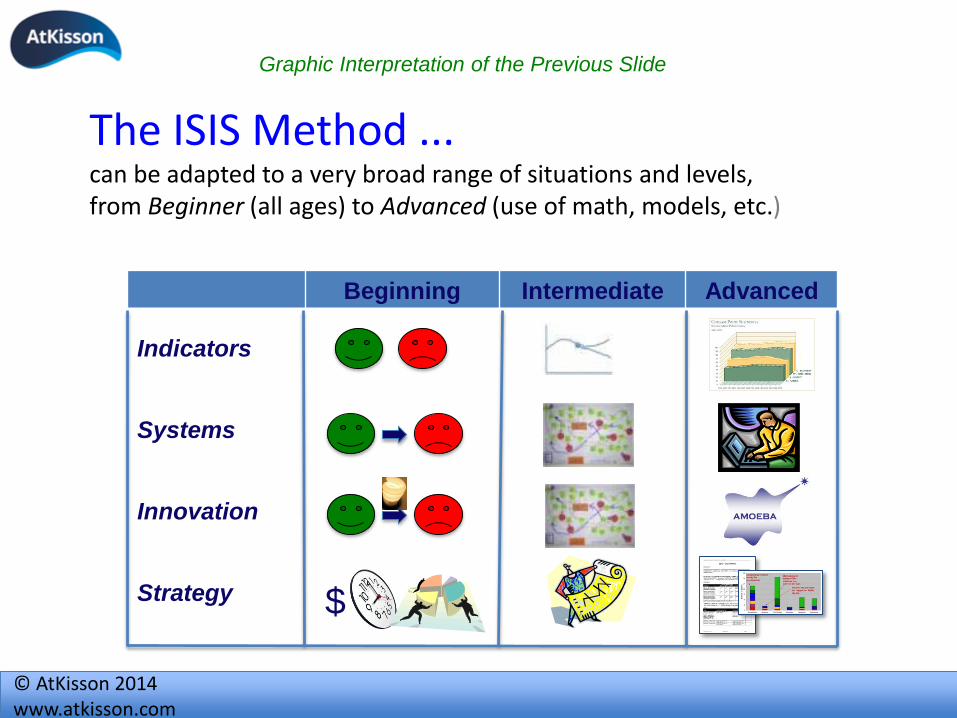
The ISIS Method ...can be adapted to a very broad range of situations and levels,from Beginner (all ages) to Advanced (use of math, models, etc.)
Indicators
Systems
Innovation
Strategy $
Beginning Intermediate Advanced
Graphic Interpretation of the Previous Slide
Indicators
Systems
Innovation
Strategy $

© AtKisson 2014www.atkisson.com
© AtKisson 2014www.atkisson.com
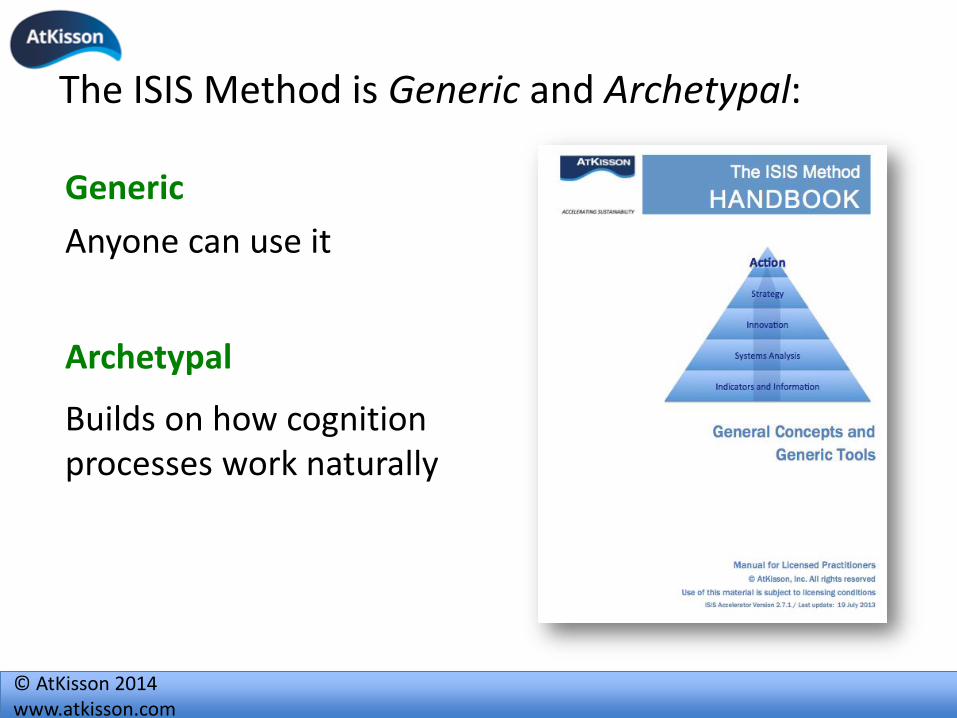
The ISIS Method is Generic and Archetypal:
Generic
Anyone can use it
Archetypal
Builds on how cognition processes work naturally
© AtKisson 2014www.atkisson.com
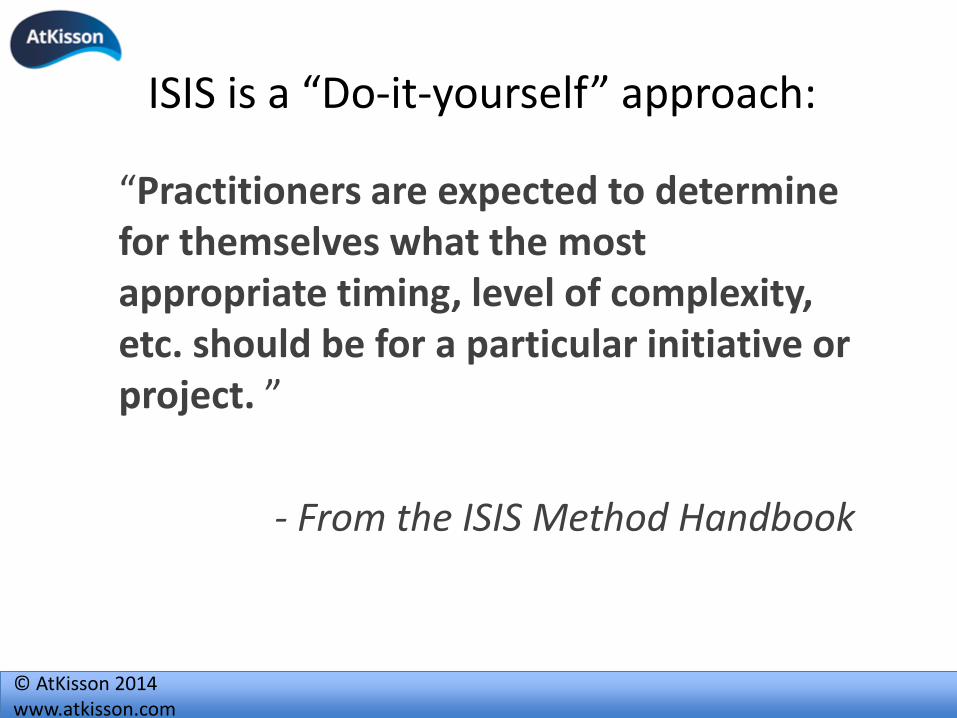
ISIS is a “Do-it-yourself” approach:
“Practitioners are expected to determine for themselves what the most appropriate timing, level of complexity, etc. should be for a particular initiative or project. ”
- From the ISIS Method Handbook

© AtKisson 2014www.atkisson.com
VISIS is a generic methodology
It involves the sequence of working with Vision > Indicators > Systems > Innovation > Strategy
Anybody can use and adapt it
Accelerator: Compass, Pyramid, Amoeba are specific tools (“Accelerator”)
They require some introduction, training and capacity building
We offer licenses to use them and adapt them
Proprietary ToolsGeneric Methodology
© AtKisson 2014www.atkisson.com
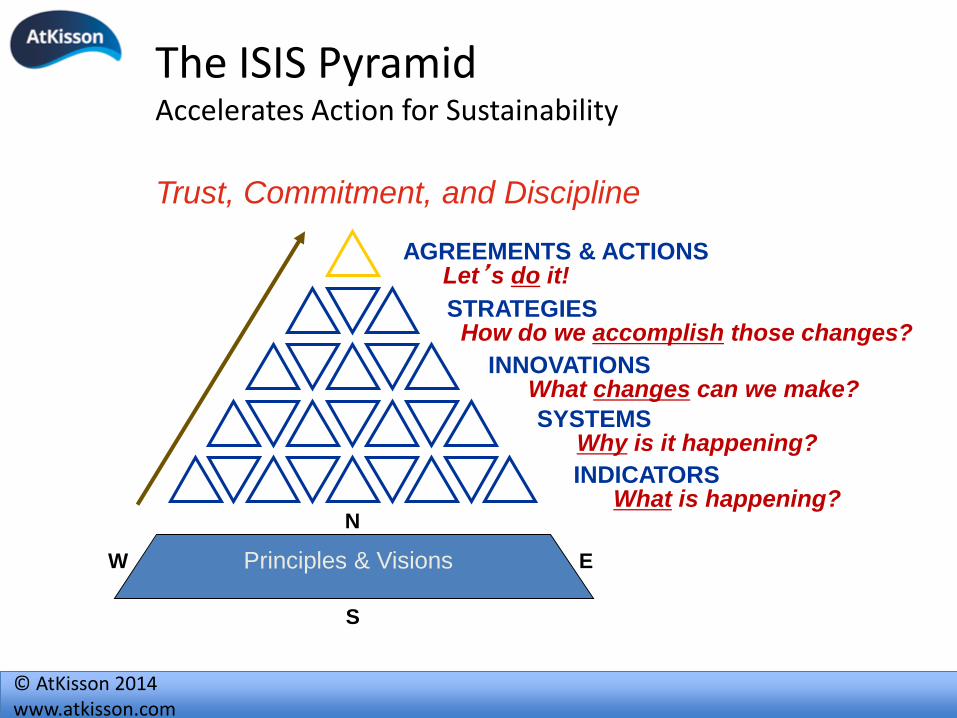
SYSTEMS
INNOVATIONS
STRATEGIES
AGREEMENTS & ACTIONS
What is happening?
What changes can we make?
How do we accomplish those changes?
Let’s do it!
Principles & Visions
S
W E
N
Why is it happening?
INDICATORS
The ISIS Pyramid Accelerates Action for Sustainability
Trust, Commitment, and Discipline

© AtKisson 2014www.atkisson.com
1 2
2 Pyramid... helps groups move from analysis to action, while building learning and consensus
Compass• Define sustainability• Perform gap analysis• Gather stakeholders• Orient key actors• Choose indicators• Measure and report• Performance indexing
Pyramid• Train on sustainable
development• Educate team & stakeholders• Develop plans and initiatives• Do teambuilding• Build broad consensus for action

© AtKisson 2014www.atkisson.com
PyramidA Tool for Collaborative Strategic Planning, Initiative Design, Professional Training, and Educational SD Programming
A workshop process that combines …
• Understanding sustainability
• Selecting and interpreting indicators
• Basic systems analysis
• Innovating for change
• Strategic planning for sustainable development
• Teambuilding Pyramid has been used by hundredsof groups around the world
© AtKisson 2014www.atkisson.com
12
3
3
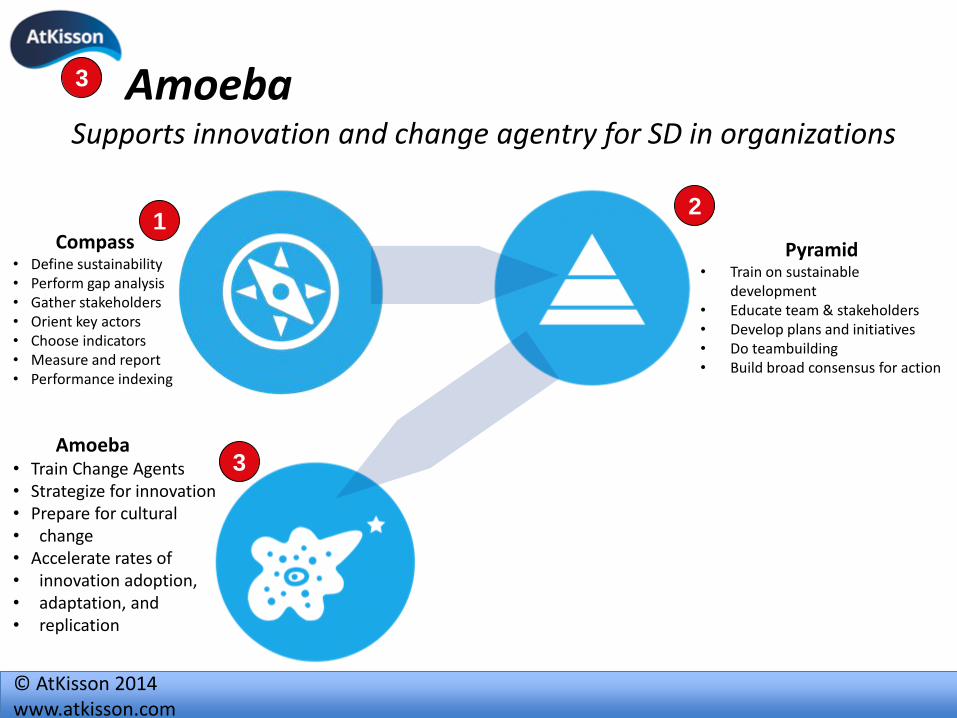
AmoebaSupports innovation and change agentry for SD in organizations
Compass• Define sustainability• Perform gap analysis• Gather stakeholders• Orient key actors• Choose indicators• Measure and report• Performance indexing
Pyramid• Train on sustainable
development• Educate team & stakeholders• Develop plans and initiatives• Do teambuilding• Build broad consensus for action
Amoeba• Train Change Agents• Strategize for innovation• Prepare for cultural• change• Accelerate rates of • innovation adoption,• adaptation, and • replication

© AtKisson 2014www.atkisson.com
• Map cultural systems
• Identify the points of leverage
• Develop diffusion strategies
• Make sustainability ideas and initiatives more attractive
• Train the “Change Agents”
AmoebaRole-Playing Training Game and Planning Tool

© AtKisson 2014www.atkisson.com
AMOEBA: Training for Culture Change
Detailed manuals
make it possible
for any
experienced
facilitator to run
many Accelerator
applications
without additional
training

© AtKisson 2014www.atkisson.com
StrateSphereSupports integrated strategic planning and performance evaluation
Define sustainability
Perform gap analysis
Gather stakeholders
Orient key actors
Choose indicators
Measure and report
Performance indexing
1Train on sustainable development
Educate team & stakeholders
Develop plans and initiatives
Do teambuilding
Build broad consensus
for action
2
Train Change Agents
Strategize for innovation
Prepare for cultural
change
Accelerate rates of
innovation adoption,
adaptation, and
replication
Focus on implementation
Formal strategic planning
Organizing and prioritizing
Finding strategic niches
Evaluating penetration
and impact
Highlighting areas for
strategic revision
4
4
3

© AtKisson 2014www.atkisson.com
• Go from ideas to fully developed strategic plans
• Clarify your underlying “Theory of Change”
• Evaluate strategic capacity
• Identify strategic niches
StrateSphereTools and Templates for Formal Planning
Overall Scores for Success Factors
0.0 1.0 2.0 3.0 4.0 5.0
Skillbase
Leadership
Cultural Strategy
Political Strategy
Timelines
Resource Mgmt
Strategic Links
Strategic Reflection
OVERALL AVERAGE

© AtKisson 2014www.atkisson.com
A Short Compass Exercise
Planning for Community Climate Resilience and disaster risk management & response

© AtKisson 2014www.atkisson.com
Flood Disaster Risk Management Sustainability Plan
Scenario Goal: Develop the foundational situational scoping (analysis) for a long-term proactive flood risk reduction & response management plan.
This analysis will be incorporate into the plan project log-frame

© AtKisson 2014www.atkisson.com
Pyramid Level 0 – Preparing the Ground
Who do we involve in the process?What do we mean by sustainability? What are out priorities?
PRINCIPLES
“OTHER”
VISION, GOALS, OUTCOMES
DEFINITION OF SUSTAINABILITY
WHO DO WE INVOLVE IN THIS PROCESS?
WHAT ARE OUR MATERIAL ISSUES?

© AtKisson 2014www.atkisson.com
Level 0 Tasks:
1. Identify which government agencies and other stakeholder groups that should be involved in this process. - Document these for each Compass Point on the Compass Template
2. In 1-3 sentences. Define what an effective integrated flood prevention & management plan would need to look like that reinforces the goals of sustainable development. Record at the top of your Compass Flip chart paper.
3. For each of the four Compass directions, identify the top 4-5 priority material issues that will provide the foundational focus of this integrated management plan.
31
Material issues include those topics or issues that have a direct or
indirect impact on your ability to help or hinder the aheivement of
goals and objectives of your integrated flood management plan for all
stakeholders and society at large.

© AtKisson 2014www.atkisson.com
Compass Issue Identification
Nature - what
Environmental issues &
desired future outcomes
can you identify in relation
to community climate
disaster management?
Economy - what Economic
issues & desired future
outcomes can you identify
in relation to community
climate disaster
management?
Wellbeing - what Individual
Human Wellbeing issues &
desired future outcomes
can you identify in relation to
community climate disaster
management?
Society - what Community
- Social – Cultural issues &
desired future outcomes
can you identify in relation
to community climate
disaster management?

© AtKisson 2014www.atkisson.com
Task: Prioritizing Issue Areas of Focus
1. Next, for each Compass group brainstorm some key questions that we should be asking ourselves and our stakeholders, which can guide our research towards developing “good” Indicators, Strategies and Plans.
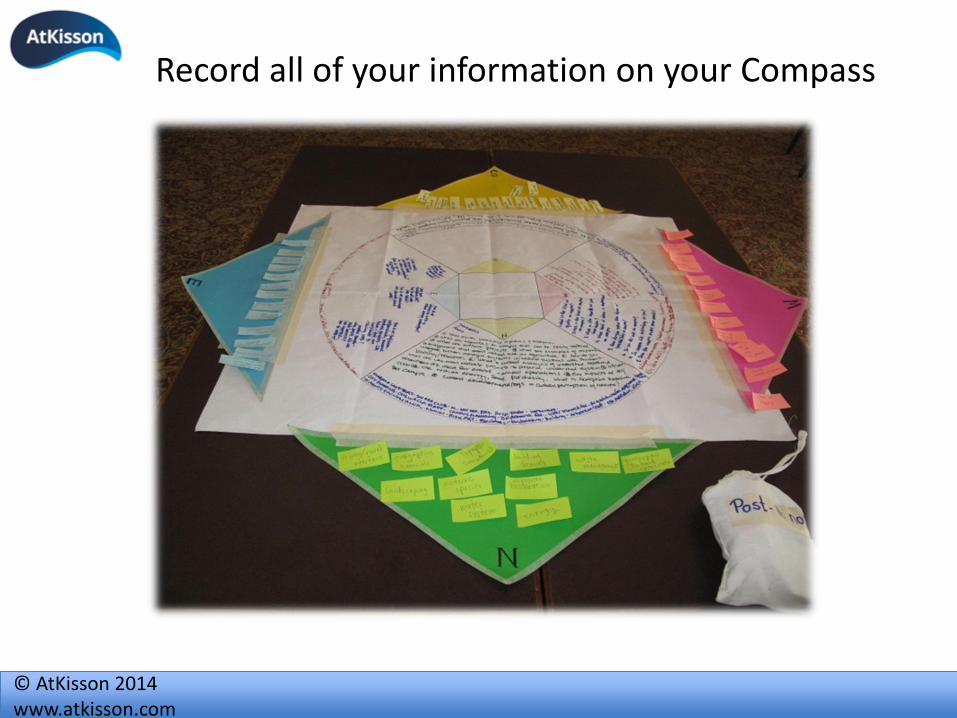
• Write your answers directly on the Compass template in
your Compass Point (in the space provided)
• Share your questions with the other group members from
the other Compass Points;

© AtKisson 2014www.atkisson.com
Task 6: Desired Future Outcomes
Identify the desired Future Outcomes you would like to see happen with regards to each community Compass Issue indicating a strong, resilient and sustainable community.
Example:
Nature Issue: Natural ecological buffer zones along key waterways.
Nature Outcome: All key waterways have sufficient (as determined by science) natural vegetation buffer zones on both sides of the waterway, which mitigate water runoff and lessen exposure of communities to food hazard.
© AtKisson 2014www.atkisson.com
Record all of your information on your Compass

© AtKisson 2014www.atkisson.com
Pyramid Level 1: Indicators Information about critical & long-term trends
INDICATORS
What is happening? What are the trends?
Where are we headed?

© AtKisson 2014www.atkisson.com
Sometimes we can see what’s happening with our own eyes ...Sometimes we can see what’s happening with our own eyes ...
Flying through the “Asian Brown Cloud,” flight to Kota Kinabalu, 24 Mar 2009 – Photo by Alan AtKisson

© AtKisson 2014www.atkisson.com
... and sometimes we can’t
View from the ground, Kota Kinabalu, 24 Mar 2009
© AtKisson 2014www.atkisson.com
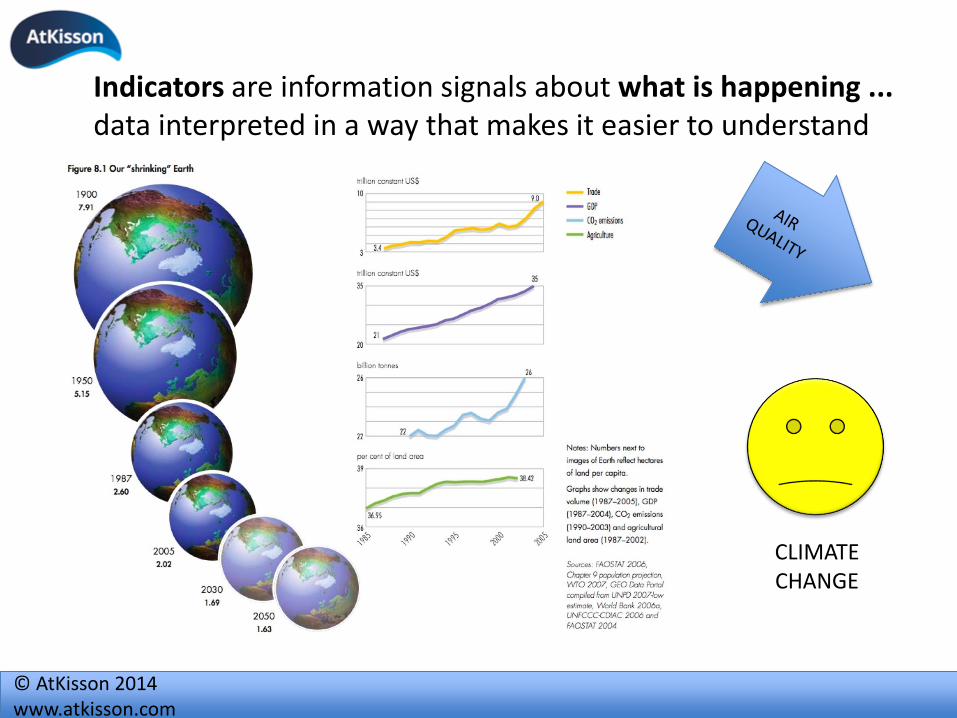
Indicators are information signals about what is happening ... data interpreted in a way that makes it easier to understand
CLIMATECHANGE

© AtKisson 2014www.atkisson.com
Level 1 Indicator Tasks Summary
1. Review your priority materiality issues and desired future outcomes.
2. Select one “good” Indicator that can provide the necessary data for each issue / outcome set.
Note: Remember who is the stakeholder group who needs to engage with this indicator
(feedback response)
3. Develop a Behavior over Time Trend graph
4. Record your information on the Post-it Notes provided.

© AtKisson 2014www.atkisson.com
Instructions:
1. Identify 1 good Sustainability Indicator for each of your
priority desired future outcomes for each Compass point.
2. Make a general trend graph of what your feel is the
direction and rate of change of each indicator over the
past 10 years.
Past Present
Improving
Stay the same
Getting worse
Level 1 Task: Choosing Sustainability
Indicators
© AtKisson 2014www.atkisson.com
Level 1 Task: Choosing Sustainability Indicators
Remember: Indicators are measurements and sources
of feedback to determine current status and changes in
conditions that are relevant to your goals and objectives.
(e.g. ensuring Sustainability of our company /
organisation)
Make sure to think about who will be engaged with this
information (i.e. which stakeholders will be interested in
this data?)

© AtKisson 2014www.atkisson.com
Relevant . . . i.e. directly connected to the issues you are concerned with
Measurable . . . objective or subjective, qualitative or quantitative
Reliable . . . i.e. you can trust the data
Understandable . . . i.e. the average person can "get it"
Clear in Direction . . . it is obvious which direction is “good”
Responsive . . . they react when you make change
Linked . . . causal linkages with other indicators across sectors
Seven Criteria of a Good Sustainability Indicator
© AtKisson 2014www.atkisson.com
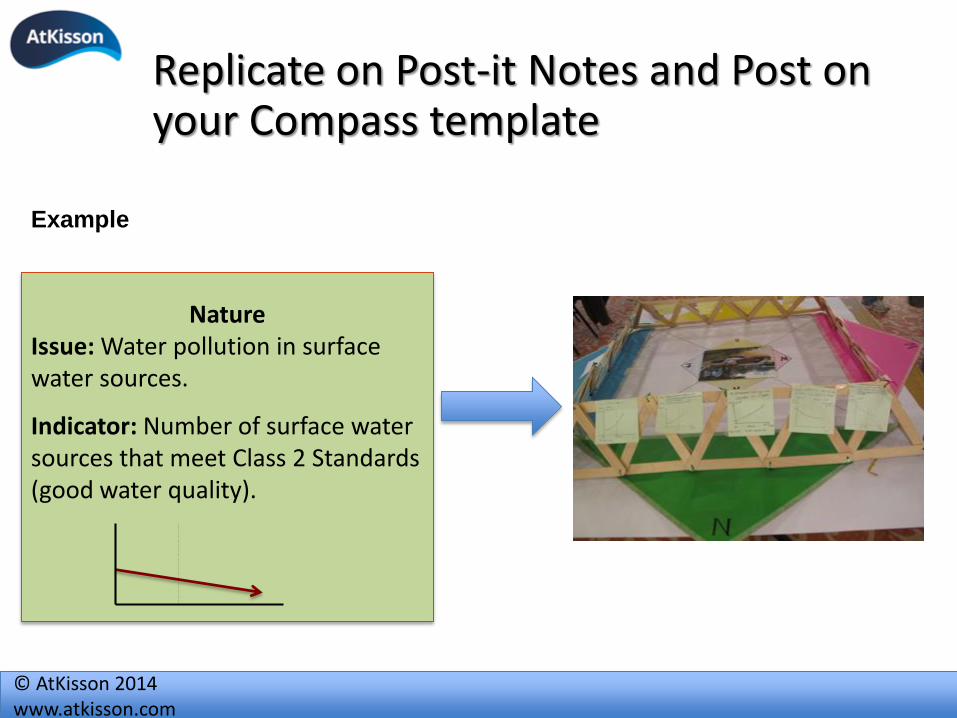
Replicate on Post-it Notes and Post on your Compass template
NatureIssue: Water pollution in surface water sources.
Indicator: Number of surface water sources that meet Class 2 Standards (good water quality).
Example
© AtKisson 2014www.atkisson.com
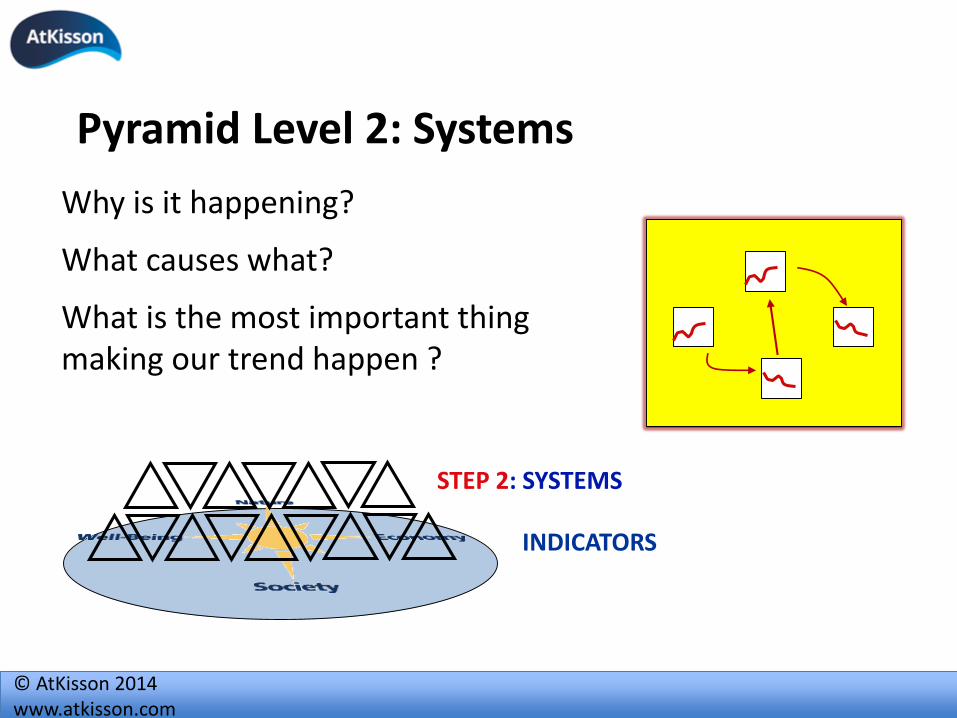
Pyramid Level 2: Systems
Why is it happening?
What causes what?
What is the most important thing making our trend happen ?
STEP 2: SYSTEMS
INDICATORS

© AtKisson 2014www.atkisson.com
Step 1: Identify Cross Systems Linkages
1. Discuss with your group the key linkages that you can find between the different Compass Point Indicators. Share your opinions and findings with the others.
1. Use your markers to draw arrows to draw the links between different indicators.
2. Identify hubs or concentrations of system links (high impact leverage points)
Pyramid Level 2: Indentifying Linkages
© AtKisson 2014www.atkisson.com
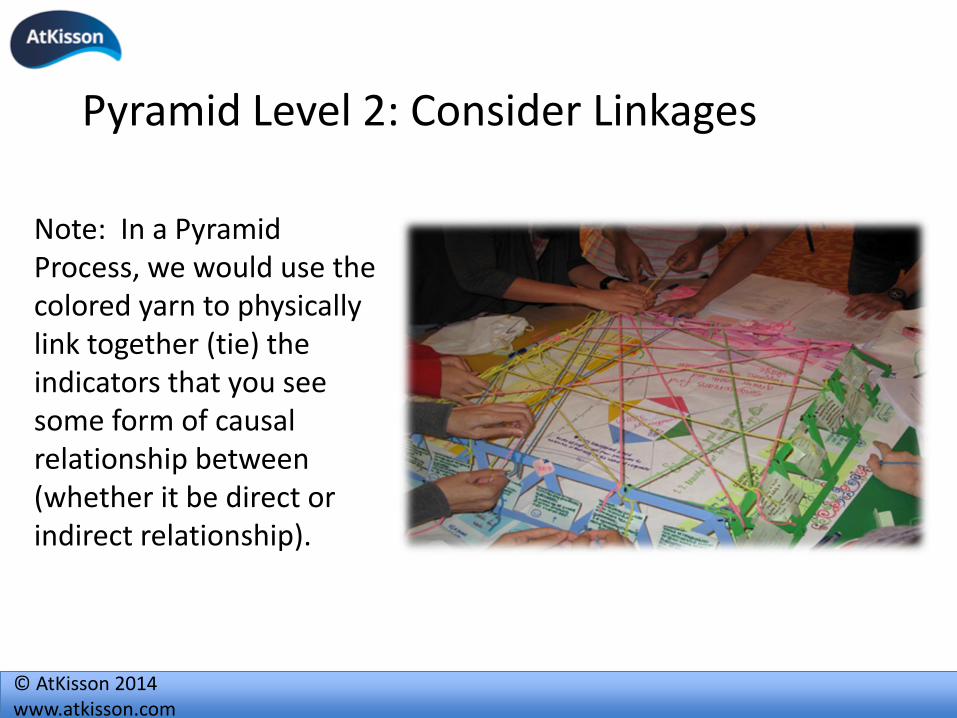
Pyramid Level 2: Consider Linkages
Note: In a Pyramid Process, we would use the colored yarn to physically link together (tie) the indicators that you see some form of causal relationship between (whether it be direct or indirect relationship).
© AtKisson 2014www.atkisson.com
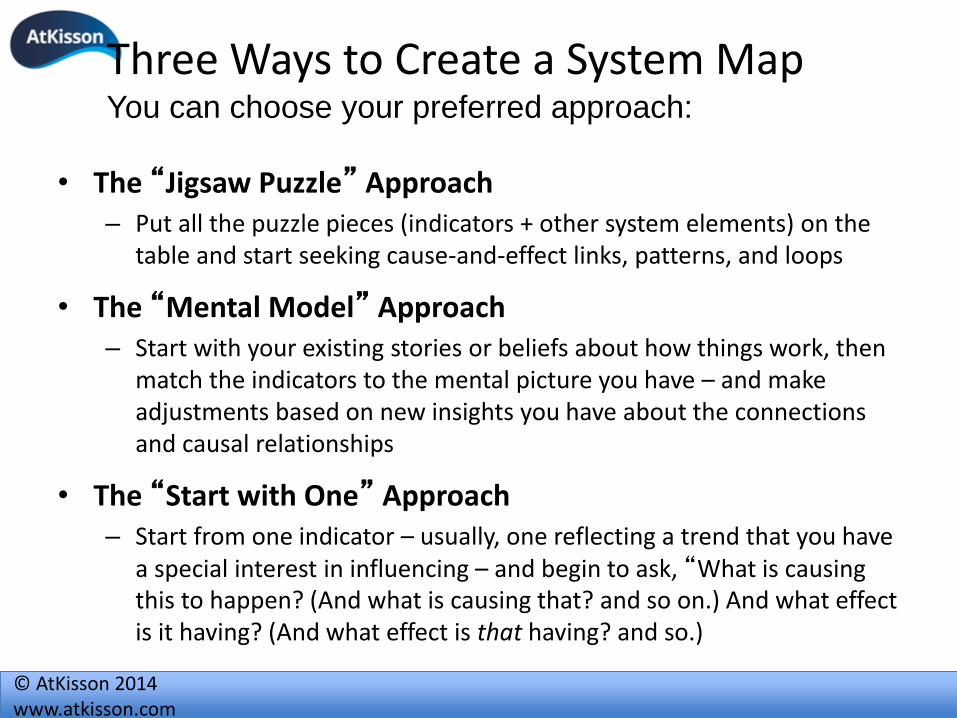
Three Ways to Create a System MapYou can choose your preferred approach:
• The “Jigsaw Puzzle” Approach– Put all the puzzle pieces (indicators + other system elements) on the
table and start seeking cause-and-effect links, patterns, and loops
• The “Mental Model” Approach– Start with your existing stories or beliefs about how things work, then
match the indicators to the mental picture you have – and make adjustments based on new insights you have about the connections and causal relationships
• The “Start with One” Approach– Start from one indicator – usually, one reflecting a trend that you have
a special interest in influencing – and begin to ask, “What is causing this to happen? (And what is causing that? and so on.) And what effect is it having? (And what effect is that having? and so.)

© AtKisson 2014www.atkisson.com
Systems Diagramming Exercise
Identify one or more important feedback loops that can have implications for long-term sustainability in your company
Step 1:

© AtKisson 2014www.atkisson.com
Systems Diagramming Example
KEY INDICATOR
Drivers / Causes Responses/ Effects
1. Start with one key Indicator from your Level 1 Compass Indicators and put it in the center of your paper.

© AtKisson 2014www.atkisson.com
CAUSE
CAUSE
EFFECT
EFFECTCAUSE
EFFECTCAUSE
Step 1 - Systems Diagramming
KEY INDICATOR
Drivers / Causes Responses/ Effects
2. Start asking “What causes that to happen?” (drivers) and “What impacts does that cause?” (responses)
Note: remember to try and link to trends in all 4 Compass Points

© AtKisson 2014www.atkisson.com
CAUSE
CAUSE
CAUSE CAUSE
CAUSE
EFFECT
EFFECT
EFFECT
EFFECTCAUSE
CAUSE
EFFECT
CAUSE
EFFECTCAUSE
Step 2 - Systems Diagramming
KEY INDICATOR
Drivers / Causes Responses/ Effects
Elaborate out to 2-3 layers away from the central trend – e.g., cause > cause > cause > key indicator > effect > effect > effect
© AtKisson 2014www.atkisson.com
CAUSE
CAUSE
CAUSE CAUSE
CAUSE
EFFECT
EFFECT
EFFECT
EFFECT
CAUSE
CAUSE
EFFECT
CAUSE
EFFECTCAUSE
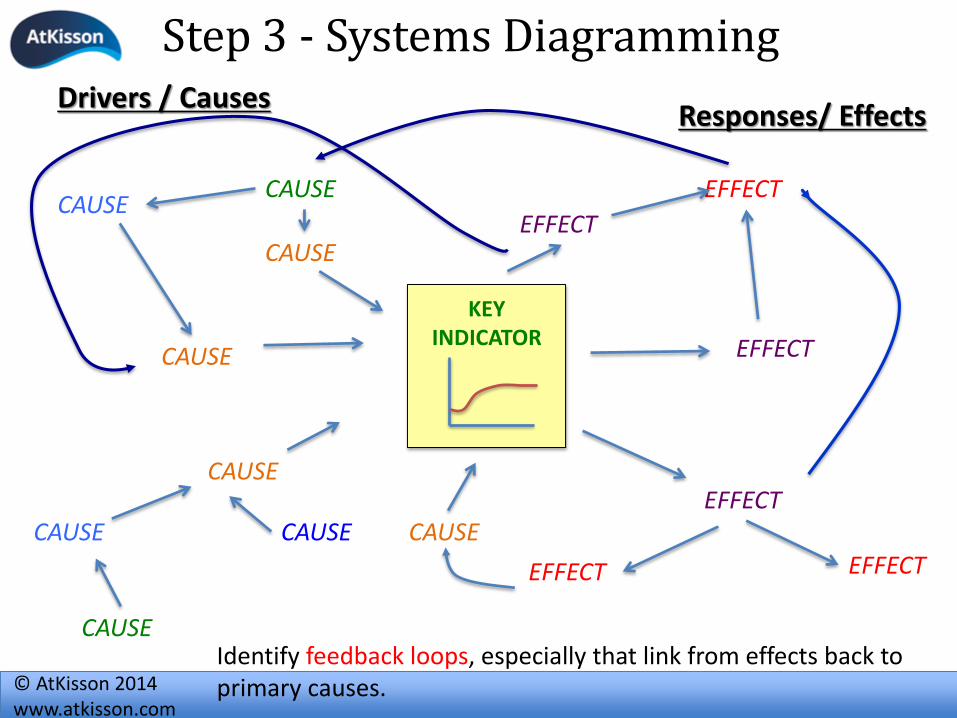
Step 3 - Systems DiagrammingDrivers / Causes
Responses/ Effects
Identify feedback loops, especially that link from effects back to primary causes.
KEY INDICATOR

© AtKisson 2014www.atkisson.com
Traffic
Time it take to get to
work/ home
Transport choice
# of people who
drive to work
Government
Transport Policy
# & type of transport
related policies
promoting Green
options
Pollution
Air pollution level in
ppm
Stress
# of reported stress
related illnesses
Quality of Life
Perception of QoL or
Standard of Living
Productivity
Efficiency of
production (value of
inputs vs outputs)
Happiness
Level of
satisfactionEconomic
Incentives
Amt. and number of
incentives to purchase
cars
Transport Options
# and type of transport
options available
Road Capacity
Car density per
roadway
Car Ownership
Car ownership per
capita
Health
Total number of
patient visits in
city hospitals
Economic Health
GDP growth rate
Drivers / Causes Responses/ Effects

© AtKisson 2014www.atkisson.com
55
Group models developed for the Transcarpathian Tisa basin: the causal-loop-diagram (1) of a concept of flood preparedness that links coping ability (short-term measure in the case of a hazard event) and adaptive capacity (long-term preparedness). The pluses (?) and minuses (-) indicate the polarity that the relationship is assumed to have (thanks to Piotr Magnszweski for contributing to the model structuring)
Example use of Causal Loop Systems Diagramming – flood preparedness

© AtKisson 2014www.atkisson.com
Step 1: Construct a System Map
Each Compass Group…
1. Select the most important issue/ indicator / trend
from you four, especially looking at linkages with
other Compass Point indicators
2. For your System and main Indicator, come up
with a System Change Goal (what do you want to
change?)
3. Build a simple systems map that links your
indicators with others (both from your own
indicators and those from other Compass Groups

© AtKisson 2014www.atkisson.com
Level 2 System Analysis
Leverage Points
Figure out how trends,decision-making, and information flows are linked together in multiple cause-effect relationships
Use that analysis toidentify the best leveragepoints for introducingchange
Step 1: Step 2:

© AtKisson 2014www.atkisson.com
Finding the Leverage Points for system interventionLeverage points are places in your system map where you can
intervene with an projects, program, technology, policy, etc. that will
change the system relationships towards the direction that you want
and be reflected in your main Indicator.

© AtKisson 2014www.atkisson.com
Identifying key Leverage Points for Intervention
59
= Leverage Point

© AtKisson 2014www.atkisson.com
Step 3: Compass Group System Presentations
Each Compass Team …
Identifies their central indicator and what is the goal you want to achieve
Identifies the main feedback loops and tells the story.
Identify the key leverage points for each loop.

© AtKisson 2014www.atkisson.com
Construction of Pyramid Level 2 Systems

© AtKisson 2014www.atkisson.com
INDICATORS
SYSTEMS
What kinds of change would be most
effective ... for the whole system?
STEP 3: INNOVATIONS
Pyramid Lite Level 3: Innovation

© AtKisson 2014www.atkisson.com
Innovation: What we do at the leverage
points

© AtKisson 2014www.atkisson.com
New targets and standards
New materials and technologies
New controls and feedback mechanisms
New information flows to new people
New rules, policies, incentives
New forms of organization, cooperation, collaboration
New models, frameworks, environments
New overarching goals and visions
New knowledge, skills and capacities
New mindsets and paradigms
A NEW WILLINGESS TO TRY NEW THINGS
Adapted from “Leverage Points: Ways to Intervene in a System,” by Donella H. Meadows. Available from www.sustainer.org

© AtKisson 2014www.atkisson.com
PYRAMID LEVEL 4 – STRATEGY
STEP 4: STRATEGIES
INDICATORS
SYSTEMS
INNOVATIONS
How do we get buy in for the idea?
How do we effectively implement our ideas?

© AtKisson 2014www.atkisson.com
N - O > CC, or ...
Perceived
Value of the
NEW Idea
Perceived
Value of the
OLD Way
Perceived
COST of the
CHANGE
The Three “Avenues for Action”
The Gilman’s Equation for Innovation Adoption

© AtKisson 2014www.atkisson.com
Pyramid Level 5 - The Capstone
Agreement
Making the Connection to the Real World
Catalyzing Community Climate Resilience

© AtKisson 2014www.atkisson.com
Compass Accelerate in Practice

© AtKisson 2014www.atkisson.com
Sustainability Indicator ProjectsOrlando: Healthy Community Initiative
Compass Index
Pyramid Strategy
Expert Forums on Linkages
Sustainability Awards Program
Results: Local funders use results to set funding priorities
Political leaders use to focus attention on system drivers

© AtKisson 2014www.atkisson.com
Sustainability Indicator Projects
Sustainable Pittsburgh ...
Regional Outreach Strategy
Compass Report and Community Indicators Handbook
Source: http://www.sustainablepittsburgh.org/
Results:Contributed to Launch of Smart Growth Partnership
Pyramid Workshop to Train Partnership Founders in S.D. and Generate Strategic Options

© AtKisson 2014www.atkisson.com
Sustainability Indicator Projects New Orleans/SE Louisiana: Top 10 by 2010
Process
Regional multi-stakeholder dialogue process
Compass-based indicator system
Pyramid-based strategic
planning (behind the scenes)
Results to Date:Direct impact on regional economic development strategy and foundation giving as well as new insights on key challenges facing region ... and the leverage points to address them

© AtKisson 2014www.atkisson.com
Sustainable Phuket InitiativeDeveloping Sustainability Indicator Framework
Phuket Sustainability Indicator Report was presented to the Phuket Governor on 22 November 2013….
Phuket Sustainability Indicator Report 2013
Why this issue important for Phuket’s Sustainability?
Tourism is one of two mainstays of the Phuket economy,
and almost all tourists come to Phuket for its famous
white sand beaches and clean, aqua blue marine waters.
These natural treasures are directly influenced by coastal
development planning, pollution, construction, zoning
law enforcement, business licensing, density of vendors,
and litter management, to name but a few. If Phuket’s
beaches are consumed by litter, extensions of restaurants
and bungalows, lounge chairs and umbrellas, vendors and
jet skis, the accumulative effect will soon overwhelm
nature’s resilience mechanisms. It will not be too long
before Phuket will lose the very attributes that its success
has been built upon. Not to say that tourism will stop, but
most likely the outdoor activity and nature related
tourism will be replaced by another type of tourism that
we all do not want.
What is the Trend?
The Phuket Marine Biological Center has implemented
a coastal environment monitoring program for 23
stations along the coastline of Phuket. Some principal
parameters collected for every 2 months include salinity,
temperature, pH, dissolve oxygen, suspended sediment,
nutrients and total coliform bacteria. The result found
that Marine water quality was generally found in good
condition, except in some stations and during certain
period of time that the quality was in fair or poor
conditions.
Possible Sources of Data
Department of Marine and Coastal Resources: Phuket
Marine Biological Center, Ministry of Natural
Resources and Environment: Pollution Control Department
Nature Aspect 1 Coastal Management / Sustainable Beach Program
The Challenge:
Phuket’s coastal marine environment,
particularly its famous beaches and
water quality are in a state of
degradation and decline.
Our Goal:
Phuket’s coastal environment enjoys
continuous excellent water quality, with clean beaches that exhibit a natural
condition to a large extent.
Proposed Strategy:
Empower and enable community
volunteer groups to take ownership and
responsibility for beach conditions and
water quality monitoring, and
education for fishing fleet on waste
proper management.
Sustainability Indicators:
Marine Water Quality Index (BOD,
PH, Fecal Coliform)
Beach Quality Index (5 star system)

© AtKisson 2014www.atkisson.com
Sustainable Community Development
Nine work groups met three times to develop “visions, goals, and metrics
All work groups brought together for intensive one-day working session using Pyramid
Results: Rough draft of indicator report Estimate of long-term trends Rough draft systems analysis 100s of ideas for innovation Consensus list of top 25
initiatives
Community Development of
Multi-sector stakeholders
Molby, Sweden

© AtKisson 2014www.atkisson.com
The U.S. Army Installation Sustainability Program
Individual bases (e.g. Fort Lewis) pursuing 25-year sustainability initiatives
Bases and base commanders leading surrounding communities and other federal agencies to adopt innovations(e.g. energy, water, community involvement, smart growth)
Installation Sustainability Program won Presidential Award in 2003
Base Stakeholders Brainstorming Sustainability Indicators
Fort Lewis Army Base, USA

© AtKisson 2014www.atkisson.com
Regional Policy Making
Eleven Baltic nations in a cooperative initiative for regional sustainable development
Mandate from the Prime Minister level
Driven through government ministries, but multi-stakeholder in character and governance
Seeking a new strategic mandate for 2004-2010
Adopted ISIS / Pyramid to develop a new strategy
Process to culiminate with Prime Ministers summit in June 2004 Baltic Countries’ Environmental
Ministers, The Riga Proposal: Agenda 21 for the Baltic Sea Region

© AtKisson 2014www.atkisson.com
Latvia, Ministry of Spatial PlanningTYPE OF ORGANIZATION:
National government
WHO PARTICIPATED:
Representatives from nearly all ministries + stakeholders from sectors (business, academia, NGOs, etc.)
PURPOSE:
Develop new long-term, sustainability-oriented policies for land use
RESULTS:
New set of spatial planning principles developed and passed into legislation
The Capstone Agreement from the Latvia pyramid, with four new sustainability principles for spatial planning. These principles were included in legislation prepared the following week.

© AtKisson 2014www.atkisson.com
Corporate Sustainability with Indonesia Business Sectors
• GOAL: promote sustainability scheme to business community and assist the companies to have long term commitment toward sustainability, measurable progress, and more accountable sustainability report. PT ANTMA tbk (mining industry)
INCO Mining tbk
Losari Eco-Resort & Spa
Indah Kiat Pulp & Paper
Indonesia Power
Bank Negara Indonesia (BNI)
Result: All companies were able to develop their own specifically tailored Sustainability Indicators to support companies’sustainability performance.

© AtKisson 2014www.atkisson.com
Green Office Training and Planning
Project of Singapore Ministry of Foreign Affairs and Singapore Environment Institute (SEI) as part of Initiative for ASEAN Integration August – November 2008.
Cambodia, Laos, Myanmar and Vietnam
Training for government officials on how to plan for , develop and implement a sustainable ‘green office’ culture through resource and energy conservation and efficiency.

© AtKisson 2014www.atkisson.com
Singapore Youth Environmental Envoy Training & Project Development
Singapore National Environment AgencyYouth Environmental Envoy Programme
2004-2009
• Over 400 Youth Leaders from high schools, polytechnics, universities and business trained
• Provide conceptual and practical training on the process of sustainable development.
• Provide a framework and launching point for the YEEs to develop environmental sustainability related projects
• provide tools and skills to encourage environmental sustainability projects and actions.

© AtKisson 2014www.atkisson.com
Pyramid 2012 — A “Global Workshop”
www.Pyramid2012.net

© AtKisson 2014www.atkisson.com Pyramid2030.org

© AtKisson 2014www.atkisson.com
Comments, Questions?

© AtKisson 2014www.atkisson.com
SYSTAINABILITY ASIA /ATKISSON GROUP
www.atkisson.com
www.systainabilityasia.com