Embed Size (px)
Citation preview
EDEXCEL INTERNATIONAL GCSE
ECONOMICS SPECIFICATION
Edexcel International GCSE in Economics (9-1) (4ET0)
First examination June
INTERNATIONAL ADVANCED LEVEL
BIOLOGY PRACTICAL GUIDE STUDENT SUPPORT Pearson Edexcel International Advanced Subsidiary in Biology (XBI11)
Pearson Edexcel International Advanced Level in Biology (YBI11)
First teaching September 2018
First examination from January 2019
First certification from August 2019 (International Advanced Subsidiary) and
August 2020 (International Advanced Level)

Table of Contents
Introduction 3
How will practical skills be tested? 4
Developing independent thinking 6
Biology practical skills: scientific methods and practices 7
Designing investigations 7
Presenting data 8
Evaluating 10
Biology practical skills: use of mathematics 11
Significant figures 11
Statistical testing 11
Errors and uncertainties 13
Core practicals 14
List of core practicals 14

Introduction
What do we mean by practical skills?
It is really important to remember that the term practical skills covers a very wide range of
requirements at A level. It does not mean just the ability to handle equipment in a school
laboratory or know how to use some particular piece of apparatus. It ranges from using
mathematics in a practical context to understanding how scientists investigate ideas, how they
analyse their data and how they are very cautious when drawing conclusions. This guide will
explain each of these in more detail.
These skills are not a separate part of your biology course, they are an essential part of all that
you do and will be tested in your examination papers. In this course, there 18 core practicals –
and a number of additional practicals – which provide lots of opportunities to develop all of these
skills.
How is this different from practical work I’ve done before?
First of all you, are undertaking what is normally a two year course and you will be expected to
show development in this time. In simple terms there might be several familiar skills and
theoretical topics, but you will be expected to have a much more detailed understanding of them.
Above all you will be expected to develop into a more mature scientist. You will need to keep
asking 'How do we know that?' You will also be expected to realise that, even at International A
level, you will only have part of the story and that science is constantly changing. It is not a pile
of 'facts' it is just the best model we have at the present.
Even at this level you can find many textbooks just 15 years old that contain information that we
no longer accept, or at least has been significantly modified! For example, for many years
biologists believed in the 'one gene-one enzyme' hypothesis, but, as you will find in part of this
course, we now know that there are several ways in which one gene can produce different
products.
How can I use these skills in the future?
Almost all of the skills you will acquire during your course will be vital if you are thinking of
continuing into higher education. Most are also what are called transferable skills. This means
that they are extremely useful to a wide range of employers and in your own personal life. The
most obvious example is that of research and analytical skills. Finding information that is reliable
and accurate and using it to make decisions based on evidence is as applicable to buying a car as
it is to making conclusions from experimental data. Exactly the same is true of all the
mathematical skills where practical biology provides lots of opportunities to develop your skills.
How to use this guide
There are three main aims of this guide.
1. To explain what is meant by practical skills at International Advanced Level.
2. To explain what is required to progress from GCSE or International GCSE.
3. To provide questions to help you understand and develop your practical skills to the right
level.
It is important to have a clear understanding of what you are trying to achieve at the beginning
of the course. In this respect the introduction and the basic principles which follow need to be
understood at the very start of your course. The questions and examples which link to particular
practicals are more likely to be useful at the relevant points throughout your course and for
consolidation before you sit the examinations.

How will practical skills be tested?
Practical skills that you will develop
The International A level specification identifies two sets of practical skill that you will develop:
one of these sets of skills has been identified as suitable for assessment through written
examinations; and the other set of skills should be developed during laboratory work but will not
be directly assessed.
Practical skills identified for assessment
Solve problems set in practical contexts
Apply scientific knowledge to practical contexts
Comment on experimental design and evaluate scientific methods
Present data in appropriate ways
Evaluate results and draw conclusions with reference to measurement uncertainties and
errors
Identify variables, including those that must be controlled
Plot and interpret graphs
Process and analyse data using appropriate mathematical skills
Know and understand how to use a wide range of apparatus, materials and techniques
safely, appropriate to the knowledge and understanding of the specification
Plan an investigation to test a hypothesis
Practical skills to be developed through teaching and learning
Apply investigative approaches and methods to practical work
Use a range of practical equipment and materials safely and correctly
Follow written instructions
Make and record observations
Present information and data in a scientific way
Use appropriate software and tools to collect and process data
Use online and offline research skills, including websites, textbooks and other printed
scientific sources of information
Cite sources of information correctly
Use a wide range of experimental and practical instruments, equipment and techniques
appropriate to the knowledge and understanding included in the specification
The unit descriptions for Unit 3 and Unit 6 in the specification give more detail on the skills
assessed in each Unit.

Practical skills in exam papers
The International A level course is examined by 6 units – three of these at International AS and
the remaining three at International A2.
The Units are arranged so that they either test your knowledge of the biology content of the
specification i.e. the Topics that you have been taught, or they test your knowledge of practical
skills in Biology (Unit 3 and Unit 6).
There are 3 written papers, one for each of Units 1, 2 and 3, at IAS level.
Paper 1: 1h 30 mins. This paper tests content of Topics 1 and 2.
Paper 2: 1h 30 mins. This paper tests content of Topics 3 and 4.
Paper 3: 1h 20 mins. This paper tests Practical Skills in Biology
(as listed on the previous page. You can also find more detail on pages 25 – 27 of the
specification).
There are 3 written papers, one for each of Units 4, 5 and 6, at A level.
Paper 4: 1h 45 mins. This paper tests content of topics 1–4 and 5 and 6.
Paper 5: 1h 45 mins. This paper tests content of topics 1–4 and 7 and 8, including questions on
a pre-released article.
Paper 3: 1h 20 mins. This paper tests Practical Skills in Biology
(as listed on the previous page. You can also find more detail on pages 39 – 42 of the
specification).
You may know that all the questions in your written exams are designed to test a number of
“Assessment Objectives”. The Assessment Objective that covers practical skills is AO3. It is
described in the specification as “Experimental skills in biology, including analysis and evaluation
of data and methods”. The Assessment Objective is only tested in Unit 3 and Unit 6 of the IAL.
Mathematical skills in exam papers
Although some mathematical skills are linked to practical work, there will be other occasions in
biology where you will use mathematical skills separately to practical skills.
To show the importance of mathematics in all sciences, 10% of the total marks for each Unit will
assess mathematical skills. This will include Unit 3 and Unit 6, where mathematical skills will be
assessed within the context of practical work.

Developing independent thinking
Whilst there are many individual skills to be developed it is very important to remember they are
not isolated parts. All are linked to how we investigate things scientifically, so this is a good place
to start.
We have already touched on what it means to be a scientist in the introduction. It is important to
explain this a little more here.
Scientists work by creating models which are ideas about how and why things might happen. To
form useful models they need imagination, ingenuity and a good deal of background knowledge.
Almost all scientists work in groups, both together in one laboratory and with other groups
worldwide. From these models they make predictions and only then do they design investigations
to test these predictions. As the number of investigations which confirm these predictions
increases then the model explanation becomes more widely accepted in the scientific community.
However it only takes one well-designed investigation that contradicts expectations to destroy
the idea.
Notice scientists are very careful not to claim they have 'proved' something and are very cautious
in their language. They are very unlikely to refer to anything as a 'fact'. For example, here is how
Watson and Crick reported one of the most important discoveries of the 20th century: 'For the
moment the general scheme we have proposed for the reproduction of deoxyribonucleic acid
must be regarded as speculative. Even if it is correct then much remains to be discovered.
Despite these uncertainties we feel that our proposed structure may help to solve one of the
fundamental biological problems.'
Scientists are human. It is not uncommon for different groups to have conflicting ideas and to
argue strongly. It then takes time for evidence to accumulate in support of one or the other.
So how does this affect you? Obviously you are unlikely to be involved in research at this level
and will be much more interested in achieving a good grade in your examinations! The challenge
for you is to begin to think like a scientist and to question things more carefully, even when
carrying out simple core practicals. Your ability to do this may be tested in examination papers.
Question 1 – How do we know that? Thinking more scientifically.
(a) Read the article entitled 'How to read the health news' to be found at
https://www.nhs.uk/news/Pages/Howtoreadarticlesabouthealthandhealthcare.asp
x
(b) On the same web page you will find an archive with reviews of many claims made
about discoveries relating to health issues. Almost every week, newspapers report
on new findings, often with remarkable claims. Take any one that you find and
research the science behind it. What did the actual research really show? Does it
match the claims in the newspaper?
If you cannot find your own question try the following:
(i) There are many scientific papers showing garlic has antibacterial properties but
does this mean that this is a useful way of solving the problem of bacterial
resistance to antibiotics?
(ii) If you wish the same question can be asked about 'Manuka' honey.

Biology practical skills: scientific methods and
practices
This section of the Guide will consider a number of key skills and practices that you develop and
use as you progress through your A level.
Designing investigations
Some of the core practicals offer you the opportunity to go beyond simply learning a technique
by applying your knowledge to the design of an investigation. You will have met many of the
requirements at GCSE or International GCSE level but during the two years of your International
A level course you will be expected to have a much more accurate understanding of the details.
You might start as follows.
● Exactly what is to be measured? Is this the correct dependent variable, does it match the
hypothesis and how can it be measured as accurately as possible?
● Can a single independent variable be measured or controlled accurately?
● Is it possible to control all other variables? If not, which ones are the most important to
control and can we monitor others?
● How much data will be needed to come to some meaningful conclusions?
Now try the following.
Question 2 – Thinking about experimental design
A student decides to investigate the effect of light and shade on the size of leaves of
one species of plant. The student’s initial plan is to measure the length of leaves on
two sides of a single bush, one side of which is shaded and the other is in full sunlight.
(a) The dependent variable chosen is length of leaf.
(i) Name three other possible leaf measurements which might provide
information on size.
(ii) Which of these measurements would you select to provide the most useful
scientific data? Give reasons for your answer.
(b) Name three other variables which need to be controlled when collecting these
data.
(c) The student chose a bush with a shaded side and a sunlit side. Give three reasons
why simply selecting differences in light intensity by observation might not give
reliable information on 'light' and 'shade'.
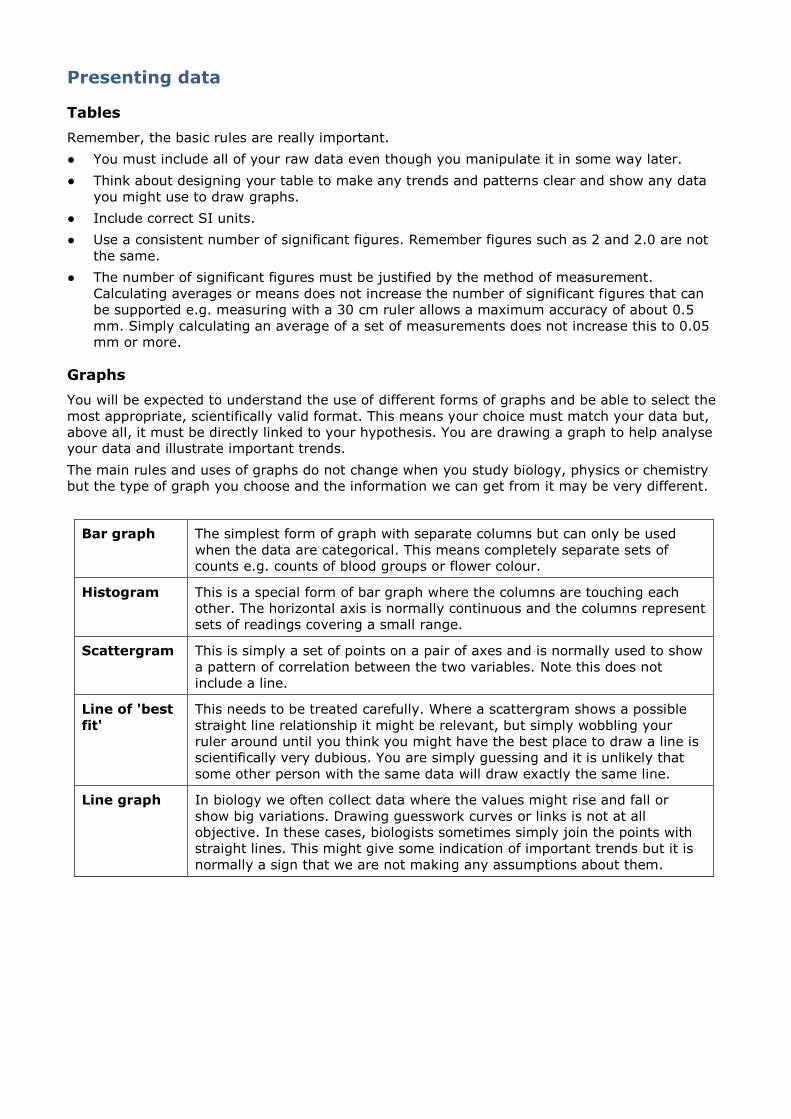
Presenting data
Tables
Remember, the basic rules are really important.
● You must include all of your raw data even though you manipulate it in some way later.
● Think about designing your table to make any trends and patterns clear and show any data
you might use to draw graphs.
● Include correct SI units.
● Use a consistent number of significant figures. Remember figures such as 2 and 2.0 are not
the same.
● The number of significant figures must be justified by the method of measurement.
Calculating averages or means does not increase the number of significant figures that can
be supported e.g. measuring with a 30 cm ruler allows a maximum accuracy of about 0.5
mm. Simply calculating an average of a set of measurements does not increase this to 0.05
mm or more.
Graphs
You will be expected to understand the use of different forms of graphs and be able to select the
most appropriate, scientifically valid format. This means your choice must match your data but,
above all, it must be directly linked to your hypothesis. You are drawing a graph to help analyse
your data and illustrate important trends.
The main rules and uses of graphs do not change when you study biology, physics or chemistry
but the type of graph you choose and the information we can get from it may be very different.
Bar graph The simplest form of graph with separate columns but can only be used
when the data are categorical. This means completely separate sets of
counts e.g. counts of blood groups or flower colour.
Histogram This is a special form of bar graph where the columns are touching each
other. The horizontal axis is normally continuous and the columns represent
sets of readings covering a small range.
Scattergram This is simply a set of points on a pair of axes and is normally used to show
a pattern of correlation between the two variables. Note this does not
include a line.
Line of 'best
fit'
This needs to be treated carefully. Where a scattergram shows a possible
straight line relationship it might be relevant, but simply wobbling your
ruler around until you think you might have the best place to draw a line is
scientifically very dubious. You are simply guessing and it is unlikely that
some other person with the same data will draw exactly the same line.
Line graph In biology we often collect data where the values might rise and fall or
show big variations. Drawing guesswork curves or links is not at all
objective. In these cases, biologists sometimes simply join the points with
straight lines. This might give some indication of important trends but it is
normally a sign that we are not making any assumptions about them.
It is expected that all students will be aware of the basic rules of graph drawing.
● Axes are clearly labelled with units. The title and units are separated by a solidus (/).
● The scale is chosen to ensure the graph covers at least half of the paper and the
y-axis intercept where appropriate.
● The axis shows the full scale with any breaks clearly indicated.
● The independent variable is on the x-axis and the dependent variable is on the
y-axis.
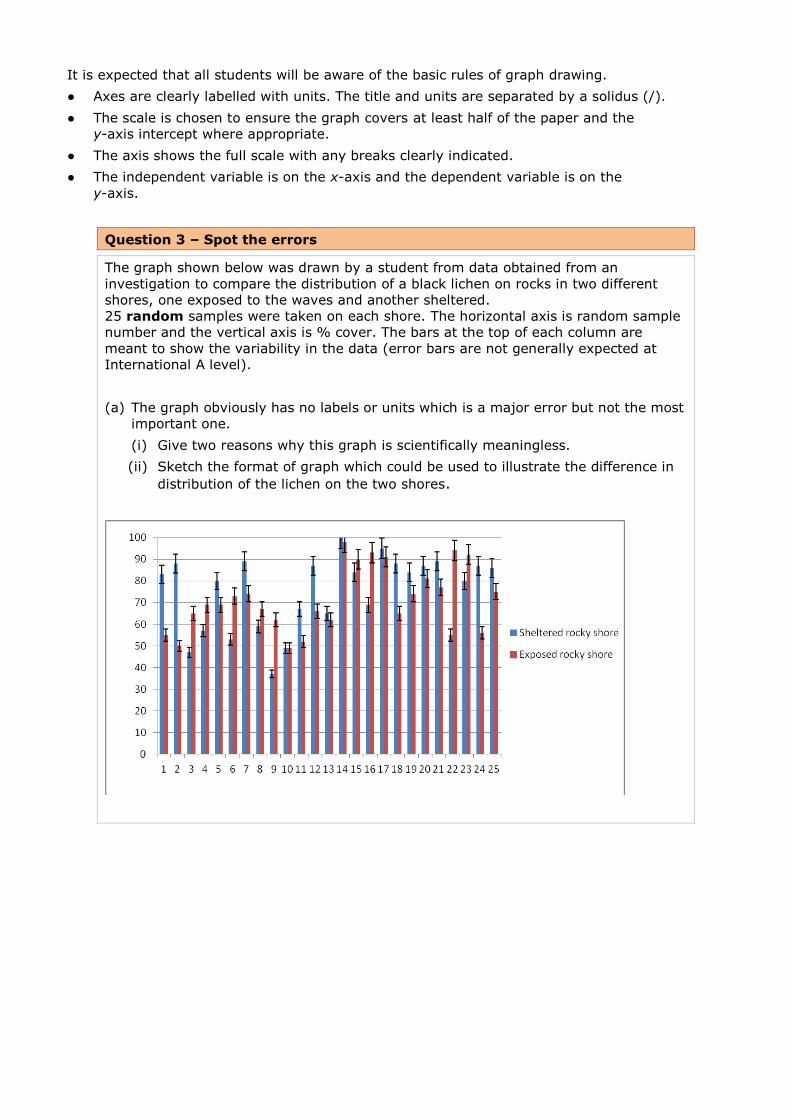
Question 3 – Spot the errors
The graph shown below was drawn by a student from data obtained from an
investigation to compare the distribution of a black lichen on rocks in two different
shores, one exposed to the waves and another sheltered.
25 random samples were taken on each shore. The horizontal axis is random sample
number and the vertical axis is % cover. The bars at the top of each column are
meant to show the variability in the data (error bars are not generally expected at
International A level).
(a) The graph obviously has no labels or units which is a major error but not the most
important one.
(i) Give two reasons why this graph is scientifically meaningless.
(ii) Sketch the format of graph which could be used to illustrate the difference in
distribution of the lichen on the two shores.
Evaluating
This is one of the most important ways in which you will be expected to show progression to A
level. Evaluating is not a simple process of offering an opinion. It is an evidence-based
analytical process. You will certainly be expected to make a judgement but this must be
expressed in terms of a reasoned argument.
So what evidence might be used when coming to a judgement?
● If you have all variables under control and a high level of accuracy then every repeat will be
identical. Obviously this perfection is almost impossible to achieve so the variation in repeats
can provide useful information. It is likely that means will have been calculated so we can
consider how much the individual readings differ from this mean.
Standard deviation is a measure of this variation. Where the data is normally distributed
then the standard deviation is a measure of this distribution, about 68% of all the data will be
within one standard deviation measure of the mean and about 95% of the data will be within
2 standard deviation measures of the mean. It is best calculated using programs such as
Excel.
Standard deviation is measured in the same units as your data. Do remember when
considering whether you have a large or small standard deviation that you must compare it
to the mean. For example if the mean value was 0.5mm then a SD of 0.5mm is very large
but if the mean was 50mm then a SD of 0.5mm is very small.
● Outliers or anomalies are another line of evidence when evaluating your findings. Be
careful when suggesting that readings are anomalies and need to be removed from the data
set. Highest and lowest values are not anomalies. Readings which are much larger or smaller
than others obviously need to be investigated as do those which show a completely different
trend to others. However, remember we are dealing with living things and they often show
high levels of variability.
● If you have lots of anomalies or very high levels of variability then you need to take a careful
look at your methodology. Big variations can arise from random errors in your methods. A
random error is simply something that is different each time you take a reading and therefore
is not under control e.g. if you use a colorimeter to measure absorbance and some of the
tubes you use are scratched but others are not, then the scratched ones will give a higher
reading so increasing the variability in your data. Systematic errors are more difficult to
detect. In this example this would mean using similarly scratched tubes every time. The
readings will not be correct but they will all be just a bit higher than they should and
therefore have little effect on the overall pattern.
● Uncertainties of measurements All measuring apparatus has some level of uncertainty
which affects the precision of the final data. Where several measuring devices such as
thermometers, pipettes or balances etc. are used these uncertainties accumulate to affect the
precision of the final readings.
● Even statistical evidence of a strong correlation does not tell us anything about what is
causing this. There are very many linked factors which give the same results e.g. you can get
a strong correlation between number of ice creams eaten and skin cancer but this is
obviously nothing to do with the cause. Similarly you need to take great care in
understanding exactly what the tests for a significant difference show (and do not show).

Biology practical skills: use of mathematics Significant figures
Core practicals will offer opportunities for you to make a decision on the most appropriate
number of significant figures.
To do this, you should take account of the nature of the data and, most of all, the level of
precision of the measuring apparatus. Remember the following pointers.
● Figures such as 2 and 2.0 do not mean the same thing.
● Consistency of significant figures is important, especially between the data collected and the
final result.
● Simply calculating a mean does not improve the level of precision of the data.
● It is important to make a reasoned decision, not just copy down a figure from a calculator or
spreadsheet.
Statistical testing
This is another good example of progression to A level. Having designed a valid investigation and
collected data in a reliable way how do we make an informed conclusion? It is likely that, before
this stage, this decision has been a matter of opinion. Where there is a lot of overlap between
two sets of data you might feel there is a difference but someone else might not. Obviously this
is not a scientific way of making important decisions, so we need some rules agreed by all
scientists.
The general rule is quite simple. If there is less than a 5 in 100 chance (a probability of 0.05)
that the data could be from the same population then scientists state that there is a significant
difference between them. The word significant is important here because other scientists will
understand exactly what rules you have applied when making your judgement. Do not use this
word unless it is clearly in the context of commenting on a statistical test and its meaning.
The complicated part of the statistics is exactly how we calculate the overall probability from the
measurements we take. This has some difficult mathematics but if this is not your strong point
you need not worry! Provided that you understand the basic idea then you can simply use some
basic instructions and formulae to carry out the calculation to find a statistical test value and then
look up the probability in a table. You will learn more about the individual tests during your
course but what follows is a description of the basic rules. (Question 19 will help you to check if
you have understood what you have learned.)
Statistics – the basic principles
Most statistical tests can be used to measure the probability that your two sets of data are from
the same population. In other words there is no significant difference between them. For this
reason it is usual to start with a null hypothesis. It is important to understand that this is not
saying that the two sets of data are identical! On the contrary, most data you will deal with as a
biologist is likely to show significant variation. The tests show how likely it would be to obtain the
data you collect if these were just random variations within the same populations.
Having formed a null hypothesis we then select a suitable test and input the measurements we
have taken into the chosen formula. This gives us our test statistic which we can then check in a
table to find the probability of this occurring simply by chance from the same population.
If the probability is less than 0.05 (5%) then we reject the null hypothesis and we can state that
there is a significant difference.
Exactly the same rules apply if we are testing for a significant correlation or a 'goodness of fit /
association.
Common tests
The common tests you will meet are:
● tests for a significant difference – Student’s t-test, z-test or Mann-Whitney U test
● test for a significant correlation – Spearman's rank correlation test
● test for a 'goodness of fit' or association – Chi-squared test.

So you must learn to substitute your data into the correct formula and calculate the result.
However, it is not necessary to understand all of the mathematics used to devise that formula.
What is really important is that you understand what the results of your statistical analysis show
(and do not show!)
Some common terminology in statistics
Mean The average value calculated as the total of the samples divided by the
number of measurements.
Median This is the value above which half of the sample lie and below which the
other half lie – in other words, the middle value. Where there is an even
number of samples this is calculated as the mid-point between the pair of
values to which this applies.
Mode The value which occurs most frequently in a set of measurements.
Standard
deviation
This provides a numerical value for the average spread of data from the
mean.
Range This is a much simpler measure of the spread of data in a sample: simply,
it is the difference between the highest and lowest values.
A simple example
A student uses a quadrat to count the number of clover plants in a fixed area. The
student uses the quadrat 10 times in a field and records the number of plants in each
quadrat. His results are:
12, 6, 7, 4, 11, 8, 5, 9, 11, 13
MEAN = (12 + 6 + 7 + 4 + 11 + 8 + 5 + 9 + 11 + 13) ÷ 10 = 8.6
MEDIAN = 8.5 (the middle two numbers are 8 and 9)
MODE = 11
Notice that the mean and median are similar. Why is this? What sort of data might
produce very different values for the mean and the median?

Errors and uncertainties
The terms error and uncertainty are often confused.
An error arises in a practical work through:
● in-built precision of equipment, or a consistent design fault (systematic error)
● poor technique or lack of careful measurement (random error).
Uncertainties arise whenever a measurement is taken because, even with careful use of the
equipment, measuring instruments have a particular level of precision e.g. a laboratory
thermometer might have +/- 0.5°C.
Some useful definitions when considering errors and uncertainties appear in the table.
Validity A measurement is valid if it measures what it is supposed to be
measuring – this depends both on the method and the instruments.
True value The value that would have been obtained in an ideal measurement.
Accuracy A measurement result is considered accurate if it is judged to be
close to the true value. It is influenced by random and systematic
errors.
Precision A quality denoting the closeness of agreement (consistency)
between values obtained by repeated measurement. It is influenced
by random effects and can be expressed numerically by the standard
deviation. A measurement is precise if the values ‘cluster’ closely
together.
Repeatability A measurement is repeatable when similar results are obtained by
students from the same group using the same method. Students can
use the precision of their measurement results to judge this.
Reproducibility A measurement is reproducible when similar results are obtained by
students from different groups using different methods or apparatus.
Uncertainty Any measurement will have some uncertainty about the result, this
will come from variation in the data obtained and be subject to
systematic or random effects. This can be estimated by considering
the instruments and the method and will usually be expressed as a
range such as 20°C ± 2°C.
Error The difference between the measurement result and the true value if
a true value is thought to exist. This is not a mistake in the
measurement. The error can be due to both systematic and random
effects and an error of unknown size is a source of uncertainty.
Core practicals The core practicals are an integral part of your course. They are not there to get you to
demonstrate some text book 'fact' or recall some simple information. They are there to help you
develop the whole range of practical and mathematical skills which are essential to biologists and
which will be tested in the written assessments.
List of core practicals
1. Use a semi-quantitative method with Benedict’s reagent to estimate the concentrations
of reducing sugars and with iodine solution to estimate the concentrations of starch, using
colour standards.
2. Investigate the vitamin C content of food and drink
3. Investigate membrane properties including the effect of alcohol and temperature on
membrane permeability.
4. Investigate the effect of temperature, pH, enzyme concentration and substrate
concentration on the initial rate of enzyme-catalysed reactions.
5. (i) use a light microscope to make observations and labelled drawings of suitable animal
cells
(ii) use a graticule with a microscope to make measurements and understand the concept
of scale
6. Prepare and stain a root tip squash to observe the stages of mitosis
7. Use a light microscope to:
(i) make observations, draw and label plan diagrams of transverse sections of roots, stems
and leaves
(ii) make observations, draw and label cells of plant tissues
(iii) identify sclerenchyma fibres, phloem, sieve tubes and xylem vessels and their
location.
8. Determine the tensile strength of plant fibres
9. Investigate the antimicrobial properties of plants, including aseptic techniques for the
safe handling of bacteria
10. Investigate the effects of light intensity, light wavelength, temperature and
availability of carbon dioxide on the rate of photosynthesis using a suitable aquatic plant.
11. Carry out a study on the ecology of a habitat, such as using quadrats and transects to
determine the distribution and abundance of organisms, and measuring abiotic factors
appropriate to the habitat
12. Investigate the effects of temperature on the development of organism
(such as seedling growth rate, brine shrimp hatch rates)
13. Investigate the rate of growth of microorganisms in a liquid culture, taking into
account the safe and ethical use of organisms.
14. Investigate the effect of different antibiotics on bacteria
15. Use an artificial hydrogen carrier (redox indicator) to investigate respiration in yeast.
16. Use a simple respirometer to determine the rate of respiration and RQ of a suitable
material (such as germinating seeds or small invertebrates).

17. Investigate the effects of exercise on tidal volume, breathing rate, respiratory minute
ventilation, and oxygen consumption using data from spirometer traces.
18. Investigate the production of amylase in germinating cereal grains.
These core practicals are not the only pieces of practical work that you will encounter in your
course. The specification also contains a number of suggested practical activities and your
teacher may choose to include some simple activities to help you learn new techniques or
become familiar with some apparatus.

Questions on core practicals
CP1. Use a semi-quantitative method with Benedict’s reagent to estimate the
concentrations of reducing sugars and with iodine solution to estimate the
concentrations of starch, using colour standards
Question 4
Explain why these methods are described as semi-quantitative rather than
qualitative or quantitative.
CP2. Investigate the vitamin C content of food and drink
Question 5
The redox dye DCPIP is used in this practical. Redox dyes change colour
when they oxidised or reduced.
Explain what is meant by oxidation and reduction.
CP3. Investigate membrane structure, including the effect of alcohol
concentration or temperature on membrane permeability
Question 6
(a) Name the red pigment found in beetroot cells.
(b) Where exactly in the cell is the pigment stored?
(c) Name the membranes that the pigment must cross in order to pass into
the surrounding water.
(d) The following is an extract from a student's report explaining how they
controlled variables in this investigation.
'I used identical discs of beetroot and placed them in temperatures from
15–80°C for exactly 5 mins.'
Explain why this might mean that the discs at different temperatures were
not treated in exactly the same way.
CP4. Investigate the effect of enzyme and substrate concentrations on the
initial rates of reactions
Question 7
(a) Why is it important to test the initial rate of enzyme-controlled reactions?
(b) What are the SI units of rate of reaction?
(c) Why is 1/t not recognised by scientists as a rate?
There are many ways of investigating enzymes so the exact method you use
will depend upon your teacher.

CP5. (i) use a light microscope to make observations and labelled drawings
of suitable animal cells
(ii) use a graticule with a microscope to make measurements and understand
the concept of scale
Question 8
The (drawing/photo) below shows some human cheek cells under high power (x400) of the microscope.
Explain you would view cells under high power.
CP6. Prepare and stain a root tip squash to observe the stages of mitosis
Question 9
(a) Name one suitable stain which could be used to show the chromosomes
clearly.
(b) Explain why it is necessary to squash the root tip before viewing under the
microscope.
(c) How is the root tip macerated?
CP7. Identify sclerenchyma fibres, phloem sieve tubes and xylem vessels and
their location within stems through a light microscope
In this practical you will make some measurements of the cells and other
structures that you see through the microscope. So this is a very important opportunity to practise some mathematical skills.
Question 10
(a) How many millimetres are there in 3 × 10⁻² m?
(b) Write 32 µm as a measurement in standard form expressed in metres.
(c) A student drew a single cell of diameter 2.8 cm. She calculated that this is a magnification of ×870. What is the size of the original cell?
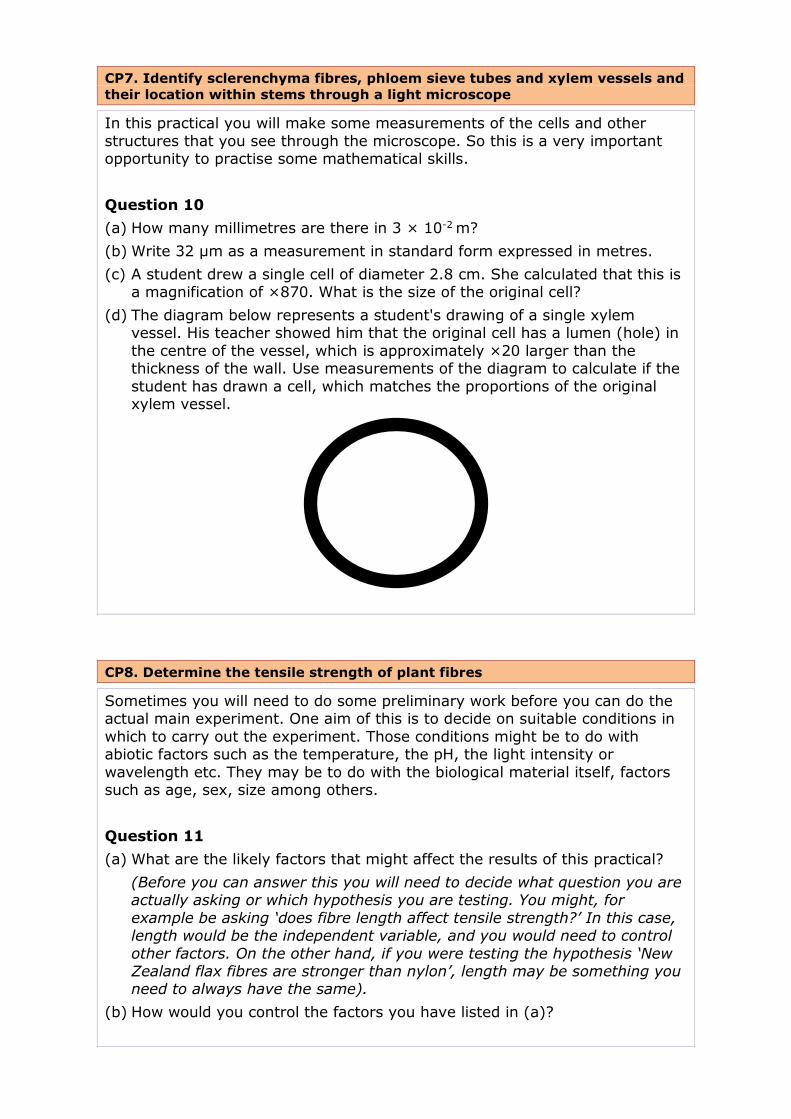
(d) The diagram below represents a student's drawing of a single xylem vessel. His teacher showed him that the original cell has a lumen (hole) in
the centre of the vessel, which is approximately ×20 larger than the thickness of the wall. Use measurements of the diagram to calculate if the
student has drawn a cell, which matches the proportions of the original xylem vessel.
CP8. Determine the tensile strength of plant fibres
Sometimes you will need to do some preliminary work before you can do the actual main experiment. One aim of this is to decide on suitable conditions in
which to carry out the experiment. Those conditions might be to do with abiotic factors such as the temperature, the pH, the light intensity or
wavelength etc. They may be to do with the biological material itself, factors such as age, sex, size among others.
Question 11
(a) What are the likely factors that might affect the results of this practical?
(Before you can answer this you will need to decide what question you are actually asking or which hypothesis you are testing. You might, for
example be asking ‘does fibre length affect tensile strength?’ In this case, length would be the independent variable, and you would need to control
other factors. On the other hand, if you were testing the hypothesis ‘New Zealand flax fibres are stronger than nylon’, length may be something you need to always have the same).
(b) How would you control the factors you have listed in (a)?
CP9. Investigate the antimicrobial properties of plants, including aseptic
techniques for the safe handling of bacteria
This is your first real chance at International A level to think about handling
microorganisms safely and successfully. These aims are achieved by a variety of procedures called aseptic techniques.
Question 12
List two aseptic techniques you use or used in this practical and explain the
precise purpose of each.
CP10. Investigate the effects of light intensity, light wavelength,
temperature and availability of carbon dioxide on the rate of photosynthesis
using a suitable aquatic plant
Question 13
(a) Name one other physiological process that will change the volume of oxygen given off.
(b) Give two reasons why this method would not be suitable for investigating
the effect of temperature on the rate of photosynthesis.
(c) What is meant by an action spectrum?
(d) What is meant by an absorption spectrum?
(e) A student investigating the effect of different wavelengths on the rate of
photosynthesis drew an action spectrum from his results. When he
compared this with the absorption spectrum of the pigments found in the same plant he found a close correlation between the two. He therefore wrote the following in his conclusions. 'The close correlation between the
absorption of different wavelengths of light and the rate of photosynthesis proves that this mixture of pigments absorbs light energy which is used to
manufacture carbohydrate and give off oxygen as a waste product.'
Is this a valid conclusion from these data? Explain your answer.
CP11. Carry out a study on the ecology of a habitat, such as using quadrats
and transects to determine distribution and abundance of organisms, and
measuring abiotic factors appropriate to the habitat
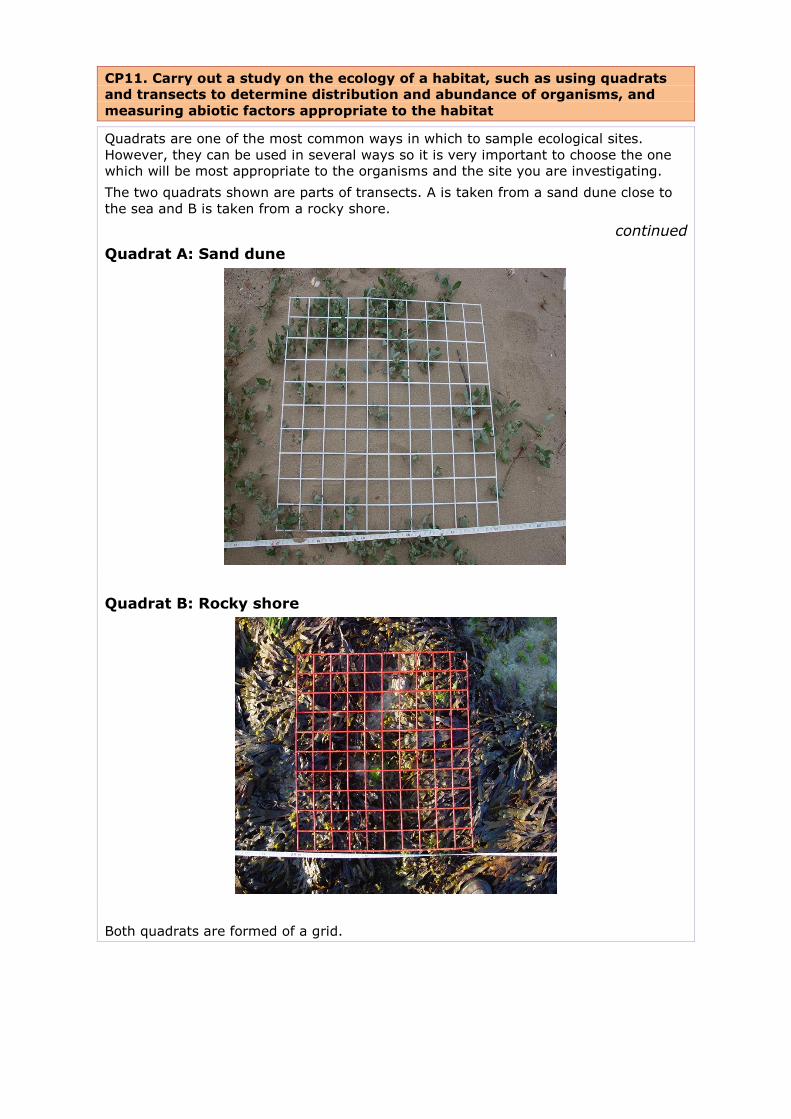
Quadrats are one of the most common ways in which to sample ecological sites.
However, they can be used in several ways so it is very important to choose the one
which will be most appropriate to the organisms and the site you are investigating.
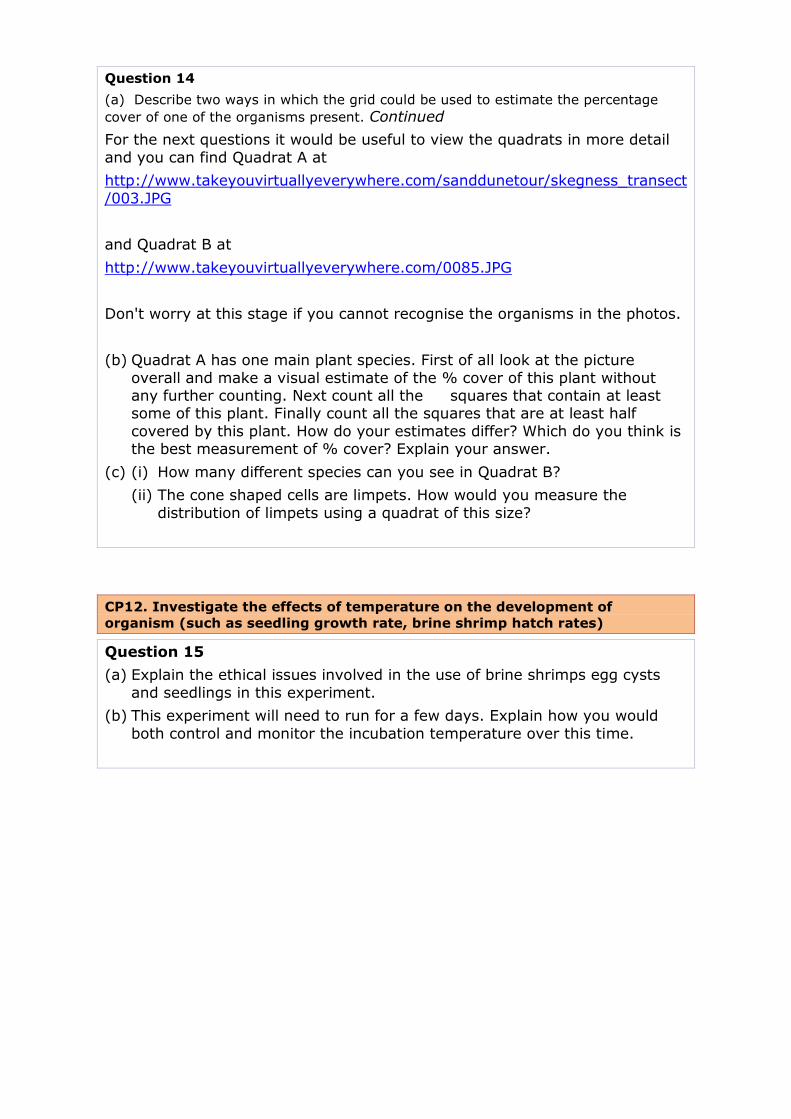
The two quadrats shown are parts of transects. A is taken from a sand dune close to
the sea and B is taken from a rocky shore.
continued
Quadrat A: Sand dune
Quadrat B: Rocky shore
Both quadrats are formed of a grid.
Question 14
(a) Describe two ways in which the grid could be used to estimate the percentage
cover of one of the organisms present. Continued
For the next questions it would be useful to view the quadrats in more detail
and you can find Quadrat A at
http://www.takeyouvirtuallyeverywhere.com/sanddunetour/skegness_transect
/003.JPG
and Quadrat B at
http://www.takeyouvirtuallyeverywhere.com/0085.JPG
Don't worry at this stage if you cannot recognise the organisms in the photos.
(b) Quadrat A has one main plant species. First of all look at the picture
overall and make a visual estimate of the % cover of this plant without any further counting. Next count all the squares that contain at least some of this plant. Finally count all the squares that are at least half
covered by this plant. How do your estimates differ? Which do you think is the best measurement of % cover? Explain your answer.
(c) (i) How many different species can you see in Quadrat B?
(ii) The cone shaped cells are limpets. How would you measure the
distribution of limpets using a quadrat of this size?
CP12. Investigate the effects of temperature on the development of
organism (such as seedling growth rate, brine shrimp hatch rates)
Question 15
(a) Explain the ethical issues involved in the use of brine shrimps egg cysts
and seedlings in this experiment.
(b) This experiment will need to run for a few days. Explain how you would
both control and monitor the incubation temperature over this time.

CP13. Investigate the rate of growth of microorganisms in a liquid culture,
taking into account the safe and ethical use of organisms.
Question 16
The table below shows some typical results of bacterial growth.
(a) Using an ordinary sheet of graph paper try to plot the increase in population numbers against time. How easy would it be to choose a
suitable scale for the population number axis?
Why logarithms?
Common logs use a base of 10 which is written as log10.
The logarithm of a number is simply the power to which we need to raise the
base to make that number.
So If the number is 100 then 102 = 100 so the log of 100 is 2.
Similarly for 1000, 103 = 1000 so the log of 1000 is 3.
Now for the sequence 10 > 100 > 1000 the logs would be 1 > 2 > 3. We have
converted a rapidly increasing series of numbers into a linear scale which is ideal for plotting and for applying other formulae to describe it.
(b) Now complete the table above to include the logs of the population
numbers. These can be found on any scientific calculator, online or even on
some smart phone calculators. Plot time as the horizontal axis and log10 population numbers as the vertical axis on ordinary graph paper to see the effect.
CP14. Investigate the effect of different antibiotics on bacteria
Question 17
The techniques here are more or less the same as those used in CP9. The
efficacy of the antibiotic is measured by the size of a zone of inhibition.
(a) Is the size of this zone affected only by the bacteriocidal or bacteriostatic properties of the antibiotic? If not, what other factors may affect it?
(b) Would this method allow you to distinguish between bacteriocidal and
bacteriostatic antibiotics?
Time (h) Population Number log10 population
number
0 0
1 64
2 4096
3 262144

CP15. Use an artificial hydrogen carrier (redox indicator) to investigate
respiration in yeast.
Question 18
(i) Name 3 redox indicators which could used in this practical.
(ii) State the colour change you would see on reduction of the indicator in
each case.
CP16. Use a simple respirometer to determine the rate of respiration and RQ
of a suitable material (such as germinating seeds or small invertebrates).
Question 19
(a) Name a compound which could be used to absorb carbon dioxide in the
apparatus.
(b) Explain why removing the carbon dioxide and then recording the change in
volume of gas in the respirometer chamber gives a measure of the oxygen taken up in respiration
(c) Blowfly larvae (maggots) are often used in this investigation. Maggots are
also often used as fishing bait by piercing them with hooks. Using higher animals in this way is illegal and would cause a public outcry. Do you feel that invertebrate or cold-blooded organisms should have the same
protection as other animals? Describe three reasons why you feel this way.
(d) The apparatus was used to investigate anaerobic respiration in yeast cells.
Describe the movement of the liquid with carbon dioxide absorbent present and with it absent.

CP17. Investigate the effects of exercise on tidal volume, breathing rate,
respiratory minute ventilation and oxygen consumption using data from
spirometer traces
You are not required to carry out this experiment, only to interpret its results.
Question 20
(a) Below are two traces, one is without carbon dioxide absorbent and the
other with it. Identify which is which and explain the difference.
Trace A Trace B
(b) Why is it dangerous to allow a subject to do the experiment with carbon
dioxide absorbent?
(c) Calculate the oxygen consumption shown by the subject in the traces
above.
CP18. Investigate the production of amylase in germinating cereal grains
Question 21
a) Why must starch be 'mobilised' before it can be used as a respiratory
substrate?
(b) There is no amylase present in cereal seeds before germination starts.
Describe the sequence of events which must take place to produce an active amylase in the cereal seeds including the role of gibberellin.
(c) Explain how these events in a barley seed are used in brewing beer.