Embed Size (px)
Citation preview

ATINER CONFERENCE PAPER SERIES No: LNG2014-1176
1
Athens Institute for Education and Research
ATINER
ATINER's Conference Paper Series
DEM2015-1514
Gamal M. Hendawy
Assistant Professor of Population Studies
Damietta University
Egypt
Socio-Demographic Characteristics of
Indian Immigrants in the Sultanate of
Oman (1993-2010)

ATINER CONFERENCE PAPER SERIES No: DEM2015-1514
An Introduction to
ATINER's Conference Paper Series
ATINER started to publish this conference papers series in 2012. It includes only the
papers submitted for publication after they were presented at one of the conferences
organized by our Institute every year. This paper has been peer reviewed by at least two
academic members of ATINER. Dr. Gregory T. Papanikos President Athens Institute for Education and Research
This paper should be cited as follows:
Hendawy, G. M. (2015). "Socio-Demographic Characteristics of Indian
Immigrants in the Sultanate of Oman (1993-2010)", Athens: ATINER'S
Conference Paper Series, No: DEM2015-1514.
Athens Institute for Education and Research
8 Valaoritou Street, Kolonaki, 10671 Athens, Greece Tel: + 30 210 3634210 Fax: + 30 210 3634209 Email: [email protected]
URL: www.atiner.gr URL Conference Papers Series: www.atiner.gr/papers.htm Printed in Athens, Greece by the Athens Institute for Education and Research. All
rights reserved. Reproduction is allowed for non-commercial purposes if the source is
fully acknowledged. ISSN: 2241-2891 13/07/2015

ATINER CONFERENCE PAPER SERIES No: DEM2015-1514
3
Socio-Demographic Characteristics of Indian Immigrants in the
Sultanate of Oman (1993-2010)
Gamal M. Hendawy1
Assistant Professor of Population Studies
Damietta University
Egypt
Abstract
There are many temporary Asian immigrants (TAI) in the Gulf Cooperation
Council (GCC) countries, who have come along with the massive waves of Asian
labor since the seventies of the twentieth century. Temporary Indian Immigrants
(TII)’ numbers are estimated to be the largest among Asian labor force in the Gulf
Cooperation Council (GCC) states in general and in the Sultanate of Oman in
particular.
The study aims to analyze the growth of the size as well as geographical
distribution of the TII within Omani governorates. The study also examines their
gender, age, and educational level, as well as their marital and work status. The
study makes use of the results of three Omani census data (1993, 2003.2010), and
labor force data, using a quantitative and cartography method.
The study showed that the historical relations between India and the Sultanate
of Oman have played a significant role in increasing the numbers of Indian
workers in the Sultanate, where their numbers increased from 267584 in 1993 to
465660 people in 2010 (representing 13.3% of Omani population and 50.0% of
the expatriates body and 16.8% of Omani population and 57.1% of the expatriates
in Oman).respectively The study also revealed that Indian labor force controls
many sectors of the Omani labor market, such as the construction, household
workers, agriculture, retail trade and motor vehicles repair sectors, thus it is
difficult to dispense them at least in the near future.
Keywords: Asian Labor - Gcc Countries - Oman - Indian Immigration - Socio-
Demographic Characteristics.
1 Currently working at Sultan Qaboos University, Sultanate of Oman.

ATINER CONFERENCE PAPER SERIES No: DEM2015-1514
4
Introduction
The Gulf Cooperation Council (GCC) countries (including Oman) have
been receiving huge waves of foreign workers (especially Asians) since the
mid-seventies until the present time. This wave started in two phases: in the
seventies of the twentieths century with Arab labor migration from North
Africa, and in the eighties with the flood of immigrants from Asia, which has
not slowed down until the present time (Mohammed, N., 2003, pp: 160-61).
Since then, the Arabian Gulf region has become one of the largest recipients of
labour migration flows in the world (Jureidini, Ray. 2014)
The large numbers of foreign workers in the GCC states occurred due to
the oil boom, which has had a significant role in financing constructing
infrastructure, economic structures, and various development projects.
Additionally, the development and modernization processes in the Arabian
Gulf region offered thousands of job opportunities in many sectors and at
varying levels of skill and experience (Hendawy, August 2008, p 18).
The proportion of expatriates in the Sultanate of Oman; henceforth Oman,
and Saudi Arabia, compared with the total expatriate population in the other GCC
states are considered the lowest. This proportion is more than 50.0% in Bahrain
and Kuwait, and more than 85.0% in Qatar, and it reached about 88.6% of the total
population of the United Arab Emirates (Table 1).
Table 1. Population of the GCC Countries by Nationality (2010)
Expatriates Citizens Country
% Person % Person
29.4 816143 70.6 1957336 Oman
31.2 8589817 68.8 18973615 Saudi Arabia
54.0 666172 46.0 568399 Bahrain 60.5 1616026 39.5 1056900 Kuwait
85.7 1456362 14.3 243073 Qatar
88.5 7316073 11.5 947997 United Arab Emirates
46.3 20146165 53.7 23425157 Total GCC Source: - Co-operation Council (GCC), the Secretariat 0.2011.
- De Bel-Air, Françoise. 2014 (Qatar data).
- General Census 2010, the Kingdom of Saudi Arabia.
- The Ministry of National Economy, 2011 (Oman).
Indians moved to the GCC stares in large numbers following the oil boom
of the 1970s, and their numbers grew further as the economies of the GCC
states expanded in the subsequent decades. Currently, there are approximately
six million Indians living and working in the six Gulf States (Kohli, Neha,
2014, pp: 115-116).

ATINER CONFERENCE PAPER SERIES No: DEM2015-1514
5
The Study Area
Oman is located in the southeast coast of the Arabian Peninsula, and lies
between latitudes 16° 40ʹ and 26° 20ʹ N, and longitudes 51° 50ʹ and 59° 40ʹ E.
It is bordered by Saudi Arabia to the west, Yemen to the southwest, and
the United Arab Emirates to the northwest, and shares marine
borders with Pakistan and Iran. With an area of 309501 Km2 mostly covered by
gravel desert plain (in the center) with mountain ranges along the north and
southeast coast. Oman is administratively divided into 11 governorates (Figure
1), and each governorate is also divided into a number of Willayats (districts).
According to 2010 census, the population of Oman was 2773479 people,
of whom 1957336 were Omani and 816143 were expatriates. The latter
represented 29.4% of the total population, mostly Asians. The average of
annual population growth in Oman was 2.4% (2003-2010), with total fertility
rate of 3.3 child/woman. The average population density is nine persons/km2,
with various rates among governorates, where in Muscat (the capital), it was
150, while in Al-Wusta region (mostly desert) it was less than 1 persons/km2.
About 75.4% of total population live in urban areas, and the most
important cities are: Muscat (the capital), Sohar and Sur in the north,
and Salalah in the south. The rest of population live in rural areas: around Al-
Aflaj and wells' water in Al-Batinah coast, mountain and desert oases and
Bedouin in the desert areas.
Figure 1. Location and Administrative Areas of Oman
Source: According to Royal Decree No. 114/2011

ATINER CONFERENCE PAPER SERIES No: DEM2015-1514
6
Objectives:
The study aims to monitor and analyze the development of the Temporary
Indian Immigrants (TII) in Oman, in terms of size, growth rates and
geographical distribution throughout the Omani governorates. The study also
monitors their characteristics in terms of gender, age, education level, marital
and work status, in order to clarify the preference of Omani labor market for
TII. It also aims to identify the future of TII in Oman.
Methodology: The study focuses on the TII in Oman, excluding the Indians who have
gained Omani citizenship. In order to reach a deeper analysis of the
characteristics of TII in Oman, the study made use of the data derived from
three Omani censuses (1993, 2003.2010), and of labor force data, using the
quantitative and cartography methods. It also used data form Arab and
international organizations such as the Arab Labor Organization and the United
Nations as well as other international and regional organizations. The study
also used some related geographical and non-geographical research. The
process of data analysis of TII has two levels: first, data analysis at the level of
the country (Oman) in comparison with the GCC countries, second, at the
governorates level.
Data analysis related to the future of TII in Oman depends on their annual
growth rate scenarios (Projected population calculated according to the prediction
equation which: Projected population = Log (latest census) + No. of years × Log (1 +
growth rate). It was found out that most of TII in Oman are married and they
had come to Oman without their wives. Thus, the levels of fertility scenarios
become inadequate to indicate their future in Oman.
Hypotheses:
There are two affirmative hypotheses and two null hypotheses
1. Omani labor market prefers Indian workers to other expatriates.
2. Omani labor market does not prefer Indian workers to other expatriates
3. Oman might dispense all expatriate workers, including Indians due to
adopting Omanization policy.
4. Oman might not dispense all expatriate workers, including Indians due
to adopting Omanization policy.
Expatriates in Oman
In the beginning of the seventies the number of expatriates in Oman was
about 107000 people representing approximately 14.8% of its total population (Al-
Zhlol, & Ali, 2003, p 372). The number increased in 1993 to be 534848 people,
representing 26.5% of its total population.
According to the 2010 census, the number of expatriates was 816143 people,
representing 29.4% of the total population. This meant that the flow of foreign

ATINER CONFERENCE PAPER SERIES No: DEM2015-1514
7
labor increased significantly in recent years due to comparatively high salary
levels that attracted foreign work force (Deffner & Pfaffenbach, 2011).
The census also showed that the annual growth rate of the expatriate
population peaked in the period 2003-2010, reaching 5.4% (Table 2), which
exceeded the annual growth rate of Omani population, despite the optimistic
expectations of Omanisation policy in public and private sectors. This could be
ascribed to the expansion of economic and service projects such as the Port of
Sohar project in North Al-Batinah and Duqm Port in Al-Wusta governorate, as
well as the growth of the private sector, which had a major role in increasing the
number of expatriates in that period.
Table 2. Size and Growth Rate of Omani & Expatriates (1993-2010).
Year Size of Population Growth Rate %
Omani
(Person)
Expatriates Omani Expatriates
Person % of total pop.
1993 1483226 534848 26.5
2003 1781558 559257 23.9 1.80 0.45
2010 1957336 816143 29.4 1.34 5.40
1993-2010 1.63 2.50
Source: - Ministry of Development, General Census of Population 1993.
- Ministry of National Economy, 2005, and 2011.
- Own calculation
The relations of Oman and Indian have had a clear impact in increasing the
number of TII in Oman, where they comprised 13.3% of the total population of
Oman in 1993, representing about 50.0% of the total expatriates. In 2003, the
number of TII in Oman reached 300693 people, representing 53.8% of the total
expatriate. The 2010 Census data showed that the number of TII was nearly
half a million (465660 people), representing 57.1% of the total expatriate.
While the proportion of Egyptian immigrants (who are the most among Arab
immigrants in Oman) did not exceed 3.7% of the total expatriates (Table 3).
Three Omani census data indicated that Asians immigrants represented the
largest and most important expatriate population group in Oman, and their size
grew from 455588 people (85.1%) in 1993 to 721511 people (88.4%) in 2010
(Table 3). In contrast, the proportion of the Arab immigrants decreased from
12.2% of the total expatriates in 1993 to 8.5% in 2010.

ATINER CONFERENCE PAPER SERIES No: DEM2015-1514
8
Table 3. The Main Nationalities of Expatriates in Oman (1993-2010) Nationalities 1993 2003 2010
Person % Person % Person %
GCC 5607 1.1 9605 1.7 7997 1.0
Egyptian 32995 6.2 23711 4.2 29877 3.7
Other Arabs 26324 4.9 28750 5.1 31112 3.8
Indian 267584 50.0 300693 53.8 465660 57.1
Other Asians 188004 35.1 180439 32.3 255851 31.3
British 7473 1.4 415 0.7 4054 0.5
Other Europeans 2960 0.6 3603 0.7 4487 0.5
African 1169 0.2 Within the other nationalities
USA Within the other nationalities 1540 0.2
Other
nationalities
2732 0.5 8341 1.5 15565 1.9
Total of Arabs 64926 12.2 62066 11.0 68986 8.5
Total of Asians 455588 85.1 481132 86.1 721511 88.4
Total of
expatriates
534848 100.
0
559257 100.
0
816143 100.0
Source: - Ministry of Development, Census 1993.
- Ministry of National Economy, 2003; and 2011.
- Own Calculation.
Factors leading to favoring Asian to Arab labor force in the Omani labor
market
Asian workers’ wages are generally lower than national and Arab
workers, as they are more accommodating and more tolerant to
hard working conditions and also capable of doing diverse work.
The simple mechanism of recruiting Asian labor in Oman plays
an important role in increasing the numbers of Asians labor,
where recruiting workers in Oman is done by the Omani private
sector. However, in Asian countries, there are government and
private recruiting agencies in India, Pakistan, Philippines,
Bangladesh, and Sri Lanka.
The historical relations between India and Oman contributed to
preferring such laborers (Al-Harthy, 2000).
The political decision of the GCC states authorities to limit the
number of Arab workers and use labour force from other
countries, especially from the India and South-East Asia
(Kapiszewski, A. 2004).
Preference of Global and international companies in Oman such
as the Asian construction companies to recruit large numbers of
non-Arab labor force.
Vagueness of Labor marketing training policies in the non-GCC
Arab countries, in addition to the fact that their training programs
are unable to provide highly qualified and well trained labor force
meeting the requirements of contemporary technological age.

ATINER CONFERENCE PAPER SERIES No: DEM2015-1514
9
Reluctance of Omani workers to work in the private sector their
preference of the government one, due to its higher wages and job
security.
Lack of enthusiasm of private sector business owners to employ
national workers and their preference to the Asian labor
(Hendawy, 2012, pp: 594-597).
Geographically, expatriates population are distributed throughout all the
governorates of Oman with different proportions according to the nature and
needs of each governorate. The total number of expatriates in 2010 was 816143
people, of whom 86.7% lived in urban areas and 13.3% in rural areas, which
meant that most of the expatriates lived in its urban areas.
Muscat governorate, being the capital city, had most investments projects and
services and it attracted most expatriate workers. In 2010 the number of
expatriates was 368872 people, representing 47.54% of the total population of
the governorate (Table 4), and 45.2% of the total expatriates in Oman.
Table 4. Size and Percentage of Expatriates in Oman (2003-2010).
Governorate 2003 2010
person % person %
Al-Wusta 6141 26.35 23068 54.78
Muscat 250461 39.63 368872 47.54
Al-Buraymi 38724 50.40 29891 40.99
Dhofar 65001 30.10 85656 34.30
Musandam 8054 28.38 9527 30.32
Adh-Dhahirah 20602 15.83 32787 21.62
North Al-Batinah 57720 14.11 97047 20.07
South Al-Batinah 31378 12.83 54593 18.89
Adh-Dakhliyah 31803 11.90 57582 17.63
South Ash-Sharqiyah 32106 18.49 30751 16.35
North Ash-Sharqiyah 17267 12.35 26369 16.23
Total 559257 23.90 816143 29.40
% = % of total governorate's population.
Source: - Ministry of National Economy 0.2005; and 2011.
- Own calculation
Expatriates proportion varied throughout the governorates of Oman. In
2010, the proportion of expatriates in Al-Wusta governorate was more than
half of its population (54.78%), (Figure 2), where it had many economic
projects such as oil mining, in addition to the Duqm port project, which
attracted a lot of foreign workers.
According to the 2010 census, the proportion of expatriates rose more than
30% of the total population in the governorates of Muscat, Dhofar, Al-Buraymi
and Musandam (Table 4). This was attributed to the fact that Muscat being the

ATINER CONFERENCE PAPER SERIES No: DEM2015-1514
10
capital city (as mentioned earlier), Dhofar being the capital of the South, and
the possession of many tourist attractions and activities such as Khareef
(summer) Salalah, that had attracted a large number of expatriates to work in
the field of tourism.
Figure 2. Proportional distribution of Omanis and Expatriates 2010
Source: By the researcher according to 2010 Census data.
Al-Buraymi shares the border with the UAE, making it as a transit for
expatriates, especially those who wish to enter the UAE from Oman and vice
versa. The proportion of expatriate ranged between 20% and 30% in the
governorates of North Al-Batinah and Adh-Dhahirah, and less than 20% of the
total population in the rest of the governorates.
As shown above, the expatriate population is spread all over Oman and
concentrated in urban areas. In some cases, they live in their own communities
which are not of their own choice, but they were imposed on them by the
nature of their work, for example, in labor camps, farms, poultry and animals
farms or industrial areas and mining operations.

ATINER CONFERENCE PAPER SERIES No: DEM2015-1514
11
Temporary Indian Immigrants (TII) in Oman: History, Growth and
Distribution
TII constitute a major figure in the equation of population size of GCC
states. Where their size in these countries exceeded six million people in 2012,
of whom 2.5 million in Saudi Arabia, 2.2 million in the United Arab Emirates,
and 466 thousand in Oman, in addition to those in other GCC states. Money
remittances of these workers constituted a significant portion of India’s foreign
exchange income. According to the World Bank statistics, in 2012, India
received US$ 29.69 billion as remittances from their workers in the GCC
countries (Pradhan, P. Kumar 2014, p: 3). It is worth mentioning that Omani-Indian relationship is very old and
backdated to the Middle Ages. This was in trade relations between the state of
Gujarat on the west coast of India and Omani ports: Qalhat, Sur and Muscat.
The oldest Indian family migrated to Oman dates back to eighth generations
(Ginu Zacharia Oommen & Khurshid Imam, 2010, p: 92-93; Pasha, 2003). India is considered to be the largest façade for Omani exports (India
imports from Oman almost all the production of urea fertilizer). Non-oil trade
relations have developed and made substantial growth where it became close to
2 billion US dollars (Vaidya, 2008). Additionally, there are other areas of
cooperation such as strategic cooperation in the military training and
information technology (Lefebvre, 2011). In 2013 the total bilateral trade
between India and Oman was doubled to 4.55 billion US$ (Pradhan, P. Kumar
2014, p: 7), where India exported to Oman at about US$ 2.6 billion and
imported from Oman at about US$ 1.95 billion (Rizvi, M. Mahtab A., 2014, p.
99).
This relation has played an important role in increasing the number of TII
in Oman. At the beginning of the seventies of the twentieth century, the
number of Indians in Oman, was about 38500 people, and then increased to
220000 in early nineties (Kohli, Neha, 2014, pp:119). In 1993 the size of TII
was 267584 people, and increased to 300693 in 2003 (Table 5). The average
annual growth rate of TII in that period (1993-2003) was 1.2%, due to the low
annual growth rate of male Indians, who reached only 0.4%, while the growth
rate of female Indian was 4.6%. This was due to the significant thrust of
Omanisation policy of that period, which led to reducing dependence on male
labor force in general. On the other hand, there was an increase in the number
of female Indians due to using them many new health and educational facilities
in addition to miscellaneous services and working as housemaids.
In the period 2003-2010 there was a significant growth in the size of TII in
Oman, where it reached 465660 people in 2010, resulting in a higher annual
growth rate of the TII population to 6.2%, which was very high compared with
the growth rate of Omani population (1.34%). In 2012 the number of TII was
estimated by 718642 immigrants (Kohli, Neha, 2014, p: 119).

ATINER CONFERENCE PAPER SERIES No: DEM2015-1514
12
Table 5. Size, Growth Rate by Gender (1993-2010) of TII, and their weight
(2010) Governorate 1993 2003 2010 % of
TII
2010. Total % M. % F. Total % M. % F. Total % M. % F.
Muscat 147215 80.64 19.36 154453 74.57 25.43 239383 78.95 21.05 51.5
Dhofar 30292 87.82 12.18 34573 81.98 18.02 41839 81.48 18.52 9.0
Musandam 2855 85.71 14.29 4445 83.82 16.18 3915 84.80 15.20 0.8
Al-Buraymi
18464 91.31 8.69
8876 82.33 17.67 7929 81.94 18.06 1.7
Adh-
Dhahirah
10713 87.63 12.37 17387 92.48 7.52 3.7
Adh-
Dakhliyah
14713 91.33 8.67 17695 84.84 15.16 33824 90.82 9.18 7.3
North Al-
Batinah 35000 89.05 10.95
25195 76.03 29.97 50245 81.60 18.40 10.8
South Al-
Batinah
13804 79.68 20.32 29281 87.86 12.14 6.3
South Ash-
Sharqiyah 17319 89.72 10.28
18658 82.72 17.28 14620 73.04 26.96 3.1
North Ash-
Sharqiyah
8715 83.35 16.65 10739 82.81 17.19 2.3
Al-Wusta 1726 97.04 2.96 3566 96.41 3.59 16490 98.76 1.24 3.6
Total 267584 84.62 15.38 300693 78.23 21.77 465660 82.10 17.90 100.0
AGR % 1.2 0.4 4.6 6.2 6.9 3.5
Notes: - Al-Buraymi within Adh-Dhahirah governorate in 1993 and the North Al-Batinah and
South Al-Batinah were one province, as well as the south and north Ash-Sharqiyah.
AGR = Annual Growth Rate.
Source: Ministry of Development, General Census of Population, 1993.
- The Ministry of National Economy 2005; and 2011.
- National Center for Statistics and Information 2013, unpublished data.
This is due to the increase of male TII in Oman in that period, which led,
in turn, to an increase in their annual growth rate to 6.9%. The major projects
adopted by the Omani government, such as the Sohar Refinery and Suhar Port
in the north, Duqm Port and City in the middle, played a great role in bringing
large numbers of male temporary immigrants, especially Indians.
TII spread in all Omani governorates, and their numbers ranged between
239383 people in Muscat governorate in 2010 and 3915 in Musandam governorate (Figure 3).

ATINER CONFERENCE PAPER SERIES No: DEM2015-1514
13
Figure 3. Size of TII in Omani Governorates (1993–2010)
Source: By the researcher according to 2010 Census data.
Muscat had more than half (51.4%) of TII in 2010 (Figure 4), as there
were large groups of families of Indian traders, especially in Muscat and
Mutrah (Allen, 1981; Peterson, 2007). This was due to its being the
administrative capital of Oman, and having many industrial areas such as:
Ghalla, and Rusail, and Almabaelh. Muscat also has big companies in Ruwi
and Al-Wadi Al-kabeer.
As shown above, it can be clearly seen that TII are distributed in all
governorates of Oman, but with variant sizes depending on the nature of each
governorate and the extent of the need for expatriate workers.

ATINER CONFERENCE PAPER SERIES No: DEM2015-1514
14
Figure 4. Distribution of TII (male & female) in Oman 2010
Source: By researcher according to 2010 Census data
Results
TII Gender and Age Groups
Gender (sex) Ratio
There is a high proportion of gender ratio in all GCC countries, and the
ratio varies from one country to another according to the nature of its
developmental projects. However, the average gender ratio rose
unprecedentedly in Qatar (338.7 male/100 female) , UAE (293.1) in 2010, and
ranged in the rest of the GCC states between 164.8 in Bahrain and 132.4 in
Saudi Arabia (Hendawy, 2012, p: 603).
According to Omani census data, TII masculine immigration is higher than
its corresponding female ratio among expatriate population and total
ATINER CONFERENCE PAPER SERIES No: DEM2015-1514
15
population of Oman. The gender ratio among TII was 550.5 in 1993, while it
was 337.7 among expatriates and 140.2 for the total population of Oman (Table
6), this was due to significant dependence on masculine labor force in general
and presence of many Indian construction companies in Oman.
Table 6. Gender Ratio of Total Population, Expatriates, and TII (1993–2010).
Gender Ratio
(Male / 100 Female) 1993 2003 2010
Total population 140.2 127.8 138.9
Total expatriates 337.7 281.6 320.0
TII 550.5 359.5 458.7
Source: - Ministry of Development, General Census of Population, 1993 .
- The Ministry of National Economy 0.2005; and 2011.
- National Center for Statistics and Information 2013, unpublished data.
In 2003, gender ratio among TII decreased to 359.5 as a result of
Omanization policy and increasing of female TII. Later it increased to 458.7 in
2010 (Table 6) due to the adoption of major projects (as mentioned early),
which led to recruiting large numbers of males to work in these projects.
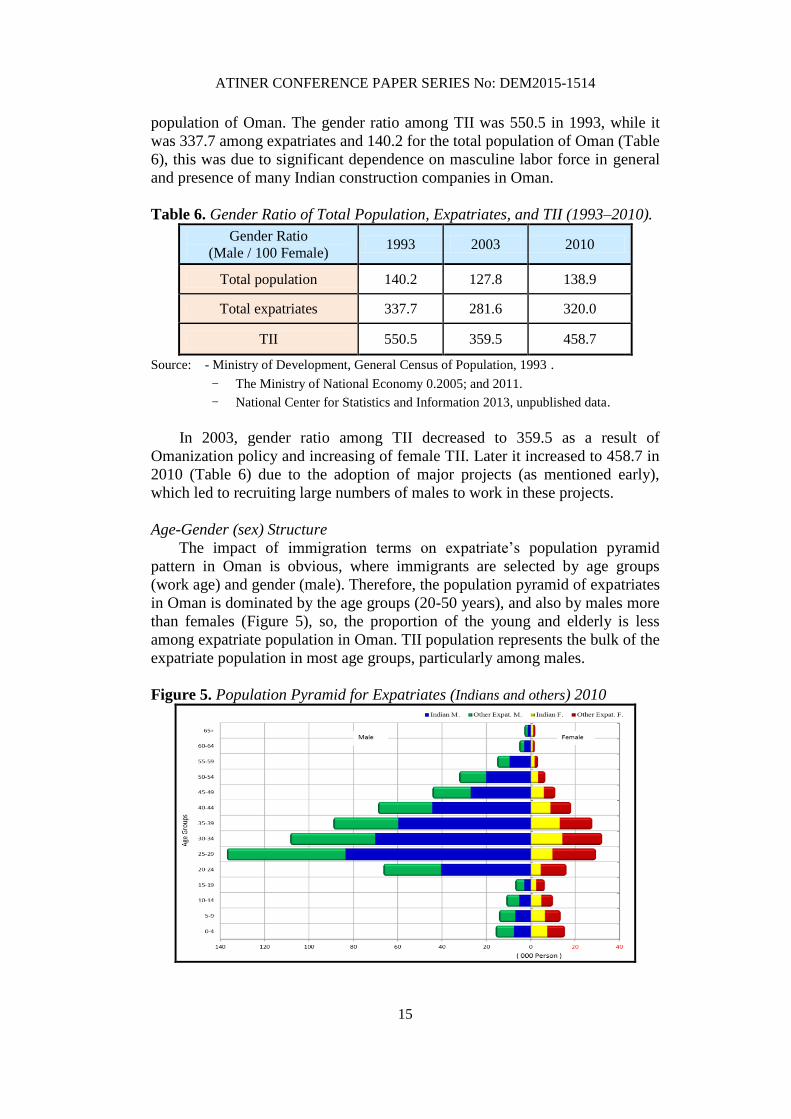
Age-Gender (sex) Structure
The impact of immigration terms on expatriate’s population pyramid
pattern in Oman is obvious, where immigrants are selected by age groups
(work age) and gender (male). Therefore, the population pyramid of expatriates
in Oman is dominated by the age groups (20-50 years), and also by males more
than females (Figure 5), so, the proportion of the young and elderly is less
among expatriate population in Oman. TII population represents the bulk of the
expatriate population in most age groups, particularly among males.
Figure 5. Population Pyramid for Expatriates (Indians and others) 2010

ATINER CONFERENCE PAPER SERIES No: DEM2015-1514
16
The number of TII has increased in all age groups in both sexes from 1993
to 2010 (Figure 6). However, the big increase was in the male ones especially
in age groups (20-30 years). This could be attributed to the introduction of
major projects (mentioned early) which lead to recruiting large numbers of
males. This shows that the Omani labor market still prefers Indian workers to
other nationalities workers.
Figure 6. Population Pyramid of TII in Oman, (a comparison between 1993 and
2010).
Educational Status of TII
The nature of development projects attracting immigrants plays an
important role in selecting TII level of education. For example, work in
agriculture, the environment (cleanliness) and a construction sectors does not
require high levels of education. Therefore, there is a large number of illiterate
workers as well as those who have basic reading and writing skills and others
who hold high educational certificates among TII (Figure 7).

ATINER CONFERENCE PAPER SERIES No: DEM2015-1514
17
Figure 7. Educational Status of TII by Gender in 2010 (+10 years)
The data also indicated that TII holding university degree were not less
than 37 thousand people, these are medical doctors at government and private
hospitals, engineers and managers. Additionally, there are more than 12
thousand people who have postgraduate qualifications (Figure 7), they are
university professors and experts in ministries, government and private
institutions.
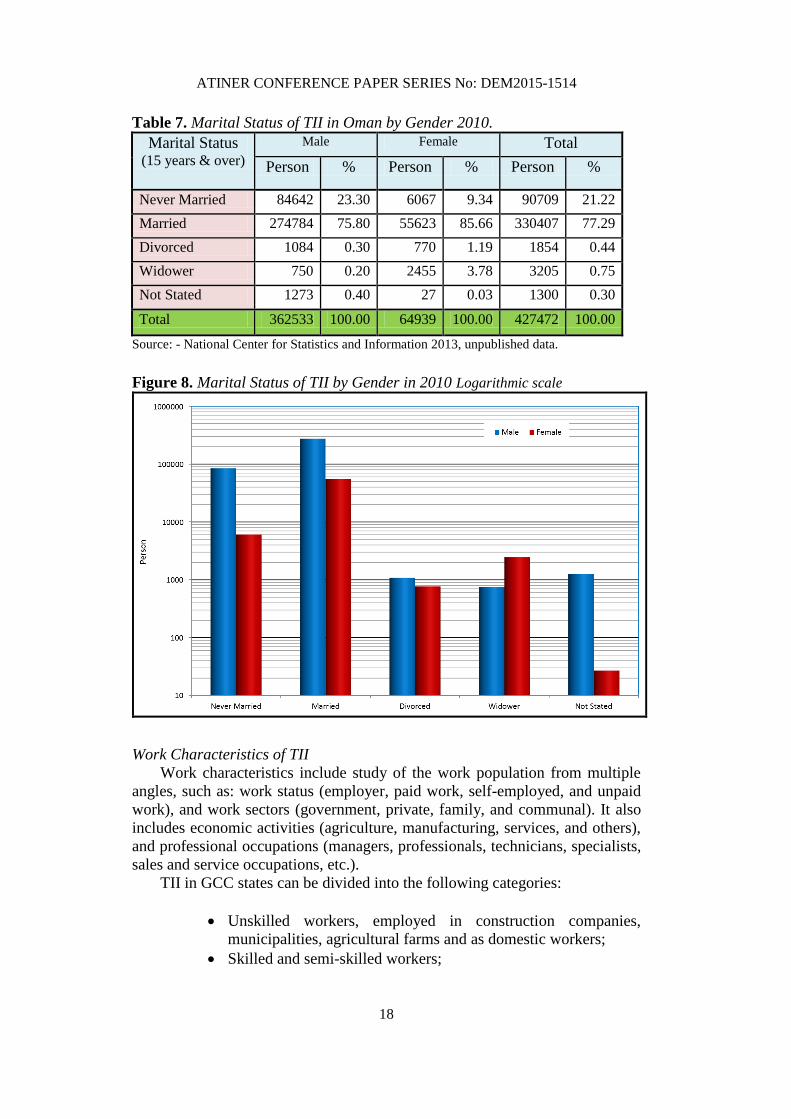
TII Marital Status
In general, the majority of TII (15 years and above) were married
(77.29%) in 2010 (Table 7), while the proportion of those who were not
married was only 21.22%. This is due to the fact that most of TII were over the
age of 15 years (age of marriage).
The marital status of TII data in 2010 indicated a strange inconsistency
where the number of married males was more than the number of married
females by about 219161 people (Figure 8). This was due to the fact that the
majority of married male TII migrated to Oman without their wives and
families.
ATINER CONFERENCE PAPER SERIES No: DEM2015-1514
18
Table 7. Marital Status of TII in Oman by Gender 2010.
Marital Status (15 years & over)
Male Female Total
Person % Person % Person %
Never Married 84642 23.30 6067 9.34 90709 21.22
Married 274784 75.80 55623 85.66 330407 77.29
Divorced 1084 0.30 770 1.19 1854 0.44
Widower 750 0.20 2455 3.78 3205 0.75
Not Stated 1273 0.40 27 0.03 1300 0.30
Total 362533 100.00 64939 100.00 427472 100.00
Source: - National Center for Statistics and Information 2013, unpublished data.
Figure 8. Marital Status of TII by Gender in 2010 Logarithmic scale
Work Characteristics of TII
Work characteristics include study of the work population from multiple
angles, such as: work status (employer, paid work, self-employed, and unpaid
work), and work sectors (government, private, family, and communal). It also
includes economic activities (agriculture, manufacturing, services, and others),
and professional occupations (managers, professionals, technicians, specialists,
sales and service occupations, etc.).
TII in GCC states can be divided into the following categories:
Unskilled workers, employed in construction companies,
municipalities, agricultural farms and as domestic workers;
Skilled and semi-skilled workers;

ATINER CONFERENCE PAPER SERIES No: DEM2015-1514
19
Professionals, such as doctors, engineers, accountants, nurses
and paramedics, employed in government and private sectors;
and
Businessmen/entrepreneurs (Kohli, Neha, 2014, p: 120).
Work Status
The number of Indians businesses owners in 2010 in Oman was 1681
employers, representing 51.5% of the total expatriate business owners, and
12.9% of the total business owners in Oman (Table 8). This shows the
influence of TII in the Omani labor market. They own car repair workshops,
and electrical appliances, textiles, and golden jewelry stores, as in Ruwi
(Figure 9) and Mutrah of Muscat governorates.
Table 8. Work Status of TII among Expatriates and Total Workers in Oman in
2010
Work Status
(15 years & over)
TII % of the total
expatriates
% of total
workers in
Oman Person %
Employer 1681 0.4 51.5 12.9
Own Account Worker 1248 0.3 41.1 4.0
Paid Employee 382350 99.1 59.3 36.1
Unpaid worker 764 0.2 60.0 29.1
Total 386043 100.0 59.2 35.1
Source: Ministry of National Economy, 2011; and the National Center for Statistics and
Information 2013, unpublished data.
The number of Indian paid workers was 382350 in 2010, representing
99.1% of the total Indian workers, 59.3% of the total expatriate paid workers,
and 36.1% of the total paid workers in Oman in 2010. Most of them are
working in the private sector, where they work in all retail stores, cafes and
homes even in farms, and they control many sectors of the Omani labor
market, for the reasons mentioned earlier, such as low wages .. etc.

ATINER CONFERENCE PAPER SERIES No: DEM2015-1514
20
Figure 9. Friday (Indian day) in Ruwi (Muscat Governorate)
Source: by researcher December 2014.
Work Sectors
The number of TII in Omani government institutions in 2010 was 12837
workers, representing 45.5% of the total expatriate workers in the government
sector, and 4.8% of the total workers in the same sector (Table 9). While the
number of TII in the private sector in Oman was 344770 workers, representing
89.3% of the total Indian workers, and 67.5% of the total expatriates working
in the Omani private sector, and 50.1% of the total workers in the private sector
in Oman in 2010.
Table 9. Work Sector of TII among Expatriates and Total workers in Oman in
2010
Work Sector
(15 years & over)
TII % of the total
expatriates
% of total workers in
Oman Person %
Public 12837 3.3 45.5 4.8
Private 344770 89.3 67.5 50.1
Family 27087 7.0 24.9 19.9
Communal 304 0.1 25.9 9.7
Others 491 0.1 23.1 11.3
Not stated 554 0.2 49.6 48.8
Total 386043 100.0 59.2 35.1
Source: Ministry of National Economy, 2011; and the National Center for Statistics and Information
2013, unpublished data.

ATINER CONFERENCE PAPER SERIES No: DEM2015-1514
21
It also shows that about 7.0% of the total Indian workers, representing
24.9% of the total expatriates in the Family sector and 19.9% of the total
workers in the same sector in Oman in 2010.
It can be concluded from the aforementioned data that most Indians work
in the private sector, and they occupy half of the positions in this sector in
Oman. This indicates that Indian workers in the Omani labor market enjoy
privilege. It turns out that there is quite a number of Indians work in family
sector, which shows that there is a number of Indian families owning projects
and institutions in of Oman.
Economic Activity
Indian labor force occupies a number of economic activities in Oman,
including: construction sector, which has 196840 workers, representing 51.0%
of the total Indian labor (Table 10), 75.4% of the total expatriates and 70.1% of
the total workers in the said sector in 2010.
There are about 14746 Indians work in hotels and restaurants, representing
60.1% of the total expatriate workers and 49.5% of the total employed in this
activity in 2010. It can be seen that the Indian labour exists in large proportions
in activities such as: Wholesale and retail trade; motor vehicles repair,
manufacturing, real estate and business activities, and electricity, gas and water
supply (Table 10), in addition to some other miscellaneous activities.
It can be concluded from the above data, Indian labor force occupies
several sections of economic activity in the Omani labor market.
Table 10. Economic Activity of TII among Expatriates and Total Workers in
Oman in 2010
Economic Activity
(15 years & over) TII % of the total
expatriates
% of total
workers in
Oman Person %
Agriculture, hunting and
forestry 4672 1.20 10.50 9.40
Fishing 396 0.10 40.40 5.30
Mining and quarrying 15905 4.12 76.70 35.10
Manufacturing 23640 6.12 52.40 38.20
Electricity, gas and water
supply 6425 1.70 73.30 37.50
Construction 196840 51.00 75.40 70.10
Wholesale and retail trade;
repair of motor vehicles,
and personal & household
goods
48330 12.52 64.00 40.30
Hotels and restaurants 14746 3.82 60.10 49.50
Transport, storage and
communications 7478 1.94 51.90 15.90
Financial intermediation 1992 0.50 70.10 14.00

ATINER CONFERENCE PAPER SERIES No: DEM2015-1514
22
Real estate, renting and
business activities 13540 3.50 74.60 39.20
Public administration and
defense; compulsory social
security
8538 2.20 48.00 4.10
Education 3581 0.90 30.30 6.40
Health and social work 6145 1.60 64.40 25.40
Other community, social
and personal service
activities
3951 1.00 44.10 33.20
Activities of private
households as employers
and undifferentiated
production activities of
private households
25360 6.60 31.50 30.80
Extra-territorial
organizations and bodies 151 0.05 27.40 20.30
Not stated, not sufficiently
defined 4341 1.13 64.40 48.80
Total 386031 100.00 59.20 35.10
Source: Ministry of National Economy, 2011; and the National Center for Statistics and
Information 2013, unpublished data.
Main Occupation The data showed that 28.2% (14540 employees) were Indians,
representing 63.2% of the total number of expatriates workers occupying
administrative directors, managers businesses and investors in Oman in 2010
(Table 11).
However, the principle and secondary engineering occupations are
considered the main occupations of Indians in Oman, where their number in
2010 was 207827 workers (53.8% of the total Indian workers) representing
71.5% of the total number of expatriate and 58.5% of the total employees
occupying the said.
A large numbers of Indians also work in occupations such as: technical,
scientific and facilities specialists, sales occupations, industrial, chemical and
food industries occupations.
We can conclude from the above that the Indian labor force occupies
important and influential occupations such as all kinds of engineering
occupations, services, technicians, sales and others in the Omani labor market.

ATINER CONFERENCE PAPER SERIES No: DEM2015-1514
23
Table 11. Percentage of main Occupations of TII and Expatriates and Total
Workers in the Oman in 2010
Main Occupation
(15 years & over) TII % of the
total
expatriat
es
% of total
workers in
Oman Person %
Administration Directors, Managers
and Working Investors 14540 3.80 63.20 28.20
Scientific, Technical and Human
Matters Specialists 25558 6.60 53.30 22.10
Scientific, Technical and human
Subjects Technicians 24686 6.40 72.20 27.60
Clerical Occupations 4968 1.30 70.70 9.20
Sales Occupations 17852 4.60 66.60 33.80
Services Occupations 68183 17.60 47.90 33.60
Agriculture, Stock-Breeding,
Aviculture and Hunting
Occupations
6104 1.60 12.60 10.00
Industrial, Chemical and Food
Industries Occupations 14315 3.70 52.00 35.40
Principal and Auxiliary
Engineering Occupations 207827 53.80 71.50 58.50
Not Classified/Unknown
Occupations 2010 0.50 43.50 2.60
Total 386043 100.00 59.2 35.10
Source: Ministry of National Economy, 2011; and the National Center for Statistics and
Information 2013, unpublished data.
The Future of TII in Oman
The projection of population provides a great deal of data about the future
of population, which helps decision-makers to formulate economic and social
policies scientifically. Government institutions need these kinds of studies to
use in planning to satisfy the needs of various sectors of society, such as
education, health care, workforce, housing and other services.
The process of projection of the size of TII in this study depends on the
method of annual growth rate scenarios (as mentioned early in methodology).
Therefore, the projection of TII according to annual growth rate depend on
three scenarios, such as: optimistic scenario (low growth rate), moderate
scenario (average), and pessimistic scenario (high).
TII in Oman has reached 465660 people in 2010, with annual growth rate
of about 6.2% in (2003-2010 census), (while the Omani population annual
growth rate was 1.34%). Based on these data, the size of TII in Oman has been
predicted in the future (2020-2050) according to three scenarios as shown at
the table: 12.

ATINER CONFERENCE PAPER SERIES No: DEM2015-1514
24
Data projections indicate that if Oman continued to depend on Indian labor
with the current growth rate (6.2% pessimistic scenario), the size of TII will
rapidly exceed 1.5 million by 2030 (Table 12). It can also go up to more than
five million by 2050, if the current status continues which leads to attract large
numbers of Indian workers.
Table 12. Prediction Scenarios of TII in Oman (2020-2050) (People)
Year
Optimistic
scenario
(AGR 2.2 %)
Moderate
scenario
(AGR 3.2 %)
Pessimistic
scenario
(AGR 6.2 %)
Difference
between
O & P
2020 578866 638066 849795 270929
2030 719593 874304 1550813 831220
2040 894532 1198007 2830118 1935586
2050 1112000 1641558 5164755 4052755
O & P = Optimistic and Pessimistic. AGR = Annual Growth Rate
Note: Projected population calculated according to the prediction equation which:
Projected population = Log (latest census) + No. of years × Log (1 + growth rate)
Source: Own calculation using Excel 2010.
However, in case that Oman adopts the policy of reducing relying on
Indian labor and expanding Omanization policy (optimistic scenario, growth
rate 2.2%), the size of TII will not exceed one million before 2050 (Table 12).
The data indicates that the difference in the size of TII in Oman in 2050,
between the adoption of the pessimistic scenario (6.2%) and the optimistic
scenario (2.2%) will reach about four million people (Table 12)., which is
considered to be a very large number and it will lead to more demographic
imbalance in population size, age, gender, workforce, and unemployment
levels.
Discussion
The results show that TII enjoy a significant preference in the Omani
labour market, where:
Indians are the largest among all communities working in Oman, and their
size reached nearly half a million in 2010, representing 57.1% of the total
expatriates.
Indian labor force occupies a number of economic activities in Oman,
including: construction sector where about 51 % of the total Indian labor,
representing 70.1% of the total workers in the same sector in 2010.
In addition, Indian labor force occupies a great number of positions in the
Omani labour market such as, the primary and secondary engineering
occupations, where about 53.8% of the total Indian labor force, representing
58.5% of the total workers in the same occupations in this sector in 2010.

ATINER CONFERENCE PAPER SERIES No: DEM2015-1514
25
Indian labor force controls the private sector in Oman, where 50.1% of the
total workers in the private sector in 2010 were Indians.
Moreover, the study shows that Indians business owners in Oman
represented 12.9% of the total business owners in 2010.
Therefore, the study accepts the affirmative hypothesis that “Omani labor
market prefers Indian workers to other expatriates” and refute the null
hypothesis that “Omani labor market does not prefer Indian workers to other
expatriates”.
The study also showed that: despite the Omanization policy, the number of
expatriates in Oman continues to increase, where it was 534848 people in 1993
and became 816143 people in 2010, and the number of Indians also rose from
267584 in 1993 to 465660 people in 2010. The major projects adopted by the
Omani government, (as mentioned early) continued to play a great role in
bringing large numbers of male immigrants, especially Indians.
Therefore, the study asserts the null hypothesis that “Oman might not
dispense all expatriate workers, including Indians due to adopting Omanization
policy”, and refute the affirmative hypothesis that “Oman might dispense all
expatriate workers, including Indians, due to adopting Omanization policy”.
To sum up, it can be seen from the above results and discussions that it is
obvious that the Omani labor market cannot do without Indian labor force, at
least in the foreseeable future. On other hand, the large increase in the number
of foreign workers in general will lead to more demographic imbalance in
population size, age, gender, workforce, and it will, in turn, lead to a
considerable increase unemployment rates among Omanis.
Recommendations
The study recommends adopting a long-term of Omanisation policy, where
it can replace expatriate labor force, especially Asians, by nationals after
striking a balance between education outputs and the Omani labor market
requirements.
References
Arabic References
National Centre of Statistics, the United Arab Emirates. (2012).
National Centre for Statistics and Information. (2013). Unpublished Data about
Expatriate in Oman, according to the 2010 census .
Al-Zhlol, Saleh A. (April 2003). Population Growth and the Future of Urban
Development in the GCC Countries, (Al-Nmow al-Sokani w mostqbal al-Tanmya
al-Hadarya bdwal magls al-Tawen al-Khalegi) Journal of the Gulf and Arabian
Peninsula Studies, Council of Scientific Publications, Kuwait University, Issue:
109 (43-83).

ATINER CONFERENCE PAPER SERIES No: DEM2015-1514
26
Al-Wasat Bahraini newspaper. (2012). Issue: 3503, Tuesday, April 10, 2012.
The Cooperation Council for the Arab States of the Gulf, the Secretariat General.
2007. Statistical Bulletin, No. 15, information center, Statistics Department,
Riyadh.
The Cooperation Council for the Arab States of the Gulf, the Secretariat General.
(2011). Statistical Bulletin, No. 19, information center, Statistics Department,
Riyadh.
The Council of Health Ministers of the Gulf Cooperation Council, the Executive
Office. (2005). Vital Health Indicators of the GCC Countries (Al-Moashrat al-
Sehya al-Haiwya le dwal magls al-Tawn), No. 11, Riyadh.
Statistics Centre. (2012). Qatar.
Department of Statistics and Information. 2012. Saudi Arabia.
Hendawy, Gamal M. (August 2008). The GCC Countries: Between the Need for
Foreign Workers and Demographics Imbalance on the Gulf (Dewal magls al-
Tawn le dawl al-Khaleg al-Arabya ben Al-haga lel amala al-Wafda w al-Khalal
fe al-Tarkeba al-Sokanya), ARAA Magazine, the Gulf Research Center, No. 47,
United Arab Emirates, pp: 18-23.
Hendawy, Gamal M. (Jan. 2012). Demographic Imbalance in the Gulf Cooperation
Council (GCC): Its Causes, Symptoms and Consequences (Al-Khalal fe bad
gwaneb al-Tarkebya al-Sokanya bdwal magls al-Tawn al-Khalegi: asbabo w
mazhroh w nataego), the Faculty of Arts Research Journal, Menoufiya
University, Egypt, Year: 23, Issue: 88, pp: 577-625.
Ministry of National Economy. (2005). General Census of Population, Housing and
Establishment of 2003, The Results of the Census at the Level of the Sultanate,
the first volume, Muscat, Oman.
Ministry of National Economy. (2011). The Most Important Results of the 2010
Census, Muscat, Oman.
Ministry of Development. (1993). General Census of Population, Housing and
Establishment of 1993, Muscat, Oman.
References in English
Al-Harthy, Hassain. (2000). International Labour Migration: the case of the Sultanate
of Oman, unpublished PhD. Thesis, University of kent, UK.
Allen, C. jr. (1981). The Indian Community of Mascat, Bulletin of the School of
oriental and African studies, 4 (1), pp: 39-53.
De Bel-Air, Françoise. (2014). “Demography, Migration, and Labour Market in
Qatar,” Explanatory Note No. 8/2014, Gulf Labour Market and Migration
(GLMM), Programme of the Migration Policy Center (MPC) and the Gulf
Research Center (GRC), http:// gulfmigration.eu.
Deffner, V. & Pfaffenbach, C. (2011). Zones of Contact and Spaces of Negotiation:
The Indian Diaspora in Muscat (Sultanate of Oman). Paper presented at the
International RC21 conference 2011 Session nr. 28: Living with difference.
Retrieved from http://www.rc21.org/conferences/amsterdam 2011.
Ginu Zacharia Oommen & Khurshid Imam. (2010). India’s ‘Look West’ Policy and Its
Impact on India‐ GCC Relations, International Politics, Vol. 3, No. VI, Summer
& Autumn 2010, pp: 71-105.
Jureidini, Ray. (2014). “Arab Gulf States: Recruitment of Asian Workers,”
Explanatory Note No. 3/2014, Gulf Labour Market and Migration (GLMM)

ATINER CONFERENCE PAPER SERIES No: DEM2015-1514
27
Programme of the Migration Policy Center (MPC) and the Gulf Research Center
(GRC), http:// gulfmigration.eu.
Kapiszewski, A. (2004). Arab Labour migration to the GCC States. Regional Conference
on Arab Migration in a Globalized World. League of Arab States and International
Organization Migration in Cairo, EGYPT, SEP 02-04, 2003.
Kohli, Neha. (2014). Indian Migrants in the Gulf Countries, in Dahiya, Rumel. (2014).
Developments in the Gulf Region: Prospects and Challenges for India in the Next
Two Decades, Institute for Defence Studies and Analyses, New Delhi, Pentagon
press.
Lefebvre, Jeffrey A. (2011). Omanʹs Foreign Policy in the Twenty‐First Century,
Middle East Policy Council, available at: http://www.mepc.org/journal/middle‐ east‐policy‐archives/omansforeign‐policy‐twenty‐first.
Mohammed, Nadeya S. A. (2003). Population and Development of the Arab Gulf
States: The Case of Bahrain, Sultanate of Oman and Kuwait, Ashgat, England.
Pasha, A. K. (2003). South Indian and Gulf: Trade and Diplomacy during the late
Eighteenth century, in N. M. Vohra (ed), History, Culture and society in India
and west Asia, New-Delhi, Shipra Publications.
Peterson, J. E. (2007). Historical Muscat: an Illustrated Guide and Gazeteer,
Handbook of Oriental Studies, Section 1, Vol. 88, Boston, Brill Academic
publishers.
Pradhan, Prasanta Kumar. (2014). India and the Gulf: Strengthening Political and
Strategic Ties, in Dahiya, Rumel. (2014). Developments in the Gulf Region:
Prospects and Challenges for India in the Next Two Decades, Institute for
Defence Studies and Analyses, New Delhi, Pentagon press.
Rizvi, M. Mahtab Alam. (2014). India’s Trade Relations with Gulf Cooperation
Council (GCC) States, in Dahiya, Rumel. (2014). Developments in the Gulf
Region: Prospects and Challenges for India in the Next Two Decades, Institute
for Defence Studies and Analyses, New Delhi, Pentagon press.
United Nations. (2010). Department of Economic and Social Affairs, Population
Division, International Migration 2009, Excel Sheet.
Vaidya, Sunil K. (August 4, 2008). India‐Sultanate of Oman Non‐oil Trade to Cross
$2b This Year, Gulfnews.com.