Embed Size (px)
Citation preview

ATHABASCA UNIVERSITY
OVERESTIMATION OF DONATION AMOUNT IN CAUSE-RELATED MARKETING
BY
KEHINDE ATERE
A DISSERTATION
SUBMITTED TO THE FACULTY OF GRADUATE STUDIES
IN PARTIAL FULFILLMENT OF THE REQUIREMENTS FOR THE DEGREE OF
DOCTOR OF BUSINESS ADMINISTRATION
FACULTY OF BUSINESS
ATHABASCA, ALBERTA
DECEMBER, 2020
© KEHINDE ATERE

The future of learning.
ii
Approval of Dissertation
The undersigned certify that they have read the dissertation entitled
CONSUMER OVERESTIMATION OF DONATION AMOUNT IN CAUSE-
RELATED MARKETING CAMPAIGNS: EFFECT OF MULTIPLE CAUSE PORTFOLIO
SIZE AND FRAMING
Submitted by:
Kehinde Atere
In partial fulfillment of the requirements for the degree of
Doctor of Business Administration
The examination committee certifies that the dissertation
and the oral examination is approved
Co-Supervisors:
Dr. Shaun McQuitty
Athabasca University
Dr. Anne Lavack
Thompson Rivers University
Committee Member:
Dr. Simon Sigué
Athabasca University
External Examiner:
Dr. Walter Wymer
University of Lethbridge
December 1, 2020

iii
Acknowledgements
I would like to acknowledge the following people for their contribution to the
preparation of this thesis:
• Dr. Shaun McQuitty – My Supervisor, for his guidance, timely comments and attention
to detail.
• Dr. Anne Lavack – My Co-Supervisor extraordinaire, for her encouragement, patience,
and her unfailing support despite several challenges throughout this journey.
• Dr. Simon Sigué – For generously giving his time to provide comments at different
stages of the research.
I would also like to extend my gratitude to Dr. Kay Devine and Dr. Kai Lamertz, for
their kind considerations when I needed support, and to my friend Ayo Peters, for his words of
encouragement to never give up on my dreams.
Most importantly, I would like to thank my family, Esther, David, Daniela and Davina
for their love and for everything. I could not have done this without them.

CONSUMER OVERESTIMATION OF DONATION AMOUNT
iv
Abstract
Research evidence suggests that people are generally inclined to overestimate the effectiveness
of their contribution to the public good. In the context of cause related marketing (CRM)
campaigns, cognitive bias resulting from the complexity of the judgmental task involved in
interpreting the donation information can lead to overestimation of the donation amount.
However, previous research in this area of CRM has mostly been focused on CRM campaigns
where a firm ties in with a single cause. This study aims to extend research in this area to further
explore the impact of CRM portfolio characteristics (framing and size) on cognitive bias in
consumer judgment and decisions. The experiment investigates whether the degree of
consumer overestimation of the CRM donation amount varies with an increase in the size of a
cause portfolio, as well as the impact of portfolio evaluation framing on overall consumer
overestimation of the donation. Results revealed no significant effect of portfolio size nor
portfolio framing in overestimation. However, there were indications that some interactions
with regards to overestimation may exist between small and large portfolio sizes under medium
negative affect conditions.
Keywords: cause-related marketing, donation amount, overestimation, portfolio size,
framing

CONSUMER OVERESTIMATION OF DONATION AMOUNT
v
Table of Contents
Approval of Dissertation ....................................................................................................... ii
Acknowledgements .............................................................................................................. iii
Abstract ............................................................................................................................... iv
Table of Contents .................................................................................................................. v
List of Figures ..................................................................................................................... vii
Chapter 1. Introduction ......................................................................................................... 1
Background ....................................................................................................................... 1
Rationale for the Research ................................................................................................. 7
Statement of the Problem ................................................................................................. 11
Research Questions ......................................................................................................... 13
Chapter 2. Literature Review ............................................................................................... 18
Overview of Biases in Decision Making .......................................................................... 21
Extant Research on Overestimation Bias.......................................................................... 23
Examination of Ethical Literature on Cause Related Marketing ....................................... 26
Theoretical Framework .................................................................................................... 29
Definitions and Measures of Focal Constructs of Study ................................................... 39
Chapter 3. Methods ............................................................................................................. 41
Research Design .............................................................................................................. 41
Pre-Test Methodology and Results .................................................................................. 43
Main Experiment ............................................................................................................. 47
Survey Instrument ........................................................................................................... 60
Response Rate ................................................................................................................. 61
Data Analysis .................................................................................................................. 62
Validity and Reliability .................................................................................................... 63
Ethical Considerations ..................................................................................................... 66
Chapter 4. Results ............................................................................................................... 67
Data Analysis .................................................................................................................. 67
Hypothesis 1 .................................................................................................................... 68
Hypothesis 2a & 2b ......................................................................................................... 71
Hypothesis 3 & 4 ............................................................................................................. 79
Chapter 5. Discussion .......................................................................................................... 87
Nonsignificant Findings ................................................................................................... 91
Limitations of Study ........................................................................................................ 93
Future Directions ............................................................................................................. 95
Literature References .......................................................................................................... 99

CONSUMER OVERESTIMATION OF DONATION AMOUNT
vi
Appendix 1: Pre-Test Questionnaire .................................................................................. 134
Appendix 2: Example of Main Experiment Questionnaire ................................................. 142
Appendix 3: Research Ethics Board (REB) Approval ........................................................ 153

CONSUMER OVERESTIMATION OF DONATION AMOUNT
vii
List of Figures
Figure 1 Examples of 12 Multiple Cause CRM Campaigns Run by Top Fortune 500
Companies ........................................................................................................................... .5
Figure 2 Conceptual Framework ......................................................................................... 38
Figure 3 Focal Constructs Definitions ................................................................................. 39
Figure 4 Demographics of the Pre-Test ............................................................................... 44
Figure 5 Charities Ranking Based on Pre-Test Results ........................................................ 45
Figure 6 Favorability - Familiarity Matrix ........................................................................... 46
Figure 7 Charity Portfolio Assignments............................................................................... 47
Figure 8 Description of Type I and Type II Errors ............................................................... 50
Figure 9 Vague CRM Donation Quantifier Advertisements Manipulated by Cause Portfolio
Size ..................................................................................................................................... 53
Figure 10 Estimable CRM Donation Quantifier Advertisements Manipulated by Cause
Portfolio Size ...................................................................................................................... 54
Figure 11 Calculable CRM Donation Quantifier Advertisements Manipulated by Cause
Portfolio Size ...................................................................................................................... 55
Figure 12 Design of Experiment for Testing Hypothesis 1 ................................................... 56
Figure 13 Design of Experiment for Testing Hypothesis 3 & 4 ............................................ 58
Figure 14 Scales Used to Measure the Variables ................................................................. 61
Figure 15 Distribution of Subjects in Experimental Cells .................................................... 67
Figure 16 Means and Standard Deviations – Hypothesis 1 ................................................... 69
Figure 17 ANOVA Results – Hypothesis 1 ......................................................................... 70
Figure 18 Plot of Estimated Marginal Means – Hypothesis 1 ............................................... 71
Figure 19 PANAS Factor Analysis ...................................................................................... 72
Figure 20 Positive Affect Distribution ................................................................................. 73
Figure 21 Negative Affect Distribution ............................................................................... 73
Figure 22 PANAS Positive Affect Sub Scores ..................................................................... 74
Figure 23 PANAS Negative Affect Sub Scores ................................................................... 75
Figure 24 PANAS Positive Affect Scores ............................................................................ 76
Figure 25 ANOVA Results – PANAS Positive Affect ......................................................... 76
Figure 26 Plot of Estimated Marginal Means – PANAS Positive Affect .............................. 77
Figure 27 PANAS Negative Affect Scores .......................................................................... 78
Figure 28 ANOVA Results – PANAS Negative Affect ....................................................... 79
Figure 29 Plot of Estimated Marginal Means – PANAS Negative Affect ............................. 79
Figure 30 Means and Standard Deviations – Hypotheses 3 & 4 ........................................... 81
Figure 31 ANOVA Results – Hypotheses 3 & 4 .................................................................. 83
Figure 32 Plot of Estimated Marginal Means – Hypotheses 3 & 4 (Portfolio Size vs.
Quantifier) .......................................................................................................................... 83
Figure 33 Plot of Estimated Marginal Means– Hypotheses 3 & 4 (Evaluation Frame vs.
Quantifier) .......................................................................................................................... 84
Figure 34 Plot of Estimated Marginal Means – Hypotheses 3 & 4 (Evaluation Frame vs.
Portfolio Size) ..................................................................................................................... 84

CONSUMER OVERESTIMATION OF DONATION AMOUNT
viii
Figure 35 T-Test Means and Standard Deviations – Evaluation Frame ................................ 85
Figure 36 T-Test Results – Evaluation Frame ...................................................................... 86
Figure 37 Effect Sizes ......................................................................................................... 91
Figure 38 Correlation Matrix that Shows Degree of Association between Variables ............ 92

CONSUMER OVERESTIMATION OF DONATION AMOUNT
1
Chapter 1. Introduction
Background
Cause related marketing (CRM) is described as a form of “collaborative philanthropy”
(File & Prince, 1998), whereby social causes are supported by profit-oriented firms as a result
of “customers’ engaging in revenue-producing transactions with the firm (exchange of goods
and services for money)” (Varadarajan & Menon, 1988). The resultant effect is a win-win-win
situation for all participants of the partnership – brand value is created for the for-profit firm,
funds are raised for the charity organization and consumers feel good about contributing to a
cause that makes a difference (Adkins, 1999a)
CRM is one of the six major types of Corporate Social Responsibility (CSR), including
Cause Promotions, Corporate Social Marketing, Corporate Philanthropy, Employee
Engagement and Socially Responsible Business Practices (Kotler & Lee, 2011). The key
distinction of CRM from the other five is its ability to establish a direct connection between
consumer behavior and corporate contribution levels to a particular cause (Kotler & Lee, 2011).
In their seminal work, Varadarajan and Menon (1988) define CRM as “the process of
formulating and implementing marketing activities that are characterized by an offer from the
firm to contribute a specified amount to a designated cause when customers engage in revenue-
providing exchanges that satisfy organizational and individual objectives”.
American Express is credited with pioneering CRM, when in 1983 it launched a cause
campaign event to raise funds for the restoration of the Statue of Liberty in New York
(Varadarajan & Menon, 1988). The company raised $1.7 million within three months through
its pledge to donate one cent for every transaction made with an American Express card, one
dollar for every newly opened American Express account and one dollar for every vacation

CONSUMER OVERESTIMATION OF DONATION AMOUNT
2
worth $500 or more sold at an American Express travel store (Williams, 1986). The event
yielded a 28% increase in card transactions and a 17% increase in new credit card accounts for
American Express (Adkins, 1999b).
CRM has mushroomed since then. Major manufacturers, retail chains, and financial
services companies, such as Wal-Mart, Ben & Jerry’s, Avon, Barclay’s, Cadbury, Kellogg’s,
Citibank, MasterCard International, RE/MAX, Procter and Gamble, The Home Depot, Target,
Timberland, and McDonald’s, all use CRM as a strategic marketing tool to influence customer
behavior. It has been regarded as one of the fastest growing forms of marketing (Berglind &
Nakata, 2005). Corporate cause related sponsorship spending in North America grew 20.2
percent between 2013 and 2018 to $2.14 billion, only behind Sports sponsorship, which grew
20.7 percent. A further 4.6 percent growth was predicted for 2019 (IEG Sponsorship Reports,
2013, 2018, 2019).
A 2010 Cone study exploring consumer attitudes and expectations of company support
for social and environmental issues suggests that 83% of Americans endorse CRM (Cone,
2010), while a similar study performed in 2015 indicates that as many as 90% would switch,
price and quality being equal, to a brand that supports a cause (Cone, 2015). The relatively
high popularity of CRM strategies with consumers stems from the perception that CRM
provides the means for consumers to leverage their relatively small contributions into major
corporate donations to support charitable causes, thereby making a big difference with minimal
transaction costs. Many large companies have jumped on the bandwagon of CRM. CRM has
become a mainstream business strategy, and certain high visibility causes like breast cancer
concerns, support for children and families and local community initiatives are drawing
substantial attention (Meyer, 1999).

CONSUMER OVERESTIMATION OF DONATION AMOUNT
3
Many companies are compelled to adopt innovative approaches to differentiate their
CRM programs to avoid being lost in the crowd. This is because consumers are becoming
increasingly sophisticated at scrutinizing authenticity of cause related marketing campaigns
(Anghel et al., 2011). According to a 2017 survey, when a company takes a stand on a social
or environment issue, as many as 56% of American consumers are willing to do the research
to find out for themselves if the efforts are consistent with the company’s activity (Cone, 2017).
For example, the Kentucky Fried Chicken (KFC) ‘Buckets For The Cure’ campaign was
labeled a failure due to perceived lack of authenticity between the sustained cause and its
activity. As part of the campaign, KFC donated 50 cents to the Susan G. Komen Breast Cancer
Foundation for every bucket of chicken ordered by restaurant operators. The problem was that
a bucket of KFC contains 2400 calories and 160 grams of fat. The program was abandoned due
to complaints that KFC and Komen were promoting unhealthy food to raise money for health
research (Minton & Cornwall, 2016). Similarly, Starbuck’s ‘Race Together’ campaign was
considered a fiasco (Procter, 2015). Race Together was an initiative from Starbucks and USA
Today that was designed to initiate discussion, compassion and action around race relations in
America. It failed because consumers perceived a lack of fit between the cause and the
organization (Procter, 2015). Some of the various approaches adopted include forging
exclusive alliances with causes, initiating worthy causes on their own (e.g., Canadian Tire
Jump Start, a national charitable program that helps financially disadvantaged kids participate
in organized sport and recreation; CIBC Children's Foundation, a national charity responsible
for distributing funds raised on CIBC Miracle Day), tying in with less visible/popular causes
or simultaneously tying in with a bundle of multiple causes in a branded portfolio (Varadarajan
& Menon, 1988). This study will focus on the latter approach: portfolio of causes.
According to Varadarajan and Menon (1988), a firm’s tie-in with a portfolio of causes
is necessitated by the need to appeal to the intense commitment to one of the causes by small

CONSUMER OVERESTIMATION OF DONATION AMOUNT
4
sub-segments of its constituencies, and the need to reach multiple market segments and
situations when causes have seasonal patterns of fund-raising efforts. The first known example
of this approach is Mastercard's ''Choose to Make a Difference'' campaign in 1987, in which
Mastercard users selected one of six cause-related institutions, to which money was allocated
from a total of $2.0 million. The company agreed to donate money each time a MasterCard
was used and the customers got to choose how the money was allocated among the six charities
by filling out ballots in their MasterCard statements. The recipient charities were AMC Cancer
Research Center, the National Committee for Prevention of Child Abuse, MADD (Mothers
Against Drunk Driving), the Muscular Dystrophy Association, the National Association on
Drug Abuse Problems, and the American Health Association (Marketing News, 1987). More
recent examples of corporate support for a smaller portfolio of multiple causes includes
RE/MAX Canada’s support for Children’s Miracle Network and Canadian Breast Cancer
Foundation, whereby a portion of commission from every home sale is donated to a local
affiliate of these two charities (Calgary Herald, 2014). Examples of 12 multiple cause CRM
campaigns run by top Fortune 500 companies in the past decade in Figure 1 below demonstrates
the prevalence of business involvement in CRM as a portfolio rather than the support of a single
cause.
One important characteristic of branded cause portfolios is the way they are organized.
Portfolios are organized around either localities or issues (Agrawal et al., 2016; Khalili, 2010).
Cause portfolio presentation mode or framing influences how they are evaluated by the
consumer. For example, locality focused CRM cause portfolios, such as the FedEx portfolio of
Memphis-based charities and US-based Mastercard's ''Choose to Make a Difference''
campaigns, tend to be presented with a narrow decision frame. In this case, consumers are able
to estimate donation amount based on an isolated evaluation of each cause in the portfolio in
such a way that interactions among multiple constituents are ignored in the consumer decision

CONSUMER OVERESTIMATION OF DONATION AMOUNT
5
(e.g., Kahneman, 2003; Kahneman & Lovallo, 1993; Liu & Chiu, 2015). In contrast, issue
focused CRM cause portfolios tend to be expressed with a broad decision frame, whereby the
consumer will integrate the overall effectiveness of the combined cause portfolio in his/her
estimation of the donation amount, as in the case of the Product RED initiative that supports
exclusively the Global Fund to fight AIDS, Tuberculosis and Malaria. Each Product RED
partner company (e.g., Hallmark, Dell, Apple, Motorola, Starbucks and Gap) is licensed to
create a product with the Product RED logo and a percentage of the profit is given to the Global
Fund in exchange for the opportunity to increase the company’s own revenue through the
Product Red products that it sells (Dadush, 2010).
Figure 1
Examples of 12 Multiple Cause CRM Campaigns Run by Top Fortune 500 Companies
Company (Campaign) CRM description
Macy’s (Scan-to-donate)
Donated up to a total of $250,000*, to DoSomething.org. to
encourage young people to volunteer for good social causes, such
as education, bullying and the environment, in their community.
(Tsiros & Irmak, 2020)
Subaru (Share the Love Event)
Donates $250 for every Subaru sold or leased during a six-week
period to the customer’s choice of the following charities:
ASPCAR, Make-A-Wish, Meals On Wheels Association of
America , and National Park Foundation (SUBARU “Share the
Love” (2015): www.media.subaru.com) (Lafferty, Lueth &
McCafferty, 2016; Tsiros & Irmak, 2020)
Amazon (Amazon “Smile”
campaign)
Donates 0.5% of the purchase price of products to the consumer’s
favorite charity, allowing the consumer to choose from nearly one
million organizations (Lafferty, Lueth & McCafferty, 2016)
Walmart (12 Days of Giving)
Wal-Mart Foundation, donates to disaster relief efforts, education
programs, immigration integration programs, and children’s
hospitals, among others (http://foundation.walmart.com) (Eilert &
Robinson, 2020)
H&M (All for Children)
Donates 25% of the retail sales price to help UNICEF provide
40,000 children living in Dhaka, Bangladesh, with improved access
to education and protection of their basic rights including
prevention of child labor (Tsiros & Irmak, 2020).

CONSUMER OVERESTIMATION OF DONATION AMOUNT
6
Newell Rubbermaid (Community
Investment Initiative)
Provides cash and in-kind contributions in three areas: providing
infants and children with a positive start and the tools to succeed;
education and professional advancement, including trade and
technical schools (Tsiros & Irmak, 2020).
National Football League
(Crucial Catch: Intercept Cancer)
Donates to American Cancer Society (ACS) ACS through the
partnership directed toward support of three screenable cancers:
breast, colorectal and cervical
Bank of America/ Apple/
Microsoft / Starbucks (Product
RED initiative)
Donates to Global Fund to fight AIDS, Tuberculosis and Malaria
(Tsiros & Irmak, 2020).
Whole Foods Market
(Communities Campaign)
Whole Foods Market’s three philanthropic foundations (Whole
Planet, Whole Kids, Whole cities) have combined forces to raise
awareness and funds, enabling shoppers to join the retailer in
efforts to alleviate global poverty, improve children’s nutrition and
increase healthy food access in communities facing barriers (Tsiros
& Irmak, 2020).
JCPenney (JCP CARES)
Every month the partner with a different charity to raise funds for
that cause – strengthening communities through youth
development, healthy living and social responsibility (Tsiros &
Irmak, 2020).
3M Post-it (City of Hope)
Donates to help fund research and treatment in the fight against
cancer, diabetes and other life-threatening diseases (Tsiros &
Irmak, 2020).
RE/MAX Canada (Children’s
Miracle Network/Yard Sale for
the Cure)
Children’s Miracle Network and Canadian Breast Cancer
Foundation (Calgary Herald, 2014),
Three clear themes have emerged in the study of CRM. According to Wu and Hung (2008),
CRM research is focused around the perspectives of the three key actors in a CRM program:
• Sponsoring company – CRM objectives, selection, performance and external
organizational impact
• Consumer – behavior, responses and attitudes towards CRM
• Non-Profit organization – Internal organizational impact of participation in CRM

CONSUMER OVERESTIMATION OF DONATION AMOUNT
7
In many studies, the CRM donation has been used as a reference point to explore the
perspectives of these key actors, given its critical underlying impact on the tactical and strategic
success of the company-cause-consumer interaction (Koschate-Fischer, Stefan & Hoyer, 2012;
Müller, Fries & Gendenk, 2014). Grau, Garretson and Pirsch (2007) outline four areas
involving these perspectives:
• Psychological characteristics of consumers driving the donation behavior
• Non-profit organization’s characteristics influencing the donation
• Consequences of CRM on the donor firm, as well as the consumer
• CRM campaign donation structure characteristics
Consistent with the first area stated above relating to psychological characteristics of
consumers, this research will explore how portfolio size and framing will impact cognitive bias
in consumer estimation of CRM donation amount within the context of a branded portfolio of
multiple causes.
Rationale for the Research
Extant research generally suggests that consumers have a favorable perception of CRM
initiatives. One stream of research posits that CRM promotions positively influence consumer
perception of the sponsoring firm’s behavior and consumer purchase intentions (Carringer,
1994; Hajjat, 2003; Kroll, 1996; Murphy, 1997; Ross, Patterson & Stutts, 1992; Ross, Stutts &
Patterson, 1990-1991; Smith & Alcorn, 1991; Webb & Mohr, 1998;). Another stream of
research probes further to examine the impact of the structural components of CRM initiatives
on consumer perception, focusing specifically on CRM donations.
Evidence suggests that, overall, a positive relationship exists between donation size,
consumer acceptance of CRM campaigns and perceived efficacy of their contribution – i.e.,

CONSUMER OVERESTIMATION OF DONATION AMOUNT
8
perception of benefit accruing to the non-profit organization (Dahl & Lavack, 1995; Hajjat,
2003; Moosmayer & Fuljahn, 2010; Strahilevitz, 1999; Subrahmanyan, 2004).
Other studies posit that donation message framing plays a significant role in consumer
perception of CRM campaigns. The central theme in these studies is that concrete or abstract
framing of a CRM donation message directly impacts consumer choice with regards to a
donation exchange, but with different outcomes (Das & Kerr, 2009).
According to Grau, Garretson and Pirsch’s (2007) exploratory study of various
elements of CRM campaigns, consumers prefer concretely framed donation information,
because it offers more tangible details to enable them to calculate the donation amount for
themselves and make an intelligent judgment for themselves as to whether their donation will
make a difference. In contrast, abstract messages are perceived as least trustworthy and least
preferred.
To gain a richer understanding of the effect of CRM donation message framing on
consumer perception, research has examined consumer confusion related to abstract CRM
donation message frames. Pracejus, Olsen and Brown (2004) elaborated on the types of
donation message framing, expressing framing in three broad categories of quantifiers - vague,
estimable and calculable. A vague quantifier is expressed in vague terms, providing the
consumer with little idea as to what is the actual amount being donated (e.g., does not state
what portion of proceeds will be donated). An estimable quantifier provides the consumer with
only some information to calculate the actual donation amount, but still includes some
unknowns (e.g., states the percentage of profit). A calculable quantifier provides tangible
information that allows the consumer to calculate the actual donation amount (e.g., states the
percentage of price). They concluded that abstract formats, expressed as a vague quantifier,
leads to consumer overestimation of donation amount to a CRM campaign and that this bias

CONSUMER OVERESTIMATION OF DONATION AMOUNT
9
occurs due to cognitive differences in how each individual interprets abstract terms found in
CRM donation messages when mapping them onto a numeric scale (Budescu & Wallsten,
1985; Fillenbaum et al., 1991; Wallsten et al., 1986).
Olsen, Pracejus and Brown (2003) focused on an estimable quantifier, arguing that two
theoretical mechanisms – Profit-equals-price (PEP) and Profit Overestimation (PO) – drive
consumer confusion and result in a near universal intuitive overestimation when donation
amounts are presented as a percentage of profit. The PEP mechanism is based on the tendency
of people to take computational shortcuts in a bid to simplify the complexity of an estimation
task, thereby leaving out relevant information demanded for the task environment (Eddy,
1982). Thus, additional ambiguity is brought to bear when donations are presented as a
percentage-of-profit. According to the research, percentage-of-profit is problematic because
consumers require a two-step calculation to arrive at the actual amount of money donated: first
estimate the profit as a percentage-of-price, and then calculate the amount donated as
percentage of profit. Therefore, a subset of the consumer population entirely overlooks the step
of estimating profit as only a small fraction of price and this leads to overestimation of the
donation amount. This argument is also consistent with how representativeness heuristics are
articulated in Kahneman and Tversky’s (1974) seminal work on heuristics and biases, where
they argue that sometimes the manner in which an object or event is represented makes one
insensitive to relevant information that may lead to a contrary outcome, such that the
information is overlooked in the process of simplifying the judgment of probabilities, and this
leads to biased conclusions (i.e., overestimation). The PO mechanism, on the other hand, is
based on the fact that consumers are often inclined to overestimate profit to an extreme extent
(Bolton, Warlop & Alba, 2003), which is exacerbated by the fact that consumers are rarely
provided actual profit information in CRM.

CONSUMER OVERESTIMATION OF DONATION AMOUNT
10
These studies speak to the underlying rationale for the current research for a couple of
reasons. Firstly, abstract donation message framing in the form of vague and estimable
quantifiers accounts for close to 96% of donation message formats used in CRM campaigns
(Pracejus, Olsen & Brown, 2004); therefore a study of their impact on consumer perception
could easily be projected to CRM campaigns in general. Secondly, the issue of transparent
portrayal of the actual amount being donated to CRM programs is receiving addition interest
from regulators and academia (Dadush, 2010; Hartmann, Klink & Simons, 2015; Langen et
al., 2011; Zheng, Zhu & Jiang, 2019). Studies indicate that the amount of the donation impacts
choices between brands (Pracejus, Olsen & Brown, 2004). When this differential choice
behavior occurs as a result of overestimation of the donation amount by the consumer, it
presents a potential cause for consumer skepticism towards the objectivity of CRM claims
(Webb & Mohr, 1998), with the further consequence of evoking decreased credibility of the
company/brand, decreased purchase intention of the product and speculation about deception,
which may lead policy makers to perceive a need for regulation (Darley & Smith, 1993; Edell
& Staelin, 1983; Holbrook, 1978; Kim & Lee, 2009; Olsen, Pracejus & Brown, 2003). Lastly,
this study is important because of the influence of portfolio size on audience outcomes when a
CRM advertisement features multiple recipient charities. Recent research suggests that
consumers are more likely to evaluate CRM campaigns lower when the cause portfolio is
focused (i.e., supports one issue) versus diverse (i.e., supports many issues) because focused
portfolio is perceived to have a weaker impact on the society (Eilert & Robinson, 2020;
Kabongo, Chang & Li, 2013). Against this background, understanding determinants of
consumer overestimation of the donation amount in the context of various CRM campaigns is
important for taking conscious mitigation steps, both from an individual consumer perspective
and from a public policy perspective.

CONSUMER OVERESTIMATION OF DONATION AMOUNT
11
Statement of the Problem
A Cone/Roper survey from 1999 indicated that eight out of 10 Americans prefer
companies committed to a single specific cause for a long period of time rather than companies
opting for multiple causes for a short period of time (Meyer, 1999). Obviously a different result
may have been obtained had the double-barreled survey question been rephrased as the
following: “Given an equal time period of commitment, do consumers prefer that companies
commit to a single cause, or commit to a portfolio of several causes?” This description
highlights the need for academic evidence regarding consumer attitudes toward CRM
campaigns involving multiple causes (i.e., a cause portfolio).
Evidence from prior research indicates consumer confusion when the CRM donation
information is expressed in abstract message frames (i.e., in vague or estimable formats), which
causes consumers to systematically adjust donation estimates upwards. This is due to a
cognitive bias related to inappropriate selection of an estimation strategy (Olsen, Pracejus &
Brown, 2003; Pracejus, Olsen & Brown, 2004). However, most research studies examining
this phenomenon had focused on CRM initiatives using only a single cause (Andrews et al.,
2014; Barone et al., 2007; Strahilevitz & Myers, 1998; Winterich & Barone, 2011). Very few
CRM research, to my knowledge and a search of article databases, has focused attention on the
framing effect within a multiple cause bundle framework (Koschate-Fischer, Huber, & Hoyer,
2015; Eilert & Robinson, 2020). Today, more firms are using multiple cause CRM portfolios
as a means of effectively reaching more diverse market segments (Lafferty, Lueth &
McCafferty, 2016, Wei & Liou, 2020); hence, understanding how cognitive bias in consumer
estimation of the CRM donation amount occurs in the context of a multiple cause portfolio is
critical. Research to date has not reviewed multiple cause CRM portfolios with the explicit
purpose of drawing inferences regarding cognitive bias in donation estimation.

CONSUMER OVERESTIMATION OF DONATION AMOUNT
12
Cognitive psychology suggests that there is a discrepancy between people’s judgments
when evaluating a decision problem in isolation and when considering a group of comparable
decision problems (Redelmeier & Tversky, 1990). The decision frame that people adopt is
influenced by the manner in which decision problems are presented to them (Langer & Weber,
2001; Liu & Chiu, 2015). This implies that when a portfolio is being evaluated for
attractiveness, different outcomes will be reached depending on whether each cause is
evaluated individually or as a group. People will give more weight to individual burdens and
benefits of each unit when segregated evaluation criteria is provided, while more weight will
be given to overall portfolio effectiveness when aggregate evaluation information is provided.
These differences in portfolio evaluation approaches also have implications for a multiple
cause portfolio in CRM, in terms of how to manage the fine balance between cause portfolio
evaluation framing aimed at appealing to the narrow interests of various sub-segments of its
constituencies versus framing the CRM donation message to ensure overall CRM portfolio
attractiveness to the average consumer.
Cognitive psychology research on the anchoring phenomenon suggests that an
individual’s estimations can be biased by exposure to anchors or arbitrary cues and
information that are irrelevant to the judgment that is being made (Brewer et al., 2007;
Mussweiller & Englich, 2003; Tversky & Kahneman, 1974). Furthermore, studies have
shown that anchors may not necessarily be numerical, but that physical quantities can also
serve as anchors for physical judgments (Kruger, 1999; LeBoeuf & Shafir, 2006).
Oppenheimer et al. (2008) further extend this position, suggesting that anchors can act cross-
modally, such that physical quantities can bias numerical judgment. According to this
research, the magnitude priming effect is the mechanism driving this cross-modal function of
anchors. Magnitude priming in essence means that regardless of modality of judgment,
people’s exposure to large or small anchors may prime the notion of their general magnitudes

CONSUMER OVERESTIMATION OF DONATION AMOUNT
13
(e.g., “largeness” or “smallness”) and that this activated sense of qualitative magnitude may
bias consequent estimation performance in accordance with that activated size (Oppenheimer
et al., 2008). This is also consistent with the view that people rely on a non-numerical sense
of magnitude during estimation strategy selection (Brown, 1994; Conrad, Brown & Cashman,
1993) and the selected estimation strategy could, in turn, influence estimation bias (Olsen,
Pracejus & Brown, 2003).
The view that magnitude priming causes anchors, such as physical quantities, to
function cross-modally in influencing numerical estimation bias has implications for how
portfolio size affects consumer estimation of corporate donation amount within CRM. A
better understanding of how portfolio size impacts consumer perception of corporate
donation amount will provide some guidance to marketers on how the overestimation bias
might be minimized while, at the same time, help more causes to effectively implement a
CRM campaign.
Research Questions
The effect of size on cognitive performance has received increasing research attention
recently, distinguishing between group-size, problem-size and sample-size effects (Anderson,
1959, 1967; Boven & Epley, 2003; Groen & Parkman, 1972; Kaplan, 1981; Kaufmann &
Betsch, 2009; Kerr, 1989; LeFevre, Sadesky & Bisanz, 1996; Shavitt, Sanbonmatsu,
Smittipatana, & Posavac, 1999; Treen et al., 2016). The group size effect refers to a decrease
in decision making efficiency when there is an increase in the size of the decision making group
involved in allocating public goods (Kerr, 1989). Decision making efficiency tapers off when
the optimal team size of five is exceeded (Treen et al., 2016). The problem size effect refers to
an increase in solution latencies and error rates for simple addition problems with a larger
solution size (i.e., 8+5 takes longer and is more error prone than 3+4), due to various aspects

CONSUMER OVERESTIMATION OF DONATION AMOUNT
14
of how stored arithmetic knowledge is represented in memory for cognitive processing (Groen
& Parkman, 1972; LeFevre, Sadesky & Bisanz, 1996). The sample-size effect, on the other
hand, refers to the sensitivity of judgment tasks to the size of the set of sampled information
(Anderson, 1959, 1967; Boven & Epley, 2003; Kaplan, 1981; Kaufmann & Betsch, 2009;
Shavitt, Sanbonmatsu, Smittipatana, & Posavac, 1999).
Further, studies have demonstrated that, under cognitive task such as estimation, people
tend to perform better at estimating with problems of small magnitude than for problems of
large magnitude (De Visscher et al., 2018). This is because people adjust their estimation
strategies to the problem size. Solving problems of large magnitude require subtle interference
from memory related similarities/overlap of physical trait which imposes additional steps, adds
to complexity of the task and increases the likelihood of error (De Visscher et al., 2018;
LeFevre, Greenham & Waheed,1993; LeFevre, Sadesky & Bisanz, 1996; Olsen, Pracejus &
Brown 2003; tiberghien et al., 2019). Its implication for social campaigns is reinforced by
Drumwright (1996), who stresses that social campaigns are more effective when they focus on
fewer causes. Therefore, the following research question arises:
RQ1 - Does cause portfolio size affect consumer overestimation of the CRM donation
amount?
In addition to the effect of size, the mode of representation (i.e., framing effect) of
decision problems appears to have an effect on judgment outcome (Einhorn & Hogarth,
1981; Newell & Simon, 1972). Studies related to probability judgments clearly demonstrate
the effect of mode of problem representation on judgement outcomes (Fischhoff, Slovic &
Lichtenstein, 1978; Tversky & Kahneman, 1980). For example, Fischhoff, Slovic and
Lichtenstein, (1978) conducted a study to demonstrate that information that people are
exposed to has a tendency to distort their perception of hazard. In that study, they asked

CONSUMER OVERESTIMATION OF DONATION AMOUNT
15
respondents to judge completeness of a fault tree listing failures that could cause a car not to
start when the ignition key was turned. Results indicated respondents evaluated completeness
about the same when looking at the tree with full list of causes of starting failures, as when
looking at tree with half of the causes deleted. Even trained automobile engineers were not
immune to this distortion. They were just as insensitive to the deletions from the fault tree as
lay people.
One important observation regarding studies examining the effect of decision problem
framing on consumer judgment is that they distinguish between a content-driven framing effect
and a structure-driven framing effect. Typically, in a single decision problem scenario, its
content will drive the framing effect on consumer judgment. For example, studies analyzing
single cause CRM have focused on the representation of the content of decision problems (i.e.,
message framing). Thus, framing the donation message in an absolute dollar amount versus the
percentage of the cause related purchase price or profit that will go to a designated cause will
directly impact the likelihood of consumer participation in a donation exchange (Das & Kerr,
2009). Pracejus, Olsen & Brown (2004) and Olsen, Pracejus and Brown (2003) extend this
logic, demonstrating that ambiguity in the framing of the donation message will cause a near
universal overestimation of the donation amount and will ultimately result in a differential
choice in consumer participation in a donation exchange.
On the other hand, in a multiple decision problem scenario, the structural context will
drive the framing effect on consumer judgment. Consumer and medical decision making
research analyzing consumer judgment situations with multiple decision problems have
focused primarily on structural context (i.e., joint versus separate framing and evaluation) to
explain the framing effect on judgment and decision outcomes (Hsee, Leclerc, 1998; Ku &
Hung, 2019; Kumar & Lim, 2008; Redelmeier & Tversky, 1992, Soman, 2004;

CONSUMER OVERESTIMATION OF DONATION AMOUNT
16
Venkatraman, Aloysius & Davis, 2006). This is because multiple prospects versus single
prospect is the prevalent class of decision consideration that people are faced with across a
broad spectrum of every-day life (Kahneman & Lovallo, 1993). For example, a decision not
to wear a helmet on a single trip on a motorcycle is unlikely, in isolation, to have a significant
consequence, but the decision to routinely avoid wearing a helmet is extremely likely to have
fatal consequences in the long term. Health consequences of smoking a single cigarette on
one night out with friends may be negligible, but a lifetime smoker faces a serious health risk
(e.g., Read, Loewenstein, & Rabin, 1999). Langer and Weber (2001), Hsee et al. (1999) and
Hsee and Leclerc (1998) posited that people make different judgments when individual
problems are presented in isolation and evaluated separately versus when a group of
problems is presented simultaneously and evaluated comparatively. According to Redelmeier
and Tversky (1990), this effect is due to differences in relative weights given to the attributes,
thus resulting in different outcomes.
In light of the above argument, the research question is:
RQ2- When donation amount is framed ambiguously, do consumers estimate the
donation amount differently when evaluating a portfolio of multiple causes in a joint
evaluation mode (i.e., presented simultaneously and evaluated comparatively) as
compared with when considering a portfolio of multiple causes in a separate evaluation
mode (i.e., presented in isolation and evaluated separately)?
In a seminal article entitled, “Small Wins: Redefining the Scale of Social Problems,”
Karl Weick argued that an effective strategy to solve social problems is “to recast larger
problems into smaller, less arousing problems” in such a way that “people can identify a series
of controllable opportunities of modest size that produce visible results and that can be gathered
into synoptic solutions” (Weick, 1984, p. 40). In other words, limitations imposed by bounded

CONSUMER OVERESTIMATION OF DONATION AMOUNT
17
rationality cause people to define large social problems in a manner that ends up overwhelming
them and impeding their ability to do anything about solving them. However, reframing larger
problems downwards into smaller, more manageable pieces increases people’s optimism in
their own ability to take innovative actions to solve the problem. Bandura and Schunk (1981)
described this self-optimism in one’s own capabilities to produce results in specific judgment
tasks as perceived self-efficacy, which is accompanied with higher performance. For example,
trying to lose 50 pounds could be a daunting task, but reframing the scale of the weight loss as
losing a pound each week, albeit a small win, could serve to motivate a person and improve
chances of reaching the goal.
This underscores the likely impact of the interaction effect between size and framing
mode on decision problem outcome. A large and growing body of research on number size
framing further explained this interaction by pointing to the fact that people’s sensitivity to
attributes framed in small numbers tend to be more amplified. Consequently, an option is more
favored when its superior attribute is framed with small numbers than when it is framed with
large numbers (Chun-Tuan Chang & Yu-Kang Lee, 2008; Peng et al., 2013; Wong & Kwong,
2005). Thus, another research question is:
RQ3 -Does the framing effect interact with the size effect in consumer overestimation
of the CRM donation amount in a multiple cause portfolio?

CONSUMER OVERESTIMATION OF DONATION AMOUNT
18
Chapter 2. Literature Review
This chapter will outline extant research that supports arguments for the relevance of
cognitive psychology research toward understanding biases in individual decision making and
criticism against its relevance. It will also present a review of literature of extant research on
bias in individual decision making, as well as research on overestimation bias. An examination
of ethical literature on Cause Related Marketing (CRM) will conclude the chapter.
Samuelson (1947) established the foundation of the normative theory of decision
making in economics when he defined several assumptions about a rational individual’s
behavior in his seminal work Foundations of Economic Analysis (Carter et al., 2007). These
assumptions are best articulated in Simon’s (1955) description of a rational man (i.e., homo
economicus), stating that he is:
. . . assumed to have knowledge of the relevant aspects of his environment which, if not
absolutely complete, is at least impressively clear and voluminous. He is assumed also
to have a well-organized and stable system of preferences, and a skill in computation
that enables him to calculate, for the alternatives of action that are available to him,
which of these will permit him to reach the highest attainable point on his preference
scale.
The rational perspective on decision making has an extensive following in neoclassical
economics and is applied in game theory and expected utility theory (von Neumann &
Morgenstern, 1947), subjective expected utility theory (Savage,1954), and the theory of
rational expectations (Lucas & Prescott, 1971; Muth, 1961).
This rational perspective has been challenged on the basis that uncertainty and bounded
rationality exist in decision making (Simon, 1955). Kahneman and Tversky (1973, 1979) later

CONSUMER OVERESTIMATION OF DONATION AMOUNT
19
demonstrated that human decision making may systematically deviate from rationality
assumptions under uncertainty, therefore exhibiting biases, and that individual behavior in this
case is best explained by cognitive psychology (Carter et al., 2007). This school of thought
further argues that individuals often fail when it comes to judging probabilities, making
predictions, or otherwise attempting to cope with uncertain decision environments in
economics (Fischhoff, 1982b; Hogarth, 1987; Thaler, 2000). Simon (1957) argued that:
. . . the capacity of the human mind for formulating and solving complex problems is
very small compared with the size of the problems whose solution is required for
objectively rational behavior in the real world – or even for a reasonable
approximation to such objective rationality.
According to Carter et al. (2007), despite strong support from many prominent
researchers for intensification of research on deviations of actual behavior from the normative
models of decision making, some have criticized this area as irrelevant.
The first argument is that these deviations from the rationality assumption are random
in nature, therefore they will more or less cancel out at the aggregate level. These individual
deviations do not necessarily disprove aggregate predictions of normative economic theory that
assumes full rationality of all economic agents (Fama, 1970). However, Kahneman et al. (1982)
and Einhorn and Hogarth (1981) have pointed out that these deviations from rationality in
decision making, like biases under uncertainty, have a systematic pattern to them, even in the
aggregate.
Another argument is that while individuals may be irrational at times, they can learn,
and as they learn their actions will approach the traditional neoclassical models (List, 2004).
This may be true in some cases (Krell & Grant, 2010); however, a number of biases, like the

CONSUMER OVERESTIMATION OF DONATION AMOUNT
20
failure to update expectations in a Bayesian manner, are relevant to individual learning in
markets (Camerer, 1992, 1987; Carter et al., 2007; Ganguly et al., 2000).
Finally, a powerful argument regarding irrelevance of individual deviation from
rationality on aggregate economic outcomes is that rational agents will drive irrational agents
from the market because the former make higher profits, therefore the weight of their decisions
on aggregate outcome will increase over time. This is not a very convincing argument, because
a reduction in the quantitative weight of irrational traders cannot be guaranteed, even for the
financial market (Fehr & Tyran, 2005). For example, if irrational traders take more risks than
rational traders, it is possible that they may earn higher average returns which may ensure their
survival in the long run (De Long et al., 1991). In fact, empirical evidence suggests that
professional traders are more prone to behavioral biases than are nonprofessionals, as in the
case of the professional traders from the Chicago Board of Trade who demonstrated a greater
tendency for myopic loss aversion than ordinary students (Haigh & List, 2005).
In the same vein as the above stated points, what is perhaps the strongest argument in
favor of the relevance of cognitive psychology research toward understanding biases in
individual decision making was put forward by Tversky and Kahneman (1986). They state that
these deviations from a rational normative theory of human behavior are “too widespread to be
ignored, too systematic to be dismissed as random error, and too fundamental to be
accommodated by relaxing the normative model”.
Research on biases in human decision making based on cognitive psychology has found
application in several business disciplines, including industrial and organizational psychology
and management. This research draws upon the area of the psychology of decision-making
(Beach & Connolly, 2005), judgment and decision-making (Shaban, 2005), and behavioral
economics (Thaler, 1993) to better explore the effect of cause portfolio size and donation
CONSUMER OVERESTIMATION OF DONATION AMOUNT
21
framing on the cognitive bias at play when the consumer overestimates the CRM donation
amount.
Overview of Biases in Decision Making
Thaler (2000) suggests that bounded rationality imposes limitations on information
processing capabilities of homo economicus. Samuelson (1955) goes a step further to elaborate
on the nature of this limitation, stating that the limitation is actually imposed on information
gathering, computing abilities (Eddy, 1982) and memory (Arrow, 1986; Miller, 1956;
Nordstrom et al., 1996; Slovic & Lichtenstein, 1971). In these 3 areas of information gathering,
computing abilities, and memory, contrary to the assumptions of normative decision theory, a
rational individual is unable to examine all possible alternatives in a complex decision
environment under uncertainty, therefore forcing decision makers to use simplifying decision
strategies or heuristics, which leads to decision biases (Hogarth, 1987; Tversky & Kahneman,
1974).
A systematic literature review of the ABI/Inform and EBSCOhost databases by Carter
et al. (2007) revealed a total of 76 differently named decision biases or sources of decision
biases. Based on the argument that previous attempts at categorizations of decision biases are
based on subjective groupings, and none are mutually exclusive and exhaustive, they created a
logical and manageable taxonomy of nine biases. These nine biases are believed to impact
supply chain management decision making, so Carter et al. (2007) specified their effects on
rationality, providing specific examples within the supply chain management context. Despite
this important contribution to the study of decision biases, this taxonomy displays some
weaknesses. One weakness that even the authors acknowledge is that the taxonomy has not
been fully tested for external validity to establish that the classification exhaustively represents
all biases that are present in day to day interactions (Carter et al., 2007). A second weakness of

CONSUMER OVERESTIMATION OF DONATION AMOUNT
22
the taxonomy is that continuous build-up of heuristic and bias research has caused emergence
of an increasing list of new biases (Baron, 2002) and, coupled with the fact the interpretation
of the term is gradually evolving over time (Gigerenzer, 2004), this has made it almost
impossible to exhaustively capture all classifications of biases. Lastly, overestimation, which
is considered a key bias, was conspicuously missing from Carter et al.’s (2007) review.
However, Montibeller and von Winterfeldt (2015) elaborated on overestimation bias as a
subset of overconfidence bias, distinguishing it as one of the group of biases which are difficult
to correct given their tendencies to be resistant to logic and decomposition. Research has shown
that people have been observed to engage in estimation strategies that involve calculations
(Brown, 2002b; Brown & Siegler, 1993) and these computational short cuts can result in
erroneous estimation strategies and subsequent overestimation bias (Olsen, Pracejus & Brown,
2003).
Another framework for understanding the cognitive mechanism underlying decision
making biases was developed by Tversky and Kahneman (1974) in their seminal work
Judgment under Uncertainty: Heuristics and Biases. They argued that people rely mainly on
representativeness, availability and adjustment, and anchoring heuristic principles to intuitively
assess the probability of uncertain events or predict the value of uncertain quantities, thus
leading to various types of biases, including overestimation bias. However, despite the
popularity of this argument and its success in stimulating streams of studies, thereby increasing
the list of heuristics and biases and understanding of the terms, the ecological validity and
logical soundness of the argument has been criticized by several subsequent studies (Cohen,
1981; Gigerenzer, 1996, 1991). For example, Gigerenzer (2004) criticized the terms used to
describe these heuristics as common-sense labels and untestable models, which post hoc can
account for almost everything, suggesting the need for a more testable model that describes
process and conditions under which heuristics succeed or fail. Even the authors themselves,

CONSUMER OVERESTIMATION OF DONATION AMOUNT
23
Tversky and Kahneman, later modified their perspectives and suggested new interpretations
on the strength of evidence from new research revealing new understanding of the terms (e.g.,
Kahneman & Fredrick, 2002 versus Tversky & Kahneman, 1974). The good news, however,
is that several streams of research work on decision biases continue to be generated with a
foundation in the three-heuristic perspective. Research across diverse fields has already begun
to offer deeper insights into specific biases. For example, studies in international politics and
strategic studies (Renshon, 2009), transportation management (Tal, 2008), biostatistics
(Jeffries, 2008), cause marketing (Olsen, Pracejus & Brown, 2003; Pracejus, Brown & Olsen,
2004) and education (Mayer et al., 2006) have focused on overestimation bias.
Extant Research on Overestimation Bias
Extant research on overestimation bias generally focuses on three aspects – types of
overestimation, underlying cognitive mechanisms and how to identify/mitigate potential bias.
In terms of the types of overestimation, the literature generally establishes two broad
categories based on whether overestimation is explainable with or without reference to
psychological biases (Garthoff, 1990). Literature also classifies three types of overestimation
– conscious/rational, erroneous and biased overestimation (Renshon, 2009). Conscious/rational
overestimation is said to occur as a result of deliberate upward adjustment of an assessment.
Erroneous overestimation occurs when an assessment is made based on insufficient or
misleading information (psychological bias is not a pre-condition for erroneous
overestimation). Biased overestimation, on the other hand, occurs as a result of systematic
upwards adjustment of an estimate as a result of cognitive bias (Olsen, Pracejus & Brown,
2003). A review of the literature suggests that biased overestimation is the least explored of
the three types of overestimation (Renshon, 2009)

CONSUMER OVERESTIMATION OF DONATION AMOUNT
24
There appears to be a lack of consensus regarding the relationship between biased
overestimation and over-confidence. Contrary to a widely held view in the judgment and
decision making literature, Renshon (2009) differentiates biased overestimation from
overconfidence and biased optimism. He contends that even though all three are systematic
biases in decision making, the direction of biased overestimation runs exactly opposite to the
direction of overconfidence and unrealistic optimism. Overconfidence and unrealistic
optimism refer to “one’s self-assessment relative to a target group” while biased overestimation
refers to “overestimation of a target’s capabilities relative to an objectively true level”
(Renshon, 2009). That said, Renshon (2009) did not articulate what conditions affect the
likelihood of biased overestimation to occur and what cognitive mechanisms underlie its
occurrence. Contrary views describe overconfidence as an optimistic overestimation of the
likelihood of a desired outcome, or one’s judgment with no regard for factors limiting
predictive accuracy (Griffin & Varey, 1996; Kahneman & Tversky, 1996; Perry, 2008).
When it comes to the second aspect of overestimation bias research - its underlying
cognitive mechanisms, the literature indicates varied underlying mechanisms for
overestimation bias, depending on the perspective of the researcher (Tal, 2008). For example,
empirical findings from Mayer et al.’s (2006) analysis of overestimation of self-reported SAT
scores among college students suggests motivated memory distortion (i.e., systematically
overestimating their scores upwards) rather than memory deterioration (Kuncel, Credé &
Thomas, 2005). However, the Mayer et al. (2006) study could not predict at what point the
distortion occurs – whether at the time of information storage (i.e., change in student’s memory
representation of the scores) or at the time of reconstruction of the information (i.e., at the point
of reporting the scores). Peracchio and Meyers-Levy (1997), on the other hand, used the
resource-matching hypothesis (Anand & Sternthal, 1989) to predict that overestimation is a
function of inefficient information processing during the interval between the periods of

CONSUMER OVERESTIMATION OF DONATION AMOUNT
25
information storage and retrieval. They pointed out that when the cognitive resources available
are less than the cognitive resources required (RA < RR), subjects will resort to heuristic
processing which could lead to overestimation. Finally, Olsen, Pracejus and Brown (2003) and
Pracejus, Olsen and Brown (2004) point to errors in information retrieval (i.e., ignoring or
improperly using a critical piece of information) as the exclusive reason for cognitive distortion
which results in an overestimation bias occurring at the point of information retrieval, prior to
processing. In two separate studies the authors concluded that confusion associated with
expressing CRM donation information, either as a percentage of profit or a percentage of
proceeds, leads many consumers to engage in inappropriate estimation strategy selection while
attempting to take computational short cuts, resulting in near universal overestimation of the
donation amount. Another important conclusion from this study is that even consumers who
have had formal business training are not immune to this bias, hence participant motivation
cannot account for this.
The third aspect of overestimation bias research focuses on how to identify/mitigate
negative effect of this cognitive bias in decision making and is also referred to as debiasing
research. Foundational literature on debiasing research is highly fragmented and narrow
focused with many advocating intervention techniques for debiasing that work on some tasks
but have limited success or even backfires on others (Arkes, 1991, Sanna et. al., 2002;
Kaufmann et. al., 2010; Larrick, 2004). In addition to these techniques, debiasing research also
focused on the positive influence of group cognitive diversity on debiasing judgement (Arkes
et.al., 1987; Larrick, 2004; Meissner & Wulf, 2017). Overall, literature outlined three main
categories of debiasing mechanism that has been perceived as efficacious in reducing biases:
cognitive measures such as draw attention to the opposite perspective in order to examine
evidence or scenarios which would not have been considered otherwise (Epley & Gilovich,
2005; Faro & Rottenstreich, 2006; Schulz-Hardt et al., 2002), motivational measures that
CONSUMER OVERESTIMATION OF DONATION AMOUNT
26
advocates for setting suitable incentives (Larrick, 2004) as well as technological measures
(Hodgkinson et al., 1999; Meissner & Wulf, 2013). The technological measures comprise of
cognitive mapping that involves breaking down and rebuilding the decision structure (decision
process and related information) in order to align the decision task with decision makers’
cognitive capabilities (Ashton & Kennedy, 2002) as well as scenario planning (Meissner &
Wulf, 2013).
Similar to the literature described above, most of previous research on overestimation
in CRM has been mostly confined to the single decision problem context (i.e., with a single
cause organization) with few exceptions (Koschate-Fischer, Huber, & Hoyer, 2015; Eilert &
Robinson, 2020). Varadarajan and Menon (1988), in their seminal work on CRM, describe the
cause portfolio as one of the key types of CRM. Unfortunately, not much research has been
focused on this type of CRM campaign. This study aims to fill this gap by focusing on
overestimation of the CRM donation in the context of the cause portfolio.
Examination of Ethical Literature on Cause Related Marketing
Given the potential impact of consumer overestimation of the CRM donation on brand
choice (Pracejus, Olsen & Brown, 2004), it is worth examining academic contributions on the
topic of ethics in Cause Related Marketing research.
Ethics remains one of the frequently discussed topics in CRM research. A quantitative
analysis of 246 articles on the subject of Cause Related Marketing in 46 journals from 1988-
2013 performed by Guerreiro et al. (2016) indicates that ethics remains the second most
frequently discussed long term topic behind “brand-cause fit” and has been in active discussion
since 2002. One of the earliest conceptualizations of ethics as a dimension of Cause Related
Marketing was proposed by Carroll (1979) in his three-dimensional model of corporate social

CONSUMER OVERESTIMATION OF DONATION AMOUNT
27
performance, where he suggests that obligations of firms to the greater society must be assessed
along the range of economic, legal, ethical, and discretionary categories of business
performance. It is on these bases that the firm must identify social issues (i.e., consumerism,
environment, and discrimination) to align with and determine what philosophy it will choose
to respond to these issues (i.e., reaction, defense, accommodation, or proaction). Choice of
response philosophy will determine where the firm will position on the do nothing to do much
continuum.
A key theme of the ethics studies in CRM research is whether CRM is less "ethical" or
desirable than other forms of corporate donation such as philanthropy. Critics of CRM posit
that expectation of commercial returns make CRM less ethical than philanthropy (Gurin, 1987;
Schiller, 1988; Varadarjan & Menon, 1988). Advocates of CRM, on the other hand, argue that
CRM and philanthropy are not inherently ethical, but must meet certain criteria of independent
ethical standards derived from the realm of moral philosophies, such as teleology, based on the
principle that if an act produces a desired result it is considered "ethical", and deontology, based
on principle that a behaviour is "right", not because of its consequences, but because it complies
with certain universal principles such as treating the individual as having inherent worth and
not being exploited and treated merely as means to achieve ends (Baylin, Cunningham &
Cushing, 1988).
Carroll (1991) further expanded, albeit indirectly, on this moral and ethical component
of CRM, stating that a perception of conflict between a firm's "concern for profits" versus its
"concern for society" is an oversimplification, but instead utilized three major ethical
approaches to management – moral, amoral and immoral – to assist executives to reconcile
their obligations to their stakeholders with those to the society in an ethical or moral fashion.

CONSUMER OVERESTIMATION OF DONATION AMOUNT
28
Criticism of CRM as being less “ethical” due to expectation of commercial returns has
generated another stream of research related to consumers questioning the motivation of a firm
for engaging in CRM. Although skepticism toward CRM appears to be declining, consumers
remain critical of these efforts, often questioning whether a company's support of a social cause
is designed to benefit the cause or the company ("Report: Consumers Swayed", 1997; Smith
& Stodghill, 1994; Webb & Mohr, 1998).
Barone, Miyazaki and Taylor (2000) argued that effective influencing tactics used in
CRM strategies can be used to manipulate consumer perception of underlying motivations for
corporate sponsorship of CRM, which in turn influences consumer choice.
Building on the topic of potential impact of the degree of influence of CRM tactics and
strategies to manipulate consumer choice, Olsen, Pracejus & Brown (2003) examined potential
consumer confusion associated with the “percentage of profit” wording often used in
expression of donation amount to CRM and concluded that it could lead to the systematic
overestimation of donation values and thus consumer choice of a brand. This raises an ethical
concern for marketing and public policy from a consumer protection perspective. They also
explored several potential affirmative disclosures to minimize the problem.
Finally, another stream of ethics research in CRM explores the ethical conflicts that
could occur in the partnership between a corporation and non-profit organizations, because the
organizations involved have different objectives and goals (Andreasen, 1996; Farache, et al.,
2007). These conflicts could include possible damage to the corporation’s reputation when the
non-profit organization oversteps ethical bounds (Andreasen & Drumwright, 2000),
corporations spending more on publicising the CRM program than their actual financial
contribution (Varadarajan & Menon, 1988), corporations “cherry-picking” attractive, risk-free,
high-visibility causes at the expense of less popular, high-risk, low-visibility groups that need

CONSUMER OVERESTIMATION OF DONATION AMOUNT
29
the support more (Gurin, 1987; Varadarajan & Menon, 1988), exaggeration of corporate
support which could lead individual donors to assume that specific causes no longer require
donations due to corporate support via CRM campaigns when in reality direct donations are
likely to be more beneficial (Polonsky & Wood, 2001), or CRM used to hide or legitimize
harmful activities central to the firm’s business (Bravo et al., 2012; Andreasen & Drumwright,
2000)
This research has implications from a public policy perspective, in the sense that it
exposes to policy makers additional areas of focus in CRM practice, where regulation or a code
of conduct is urgently needed.
Theoretical Framework
It is well documented that a multiple strategy perspective is applicable across diverse
estimation tasks (Siegler, 1987). A multiple strategy perspective on decision behavior
demonstrates that people’s estimation strategy selection is contingent upon the task
characteristics, particularly accessibility to task-relevant representative content in memory
which can be retrieved and the nature of task-relevant information (Blair & Burton, 1987;
Brown, 2002a).
Evidence from previous research also suggests that estimation bias is systematically
related to strategy selection (Olsen, Pracejus & Brown, 2003). Overestimation occurs when
people engage in non-numerical strategies due to the process of converting a qualitative value
to a numerical value (Brown, 1995; Brown, 2002a). Generally, non-numerical strategies
involve either direct retrieval of a qualitative sense of magnitude or forming a qualitative
sense of magnitude via memory assessment, then converting it into a number. If people lack a
metric for this conversion, they can be quite inaccurate, typically leading to net

CONSUMER OVERESTIMATION OF DONATION AMOUNT
30
overestimation (Brown, 1995; Brown & Siegler, 1993; Conrad & Brown, 1994). A typical
example of memory assessment involves the use of availability heuristics, where people’s
estimates are based on ease of information retrieval (Tversky & Kahneman, 1974).
One aspect of task relevant information that seems to have a specific strong effect on
the outcome of non-numerical estimation tasks is the size of the task. In evaluating how
survey respondents make frequency judgements to answer behavioral frequency questions,
empirical findings suggest that when frequencies are high, people are not only likely to rely
on non-numerical estimation strategies which lead to overestimation (Blair & Burton, 1987;
Conrad & Brown, 1994; Conrad, Brown & Cashman, 1993), but that the absolute error
increases with task size, i.e., event frequency (Brown, 1997). This is also consistent with
Fiedler and Juslin’s (2006) thesis that many cognitive biases can be explained in terms of
sampling processes. Kaufmann and Betsch (2009) concur, suggesting that attributes of an
information sample, such as its size, directly impact judgment. Furthermore, findings from
Klemz and Gluca (2003) show that increased task complexity (i.e., increased number of task
alternatives or attributes to be evaluated) leads to significant error in decision outcomes, even
for experienced decision makers, due to the non-compensatory decision strategies they adopt
in order to simplify their decision process.
The sample size effect provides a robust explanation of the sensitivity of intuitive
judgment of samples involving multiple pieces of information (i.e., cause portfolios) to sample
size and variance. It posits that summary judgment of a set of sampled information becomes
more extreme with an increase in the size of the set (Kaufmann & Betsch, 2009; Boven &
Epley, 2003; Evans & Bradshaw, 1986; Kaplan, 1981; Shavitt et al., 1999; Bar-Hillel, 1979;
Anderson, 1967, 1959)

CONSUMER OVERESTIMATION OF DONATION AMOUNT
31
A stream of research has subsequently emerged to further elaborate on the underlying
reason for the sensitivity of intuitive judgment to sample size. This research posits that people,
as part of their intuition, adopt the statistical principle of the law of large numbers in everyday
judgment situations (Evans & Pollard, 1985; Kruglanski, Friedland & Farkash, 1984; Nisbett,
Krantz, Jepson, & Kunda, 1983; Nisbett & Ross, 1980; Piaget & Inhelder, 1975). This principle
assumes that larger samples are perceived to yield a more reliable representation of its
population characteristics than small samples (Hays, 1981; Sedlmeier & Gigerenzer, 1997);
hence, increasing a sample size will cause enhanced weight to be assigned to it in subsequent
quantitative judgments (Kaufmann & Betsch, 2009).
Drawing on findings by Pracejus, Olsen and Brown (2004) and Olsen, Pracejus and
Brown (2003) that cognitive bias leads to near universal overestimation when donation
information is expressed in ambiguous formats (i.e., with vague or estimable quantifiers), I
therefore hypothesize as follows:
H1: When donation amount information is ambiguous (i.e., expressed as vague or
estimable quantifier formats), consumer overestimation of donation amount will
increase as size of the cause portfolio (number of causes) increases.
This has significant implications for the composition of corporate CRM programs,
since firms typically aim to support a portfolio of multiple causes in order to target different
market or product segments or sub-segments at the same time (Varadarajan & Menon, 1988).
Therefore, when a portfolio is composed of several causes, each perceived to represent
roughly the same proportion of the consumer market segment, people’s judgments will be
sensitive to increases in the portfolio size.

CONSUMER OVERESTIMATION OF DONATION AMOUNT
32
The nature of a consumer’s central tendencies offers a boundary condition for the effect
of portfolio size on the degree of overestimation of a CRM donation. The concept of priming
provides insight into this boundary condition. Priming describes a phenomenon, when a
person’s exposure to a stimulus subconsciously influences the person’s response subsequent
stimulus by providing a frame of reference. Previous research argues that intuitive judgments
tend to assimilate irrelevant anchors (Kahneman & Tversky, 1974), concluding that anchors
from one dimension or modality could, indeed, influence estimates of targets in another
dimension or modality (Oppenheimer, LeBoeuf & Brewer, 2008). In essence, this means that
people’s exposure to a small or large quantity in one dimension can cross-modally prime the
representation of magnitude in other dimensions, resulting in biased quantitative judgments
and responses (Oppenheimer, LeBoeuf & Brewer, 2008; Smith & Price, 2010).
Another perspective on priming is the interaction between the degree of life satisfaction
and the magnitude of affective priming in memory. Studies suggest a bidirectional relationship
between affective priming effects and levels of life satisfaction (Robinson & Von Hippel,
2006). Moreover, the nature of this influence is such that people with higher levels of life
satisfaction appear to have a strong association with larger positive affective priming effects
partly due to a memory organization common among people who experience high levels of life
satisfaction, whereby there is a strong interconnectivity of positive affective thoughts relative
to negative (Robinson & Kirkeby, 2005; Robinson & Von Hippel, 2006).
Related to the concept of life satisfaction, or subjective well-being, is the concept of
self-reported mood. The self-reported mood literature identifies two highly distinctive primary
dimensions of mood – Positive Affect and Negative Affect (Watson & Clark, 1984; Watson &
Tellegen, 1985). Positive Affect refers to a dimension of pleasurable engagement, high energy,
full concentration stimulated by enthusiastic, alert and active mood state, while Negative Affect

CONSUMER OVERESTIMATION OF DONATION AMOUNT
33
is a dimension of subjective distress and unpleasurable engagement stimulated by a variety of
aversive mood states (Watson, Clark & Tellegen, 1988). Many existing self-report instruments
of subjective well-being (SWB) such as Satisfaction With Life Scale (SWLS) are unreliable,
because they are subject to conscious distortion of response to the scale if respondents are
motivated to do so and inadequate for assessing affective component of SWB (Pavot & Diener,
1993). On the other hand, Watson, Clark and Tellegen’s (1988) 20-item mood scale that
comprise the Positive and Negative Affect Schedule (PANAS) is well validated and cited by
12,300 scholarly papers (Kuesten et al., 2014). Therefore, PANAS is a more reliable measure.
Positive priming effects reinforce positive thoughts and experiences over time and this
cascade of positive thoughts likely predisposes individuals to higher ratings of life satisfaction
and well-being evaluations (Robinson & Kirkeby, 2005; Robinson & Von Hippel, 2006). For
example, one positive thought (e.g., job security) is likely to trigger another one (e.g., stable
finances) which in turn triggers another one (e.g., economic security, loving family
relationships, good mental health, etc.), thus self-perpetuating a tendency for happiness that in
turn gives rise to higher life satisfaction ratings. On the other hand, negative priming effect is
demonstrated when exposure to consecutive negative stimuli (e.g., negative thoughts, sadness,
anger) reinforces a greater degree of pessimism and avoidance behavior in everyday life of
individuals, thus predisposing them to a lower ratings of life satisfaction and lower well-being
evaluations (Carver & Scheier, 1998; Robinson & Kirkeby, 2005).
Schwarz and Clore’s (1983) suggests that affective priming manipulations tend to
induce bias in the interpretation of a judgment target. While Oppenheimer, LeBoeuf and
Brewer’s (2008) argued that biased quantitative judgments and responses can result from
exposure to a small or large quantity in one dimension cross-modally priming the
representation of magnitude in another dimension. Drawing on these two positions, one can

CONSUMER OVERESTIMATION OF DONATION AMOUNT
34
argue that given the same conditions, measuring consumers’ positive (or negative) affect as
measured by Positive and Negative Affect Schedule (PANAS) may result in varying degrees
of overestimation (or underestimation) of the CRM donation amount. Thus, I propose that:
H2a: When the donation information is ambiguous (i.e., expressed in vague or
estimable quantifier formats), the consumer’s level of positive affect positively
moderates the effect of the size of a given multiple cause portfolio on the extremity of
consumer overestimation of the CRM donation amount.
H2b: When the donation information is ambiguous (i.e., expressed in vague or
estimable quantifier formats), the consumer’s level of negative affect negatively
moderates the effect of the size of a given multiple cause portfolio on the extremity of
consumer overestimation of the CRM donation amount.
The framing effect phenomenon has been receiving increasing attention in decision
behavior research. The framing effect refers to how a different description or wording of a
scenario (i.e., scenario decision frame) produces a different reasoning or behavioral preference,
assuming all other objective information being equal (Frisch, 1993).
Cognitive psychology distinguishes between two primary decision frames by which the
framing effect can occur: distributional reasoning and case-specific reasoning (Connie, John
& Iyer, 2002). Distributional reasoning looks at a scenario in terms of its relevance to a broader
context, with which there is a prior learning experience, then relies on normative or rule-based
principles to draw on generalizations to analyze the current scenario. Case-specific reasoning
evaluates each scenario independently, relying on costs and benefits to arrive at a decision
(Reeves & Lockhart, 1993).

CONSUMER OVERESTIMATION OF DONATION AMOUNT
35
Typically, consumer decision behavior research has measured framing effects by
comparing outcome choices (Dotson et al., 2012; Gamliel & Herstein, 2012; Levin & Gaeth,
1988), behavioral preferences (Braun, Gaeth & Levin, 1997; Gamliel & Herstein, 2007;
Meyers-Levy & Maheswaran,1990), or moral reasoning processes (Connie, John & Iyer, 2002;
Stanforth & Hauck, 2010) when examining two (negative and positive) frames of a scenario.
Comparative analysis indicates conflicting outcome in these studies. For example, Levin and
Gaeth (1988) and Dotson et al. (2012) studies demonstrated that diagnostic product experience
dilutes impact of framing effects on consumer decision. On the contrary, Gamliel and Herstein
(2007) study related to framing effects on consumer willingness to buy private brands
suggested that relative to positive frame (save), negative frame (loss) results in higher
consumer willingness to buy private brands.
Further, Braun, Gaeth and Levin (1997) study testing male and female responses
suggested that framing effects were limited to female for whom framed attribute was
specifically important. However, Connie, John and Iyer (2002) observed a different outcome
showing that true framing effects are not likely to vary by gender. Meyers-Levy and
Maheswaran (1990) attributes some of these conflicting outcomes in framing effects studies to
people’s use of either detailed versus heuristic processing in comprehending the message that
is framed either positively or negatively. Their tendency to use detailed processing in
determining their preference is greater when message information is of high personal
relevance. However, tendency for heuristic processing is greater when the message information
is of low personal relevance.
A stream of research has been undertaken in prospect theory research to account for
various ways people encode compound joint outcomes -- “narrow framing” (Benartzi & Thaler,
1999; Kahneman & Lovallo, 1993), “choice bracketing” (Read et al., 1999), “mental

CONSUMER OVERESTIMATION OF DONATION AMOUNT
36
accounting” (Thaler, 1999), and “segregation/aggregation” (Langer & Weber, 2001;
Redelmeier & Tversky, 1992). The central theme is that evaluating component outcomes either
jointly (i.e., aggregated or consolidated) or separately (i.e., segregated or partitioned) may
induce related differences in perceived value. For example, research on price framing for
multiple component bundles finds that segregated pricing of individual components could raise
salience of a component and its associated features, thereby increasing its weight in affect
evaluation and choice (Chakravarti et al., 2002; Gilbrand, Gulitinan & Urbany, 2008). In
contrast, most extant CRM research that examined the influence of the framing effect on the
consumer decision making process had focused mainly on donation message framing in the
context of a single cause (Das & Kerr, 2009; Grau & Garretson Folse, 2007; Grau, Garretson,
& Pirsch, 2007; Olsen, Pracejus, & Brown, 2003; Pracejus, Olsen & Brown, 2004). Very few
CRM research, to my knowledge and a search of article databases, has focused attention on the
framing effect within a multiple cause bundle framework (Koschate-Fischer, Huber, & Hoyer,
2015; Eilert & Robinson, 2020).
Overall, it is suggested that an aggregated prospect frame leads to superior outcomes,
but people are most likely to adopt segregated frames when faced with intuitive decision
problems (Kahneman, 2003; Kahneman & Lovallo, 1993). This consequently results in isolated
evaluation of components, often ignoring the overall portfolio context and leading to
suboptimal results. Some studies suggest that this tendency for segregated framing occurs
regardless of whether the context of the decision problem is at the individual or public level.
On the other hand, Weick (1984) suggests focusing on small gains when addressing social
dilemma problems, implying that dividing a large problem into pieces small enough for
individuals to handle enhances the prospects of success. Hedonic optimizers would also
normally adopt a narrow decision frame that segregates gains instead of a broad decision frame
that combines all gains and appears to be optimal (Lim, 2006; Thaler & Johnson, 1990). In

CONSUMER OVERESTIMATION OF DONATION AMOUNT
37
fact, Langer and Weber (2001), in their analysis of a portfolio consisting of mixed lotteries,
suggest a sensitivity of acceptance rates to the difference between narrow and broad
presentation of the portfolios, even with similar risk profiles. They point out that narrow
framing leads to segregated evaluation, which in turn results in lower overall evaluation of the
portfolio. Therefore:
H3: When evaluating a portfolio of multiple causes with ambiguous donation
information (i.e., expressed in vague or estimable quantifier formats), segregated
framing of the portfolio evaluation leads to lower overall consumer overestimation of
the donation amount, compared to aggregated framing of the same portfolio.
Evidence also suggests that under conditions of ambiguity where intuitive judgment is
applied, framing effects are present for positively correlated investment portfolios (Steul,
2006). Perry (1985) also points out that this correlation rises as the portfolio size increases,
thus implying a direct causal relationship between framing effect and portfolio size.
Drawing on Kahneman and Lovallo’s (1993) conclusion that people intuitively adopt
narrow framing which leads to suboptimal outcomes (i.e., lower estimates of donation amount),
one can then assume a negative relationship between portfolio size and narrow framing. For
example, in a decision-making environment under ambiguity, intuition leads people to frame
the outcome narrowly by focusing on losses rather than gains, thus making it difficult to trade
small losses for large gains. When evaluating a new gamble, the intuitive tendency toward
narrow framing forces people to evaluate the gamble in isolation, instead of merging it with
the risks they are already facing and checking whether the combination is attractive, thus
missing out on the gamble’s potential contribution to total wealth. This is particularly
applicable in real-world situations where people fail to choose wise trade-offs by neglecting to
consider diverse applications of the decision opportunity they are presented with. Voters, for

CONSUMER OVERESTIMATION OF DONATION AMOUNT
38
example, focus too much on the narrow interests of the small group to which they belong and
neglect to consider the secondary effect of their interests potentially being represented by a
minority group of legislators, which would reduce the likelihood of such interests being
reflected in government decisions (Rickard, 2012). Therefore, my hypothesis states that:
H4: When evaluating a portfolio of multiple causes with ambiguous donation
information (i.e., expressed in vague or estimable quantifier formats), segregated
framing of the portfolio evaluation attenuates the effect of cause portfolio size on the
extremity of consumer overestimation of the CRM donation amount.
Conceptual Framework
Figure 2
H1 (+)
H2b (-)
H2a (+)
H4 (-)
H3 (-)
Ambiguous
Donation
Quantifier (Vague
vs. Estimable)
Consumer Confusion
from complexity of
judgmental task
Consumer
Overestimation of
Donation Amount
Positive/Negative
Affect
Portfolio size (Small
vs. Medium vs. Large)
Evaluation Frame
(Segregate vs.
Aggregate)
CRM Donation Information Consumer Response

CONSUMER OVERESTIMATION OF DONATION AMOUNT
39
Definitions and Measures of Focal Constructs of Study
Focal constructs are defined and their measures described below
Figure 3
Focal Constructs Definitions
Variable Definition Measure
Donation
Overestimat
ion
Higher consumer estimate of CRM donation amount than
actual resulting from consumer’s confusion during attempt to
interpret or map the ambiguous terms found in CRM
donation messages onto a numeric scale because people take
computational shortcuts in a bid to simplify the complexity
of the estimation task, such that they overlook relevant
information required for the task environment (Budescu &
Wallsten, 1985; Eddy, 1982; Fillenbaum et al., 1991; Olsen,
Pracejus & Brown, 2003; Wallsten et al., 1986).
Comparison of actual
dollar amount of donation
from similar CRM event
and the scaled responses
from the hypothetical
CRM. All scaled response
that are higher than the
actual donation amount
Donation
Quantifier
The way the company presents the CRM donation amount to
the consumer (Grau, Garretson & Pirsch, 2007; Pracejus,
Olsen and Brown, 2004)
• Vague quantifiers provide consumers with almost no
idea as to the actual amount being donated (i.e.,
generous donation will be made)
• Estimable quantifiers give only a piece of
information needed to calculate the donation amount
(i.e., x% of percentage of profit will be donated)
• Calculable describes donation amount in a manner
allows consumers to calculate the actual amount
being donated (i.e., x% of percentage of price will
be donated)
Identified based on terms
used to express quantity
of donation amount in
CRM campaign
messaging
Portfolio
Size
Number of causes involved when CRM campaign
simultaneously ties in with a bundle of multiple causes in a
branded portfolio (Varadarajan & Menon, 1988).
Count of causes listed in a
branded CRM campaign
portfolio
Positive/
Negative
Affect
Self-reported primary dimensions of life satisfaction and
well-being evaluations using mood states (Robinson &
Kirkeby, 2005; Robinson & Von Hippel, 2006; Watson &
Clark, 1984; Watson & Tellegen, 1985). Positive Affect
refers to a dimension of pleasurable engagement, high
energy, full concentration stimulated by enthusiastic, alert
and active mood states, while Negative Affect is a dimension
of subjective distress and unpleasurable engagement
stimulated by a variety of aversive mood states (Watson,
Clark & Tellegen, 1988).
20-item mood scale that
comprises the Positive
and Negative Affect
Schedule (PANAS)

CONSUMER OVERESTIMATION OF DONATION AMOUNT
40
Evaluation
Frame
Expression in CRM campaign message of how CRM
donation will be distributed to each cause in branded
multiple cause portfolio either individually (segregate; i.e.,
donation to be split equally between charities) or as a group
(aggregate; i.e., donation to be split unequally between
charities) (Thaler, 1999; Langer & Weber, 2001)
Identified based on terms
used to express how
donation will be
distributed to each cause
in a multiple cause CRM
campaign

CONSUMER OVERESTIMATION OF DONATION AMOUNT
41
Chapter 3. Methods
A positivist philosophy is adopted for this research. Positivists believe that reality is
independent of the researcher, hence it can be observed from an objective viewpoint without
the researcher interfering in the phenomena being studied (Levin, 1988). Although there has
been much debate about the appropriateness of the positivist paradigm for social science
research (Hirschheim, 1985) when compared to the interpretivist perspective, its rich tradition
in the performance marketing research is the key attraction. Experimental design is argued to
be the best research design for establishing causal connections between variables because of
its high internal validity (Bryman, Teevan & Bell, 2009). All the hypotheses described earlier
will be tested using an experimental research design.
This chapter will outline methodology for testing the hypotheses proposed in chapter
1. The research design, survey instrument used for data gathering, as well as the response rate
will be presented. The chapter then concludes by detailing our approach to data analysis for
this study, criteria used to ensure validity and reliability of the research, as well as ethical
consideration for the study.
Research Design
An Imagine Canada survey of 2,200 Canadian companies (Easwaramoorthy et al.,
2006) indicates that social services, health and sports and recreation organizations are the most
likely types of nonprofits to be supported by businesses and also that the top three causes that
businesses support are children (68%), youth (55%), and people with physical disabilities
(40%). Consequently, the 26 charities initially selected for the pretest for this experiment
support children’s health, recreation and social service issues. These 26 examples were chosen
because they were the largest charities in each of these three categories, based on annual

CONSUMER OVERESTIMATION OF DONATION AMOUNT
42
donations. Charities that were local to a particular city were excluded from the list since the
target participants for the pretest who are students at Athabasca University are from all across
Canada. These 26 charities are listed as follows:
1. Children’s Miracle Network
2. Make a Wish Foundation
3. Ronald McDonald House Charities
4. Sick Kids Foundation
5. Canadian Tire Jump Start
6. CIBC Children's Foundation
7. SOS Children's Villages Canada
8. Tim Horton Children’s Foundation
9. Juvenile Diabetes Research Foundation Canada
10. World Vision Canada
11. Council on Drug Abuse (CODA)
12. Big Brothers Big Sisters of Canada
13. Boys and Girls Clubs of Canada
14. The Canadian Red Cross Society
15. CARE Canada, Bethany Care Society
16. Canadian Breast Cancer Foundation
17. Multiple Sclerosis Society of Canada
18. Canadian Cancer Society
19. Heart and Stroke Foundation of Canada
20. Canadian Wildlife Federation
21. The David Suzuki Foundation
22. World Wildlife Fund Canada

CONSUMER OVERESTIMATION OF DONATION AMOUNT
43
23. Tides Canada Foundation
24. The Nature Conservancy of Canada
25. MADD Canada
26. United Way of Canada
Pre-Test Methodology and Results
Prior to starting the experiment, a pretest was conducted to measure the perceived
familiarity and favorability of each of the above-mentioned charitable organizations. The pre-
test was also used to unveil any issues with the clarity and consistent interpretation of individual
questions and ensure that the questions met their intended purpose (Burns et al., 2008).
Permission was obtained from the Athabasca University authorities to access
respondents for the research. An invitation to participate in the pre-test, along with the link to
the survey web site, was posted on the Athabasca University Student Portal. For Staff, a similar
posting was put up on the Staff portal homepage. This provided access to a student, faculty and
staff population of approximately 10,000 respondents. A minimum of 30 respondents were
required for the pre-test. Every week, an automatic number generation was used to randomly
select a series of 1:3 responses drawn from among volunteers for the study. Consequently,
responses from 131 adults aged 18 and over were collected over an eight-week period.
Each of the 26 charities noted above was listed in the pre-test questionnaire, without
providing a description of its mission/cause affiliation or assignment to a category.
Respondents were asked to indicate whether they are familiar with the charity (familiar / not
familiar) and whether they have a favorable or unfavorable opinion of each of these charitable
organizations on a scale from 1 to 5 (where 5=favourable, 4=mostly favourable, 3=no opinion;
2=mostly unfavourable; 1=unfavourable). Demographic data (age, sex, and amount of

CONSUMER OVERESTIMATION OF DONATION AMOUNT
44
charitable giving per year) was collected as part of the pretest in order to ensure that there are
no substantial differences in favorability and familiarity when comparing different
demographic groups. A copy of the pretest questionnaire can be found in Appendix 1.
Pre-Test Sample Descriptor: For the pre-test, there were initially a total of 131
respondents. However, after deleting the questionnaires that had missing values or incomplete
responses, 129 responses remained (98.5 percent of the original sample of 131 questionnaires).
This is substantially more than the minimum 30 respondents that were required for the pre-test.
Figure 4 indicates the demographics of the respondents. The gender distribution was 86%
female and 14% male. The modal age range was 25- 34 years.
Figure 4
Demographics of the Pre-Test
AGE: Male Female TOTAL:
18-24 n= 4
3.1%
n=18
14.0%
n=22
17.1%
25-34 n=10
7.8%
n=37
28.6%
n=47
36.4%
35-44 n=3
2.3%
n=33
25.6%
n=36
27.9%
45-54 n=1
0.8%
n=20
15.5%
n=21
16.3%
55-64 n=0
%
n=3
2.3%
n=3
2.3%
65+ n=0
%
n=0
%
n=0
0%
TOTAL: n=18
14%
n=111
86%
n=129
100%
The gender distribution of the pretest sample drawn from Athabasca University
students and staff indicating more female than male response is consistent with the student
demographics numbers published on the AU website indicating 67% female student population
as of 2010-2011 year (Athabasca University, AU at a Glance). However, there was no publicly
available data related to gender distribution among from Athabasca University staff. That said,

CONSUMER OVERESTIMATION OF DONATION AMOUNT
45
preponderance of female response is also representative of the larger society and consistent
with a growing body of research on CRM, which suggests significantly more positive response
to CRM from women than men (Ross, Stutts & Patterson, 1991, 1992; Vilela & Nelson, 2016)
Figure 5 provides a ranking for all 26 charities, based on the Net favorability scores.
Favorability rating is a proven measurement technique used in polls or surveys to assess the
overall public sentiments towards a person, place or thing (Lavrakas, 2008). The rating is
commonly used in political polls to indicate if overall public opinion towards a politician is
favorable (positive), unfavorable (negative) or neutral. It is usually expressed in Net
Favorability score. The Net Favorability score was calculated by subtracting the unfavorable
opinions from the favorable opinions.
Figure 5
Charities Ranking Based on Pre-Test Results
Answer Choices
%
Familiar
(Have
an
opinion)
% With
Favorable
Opinion
% With
Unfavorable
Opinion
Net
Favorable
(%)
Net
Favorability
Ranking for
HIGH
familiarity
(>50%)
Make a Wish Foundation 90% 86% 4% 82% 1
Ronald McDonald House Charities 94% 87% 6% 81% 2
Big Brothers Big Sisters of Canada 81% 80% 2% 78% 3
The Canadian Red Cross Society 89% 80% 9% 71% 4
MADD Canada 81% 76% 5% 71% 5
Boys and Girls Clubs of Canada 72% 71% 1% 70% 6
Canadian Wildlife Federation 68% 68% 0% 68% 7
Sick Kids Foundation 65% 65% 0% 65% 8
Heart and Stroke Foundation of
Canada 79% 72% 8% 64% 9
Canadian Cancer Society 82% 70% 13% 57% 10
Multiple Sclerosis Society of Canada 59% 58% 1% 57% 11
Tim Horton Children’s Foundation 67% 62% 5% 57% 12
World Wildlife Fund Canada 63% 58% 5% 53% 13
Canadian Breast Cancer
Foundation 85% 68% 16% 52% 14
Children’s Miracle Network 65% 58% 6% 52% 15
Canadian Tire Jump Start 62% 57% 5% 52% 16
United Way of Canada 65% 51% 14% 36% 17
The David Suzuki Foundation 59% 45% 14% 31% 18
World Vision Canada 70% 37% 33% 4% 19
Juvenile Diabetes Research
Foundation Canada 44% 42% 2% 40% 20

CONSUMER OVERESTIMATION OF DONATION AMOUNT
46
The Nature Conservancy of Canada 31% 29% 2% 26% 21
CIBC Children's Foundation 15% 11% 5% 6% 22
Council on Drug Abuse (CODA) 14% 11% 3% 8% 23
CARE Canada, Bethany Care
Society 13% 11% 2% 8% 24
SOS Children's Villages Canada 12% 8% 4% 5% 25
Tides Canada Foundation 7% 4% 3% 1% 26
Based on a median split on the Familiarity question and a median split on the Net
Favorability Ranking, each charity was placed into one of the boxes in the Figure 6 below.
Figure 6
Favorability - Familiarity Matrix
High Favorability / Low Familiarity
High Favorability / High Familiarity
Make a Wish Foundation
Ronald McDonald House Charities
Big Brothers Big Sisters of Canada
The Canadian Red Cross Society
MADD Canada
Boys and Girls Clubs of Canada
Canadian Wildlife Federation
Sick Kids Foundation
Low Favorability / Low Familiarity
CIBC Children's Foundation
SOS Children's Villages Canada
Juvenile Diabetes Research Foundation Canada
Council on Drug Abuse (CODA)
CARE Canada, Bethany Care Society
Tides Canada Foundation
The Nature Conservancy of Canada
Low favorability / High Familiarity
Heart and Stroke Foundation of Canada
Canadian Cancer Society
Multiple Sclerosis Society of Canada
Tim Horton Children’s Foundation
World Wildlife Fund Canada
Canadian Breast Cancer Foundation
Children’s Miracle Network
Canadian Tire Jump Start
United Way of Canada
The David Suzuki Foundation
World Vision Canada
Charities with the highest Net Favorability Rankings which fall into the high
favorability and high familiarity quadrants were selected and combined into portfolios of 2, 5,
65%
50%

CONSUMER OVERESTIMATION OF DONATION AMOUNT
47
or 8 charities. The two highest ranked charities were used for the 2-charity portfolio, the 5
highest ranked charities were used for the 5-charity portfolio, and the 8 highest ranked charities
were used for the 8-charity portfolio. Consequently, 8 charities selected for the experiment
based on the order of ranking are as follows:
Figure 7
Charity Portfolio Assignments
2-Charity Portfolio 5-Charity Portfolio 8-Charity Portfolio
1. Make a Wish Foundation
2. Ronald McDonald House
Charities
1. Make a Wish Foundation
2. Ronald McDonald House
Charities
3. Big Brothers Big Sisters of
Canada
4. The Canadian Red Cross
Society
5. MADD Canada
1. Make a Wish Foundation
2. Ronald McDonald House
Charities
3. Big Brothers Big Sisters of
Canada
4. The Canadian Red Cross
Society
5. MADD Canada 6. Boys and Girls Clubs of
Canada
7. Canadian Wildlife Federation
8. Sick Kids Foundation
Main Experiment
The primary purpose of the main experiment is to see if the degree of consumer
overestimation of the CRM donation amount will vary with an increase in the size of a cause
portfolio, thereby testing Hypothesis 1. The study also administered the PANAS (Positive and
Negative Affect Scale) instrument, in order to test Hypothesis 2a and 2b.
Further, the experiment tested Hypothesis 3 by evaluating a portfolio of multiple causes
with ambiguous donation information (i.e., expressed in vague or estimable quantifier formats),
to see how the portfolio evaluation framing (i.e., expressed in segregated frames or aggregated
frames) impacts the overall consumer overestimation of the donation amount within the same
portfolio size.

CONSUMER OVERESTIMATION OF DONATION AMOUNT
48
Segregated frames are expressed with a statement indicating equal split of donation
amount between a specified number of charities, while aggregate frames are expressed as
unequal split of donation amount. Respondents were allowed to self-select between the
aggregate and segregate conditions.
The experiment also tests Hypothesis 4 by manipulating the cause portfolio size to see if the
degree of consumer overestimation of the CRM donation amount varies with an increase in the
size of a cause portfolio.
Method: To test hypothesis 1, the dependent variable is the overestimation of the CRM
donation amount relative to the actual donation amount. The stimulus information is
manipulated between-subjects according to a 3 (portfolio size: small vs. medium vs. large) x 3
(donation quantifier format: vague (ambiguous) vs. estimable (ambiguous) vs. calculable (non-
ambiguous) full factorial design.
To test Hypothesis 2a and 2b, the PANAS instrument is used to measure positive affect
and negative affect, to determine whether affect contributes to overestimation of donation
amount.
To test Hypotheses 3 & 4, the dependent variable is the overestimation of the CRM
donation amount relative to the actual donation amount. The stimulus information is
manipulated within-subjects according to a 2 x 2 x 2 factorial design of cause portfolio size
(small vs. large) and portfolio evaluation frame (segregated vs. aggregated) nested within the
ambiguous donation quantifier factor (vague vs. estimable). Respondents were randomly
assigned to only the cause portfolio size and ambiguous donation quantifier conditions, while
they were allowed to self-select between the aggregate and segregate conditions.

CONSUMER OVERESTIMATION OF DONATION AMOUNT
49
Data Collection: Permission was obtained from the Athabasca University authorities
to access respondents for the research. An invitation to participate in the research study, along
with the link to the survey web site, was posted on the Athabasca University Student Portal.
For Staff, a similar posting was put up on the Staff portal homepage. This provided the
researcher with access to a student, faculty and staff population of approximately 10,000
respondents.
Additional permission was also obtained from the Athabasca University Ethics Review Board
to access respondents from members of the public. An invitation to participate in the research
study, along with the link to the survey web site, was posted on social media portals –
WhatsApp, LinkedIn and Facebook.
The desired sample size of a minimum of 270 adults aged 18 and over was collected over an
eight-week period. The rationale for this sample size is presented in the following statistical
power analysis.
Sample Size - Power Analysis: An a priori power analysis was conducted to determine
an appropriate sample size N that would be large enough to produce a power that is reasonably
high, while maintaining statistical significance level α (maximum allowable probability of
committing type I error) at a reasonably low value. This is done by controlling the probability
of type II error β.

CONSUMER OVERESTIMATION OF DONATION AMOUNT
50
Description of Type I and Type II Errors
The null hypothesis H0 to be rejected is that an increase in the size of the cause portfolio will
not affect the overestimation of the donation amount.
It should be noted that type II error is the failure to reject null hypothesis H0 when the
null hypothesis is false, while type I error is rejecting the null hypothesis when it is true.
Reducing the chance of type I error increases the chance of type II error and vice-versa
(Bryman, Teevan & Bell, 2009). The power of a test is the probability that the hypothesis test
will reject the null hypothesis when the null hypothesis is false.
Typically, type I error is considered a more serious error that needs to be avoided.
Therefore, in this hypothesis testing, we control α at a pre-determined nominal value and
choose a sample size that ensures β is minimized. In this case, the null hypotheses are tested
using ANOVA at a statistical significance level of p≤0.05 with a desired power of the test at
1- β = 0.8. This in essence means that there are, at most, 5 chances in 100 of the sample showing
a relationship not found in the rest of the population and there is an 80% chance of rejecting
the null hypothesis when it is false.
The central limit theorem (CLT) states that for a random sample taken from a
population, the distribution of the sample mean will be close to a normal distribution (assuming
Figure 8
Null hypothesis
(H0) is true
Null hypothesis
(H0) is false
Reject null
hypothesis error
Type I error
False positive Correct outcome
True Positive
Fail to reject null
hypothesis
Correct outcome
True Negative Type II error
False negative

CONSUMER OVERESTIMATION OF DONATION AMOUNT
51
the population has a normal distribution), provided the sample size is sufficiently large.
Simulation studies indicate samples of 25 or more produce an approximately normal
distribution (Groebner et al., 2005, Koundouri & Kourogenis, 2011; Sang Gyu Kwak, & Jong
Hae Kim, 2017). Thus, CLT suggests that picking samples in groups of 30 or more will ensure
a normal distribution within each group (Shirota & Suzuki, 2014; Chang, Wu, Ho & Chen,
2008; Moen & Powell, 2005). Consequently, a minimum of 270 participants is required for
this investigation (i.e., 30 participants for each of the 9 experimental groups.
Further, as a statistical power analysis was performed for sample size estimation, based
on the Low Favorability / Low Familiarity and High Favorability / High Familiarity responses
from the pre-test (N=129). The effect size in this study was considered to be large (0.8) using
Cohen's (1988) criteria. With an alpha = .05 and power = 0.80, the projected minimum sample
size needed in each group with this effect size (GPower 3.1) is approximately N = 21. Thus,
our proposed sample size of 30 will be more than adequate for the main objective of this study.
The questionnaires for the main experiment are shown in Appendix 2. As part of the
online questionnaire, participants were presented with an experimental advertisement for an
annual “Make–A-Difference” event by a fictitious computer retail store (Giga-Byte Computer
Products Inc.) which features a photograph of a brand-name 15.6” notebook computer for
$999.99. The advertisement and sale price are based on an actual advertisement for a
comparable notebook computer placed by a popular Canadian retailer. In an effort to make the
advertisement appear real, standard features of a notebook computer are displayed on the
advertisement - Windows 10, 2-in-1 13.3" Touch-Screen Laptop, Intel Core i7 - 12GB
Memory, 512GB Solid State Drive, Bluetooth; touch screen; backlit keyboard; HDMI output.
At the bottom of each advertisement a statement explaining the donation information
is included. It reads:

CONSUMER OVERESTIMATION OF DONATION AMOUNT
52
“As part of our ongoing commitment to support programs related to children’s health,
recreation and social service issues in the communities where we do business, (phrase
indicating donation information) will be donated to a portfolio of N charities from the
following list of charities - (List of charities that fall into the high favorability–high
familiarity quadrant will be provided)."
The phrase stating the donation information is either vague – “a generous donation”,
estimable – “10% of profits”, or calculable – “10% of sales price”.
In the vague condition, the donation amount is expressed as a generous donation. In the
estimable condition, donation amount is expressed as 10% of profits. In the calculable
condition, donation amount is expressed as 10% of sales price. There are three portfolio sizes:
the first one includes two charities, the second one has 5 charities and the third one has 8
charities.

CONSUMER OVERESTIMATION OF DONATION AMOUNT
53
Vague CRM Donation Quantifier Advertisements Manipulated by Cause Portfolio Size
Figure 9

CONSUMER OVERESTIMATION OF DONATION AMOUNT
54
Estimable CRM Donation Quantifier Advertisements Manipulated by Cause Portfolio Size
Figure 10

CONSUMER OVERESTIMATION OF DONATION AMOUNT
55
Calculable CRM Donation Quantifier Advertisements Manipulated by Cause Portfolio Size
Figure 11
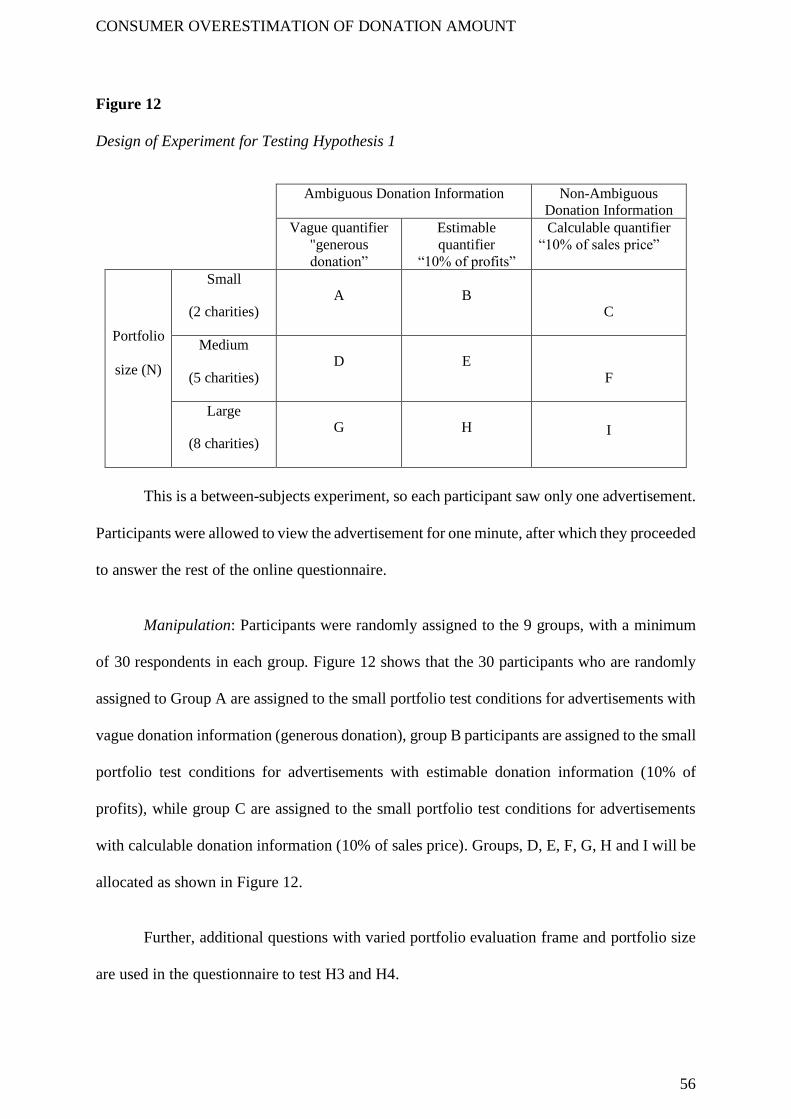
CONSUMER OVERESTIMATION OF DONATION AMOUNT
56
Figure 12
Design of Experiment for Testing Hypothesis 1
Ambiguous Donation Information Non-Ambiguous Donation Information
Vague quantifier
"generous
donation”
Estimable
quantifier
“10% of profits”
Calculable quantifier
“10% of sales price”
Portfolio
size (N)
Small
(2 charities) A B
C
Medium
(5 charities) D E
F
Large
(8 charities) G H
I
This is a between-subjects experiment, so each participant saw only one advertisement.
Participants were allowed to view the advertisement for one minute, after which they proceeded
to answer the rest of the online questionnaire.
Manipulation: Participants were randomly assigned to the 9 groups, with a minimum
of 30 respondents in each group. Figure 12 shows that the 30 participants who are randomly
assigned to Group A are assigned to the small portfolio test conditions for advertisements with
vague donation information (generous donation), group B participants are assigned to the small
portfolio test conditions for advertisements with estimable donation information (10% of
profits), while group C are assigned to the small portfolio test conditions for advertisements
with calculable donation information (10% of sales price). Groups, D, E, F, G, H and I will be
allocated as shown in Figure 12.
Further, additional questions with varied portfolio evaluation frame and portfolio size
are used in the questionnaire to test H3 and H4.

CONSUMER OVERESTIMATION OF DONATION AMOUNT
57
Figure 13 shows that the same participants are divided into eight groups based on
preferences indicated in response to the questions indicating equal versus unequal split of
donation amount among various sizes of portfolio of charities. These groups are I, J, K and L
(aggregated groups), and groups M, N, O and P (segregated groups) respectively. Segregated
groups are those who expressed a preference for donation statement indicating equal split of
donation amount between a specified number of charities, while aggregate groups are those
who expressed preference for donation statement indicating unequal split of donation amount.
Group I is assigned to the aggregated frame test conditions for advertisements with
vague donation information - “generous donation, to be split 70:30 between 2 charities” - while
group K is assigned to the aggregated frame test conditions for advertisements with estimable
donation information - “10% of profits, to be split 70:30 between 2 charities”.
Groups J, L, M, N, O and P are assigned to varying magnitudes of donation amount
from a defined set for aggregated large portfolio of vague and estimable donation quantifiers,
as well as for segregated large and small portfolios of vague and estimable donation quantifiers.

CONSUMER OVERESTIMATION OF DONATION AMOUNT
58
Figure 13
Design of Experiment for Testing Hypothesis 3 & 4
Vague quantifier
“generous donation”
Estimable quantifier
“% of profits”
Small portfolio
(N=2)
(Nested)
Large portfolio
(N=8)
(Nested)
Small portfolio
(N=2)
(Nested)
Large portfolio
(N=8)
(Nested)
Portfolio
evaluation
frame
Aggregate
I
(generous
donation, to be
split 70:30
between 2
charities)
J
(generous
donation,
splitting the
donation
unequally
between 8
charities so that
the 1st charity
receives about
twice as much
as the 8th
charity)
K
(10% of profits,
to be split 70:30
between 2
charities)
L
(10% of profits,
splitting the
donation
unequally
between 8
charities so that
the 1st charity
receives about
twice as much
as the 8th
charity)
Segregated
M
(generous
donation, to be
split 50:50
between 2
charities)
N
(generous
donation, to be
split equally
between 8
charities)
O
(10% of profits,
to be split 50:50
between 2
charities)
P
(10% of profits,
to be split 50:50
between 8
charities)
The CRM portfolio to be used will include only 2 charities for the small portfolio and
8 charities for the large portfolio, as shown in Figure 13.
The questionnaire includes the PANAS instrument (Watson, Clark, & Tellegen, 1988),
which is used to measure positive and negative affect. The PANAS data is used to undertake
the analysis for H2a and H2b. The PANAS instrument is followed by a scale measuring attitude
toward cause-related marketing (Kropp, Holden, & Lavack, 1999). This CRM scale is used to
compare donation estimates between those who have highly favourable attitudes to CRM
versus those with less favourable attitudes to CRM.

CONSUMER OVERESTIMATION OF DONATION AMOUNT
59
Then each respondent viewed the cause-related marketing ad from a hypothetical
company called Gig-a-Byte. As described above, the ad has 3 versions that describe the
charitable donation in either vague, estimable, or calculable terms (i.e., generous donation,
10% of the profits, or 10% of the sales amount). Each of these 3 versions of the ad further has
3 versions, indicating that donations will be provided to a portfolio of either 2, 5, or 8 charities.
This results in 9 versions of the questionnaire, one for each of the 9 experimental conditions.
The questionnaire for each of the experimental conditions includes a brief description
of Gig-a-Byte’s cause-related marketing (CRM) program. It also included a textual description
of the “Save-A-Child” event last year, stating that for every notebook computer purchased $10
was donated to charity with the Children’s Miracle Network being the only charitable
organization recipient, but at the request of customers, this year’s event features donations to
multiple children’s charities.
After viewing this ad, respondents were asked to estimate the aggregate donation amount for
each selected cause portfolio size. Overestimation of donation amount was then defined using
both actual dollar amounts and the scaled responses. Actual dollar amount donated was
$29,982. Hence all scaled responses besides the “less than $30,000” were considered
overestimation of donation.
In total, the questionnaire took approximately 8 to 10 minutes for respondents to
complete. For each portfolio size, results from the ambiguous conditions were compared to
results from non-ambiguous conditions in order to verify the hypothesis that ambiguous
conditions lead to overestimation.
As an incentive for participating in this survey, participants’ computer IP address was
to be used in a draw for a $100 gift certificate. Unfortunately, unforeseen technology challenges
CONSUMER OVERESTIMATION OF DONATION AMOUNT
60
made this impossible, so instead $100 was donated to Canadian Salvation Army at the
conclusion of the data gathering.
Survey Instrument
In an effort to maximize both reliability and validity of the survey instrument used in
this study and consequently quality and quantity of the responses, the instrument was
designed based on the principles discussed in section 3.1. Several factors were taken into
consideration in order to minimize response error.
First, the questionnaire included questions followed a logical flow. Second, in order to
minimize respondent fatigue, the questionnaire was kept short enough that it could be
completed in 8 to 10 minutes. All of the questions asked were either directly related to the
research variables or served to assist the flow, in order to minimize respondent fatigue.
Finally, survey questions related to respondent’s personal details and attitude towards
donation to charity were added to ensure that respondents had sufficient data or knowledge to
answer the questions. The data was gathered in case further analysis may be required to
explain if demographic or responsiveness to CRM moderates the effect of cause portfolio size
on overestimation. Most of the questions were in a close-ended format, well-spaced with
clear instructions presented on a series of linked pages (multiple-item screens) as
recommended for self-administered internet-based surveys (Burns et al., 2008; Borque &
Fielder, 2003).

CONSUMER OVERESTIMATION OF DONATION AMOUNT
61
Figure 14
Scales Used to Measure the Variables
Variable Type of Measurement Scale Descriptive
Statistics
Donation
Overestimation
Ordinal, Treated as Continuous 6-point scale Mean (SD)
Donation Quantifier Nominal Mean (SD)
Portfolio Size Nominal Mean (SD)
Positive / Negative
Affect
Ordinal, Converted to Nominal
(affect level) PANAS scale Mean (SD)
Evaluation Frame Nominal 2- point scale Mean (SD)
Response Rate
The survey instrument was self-administered, however respondents were made aware
that participation was voluntary. A cover letter that explains the reasons for the research, its
importance, and why the respondent was selected, as well as a guarantee of confidentiality,
was included in the invitation to each respondent (Bryman, Teevan & Bell, 2009). The
questionnaires were short and concise to ensure easy understanding. However, a given
respondent’s questionnaire was not included within the data set if the respondent did not answer
a large proportion of the questions, or if it was clear that the questionnaire was not taken
seriously by the respondent. According to Bryman, Teevan & Bell (2009, p 196), the response
rate is calculated as:
Number of usable questionnaires x 100
Total sample – unsuitable members of the sample
A response rate of 66% was achieved.

CONSUMER OVERESTIMATION OF DONATION AMOUNT
62
The central limit theorem suggests a normal distribution will be achieved, with a certain
probability, when the sample size per cell is equal to 30 or higher (Shirota & Suzuki, 2014;
Chang, Wu, Ho & Chen, 2008; Moen & Powell, 2005; Koundouri & Kourogenis, 2011),
assuming the population distribution is normal. The sample size was further verified by
statistical power analysis.
Data Analysis
An analysis of variance (ANOVA) was performed using SPSS, with results indicating
sum of squares, degrees of freedom (df), mean square, F-value and significance (sig) values
for each of the two factors in the design (donation and impact), the interaction effect between
them, as well as for the error term (e).
The F-value, which is determined by dividing the mean square of each independent
variable (and also their interaction) with the mean square of the residual, is to test the null
hypothesis.
The F-test is applied to the responses by comparing the F-value of each against a
tabulated value from an F-distribution table. If the F-value is greater than the tabulated value
and the significance level < 5%, then the null hypothesis is rejected.
In this experiment the dependent variable is donation overestimation. Independent
variables donation quantifier and portfolio size were manipulated to determine whether
increase in portfolio size increases consumer overestimation of donation amount. Independent
variables donation quantifier and positive and negative affect levels were also manipulated to
determine whether positive and negative affects moderate effect of increase in portfolio size
on extremity of consumer overestimation of donation amount. Finally, independent variables
donation quantifier and portfolio size were manipulated while participants were able to self-

CONSUMER OVERESTIMATION OF DONATION AMOUNT
63
select among types of independent variable portfolio evaluation frame to determine whether
segregated framing portfolio evaluation either leads to lower overall consumer overestimation
of the donation amount or attenuates the effect of cause portfolio size on the extremity of
consumer overestimation of the CRM donation amount.
Validity and Reliability
Bryman, Teevan & Bell (2009) propose three criteria for evaluating the quality of any
quantitative research – replicability, reliability and validity. Replicability refers to whether
others can repeat part or all of a study and get the same results. It can be enhanced by ensuring
that methods used in generating a set of findings are made explicit (Bryman, Teevan & Bell,
2009).
Reliability emphasizes consistency of a particular measurement technique to yield the
same result if administered on different occasions (Bryman, Teevan & Bell, 2009). Generally,
the three types of reliability includes: (1) stability of results of a measure over time, assuming
the concept being measured did not change; (2) internal reliability which is concerned about
whether multiple measures administered in one sitting are consistent; and (3) inter-observer
reliability, which is concerned with consistency in decisions when two observers are used. This
study is most concerned with internal reliability.
A key criticism of experimental design is that manipulations of independent variables
happen over a short time period in experimental designs (Brannigan, 2004), but these variables
affect everyday life over a much longer time period; therefore, there may be a discrepancy
between short term and long term impacts. This criticism further indicates why reliability is
important in experimental design.

CONSUMER OVERESTIMATION OF DONATION AMOUNT
64
Typically, there are two types of errors in a measurement – random errors (XR) and
systematic error (XS). Reliability evaluates how much of the variation of a measure is due to
random errors. However, a perfectly reliable measure (XR=0) may still have systematic error.
Therefore, reliability of a measure is a necessary, but not a sufficient, condition for validity
(Brahma, 2009).
Validity, on the other hand, is concerned with the integrity of the conclusions of the
research. Three main types of validity are construct validity, internal validity and external
validity (Bryman, Teevan & Bell, 2009). Construct validity refers to the extent to which an
indicator really measures the construct it is supposed to measure (Brahma, 2009). Internal
validity measures the extent to which manipulation of the independent variables truly causes
the observed changes in the dependent variable; therefore, it relates to factors of systematic
error. External validity is concerned with the generalizability of results beyond the sample used
in the study (Easterby-Smith, Thorpe & Jackson, 2008).
Construct validity is maximized when the researcher is able to rule out any possible
rival explanation of the relationship between constructs (Podsakoff, et al., 2003). On the other
hand, external validity is maximized when samples used are highly representative of the
population under study and, by extension, more representative of the “real world”. Internal
validity is maximized when the experiment is able to eliminate or control the effect of all other
factors on the dependent variable (Stewart, 2010a). Six extraneous factors that affect internal
validity are history effect, maturation effect, testing effect, instrumentation effect, selection
bias and mortality.
Bryman, Teevan and Bell (2009, p. 27), citing Cook and Campbell (1979), also identified
five major threats to generalizability (external validity) of the findings. In the case of this
model, the relevant threats are as follows:

CONSUMER OVERESTIMATION OF DONATION AMOUNT
65
• Interaction of independent variable and history: The Canadian economy was very
buoyant at the time of this study in 2019, and as a result people may have been more
generous and willing to support CRM causes. It remains to be seen whether the findings
of this experiment will be generalizable if and when economic conditions change in the
future.
• Reactive effect of experimental arrangements: Since most respondents are aware that
they are participating in an experiment, their responses may reflect an effort to behave
in a socially acceptable manner, rather than sincerity and spontaneity; this could affect
the generalizability of the findings.
The proposed research design for this study will use much of the same structure as proposed
by Bryman, Teevan and Bell (2009), which is to ensure replicability, reliability and validity.
Using the guidance from (Bryman, Teevan & Bell, 2009) replicability of the study was
assured by providing a detailed description of the procedure for selecting respondents,
administering data gathering instrument (self-completed questionnaires) in section 3.1 and
description of the analysis of data in section 4.1. Internal reliability of each group of scaled was
tested using Cronbach’s alpha coefficient. Cronbach’s alpha coefficient for questions was
within the range of 0.700 – 0.895.
Further using the guidance from (Bryman, Teevan & Bell, 2009), a construct validity was
performed. Overestimation of donation amount variable was tested for convergent and
divergent validity with respect to other constructs in the questionnaire – age, gender, positive
affect variable (excited), negative affect variable (upset). A weak correlation was observed
with age and gender. On the other hand, a strong correlation with the positive affect variable
(excited) was observed as well as a negative correlation with the negative affect variable
(upset).

CONSUMER OVERESTIMATION OF DONATION AMOUNT
66
Ethical Considerations
This study involved human subjects so several principles were adhered to. Firstly,
approval of the Athabasca University Research Ethics board was received before proceeding
with this study. Secondly, consent of potential subjects was received before participating in the
experiment and they were advised of all risks of participation (Bryman, Teevan & Bell, 2009).
Finally, no harm to participants is expected or intended to occur as result of this study, and the
identities and records of participants remain confidential (Bryman, Teevan & Bell, 2009).

CONSUMER OVERESTIMATION OF DONATION AMOUNT
67
Chapter 4. Results
Chapter 3 described the method used in collection of data for this research. This chapter
will present descriptive statistics of the sample and results of the hypothesis testing.
Data Analysis
A minimum of 270 responses were required to ensure normal distribution of responses
as per the central limit theorem, assuming the population is normally distributed (i.e., 30
responses for each of the 9 experimental cells for H1). This is further verified with statistical
power analysis, which affirmed minimum sample required per experimental cell is 21. Overall,
350 survey responses were received.
As part of the methodology involved in using the internet questionnaire, respondents
were randomly assigned to groups, which resulted in the frequency distribution shown in
Figure 15
Figure 15
Distribution of Subjects in Experimental Cells
Distribution of Subjects in Experimental Cells
Vague quantifier
"generous
donation”
Estimable
quantifier
“10% of profits”
Calculable
quantifier
“10% of sales
price”
Total
Small (2 charities)
n=34 9.7%
n=40 11.4%
n=38 10.9%
n=112 32.0%
Medium
(5 charities)
n=43
12.4%
n=39
11.1%
n=39
11.1%
n=121
34.6%
Large
(8 charities)
n=32
9.1%
n=53
15.2%
n=32
9.1%
n=117
33.4%
N
Total
n=109
31.2%
n=132
37.7%
n=109
31.1%
n=350
100.0%

CONSUMER OVERESTIMATION OF DONATION AMOUNT
68
Because 120 of the 350 responses had some degree of missing data, most of the analyses
that follow in this section are based upon a slightly smaller number of subjects.
The decision was made to include the 120 questionnaires with some degree of missing data for
testing interaction of cause portfolio size with overestimation (hypothesis 1), because most of
the data missing were related to the PANAS scale (hypotheses 2) and portfolio evaluation
frames (hypotheses 3 and 4). All response related to donation estimate were complete.
Hypothesis 1
H1: When donation information is ambiguous (i.e., expressed as vague or estimable
quantifier formats), consumer overestimation of donation amount will become more
extreme as size of the cause portfolio increases.
In order to test H1, an ANOVA was carried out. For the purposes of this ANOVA, the
estimation of donation amount was treated as a continuous variable and was coded as follows:
1(less than $30,000), 2($30,000-$59,999), 3($60,000-$89,999), 4($90,000-$119,999),
5($120,000-$149,999), 6($150,000 or more) (Light & Margolin, 1971; Norman, 2010;
Sullivan & Artino, 2013; Zumbo & Zimmerman, 1993). All estimation of donation amount
coded as 2($30,000-$59,999), 3($60,000-$89,999), 4($90,000-$119,999), 5($120,000-
$149,999), 6($150,000 or more) are considered overestimation. Only 6 participants did not
overestimate the donation amount.
The Mean values of each of these coded categories are used in the ANOVA and are listed in
Figure 16.
The results of the 3 (portfolio size: small vs. medium vs. large) x 3 (donation quantifier
format: vague (ambiguous) vs. estimable (ambiguous) vs. calculable (non-ambiguous) full
factorial design, to test hypothesis 1 are shown in Figure 17. The main effect of donation

CONSUMER OVERESTIMATION OF DONATION AMOUNT
69
quantifier on overestimation yielded an F ratio of F(2,321) = 5.99 p = 0.003 indicating a
significant difference of overestimation between vague (M = 2.81, SD = 1.58), estimable (M =
2.95, SD = 1.43) and calculable (M = 3.46, SD = 1.34) donation quantifiers. A Post Hoc Tukey
test determined the Calculable Quantifier to be the driver of this effect. The main effect of
portfolio size on overestimation yielded an F ratio of F (2,321) = 0.98, p = 0.38 indicating a
non-significant difference of overestimation between small (M = 2.96, SD = 1.46), medium (M
= 3.04, SD = 1.48) and large (M = 3.20, SD = 1.48) charities. The test of H1 to evaluate if
interaction of donation quantifier and portfolio size causes overestimation to become more
extreme yielded a non-significant F ratio of F (4, 321) = 0.426, p = 0.79.
Figure 16
Means and Standard Deviations – Hypothesis 1
Estimation of donation amount
Cell Means: ANOVA
Vague quantifier
"generous
donation”
Estimable quantifier
“10% of profits”
Calculable
quantifier
“10% of sales
price”
Grand
Mean
Small
(2 charities)
Mean = 2.58
(s.d. = 1.54)
n= 33
Mean =3.03
(s.d. = 1.50)
n= 37
Mean = 3.26
(s.d. = 1.29)
n= 35
Mean – 2.96
(s.d. = 1.46)
n=105
Medium
(5 charities)
Mean = 2.85
(s.d. = 1.56)
n=41
Mean = 2.77
(s.d. = 1.42)
n= 35
Mean = 3.49
(s.d. = 1.37)
n= 37
Mean = 3.04
(s.d. = 1.48)
n=113
Large
(8 charities)
Mean = 3.00 (s.d. = 1.65)
n= 31
Mean = 3.02 (s.d. = 1.39)
n= 49
Mean = 3.66 (s.d. = 1.40)
n= 32
Mean = 3.20 (s.d. = 1.48)
n=112
Grand
Mean:
Mean = 2.81 (s.d. = 1.58)
n= 105
Mean = 2.95 (s.d. = 1.43)
n= 121
Mean = 3.46 (s.d. = 1.34)
n= 104
Mean = 3.07 (s.d. = 1.47)
n=330

CONSUMER OVERESTIMATION OF DONATION AMOUNT
70
Figure 17
ANOVA Results – Hypothesis 1
Source
Sum of
Square
df
Mean Square
F Sig
Donation_ Quantifier
25.317 2 12.659 5.989 .003
Portfolio Size 4.141 2 2.071 .980 .377
Donation Quantifier x Portfolio Size interaction
3.603 4 .901 .426 .790
A visual inspection of the data back in Figure 16 suggests that there is a pattern of
sequentially increased donation overestimation for the Small portfolio vs. Medium portfolio
vs. Large portfolio, within both the Vague quantifier and Calculable quantifier conditions.
However, this pattern does not seem to hold for the Estimable quantifier condition. In any case,
the overall differences between different sized portfolios were insufficient to attain statistical
significance.
H1 states that when donation information is ambiguous (i.e., expressed as vague or
estimable quantifier formats), consumer overestimation of donation amount will become more
extreme as size of the cause portfolio increases. However, these results mean that if compared
to H1, responses received did not provide sufficient evidence to conclude that increase in cause
portfolio size will cause consumer overestimation of donation amount to become more extreme
when donation information is expressed in vague or estimable quantifier formats.

CONSUMER OVERESTIMATION OF DONATION AMOUNT
71
Figure 18
Plot of Estimated Marginal Means – Hypothesis 1
Hypothesis 2a & 2b
H2a: When the donation information is ambiguous (i.e., expressed in vague or
estimable quantifier formats), the consumer’s level of positive affect positively
moderates the effect of the size of a given multiple cause portfolio on the extremity of
consumer overestimation of the CRM donation amount.
H2b: When the donation information is ambiguous (i.e., expressed in vague or
estimable quantifier formats), the consumer’s level of negative affect negatively
moderates the effect of the size of a given multiple cause portfolio on the extremity of
consumer overestimation of the CRM donation amount.
A Factor Analysis was conducted to ensure that the PANAS scale actually loads onto
two factors as it is intended to. Eigenvalues for the Factor analysis confirmed that PANAS is
made up of only two components, with scale items for positive and negative affect aligning
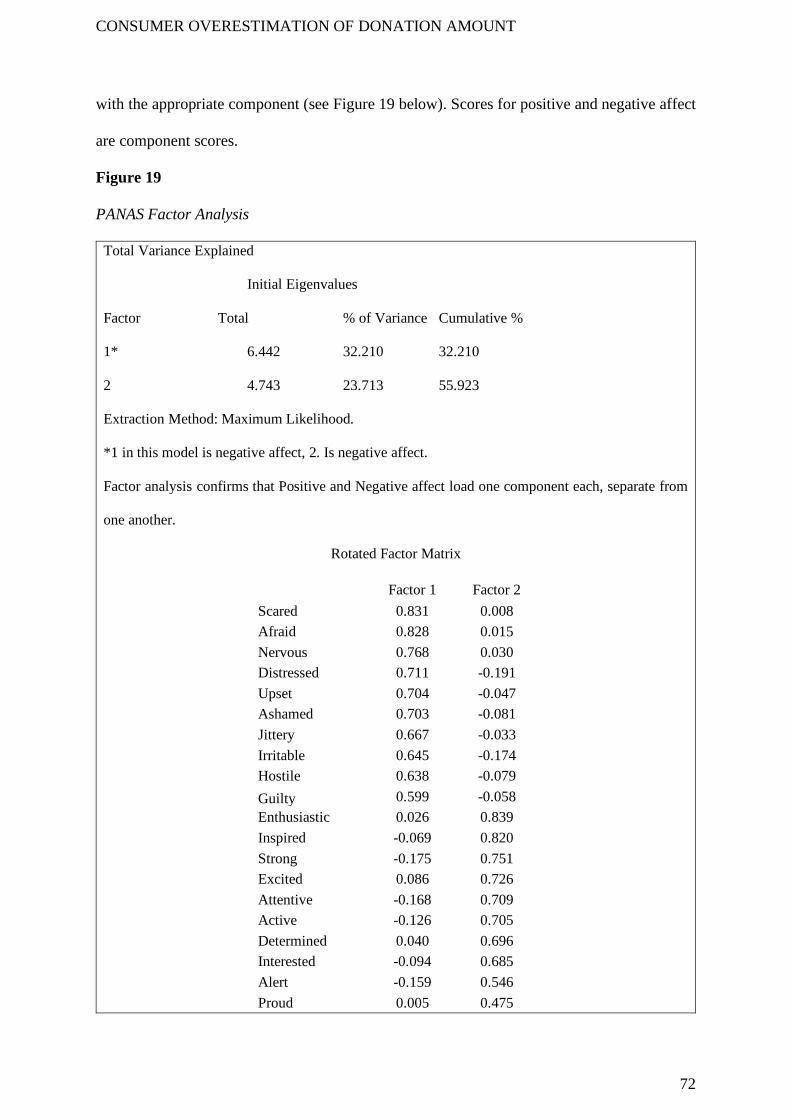
CONSUMER OVERESTIMATION OF DONATION AMOUNT
72
with the appropriate component (see Figure 19 below). Scores for positive and negative affect
are component scores.
Figure 19
PANAS Factor Analysis
Total Variance Explained
Initial Eigenvalues
Factor Total % of Variance Cumulative %
1* 6.442 32.210 32.210
2 4.743 23.713 55.923
Extraction Method: Maximum Likelihood.
*1 in this model is negative affect, 2. Is negative affect.
Factor analysis confirms that Positive and Negative affect load one component each, separate from
one another.
Rotated Factor Matrix
Factor 1 Factor 2
Scared 0.831 0.008
Afraid 0.828 0.015
Nervous 0.768 0.030
Distressed 0.711 -0.191
Upset 0.704 -0.047
Ashamed 0.703 -0.081
Jittery 0.667 -0.033
Irritable 0.645 -0.174
Hostile 0.638 -0.079
Guilty 0.599 -0.058
Enthusiastic 0.026 0.839
Inspired -0.069 0.820
Strong -0.175 0.751
Excited 0.086 0.726
Attentive -0.168 0.709
Active -0.126 0.705
Determined 0.040 0.696
Interested -0.094 0.685
Alert -0.159 0.546
Proud 0.005 0.475

CONSUMER OVERESTIMATION OF DONATION AMOUNT
73
The following two graphs (Figure 20 and 21) show the distribution of scores for
Positive affect and Negative affect. The Positive affect scale follows a normal distribution,
while the Negative affect scale does not. The positive skewness displayed by Negative affect
scale distribution is consistent with the tendency of the Negative affect data set as observed in
previous research (Crawford & Henry, 2004; Merz et al., 2013; Watson et al., 1988). It suggests
that people generally endorse greater levels of Positive affect (Mean = 30.3, SD = 3.8),
compared to Negative affect (Mean = 20.7, SD = 3.5).
Figure 20
Positive Affect Distribution
Figure 21
Negative Affect Distribution

CONSUMER OVERESTIMATION OF DONATION AMOUNT
74
In order to use the PANAS scales in an ANOVA, the positive and negative affect scales
were each subjected to a 3-way split. The lowest 1/3 of scores for each scale was labeled as
“low”, the middle 1/3 was labeled as “medium” and highest 1/3 was labeled “high”. For
positive affect this resulted in low scores falling at a value of 26 or below, medium values
between 27-35, and high values at 36 and above. For negative affect this resulted in low values
falling between 10-13, medium values between 14-24 and high values at 25 and above (see
distribution of raw data and affect levels by IV category below in Figures 22-23). This approach
makes it easy to estimate interactions in ANOVAs.
Figure 22
PANAS Positive Affect Sub Scores
Positive Affect Scale
Mean (SD)
Low Positive Affect
18.9 (5.0)
n= 82
Medium Positive Affect
30.9 (2.5)
n= 80
High Positive Affect
41.0
(3.9) n=68
Grand Mean:
30.3
(3.8)
n=230

CONSUMER OVERESTIMATION OF DONATION AMOUNT
75
Figure 23
PANAS Negative Affect Sub Scores
Negative Affect Scale
Mean (SD)
Low Negative Affect
11.2 (1.2)
n= 81
Medium Negative Affect
18.1 (3.2)
n= 84
High Negative Affect
32.9
(6.2) n=65
Grand Mean:
20.7
(3.5)
n=230
In order to test hypothesis 2a and 2b, a 3 (small, medium, large portfolio size) x 3 (low,
medium, high affect level) ANOVA was performed. For this analysis, ambiguity was collapsed
across vague and estimable because initial ANOVA analysis indicates similar results from both
ambiguous variables. For hypothesis 2a, regarding the moderating influence of positive affect
on portfolio effect of overestimation extremity, the results are as follows: The Mean values of
each of these coded categories are used in the ANOVA and are listed in Figure 24 below.

CONSUMER OVERESTIMATION OF DONATION AMOUNT
76
Figure 24
PANAS Positive Affect Scores
Low Positive
Affect
Medium Positive
Affect
High Positive
Affect
Grand Mean
Small
(2 charities)
3.26
(0.99) n=19
2.82
(0.94) n=39
2.71 (1.25)
n=7
2.94
(1.00) n=65
Small
(2 charities)
3.26
(0.99)
n=19
2.82
(0.94)
n=39
2.71
(1.25)
n=7
2.94
(1.00)
n=65
Medium
(5 charities)
2.83
(1.47)
n=28
3.23
(1.15)
n=52
3.82
(1.33)
n=11
3.29
(1.21)
n=81
Large
(8 charities)
4.20
(1.30)
n=5
3.15
(1.29)
n=52
3.53
(1.38)
n=17
3.31
(1.23)
n=74
Grand Mean
3.33
(1.18)
n=52
3.09
(1.16)
n=143
3.46
(1.36)
n=35
3.03
(3.7)
n=230
The main effect of positive affect level on overestimation yielded an F ratio of F (2,
199) = 1.40, p = 0.25. indicating a non-significant difference in overestimation between low,
medium and high positive affect. The test of H2a to evaluate if interaction of positive affect
level and portfolio size positively moderates effect of portfolio size on overestimation yielded
a non-significant F ratio of F (4, 199) = 1.37, p = 0.25
Figure 25
ANOVA Results – PANAS Positive Affect
Source
Sum of Square
df
Mean
Square
F Sig
Positive Affect
3.920 2 1.960 1.401 0.249
Positive Affect x Portfolio
Size Interaction 7.682 4 1.920 1.373 0.245

CONSUMER OVERESTIMATION OF DONATION AMOUNT
77
Figure 26
Plot of Estimated Marginal Means – PANAS Positive Affect
For hypothesis 2b, regarding the moderating influence of negative affect on portfolio
effect of overestimation extremity, the results are as follows: The Mean values of each of these
coded categories are used in the ANOVA and are listed in Figure 27 below (see Figure 29 for
visual depiction of results).

CONSUMER OVERESTIMATION OF DONATION AMOUNT
78
Figure 27
PANAS Negative Affect Scores
Low
Negative
Affect
Medium Negative
Affect
High Negative
Affect
Grand Mean
Small
(2 charities)
3.00
(1.00)
n=7
2.87
(0.98)
n=32
3.04
(1.06)
n=25
2.95
(1.00)
n=64
Medium
(5 charities)
4.00
(1.63)
n=27
3.26
(1.18)
n=53
2.80
(0.92)
n=10
0.27
(1.22)
n=90
Large
(8 charities)
4.07
(1.54)
n=14
3.27
(1.22)
n=49
3.00
(1.35) n=13
3.37
(1.34)
n=72
Grand Mean
3.79
(1.48)
n=48
3.17
(1.15)
n=134
2.98
(1.10)
n=48
3.21
(1.21)
n=230
The main effect of negative affect level on overestimation yielded an F ratio of F (2, 201) =3.22
p = 0.04, indicating a significant difference of overestimation between low, medium, and high
negative affect. The interaction of negative affect level and portfolio size yielded a non-
significant F ratio of F (4, 201) = 0.97, p = 0.43.
H2 states that when donation information is ambiguous (i.e., expressed as vague or
estimable quantifier formats), consumer’s level of positive affect positively moderates the
effect of the size of a given multiple cause portfolio on the extremity of consumer
overestimation of the CRM donation amount and consumer’s level of negative affect
negatively moderates the effect of the size of a given multiple cause portfolio on the extremity
of consumer overestimation of the CRM donation amount. However, these results mean that if
compared to, responses received did not provide sufficient evidence to conclude that
interaction effects of positive or negative affect exists with regard to overestimation. That said,
some interactions with regards to overestimation may exist between small and large portfolio
sizes under medium negative affect conditions.

CONSUMER OVERESTIMATION OF DONATION AMOUNT
79
Figure 28
ANOVA Results – PANAS Negative Affect
Source
Sum of Square
df
Mean
Square F Sig
Negative Affect
9.052 2 4.526 3.216 0.042
Negative Affect x Portfolio Size Interaction
5.456 4 1.364 0.969 0.425
Figure 29
Plot of Estimated Marginal Means – PANAS Negative Affect
Hypothesis 3 & 4
H3: When evaluating a portfolio of multiple causes with ambiguous donation
information (i.e., expressed in vague or estimable quantifier formats), segregated
framing of the portfolio evaluation leads to lower overall consumer overestimation of
the donation amount, compared to aggregated framing of the same portfolio.

CONSUMER OVERESTIMATION OF DONATION AMOUNT
80
H4: When evaluating a portfolio of multiple causes with ambiguous donation
information (i.e., expressed in vague or estimable quantifier formats), segregated
framing of the portfolio evaluation attenuates the effect of cause portfolio size on the
extremity of consumer overestimation of the CRM donation amount.
In order to test hypotheses 3 and 4, a 2 x 2 x 2 factorial design of cause portfolio size
(small vs. large) and portfolio evaluation frame (segregated vs. aggregated) nested within the
ambiguous donation quantifier factor (vague vs. estimable) was used. However, the portfolio
evaluation frame (segregated vs aggregate) was a variable in which respondents indicated
whether they preferred a donation be split 70:30 (aggregate) or 50:50 (segregate). The vast
majority of respondents preferred the segregate option, likely due to the fact that it seems the
most fair. This resulted in experimental cells which did not have a sufficient number of
respondents (i.e., there should ideally be at least 30 subjects in each experimental cell).
Therefore, the ANOVA has been carried out, but it needs to be treated with caution because of
the small cell sizes for the aggregate portfolio evaluation frame variable.
The ANOVA results are as follows: The Mean values of each of these coded categories
are used in the ANOVA and are listed in Figure 30.

CONSUMER OVERESTIMATION OF DONATION AMOUNT
81
Figure 30
Means and Standard Deviations – Hypotheses 3 &4
Vague
Quantifier
Estimable
Quantifier
Grand Mean
Small
(2 charities)
Segregate
2.97
(0.99)
n= 30
2.94
(1.03)
n= 33
2.95
(1.01)
n= 63
Aggregate
2.50
(0.71)
n= 2
2.00
(0)
n= 2
2.25
(0.50)
n=4
Sub Grand Mean 2.94
(0.98)
n= 30
2.89
(1.02)
n= 35
2.91
(1.00)
n=67
Large
(8 charities)
Segregate
3.64
(1.39)
n= 28
3.24
(1.28)
n= 45
3.40
(1.33)
n=73
Aggregate
3.50
(0.71)
n= 2
2.33
(1.53)
n= 3
2.80
(1.30)
n= 5
Sub Grand Mean 3.63 (1.35)
n= 30
3.19 (1.30)
n= 48
3.36 (1.33)
n= 78
Grand Mean
Segregate
3.29
(1.24)
n= 58
3.12
(1.18)
n= 78
3.19
(1.21)
n= 136
Aggregate
3.00 (0.82)
n= 4
2.20 (1.10)
n= 5
2.56 (1.01)
n= 9
Sub Grand Mean 3.27
(1.22)
n= 62
3.06
(1.19)
n= 83
3.15
(1.20)
n= 145
Note: sample size is down to 145 due to 5 groups of participants (3 groups of 2, 5 and 8
cause portfolios with calculable quantifier conditions; 2 groups of 52 cause portfolio with
vague and estimable conditions) being excluded as they are not relevant to the hypothesis
being tested
CONSUMER OVERESTIMATION OF DONATION AMOUNT
82
The main effect of evaluation frame (segregate vs. aggregate) yielded an F ratio of F
(1,137) = 2.20, p = 0.14 (shown in Figure 31), indicating no significant difference in
overestimation between segregate (M = 3.19, SD = 1.21) and aggregate (2.56, SD = 1.01)
collapsed across donation quantifier factor and charity size (hypothesis 3). The main effect of
donation quantifier factor yielded an F ratio of F (1,137) = 1.59, p = 0.21, indicating a non-
significant difference between vague (M = 3.27, SD = 1.22) and estimable (M = 3.06, SD =
1.19). The main effect of portfolio size on overestimation yielded an F ratio of F (1,137) =
1.94, p = 0.17, indicating a non-significant difference between small (M = 2.91, SD = 0.99)
and large (M = 3.36, SD = 1.33) charities. The interaction effect of donation quantifier factor
x evaluation frame x charity size on overestimation (hypothesis 4) yielded a non-significant F
factor of F (1, 137) = 0.03, p = 0.86, interaction effects of donation quantifier factor x portfolio
size, portfolio size x eval frame and donation quantifier factor x eval frame also yielded non-
significant results (Figures 32-35. provides the individual non-significant 2-way interactions).
These results mean that responses received did not provide sufficient evidence to
support H3 which states that when evaluating a portfolio of multiple causes with ambiguous
donation information (i.e., expressed in vague or estimable quantifier formats), segregated
framing of the portfolio evaluation leads to lower overall consumer overestimation of the
donation amount, compared to aggregated framing of the same portfolio.
Responses received neither provided sufficient evidence to support H4, which states
when evaluating a portfolio of multiple causes with ambiguous donation information (i.e.,
expressed in vague or estimable quantifier formats), segregated framing of the portfolio
evaluation attenuates the effect of cause portfolio size on the extremity of consumer
overestimation of the CRM donation amount.

CONSUMER OVERESTIMATION OF DONATION AMOUNT
83
Figure 31
ANOVA Results – Hypotheses 3 & 4
Source
Sum of Square
df
Mean
Square F Sig
Donation Quantifier Factor
2.239 1 2.239 1.588 0.210
Portfolio Size 2.740 1 2.740 1.943 0.166 Evaluation Frame 3.096 1 3.096 2.195 0.141
Donation Quantifier Factor x Portfolio Size
0.551 1 0.551 0.391 0.533
Donation Quantifier Factor x Evaluation Frame
0.788 1 0.788 0.558 0.456
Portfolio Size x Evaluation Frame
0.063 1 0.063 0.045 0.832
Donation Quantifier Factor x Portfolio Size x
Evaluation Frame 0.045 1 0.045 0.032 0.859
Figure 32
Plot of Estimated Marginal Means – Hypotheses 3 & 4 (Portfolio Size vs. Quantifier)

CONSUMER OVERESTIMATION OF DONATION AMOUNT
84
Figure 33
Plot of Estimated Marginal Means– Hypotheses 3 & 4 (Evaluation Frame vs. Quantifier)
Figure 34
Plot of Estimated Marginal Means – Hypotheses 3 & 4 (Evaluation Frame vs. Portfolio Size)

CONSUMER OVERESTIMATION OF DONATION AMOUNT
85
Studies have shown that a t-test may be feasible for comparing means of the aggregate
portfolio evaluation frame variable to other variables in this case as long as the effect size is
large and also bears risk to credibility of the findings due to high false positive rate that could
occur for unequal sample sizes combined with unequal variances (de Winter, 2013; Janušonis,
2009). Therefore, an independent sample t-test has been carried out to test H3 (hypothesis 3)
which was most impacted by the small cell size of the aggregate portfolio evaluation frame
variable, but it needs to be treated with caution because of the small cell sizes for the aggregate
frame variable.
Results of the independent sample t-test are as follows: The Mean values of each of
these coded categories are used in the independent sample t-test and are listed in Figure 35
below.
Figure 35
T-Test Means and Standard Deviations – Evaluation Frame
Segregate Frame Aggregate Frame
3.19
(1.21)
n= 136
2.56
(1.01)
n= 9
Equal variances assumed as the p value for the F test is equal to 0.722, hence greater than 0.5.
T-test value = 1.541, p (two tailed) = 0.125 (shown in Figure 36), indicating no significant
difference in overestimation between segregate (M = 3.19, SD = 1.21) and aggregate (2.56, SD
= 1.01) collapsed across donation quantifier factor and charity size (hypothesis 3).

CONSUMER OVERESTIMATION OF DONATION AMOUNT
86
Figure 36
T-Test Results – Evaluation Frame
Donation Size
Overestimation
F Sig t df
Sig
(2 tailed)
Equal variances
assumed
0.127 0.722 1.541 143 0.125
Equal variances not
assumed 1.798 9.5869 0.104
These results mean that responses received did not provide sufficient evidence to support H3
which states that when evaluating a portfolio of multiple causes with ambiguous donation
information (i.e., expressed in vague or estimable quantifier formats), segregated framing of
the portfolio evaluation leads to lower overall consumer overestimation of the donation
amount, compared to aggregated framing of the same portfolio.

CONSUMER OVERESTIMATION OF DONATION AMOUNT
87
Chapter 5. Discussion
The literature review sends a clear message that cognitive distortion results in consumer
overestimation of donation amount to cause-related marketing campaigns. Confusion
associated with expressing CRM donation information, either as a percentage of profit or a
percentage of proceeds, leads many consumers to engage in inappropriate estimation strategy
selection while attempting to take computational short cuts, which results in near universal
overestimation of the donation amount (Pracejus, Olsen & Brown, 2004; Olsen, Pracejus &
Brown, 2003; Vardarajan & Menon, 1988). The ethical literature on CRM further sends the
message that this cognitive distortion resulting from confusion associated with expressing
CRM donation information can effectively be used in CRM strategies to manipulate consumer
perception of underlying motivations for corporate sponsorship of CRM, and thus consumer
choice of a brand (Hamby & Brinberg, 2018; Vlakos et al., 2016; Müller, Fries & Gedenk,
2014; Moosmayer & Fuljahn, 2010; Subrahmanyan, 2004; Hajjat, 2003; Barone, Miyazaki &
Taylor, 2000; Strahilevitz, 1999; Dahl & Lavack, 1995).
This possibility to manipulate consumers using CRM strategies raises an ethical
concern for marketing and public policy from a consumer protection perspective (Pracejus et
al., 2020; Olsen, Pracejus & Brown, 2003). Such concerns arise from the fact that the parties
involved, for-profits and charities, have essentially different goals and unequal leverage in the
alliance (Andreasen, 1996). Hence, when charities enter into partnership with a financially
stronger partner, they may be powerless to set clear rules of conduct. Thus, charities’
reputations, consumer affinity to their causes could be exposed to the risk of being exploited
by the corporation to influence consumers participation in CRM campaigns (Farache et al.,
2007). Further, it should be noted that Federal Trade Commission (FTC) enforcement policy
against deceptive acts and practices (1983) defined three conditions to satisfy the deceptive
practices definition: (1) The practice must be likely to mislead consumers; (2) the ability to

CONSUMER OVERESTIMATION OF DONATION AMOUNT
88
mislead consumers is examined from the perspective of consumer reasonableness in the group
targeted; and (3) the practice must be material, thereby influencing consumers’ decisions.
Therefore, when a corporation’s efforts to more effectively manipulate the CRM donation
message for greater audience effect leads to consumer confusion and overestimation of
donation amount due to use of ambiguous donation information format, it could be perceived
as ethically walking a fine line with respect to violation of the FTC policy.
One of the goals of this research is to further contribute to the fast-growing body of
knowledge on CRM, by providing an understanding of the determinants of consumer
overestimation of the donation amount in the unexplored context of multiple cause portfolio
CRM campaigns. This will help to expose policy makers to an additional area of focus in CRM
practice, where regulation or a code of conduct is urgently needed from a public policy
perspective.
The goal of this study was to investigate effects of cause portfolio size and framing of
donation information on how consumer overestimate amount to be donated by a cause-related
marketing (CRM) campaign. Current research points to cognitive bias as the underlying reason
for people overestimating the effectiveness of their own contribution to public good. This
overestimation can be exacerbated in the context of cause related marketing (CRM) campaigns.
Unlike previous studies that focus on CRM campaigns with ties to a single cause, this study
aimed to further explore the cognitive bias involved in overestimation via factors of campaign
framing and as well as size. This study also took into account personality factors related to
positive and negative affect. We discuss the implications of our findings below. This section is
structured in order of the research hypotheses posed in the study.
The first hypothesis (H1) sought to identify the extremity of consumer overestimation
when donation information is ambiguous (vague, estimable) as function of size cause portfolio

CONSUMER OVERESTIMATION OF DONATION AMOUNT
89
size (small, medium, large). Results showed that while donation quantifier (vague vs. estimable
vs calculable) was predictive of overestimation extremity, with calculable as the driving factor,
neither cause portfolio size on its own, nor donation quantifier as a function of cause portfolio
were predictive of overestimation extremity. This is a surprising finding in that, the main effect
of donation quantifier is driven by the higher mean in the calculable category. This indicates
that when tangible information is available, individuals overestimate their donation amounts
even more. This speaks to the logical flaw inherent in cognitive biases. It means that under
certain conditions, cognitive biases are consonant with logical fallacies (misconception that
results from faulty reasoning or information processing) resulting in overestimation of donation
amount. In other words, even when tangible information is available, individuals may still
perceive this as if the cognitive resources available for donation estimate calculation are less
than the cognitive resources required (RA < RR), subjects will resort to heuristic processing
which could lead to overestimation (Anand & Sternthal, 1989).
Next, in H2a and H2b we investigated the influence that positive and negative affect
have on the cause portfolio size determinant of overestimation. Results showed that there were
no interaction effects of positive or negative affect with regards to overestimation. While a
main effect of negative affect on overestimation was encountered, there no main effect of
positive affect with regards to overestimation. It is possible that although positive mood is
associated with higher life satisfaction ratings, this same effect does not translate to financial
overestimation. While studies do show that people who have more money are in fact happier
(an empirical negation of the maxim “money can’t buy happiness”) it is possible that this does
not translate to their estimation of charitable impact. In fact, it could perhaps be argued that
someone with a negative affect would be more likely to overestimate a donation in a way of
seeking hope. This, however, would require that negative affect has not translated to
hopelessness and pessimism. At any rate, some interactions with regards to overestimation may

CONSUMER OVERESTIMATION OF DONATION AMOUNT
90
exist between small and large portfolio sizes under medium negative affect conditions. Our
sample showed a reasonable distribution across low, medium and high positive and negative
affect. This indicates a sample of individuals whereby those primed for positivity were pretty
well matched with those primed for negativity across high, medium and low levels. Therefore,
it was not the case that we failed to capture a reasonably extreme high/low level of affect. One
possibility is simply that the PANAS is not the best tool to use when connecting mood to
monetary investment. Future studies should look into mood scales more closely tied to
investment, charity and monetary factors.
Lastly, in H3 and H4 we investigated the framing effects: segregated vs. aggregated,
on consumer overestimation. In H3 we first looked at whether segregated framing led to lower
overestimation in portfolios of multiple causes when donation information was ambiguous
(vague or estimable). Results revealed no significant difference in overestimation between
segregated and aggregated framing. In H4 we then looked at the potential moderating impact
of segregated framing on the effect cause portfolio size has on donation overestimation. Results
revealed no such interaction. Given our previous null results, the lack of findings related to
framing was not terribly surprising. What becomes clear from our analyses is that individuals
are relatively insusceptible to nuances regarding CRM. This suggests that overestimation
appears to be a thought process that does not necessarily take into consideration the many
variables we have presented here, including framing. Framing involves a consideration about
calculations and ratios, and we know from our first hypothesis that individuals overestimate in
the presence of calculable evidence. Therefore, it should perhaps come as no surprise that
overestimation is not moderated by calculable framing effects.
The consistently nonsignificant null results of our study indicate a resiliency of
overestimation that is not moderated by nuanced factors such as charity size, framing effects
or mood. All but 6 respondents indicated donation estimation categories that are higher than

CONSUMER OVERESTIMATION OF DONATION AMOUNT
91
the actual $29,982 donation made the popular Canadian retailer as result of advertisement and
sale price for notebook computer comparable to the study. Our results show that individuals
make their overestimations based on concrete, calculable information and little else seems to
come into play in the assessment. With regard to our failure to reject the null for our hypotheses
investigating interactions, the variability of overestimation across various levels of one
independent variable within the same level of another independent variable was the primary
reason for null findings.
Nonsignificant Findings
A statistical power analysis was performed for sample sizes in order to explore issues behind
the non-significant results (Figure 17). Analysis of the mean of each coded category used to
test H1, H2 indicates that existence of the predicted relationships cannot be ascertained.
However, this is not due to low statistical power as the effect sizes in this study was considered
to be large using Cohen's (1988) criteria with alpha = .05 and power = 0.7 – 0.93. On the other
hand, effect size for coded categories used to test H3 and H4 indicates low to medium, which
suggests that statistical power was enough to detect the predicted relationships if it exists.
Figure 37
Effect Sizes
Variable Effect Size Description
Donation Quantifier 0.782 Large
Portfolio Size 0.665 Large
Positive affect level 0.699 Large
Negative affect level 0.609 Large
Aggregate/Segregate evaluation frames 0.454 Medium

CONSUMER OVERESTIMATION OF DONATION AMOUNT
92
Figure 38
Correlation Matrix that Shows Degree of Association between Variables
Overestimation
of Donation
Amount
Portfolio
Size
Donation
Quantifier
Negative
Affect
Positive
Affect
Donation
Frame
Overestimation
of Donation
Amount
1 0.065 0.177**
(p=.001)
-0.113*
(p=0.040)
0.058 -0.020
Portfolio Size 0.065 1 -0.018 -0.054 0.177**
(p=0.001)
0.045
Donation
Quantifier
0.177**
(p=.001)
-0.018 1 -0.682**
(p=0.000)
0.102 -0.187**
(p=0.000)
Negative Affect -0.113*
(p=.040)
-0.054 -0.682**
(p=.000)
1 -0.179**
(p=0.001)
0.142**
(p=0.008)
Positive
Affect
0.058 0.177**
(p=0.001)
0.102 -0.179**
(p=0.001)
1 0.088
Donation Frame -0.020 0.045 -0.187**
(p=0.000)
0.142**
(p=0.008)
0.088 1.000
**Correlation is significant at the 0.01 level (2-tailed)
*Correlation is significant at the 0.05 level (2-tailed)
Further, a correlation matrix was developed to evaluate the degree of association between
the variables (Figure 38). Results further validated findings from the study indicating
significant correlation between negative affect and overestimation of donation amount. In fact,
it could perhaps be argued that someone with a negative affect would be more likely to
overestimate a donation in a way of seeking hope. On the other hand, an interesting observation
is that negative affect level has some degree of correlation with all variables except portfolio
size which speaks to strength of impact of negative affect priming to reinforces a greater degree

CONSUMER OVERESTIMATION OF DONATION AMOUNT
93
of pessimism and avoidance behavior in everyday life of individuals, (Robinson & Kirkeby,
2005; Robinson & Von Hippel, 2006).
The correlation matrix also demonstrates resiliency of overestimation that is not
moderated by nuanced factors such as charity size, framing effects or positive mood.
Limitations of Study
The present study provides a framework for studying the concepts of interest in a
nuanced and novel way. The methodology, however, does have limitations, and all results
should be viewed in the context of these limitations. A list of 2, 5 and 8 charities were provided
in each advertisement depending on the test conditions. However, it has been observed that
confining the list of charities to those specified could influence responses depending on how
they align with respondents' personal charity preferences. The actual list of charities chosen
could influence responses. It is also possible that results may have been more statistically
significant had only single charity versus a large portfolio been compared, rather than trying to
compare small, medium, and large portfolios.
Another potential limitation of the study is our use of a 6-point scale to approximate
the continuous variable of donation estimate. This use of categories was intended to make it
easier for respondents to estimate the donation size without having to resort to using a
calculator. Previous research has proven that ordinal variables with 5 or more categories can
be used as continuous without any significant harm to the analysis (Arieli-Attali, Ou &
Simmering, 2019; Sullivan & Artino, 2013; Norman, 2010; Zumbo & Zimmerman, 1993). The
premise is that although the donation estimate is an ordinal variable in our study, we treated it
as continuous because we assumed the 6 donation estimate levels as a continuum representing
respondents’ preferences for donation estimate and also assumed that intervals between any
two point are essentially equal. However, by constraining the continuous variable into

CONSUMER OVERESTIMATION OF DONATION AMOUNT
94
categories, the variability of the actual values is lost. Furthermore, this can be viewed as one
step removed from indicating actual donation values, as the values themselves are not shown.
This has the potential to be confusing to some readers. However, the benefit of using the 6-
point scale is in the simplicity for respondents. Respondents did not need to make a difficult
calculation but could instead simply choose one of the 6 categories that best matched their
quick estimation of the donation amount.
Gender imbalance could also be a limitation of this study given the fact that 67% of the
350 respondents were female versus 33% male. Research suggests women are more likely to
respond more positively to CRM campaigns than men (Anuar & Mohamad, 2011; Chéron,
Kohlbacher & Tan Shen Hui, 2018; Witeck, 2016) due to stronger predisposition to empathic
feelings among women, which drives prosocial behaviors (Moosmayer & Fuljahn, 2010).
Further, Moosmayer and Fuljahn, (2010) elaborated that this predisposition to empathy drives
higher sensitivity towards benefit of CRM campaigns to the charity and ensures that impact of
donation size on consumer goodwill towards a CRM campaign is particularly relevant for
women than for men. Therefore, men are more likely to provide lower estimate of donation
amount than women, resulting in larger variance from the mean estimate than women. It could
be argued that a sample gender imbalance could further exacerbate this variance. Future
research will have to measure empathy as a variable such that it could be used to normalize
estimate for donation amount provided by men versus women.
We also observed a vastly uneven distribution in aggregated vs. segregated groups, with
a much higher self-selection into the segregated group. The reasoning for this is like due to a
perception of equity in a 50:50 split, without much other information being known. This is a
limitation in two ways. First, it limits the interpretations we can make about main effects and
interactions of the framing variable. Second, it potentially conflates equity with equality
regarding the splitting of donations. Without knowing the financial needs/size of the individual

CONSUMER OVERESTIMATION OF DONATION AMOUNT
95
charities, assuming a 50:50 split, while equal, may not be an equitable choice. This also created
substantial difficulty for carrying out the ANOVA, since it resulted in numerous cells which
did not meet the required minimum of 30 participants within the cell. The issue with high self-
selection into the aggregate group could have been fixed by partitioned presentation of the
conditions in the portfolio frame variable in the experimental design which allows random
assignment only one condition to one questionnaire at any time.
Future Directions
The variation we saw across our sample on the factors of interest indicates a broad
snapshot of the issue at hand. Future studies would benefit from looking at the factors addressed
in this study within certain charity types or specific donor types. For example, unlike the current
study that focused on CRM campaigns related to children’s health, recreation and social
service, perhaps future studies should focus on the impact of donation framing (segregate
versus aggregate) on consumer overestimation in CRM campaigns related to a single issue only
(e.g., children’s health issues).
Some of these scales that could be considered are:
• Big-Five Inventory - BFI (John & Srivastava, 1999). It uses a 44-item measure
to examine extent to which the 5 broad traits generally found in many prominent
personality models applies to the participant. The traits include neuroticism-N
(high scorers on this trait are prone to feeling sad, worried, anxious, and
dissatisfied with themselves), extraversion-E (high scores denotes friendly,
assertive, outgoing, cheerful, and energetic traits), openness to experience -O
(high scores denotes tolerant, intellectually curious, imaginative, and artistic
traits), agreeableness-A (high scores denotes polite, considerate, cooperative,
honest, and trusting traits), and conscientiousness-C (high scores denote

CONSUMER OVERESTIMATION OF DONATION AMOUNT
96
responsible, cautious, organized, disciplined, and achievement-oriented traits).
Responses use 5-point Likert scale to determine where the five dimensions of
personality lies along a continuum of opposing poles.
• Neo Five-Factor Inventory - Neo FFI (Costa & McCrae, 1992). It uses a 60-
item measure to examine extent to which the 5 broad personality traits
mentioned above are applicable to the participant. Responses also use 5-point
Likert scale ranging from strongly agree to strongly disagree.
• Rosenberg Self-Esteem Scale – RSES (Rosenberg, 1979). It uses a 10-item
unidimensional scale to measure participants’ global self-esteem. measure of
global self-esteem using statements related to overall feelings of self-worth or
self-acceptance. A 4-point scale, ranging from strongly agree to strongly
disagree, is used to examine the extent to which the statements apply to the
participant.
Future studies would also do well to constrain the framing effects grouping in such a
way that ensures a balance between framing types. Because individuals are susceptible to
framing effects, it is likely not sufficient to leave this up to self-selection in order to achieve a
balance between framing groups. Such a balance is ultimately necessary to be able to determine
the main and interaction effects of framing. For example, our study observed a vastly uneven
distribution in aggregated vs. segregated groups, with a much higher self-selection into the
segregated group. The reasoning for this is likely due to a perception of equity in a 50:50 split,
given a situation where there was only limited information provided to respondents. This
limited the interpretations we can make about main effects and interactions of the framing
variable and potentially conflated equity with equality regarding the splitting of donations, thus
creating substantial difficulty for carrying out the ANOVA, since it resulted in numerous cells
which did not meet the required minimum of 30 participants within the cell.

CONSUMER OVERESTIMATION OF DONATION AMOUNT
97
Further, future studies would do well to expand upon the potential demographic effects
related to charitable donation activity/consumer overestimation. While the present study
considered age and sex, other factors have potential impact. For example, it may be important
to include socioeconomic status or geographic location.
Research on consumer attitude towards Cause Related Marketing (CRM) campaigns
suggests that demographic characteristics (age, gender, education, geographical location and
socioeconomic status) are key drivers of consumer attitudes towards Cause Related Marketing
(CRM) campaigns. Witek (2016) even suggested that young, educated women who live in large
cities have the most favorable attitudes toward CRM campaigns and the higher the level of
education and socioeconomic status, the more favorable the attitude. Therefore, demographic
characteristics are critical considerations in shaping the form of message, as well as the type,
specific character and content of CRM campaigns (Witek, 2016). Campaigns may need to be
tailored to each particular demographic group of customers (Hall & Witek, 2016). Moosmayer
and Fuljahn, (2010) further elaborated on the impact of donation amount in differentiating the
CRM message to particular demographic groups, pointing out that due to the fact women are
more sensitive to CRM than men, programs targeting women will be more effective if the
messaging promises substantially higher donation levels to causes. However, Olsen, Pracejus
& Brown (2003), while supporting the consensus that perceived level of donations tends to
drive higher consumer attitude towards co-participation in CRM campaigns, also raises a
caution on the possibility of deception related to near universal consumer confusion with the
donation messaging leading to overestimation of donation amount and impact on consumer
behavior. Exploring impact of demographic characteristics socioeconomic status or geographic
location on consumer reaction to the ambiguous donation messaging may be beneficial from a
public policy perspective.

CONSUMER OVERESTIMATION OF DONATION AMOUNT
98
Lastly, much of CRM research has been motivated by a desire to frame the elements of
a message to consumers to maximize the positive effects for the firm. An examination of more
ethical ways to effectively manipulate the CRM donation amount message for greater audience
effect is worth considering may be beneficial from a public policy perspective. More
specifically, the effective use of clear communication to mitigate the potential for consumer
confusion that leads to overestimation of donation amount. Olsen, Pracejus and Brown (2003)
explored with a single cause scenario, several potential affirmative disclosures around the term
“profit” used in CRM donation amount messaging: (1) a statement defining profit as the sales
price minus the cost of each sold product; (2) a percentage statement about the amount of profit;
(3) a concrete statement about the amount of profit, and demonstrated that these have been
reasonably effective in mitigating the problem of overestimation. Future studies will do well
to investigate the extent to which these finding will hold if we compare different single cause
CRM campaigns involving products with different price levels (e.g., printers versus automobile
vehicles). It will also be good to explore the same for multiple cause CRM campaigns.
Furthermore, Tsiros and Irmak (2020) demonstrated that the use of maximum or
minimum donation limits (e.g., “at least $100,000 will be donated” or “maximum of $10
million will be donated”) minimizes consumers concerns that the CRM campaign is a thinly
veiled marketing scheme. Future studies could explore the degree to which this finding will
hold if different wording were used to describe the maximum or minimum limits (e.g., “up to
$10 million will be donated” instead of “maximum of $10 million will be donated”).

CONSUMER OVERESTIMATION OF DONATION AMOUNT
99
Literature References
Adkins, S. (1999a). Cause Related Marketing: Who Cares Wins. Butterworth-Heinemann.
Adkins, S. (1999b). The Wider Benefits of Backing A Good Cause, Marketing, September.
Agrawal, U., Mangla, A., & Sagar, M. (2016). Company-Cause-Customer: Interaction
Architecture. Global Journal Of Flexible Systems Management, 17(3), 307-319.
https://doi.org/10.1007/s40171-016-0128-2
Anand, P., & Sternthal, B. (1989). Strategies for Designing Persuasive Messages: Deductions
from the Resource Matching Hypothesis, in Cognitive and Affective Responses to
Advertising, ed. Patricia Cafferata and Alice M. Tybout, Lexington, MA: Heath, 135–
159.
Anderson, N. H. (1959). Test of a model for opinion change. Journal of Abnormal and Social
Psychology, 59, 371–381.
Anderson, N. H. (1967). Averaging model analysis of set-size effects in impression formation.
Journal of Experimental Psychology, 75, 158–165.
Andreasen, A. R. (1996). Profits for nonprofits: find a corporate partner. Harvard Business
Review, 74(6), 47-59.
Andreasen, A. R. & Drumwright, M. E. (2000). Alliances and ethics in social marketing. In
Andreasen, A. R. (Ed.) Ethical issues in social marketing. Washington D.C.:
Georgetown University Press, 95 – 124.

CONSUMER OVERESTIMATION OF DONATION AMOUNT
100
Andrews, M., Luo, X., Fang, Z., & Aspara, J. (2014). Cause Marketing Effectiveness and the
Moderating Role of Price Discounts. Journal of Marketing, 78 (November), 120-142.
Anghel, L.D., Grigore, G.F., & Roşca, M. (2011). Cause-Related Marketing, Part of Corporate
Social Responsibility and its Influence upon Consumers’ Attitude. Amfiteatru
Economic, 29, 72-85.
Arieli-Attali, M., Ou, L. & Simmering, V.R. (2019). Understanding Test Takers' Choices in a
Self-Adapted Test: A Hidden Markov Modeling of Process Data. Front. Psychol.
10:83. https://doi.org/10.3389/fpsyg.2019.00083
Arkes, H. R. (1991). Costs and benefits of judgment errors: implications for debiasing.
Psychological Bulletin, v10(n3).
Arkes, H. R., Christensen, C., Lai, C., & Blumer, C. (1987). Two Methods of Reducing
Overconfidence. Organizational Behavior & Human Decision Processes, 39(1), 133.
https://doi.org/10.1016/0749-5978(87)90049-5
Arrow, K. J. (1986). Rationality of self and others in an economic system. Journal of Business,
59 (4), 385-399.
Ashton, R. H. & Kennedy, J. (2002). Eliminating recency with self-review: the case of auditors’
‘going concern’ judgments. Journal of Behavioral Decision Making. 15(3), 221-231.
Athabasca University, AU at a Glance. https://www.athabascau.ca/aboutau/#au-at-a-glance

CONSUMER OVERESTIMATION OF DONATION AMOUNT
101
Bandura, A., & Schunk, D. H. (1981). Cultivating competence, self-efficacy, and intrinsic
interest through proximal self-motivation. Journal of Personality and Social
Psychology, 41, 586-598.
Bar-Hillel, M. (1979). The role of sample size in sample evaluation. Organizational Behavior
and Human Performance, 24, 245-257.
Baron, J. (2002). Value trade-offs and the nature of utility: Bias, inconsistency, protected
values, and other problems. Paper for conference on behavioral economics. American
Institute for Economic Research, Great Barrington, MA, July.
Baylin, G., Cunningham, P., & Cushing, P. (1988). Cause-Related Marketing: Ethical Practice
or Exploitive Procedure? Proceedings of the Conference of the Association of
Consumer Psychology.
Beach, L. R., & Connolly, T. (2005). The Psychology of Decision Making: People in
Organizations, Sage, Thousand Oaks, CA.
Begling, M., & Nakata, C. (2005). Cause-related marketing: More buck than bang? Business
Horizons, 48, 443-453.
Blair, E., & Burton, S. (1987). Cognitive Processes Used by Survey Respondents to Answer
Behavioral Frequency Questions. Journal of Consumer Research, 14 (September),
280–288.
Bolton, L. E., Warlop, L., & Alba, J. W. (2003). Consumer Perceptions of Price (Un)Fairness.
Journal of Consumer Research, 29 (March), 474–491.

CONSUMER OVERESTIMATION OF DONATION AMOUNT
102
Borque, L. B., & Fielder, E. P., (2003). How to Conduct Self-administered and Mail Surveys,
2nd Edition, Sage Publications, Thousand Oaks.
Boven, L. V., & Epley, N. (2003). The unpacking effect in evaluative judgments: When the
whole is less than the sum of its parts. Journal of Experimental Social Psychology, 39,
263–269.
Brahma, S. (2009). Assessment of Construct Validity in Management Research: A Structured
Guideline. Journal of Management Research, 9(2), 59-71.
Brannigan, A. (2004). The Rise and Fall of Social Psychology: The Use and Misuse of
Experimental Method (Hawthorne, NY:Aldine de Gruyter).
Braun, K. A., Gaeth, G. J., & Levin, I. P. (1997). Framing Effects With Differential Impact:
the Role of Attribute Salience. Brucks, M., & MacInnis, D.J. (Eds), Advances in
Consumer Research, 24, Association for Consumer Research, 405-411.
Brewer, N. T., Chapman, G. B., Schwartz, J. A., & Bergus, G. R. (2007). The influence of
irrelevant anchors on the judgments and choices of doctors and patients. Medical
Decision Making, 27(2), 203-211.
Brown, N. R. (1995). Estimation strategies and the judgment of event frequency. Journal of
Experimental Psychology: Learning, Memory, and Cognition, 21, 1539-1553.
Brown, N. R. (2002a). Encoding, Representing, and Estimating Event Frequencies: A
Multiple Strategy Perspective. in Frequency Processing and Cognition, Sedlmeier, P.,
& Betsch, T. eds. Oxford, UK: Oxford University Press, 37–53.

CONSUMER OVERESTIMATION OF DONATION AMOUNT
103
Brown, N. R. (2002b). Real-World Estimation: Estimation Modes and Seeding Effects. In
Psychology of Learning and Motivation, Vol. 41, Brian H. Ross, ed. New York:
Academic Press, 321–360.
Brown, N. R., & Siegler, R. S. (1993). Metrics and Mappings: A Framework for Understanding
Real-World Quantitative Estimation. Psychological Review, 100 (3), 511–534.
Budescu, D. V., & Wallsten, T. S. (1985). Consistency in Interpretation of Probabilistic
Phrases. Organizational Behavior and Human Decision Processes, 36, 391-405.
Burns, K. E., Duffett, M., Kho, M. E., Meade, M. O., Adhikari, N. K., Sinuff, T., Cook, D. J.,
ACCADEMY Group (2008). A guide for the design and conduct of self-administered
surveys of clinicians. CMAJ : Canadian Medical Association journal = journal de
l'Association medicale canadienne, 179(3), 245–252.
https://doi.org/10.1503/cmaj.080372
Bravo, R., Matute, J., & Pina, J. M. (2012). Corporate social responsibility as a vehicle to reveal
the corporate identity: A study focused on the websites of Spanish financial entities.
Journal of Business Ethics, 107(2), 129–146.
Bryman, A., Teevan, J., & Bell, A. (2009). Social Research Methods (Second ed.). Oxford
University Press, Canada.
Calgary Herald (2014). RE/MAX, Business October 27, 2014 [online] Available at:
https://calgaryherald.com/business/remax

CONSUMER OVERESTIMATION OF DONATION AMOUNT
104
Camerer, C. F. (1987). Do Biases in Probability Judgment Matter in Markets? Experimental
Evidence. American Economic Review, 77(5), 981-997.
Camerer, C. F. (1992). The Rationality of Prices and Volume in Experimental Markets.
Organizational Behavior and Human Decision Processes, 51, 237-272.
Carringer, P. T. (1994). Not just a worthy cause: Cause-related marketing delivers the goods
and the good. American Advertising, 10(1), 16-19.
Carroll, A. B. (1979). A three-dimensional conceptual model of corporate performance.
Academy of Management Review, 4(4), 497-505.
Carroll, A. B. (1991). The pyramid of corporate social responsibility: Toward the moral
management of organizational stakeholders. Business horizons, 34(4), 39-48.
Carter, C., R., Kaufmann, L., & Michel, A. (2007). Behavioral supply management: A
taxonomy of judgment and decision-making biases. International Journal of Physical
Distribution & Logistics Management, 37(8), 631-669.
Carver, C. S., & Scheier, M. F. (1998). On the self-regulation of behavior. New York:
Cambridge University Press.
Chakravarti, D., Krish, R., Paul, P., & Srivastava, J. (2002). Partitioned Presentation of Multi-
Component Bundle Prices: Evaluation, Choice and Underlying Processing Effects.
Journal of Consumer Psychology, 12(3), 215-229.
CONSUMER OVERESTIMATION OF DONATION AMOUNT
105
Chang, H. J., Wu, C. H., Ho, J. F., & Chen, P. Y. (2008). On sample size in using central limit
theorem for gamma distribution. Information and Management Sciences, 19(1), 153-
174.
Chun-Tuan Chang, & Yu-Kang Lee. (2008). All Charity Advertisements Are Not Created
Equal: Influences of Message Framing, Vividness Valence, and Number Size Framing.
Advances in Consumer Research, 35, 652–653.
Cohen, L. J. (1981). Can human irrationality be experimentally demonstrated? Behavioral and
Brain Sciences, 4, 317–370.
Cone, (2010). 2010 Cause Evolution Study [online] Available at:
https://www.conecomm.com/2010-cone-communications-cause-evolution-study-pdf
Cone, (2015). 2015 Cone Communications/Ebiquity Global CSR Study [online] Available at:
http://www.conecomm.com/research-blog/2015-cone-communications-ebiquity-
global-csr-study
Connie, R. B., John, P. F., & Iyer, R. (2002). Framing effects within the ethical decision making
process of consumers. Journal of Business Ethics, 36(1), 119-140.
Conrad, F. G., & Brown, N. R. (1994). Strategies for estimating category frequency: Effects
of abstractness and distinctiveness. In American Statistical Association, Proceedings
of the section on survey methods research (pp. 1345-1350). Alexandria, VA:
American Statistical Association.
Conrad, F. G., Brown, N. R., Cashman, E. R. (1993). How the Memorability of Events
Affects Frequency Judgments. American Statistical Association, Proceedings of the

CONSUMER OVERESTIMATION OF DONATION AMOUNT
106
Section on Survey Methods Research. Cook, T., & Campbell, D. 1979. Quasi-
Experimentation: Design and Analysis for Field Settings. Boston, MA: Houghton
Mifflin.
Costa, P. T. Jr., & McCrae, R. R. (1992). Revised NEO Personality Inventory (NEO-PI-R)
and NEO Five-Factor Inventory (NEO- FFI) Professional Manual. Odessa, FL:
Psychological Assessment Resources.
Crawford, J. R., & Henry, J. D. (2004). The Positive and Negative Affect Schedule
(PANAS): Construct validity, measurement properties and normative data in a large
non‐clinical sample. British journal of clinical psychology, 43(3), 245-265
Dadush, S. (2010). Profiting in (Red): The Need for Enhanced Transparency in Cause-
Related Marketing. New York University Journal of International Law & Politics,
42(4), 1269.
Dahl, W. D., & Lavack, A. M. (1995). Cause-related marketing: Impact of size of corporate
donation and size of cause-related promotion on consumer perceptions and
participation. In Stewart, D.W. and Vilcassim, N.J. (Eds), 1995 AMA Winter
Educators’ Conference, American Marketing Association, Chicago, IL, 477-481.
Darley, W. K., & Smith, R. E. (1993). Advertising claim objectivity: Antecedents and effects.
Journal of Marketing, 57(4), 100–113.
Das, N. & Kerr, A. H. (2009). Improving the Impact of Cause-Related Donation Exchanges
Through Message Framing: A Conceptual Perspective. Journal of Applied Business
Research, 25(2), 69-78.

CONSUMER OVERESTIMATION OF DONATION AMOUNT
107
DeLong, J. B., Shleifer, A., Summers, L. H., & Waldman, R. J. (1991). The Survival of Noise
Traders in Financial Markets. Journal of Business, 64, 1-19.
Deshpande, R., & Webster, Jr., F. E. (1989). Organizational Culture and Marketing: Defining
the Research Agenda. Journal of Marketing, 53 (January): 3-15.
De Visscher, A., Vogel, S. E., Reishofer, G., Hassler, E., Koschutnig, K., De Smedt, B., &
Grabner, R. H. (2018). Interference and problem size effect in multiplication fact
solving: Individual differences in brain activations and arithmetic performance.
NeuroImage, 172, 718–727. https://doi.org/10.1016/j.neuroimage.2018.01.060
De Winter, J. C. (2013). Using the Student's t-test with extremely small sample sizes. Practical
Assessment, Research, and Evaluation, 18(1), 10.
Díaz-García, A., González-Robles, A., Mor, S., Mira, A., Quero, S., García-Palacios, A.,
Banos, R. & Botella, C. (2020). Positive and Negative Affect Schedule (PANAS):
psychometric properties of the online Spanish version in a clinical sample with
emotional disorders. BMC psychiatry, 20(1), 56.
Dillman, A. D., Smyth, J. D., & Christian, L. M. (2008). Internet, Mail, and Mixed-Mode
Surveys: The Tailored Design Method (Third ed.). John Wiley & Sons.
Dotson, M., Clark, J. D. Davé, D. S., & Morris, K. J. (2012). Effects of the framing of product
information on consumer preferences: An experimental comparison of wines from
different regions in the united states. International Journal of Management, 29(3), 64-
74.

CONSUMER OVERESTIMATION OF DONATION AMOUNT
108
Drumwright, M. (1996). Company advertising with a social dimension: The role of
noneconomic criteria. Journal of Marketing, 60 (October), 71-87.
Easterby-Smith, M., Thorpe, R., & Jackson, P. (2008). Management Research: Theory and
Research, Sage, London.
Easwaramoorthy, M., Barr, C., Gumulka, G., & Hartford, L. (2006). Business Support for
Charities and Nonprofits, Research Bulletin, 13(2). Toronto: Imagine Canada.
Eddy, D. M. (1982). Probabilistic Reasoning in Clinical Medicine: Problems and Opportunities
in Judgment and Decision Making, Kahneman, D., Slovic, P. & Tversky, A. eds.
Cambridge, UK: Cambridge University Press.
Edell, J. A., & Staelin, R. (1983). The information processing of pictures in print
advertisements. Journal of Consumer Research, 10(1), 45–60.
Eilert, M., & Robinson, S. (2020). The Impact of Cause Portfolio Focus and Contribution
Amount on Stakeholder Evaluations. Business & Society, 59(7), 1483–1514.
https://doi.org/10.1177/0007650318761858
Einhorn, H. J., & Hogarth, R. M. (1981). Behavioural decision theory: processes of judgment
and choice. Annual Review of Psychology, 32, 53-88.
Epley, N. & Gilovich, T. (2005). When effortful thinking influences judgmental anchoring:
differential effects of forewarning and incentives on self-generated and externally
provided anchors. Journal of Behavioral Decision Making, 18(3), 199-212.

CONSUMER OVERESTIMATION OF DONATION AMOUNT
109
Evans, J. St. B. T., & Bradshaw, H. (1986). Estimating Sample-Size Requirements in Research
Design: A Study of Intuitive Statistical Judgment. Current Psychological Research &
Reviews, Spring, 5(1), 10–19.
Evans, J. St. B. T., & Pollard, P. (1985). Intuitive statistical inferences about normally
distributed data. Acta Psychologica, 60, 57–71.
Fama, E. F. (1970). Efficient capital markets: a review of theory and empirical work. Journal
of Finance, 25(2), 383-417.
Farache, F., et al. (2007). Ethics and cause related marketing: five major ethical conflicts. In X
SEMEAD.
Faro, D. & Rottenstreich, Y. (2006). Affect, empathy, and regressive mispredictions of others’
preferences under risk. Management Science, 52(4), 529-541.
Federal Trade Commission (1983), “FTC Deception Policy Statement,” Letter from James C.
Miller III (Former) FTC Chairman to the Honorable John D. Dingell, Chairman,
Committee on Energy and Commerce, U.S. House of Representatives, (October 14),
1–15.
https://www.ftc.gov/system/files/documents/public_statements/410531/831014decept
ionstmt.pdf
Fehr, E., & Tyran, J-R. (2005). Individual Irrationality and Aggregate Outcomes. Journal of
Economic Perspectives, 19(4), 43-66.
Fiedler, K., & Juslin, P. (2006). Information sampling and adaptive cognition. Cambridge
University Press.

CONSUMER OVERESTIMATION OF DONATION AMOUNT
110
File, K. M., & Prince, R. A. (1998). Cause related marketing and corporate philanthropy in the
privately held enterprise. Journal of Business Ethics, 17, 1529–1539.
Fischhoff, B. (1982). Debiasing, in Kahneman, D., Slovic, P. and Tversky, A. (Eds), Judgment
Under Uncertainty: Heuristics and Biases, Kahneman, Cambridge University Press,
New York, NY, 422-444.
Fischhoff, B., Slovic, P., & Lichtenstein, S. (1978). Fault trees: Sensitivity of estimated
failure probabilities to problem representation. Journal of Experimental Psychology:
Human Perception and Performance, 4(2), 330-334.
Frisch, D. (1993). Reasons for framing effects. Organizational Behavior and Human Decision
Processes, 54, 399-429.
Ganguly, A., Kagel, J. H., & Moser, D. (2000). Do asset market prices reflect traders' judgment
biases? Journal of Risk and Uncertainty 20(3), 219-245.
Gamliel, E., & Herstein, R. (2007). The effect of framing on willingness to buy private brands.
The Journal of Consumer Marketing, 24(6), 334-334.
Gamliel, E., & Herstein, R. (2012). Effects of message framing and involvement on price deal
effectiveness. European Journal of Marketing, 46(9), 1215-1232.
Garthoff, R. L. (1990). Estimating Soviet military force levels: Some light from the past.
International Security 14(4), 93–116.
Gigerenzer, G. (1991). How to make cognitive illusions disappear: Beyond “heuristics and
biases,” European Review of Social Psychology, 2, 83–115.

CONSUMER OVERESTIMATION OF DONATION AMOUNT
111
Gigerenzer, G. (1996). On narrow norms and vague heuristics: A reply to Kahneman and
Tversky, Psychological Review, 103, 592–596.
Gigerenzer, G. (2004). Fast and frugal heuristics: The tools of bounded rationality in Blackwell
Handbook of Judgment and Decision Making, Koehler & Harvey, Blackwell
Publishing, UK.
Gilbride, T. J., Guiltinan, J. P., & Urbany, J. E. (2008). Framing effects in mixed price
bundling. Marketing Letters, 19(2), 125-139.
Grau, S. L., Garretson, J.A., & Folse, J. A. (2007). Cause-related marketing (CRM): The
influence of donation proximity and message-framing cues on the less-involved
consumer,” Journal of Advertising, 36(4), 19-33.
Grau, S. L., Garretson, J. A., & Pirsch, J. (2007). Cause-related marketing: An exploratory
study of campaign donation structures issues. Journal of Nonprofit & Public Sector
Marketing, 18(2), 69-91.
Griffin, D., & Varey, C. (1996). Towards a consensus on overconfidence. Organizational
Behavior and Human Decision Processes, 65(3), 227-31.
Groebner, D.F., et al. (2005). Business Statistics. A Decision-making Approach. Pearson
Education, Inc., Upper Saddle River, New Jersey, 07458.
Groen, G. J., & Parkman, J. M. (1972). A chronometric analysis of simple addition.
Psychological Review, 79, 329–343.

CONSUMER OVERESTIMATION OF DONATION AMOUNT
112
Guerreiro, J., Rita, P., & Trigueiros, D. (2016). A text mining-based review of cause-related
marketing literature. Journal of Business Ethics, 139(1), 111-128.
Gurin, M. G. (1987). Cause-related marketing in question. Advertising Age, Special Report,
(July 27), S-16.
Haigh, M. S., & List, J. (2005). Do professional traders exhibit myopic loss aversion? An
experimental analysis. Journal of Finance, 90, 523-34.
Hajjat, M. M. (2003). Effects of cause-related marketing on attitudes and purchase intentions:
The moderating role of cause involvement and donation size. Journal of Nonprofit &
Public Sector Marketing, 11(1), 93.
Hamby, A., & Brinberg, D. (2018). Cause-Related Marketing Persuasion Knowledge:
Measuring Consumers’ Knowledge and Ability to Interpret CrM Promotions. Journal
of Consumer Affairs, 52(2). https://doi.org/10.1111/joca.12167
Hartmann, M., Klink, J., & Simons, J. (2015). Cause related marketing in the German retail
sector: Exploring the role of consumers’ trust. Food Policy, 52, 108–114.
https://doi.org/10.1016/j.foodpol.2014.06.012
Harvey, N. & Bolger, F. (1996). Graphs versus tables: Effects of data presentation format on
judgmental forecasting. International Journal of Forecasting, 12 (March), 119–137.
Hays, W. L. (1981). Statistics (3rd ed.). Holt, Rinehart and Winston: New York.

CONSUMER OVERESTIMATION OF DONATION AMOUNT
113
Hodgkinson, G. P., Maule, A. J., Brown, N. J., Pearman, A. D. & Glaister, K. W. (2002).
Further reflections on the elimination of framing bias in strategic decision making.
Strategic Management Journal, 23(11), 1069-1076.
Hogarth, R. M. (1987). Judgment and Choice: The Psychology of Decision, 2nd ed., Wiley,
Chichester.
Holbrook, M. B. (1978). Beyond attitude structure. Journal of Marketing Research, 15(4),
546–556.
Hsee, C. K., & Leclerc, F. (1998). Will products look more attractive when presented
separately or together? Journal of Consumer Research, 25(2), 175-186.
Hsee, C. K., Loewenstein, G. F., Blount, S., & Bazerman, M. H. (1999). Preference reversals
between joint and separate evaluations of options: A review and theoretical analysis.
Psychological Bulletin, 125(5), 576.
IEG Sponsorship Reports (2013). IEG sponsorship reports 2013, [online] Available at:
https://www.sponsorship.com/iegsr/2013/01/07/2013-Sponsorship-Outlook--
Spending-Increase-Is-Dou.aspx
IEG Sponsorship Reports (2018). IEG sponsorship reports 2018, [online] Available at:
https://www.sponsorship.com/Report/2018/01/08/Signs-Point-To-Healthy-
Sponsorship-Spending-In-201.aspx
IEG Sponsorship Reports (2019). IEG sponsorship reports 2019, [online] Available at:
https://www.sponsorship.com/Latest Thinking/Sponsorship Infographics/Sponsorship
Spending of Causes to Grow 4.6% in 201.aspx

CONSUMER OVERESTIMATION OF DONATION AMOUNT
114
Janušonis, S. (2009). Comparing two small samples with an unstable, treatment-independent
baseline. Journal of Neuroscience Methods, 179, 173–178.
Jefferies, N. O. (2009). Ranking bias in association studies. Human Heredity, 67, 267–275
John, O. P., & Srivastava, S. (1999). “The Big-Five trait taxonomy: history, measurement, and
theoretical perspectives,” in Handbook of Personality: Theory and Research, 2nd Edn,
eds L. A. Pervin and O. P. John (New York, NY: Guilford Press), 102–138.
Kabongo, J. D., Chang, K., & Li, Y. (2013). The impact of operational diversity on corporate
philanthropy: An empirical study of U.S. companies. Journal of Business Ethics, 116,
49-65.
Kahneman, D. (2003). Maps of bounded rationality: Psychology for behavioral economics.
American Economic Review, 93 1449–1475.
Kahneman, D., & Fredrick, S. (2002). Representativeness revisited: Attribute substitution in
intuitive judgments. In T. Gilovich, T. D. Griffin, and D. Kahneman (eds.), Heuristics
and Biases: The Psychology of Intuitive Judgment (pp. 49–81). Cambridge: Cambridge
University Press.
Kahneman, D., & Lovallo, D. (1993). Timid choices and bold forecasts: A cognitive
perspective on risk taking. Management Science, 39(1), 17-31.
Kahneman, D., Slovic, P., & Tversky, A. (1982). Judgment under Uncertainty – Heuristics
and Biases. New York: Cambridge University Press.

CONSUMER OVERESTIMATION OF DONATION AMOUNT
115
Kahneman, D., & Tversky, A. (1972). Subjective probability: A judgment of
representativeness. Cognitive Psychology, 3, 430-454.
Kahneman, D., & Tversky, A. (1973). On the psychology of prediction. Psychological Review,
80(4), 237-251.
Kahneman, D., & Tversky, A. (1974). Judgment under uncertainty: Heuristics and biases.
Science, 185(4157), 1124-1131.
Kahneman, D., & Tversky, A. (1979). Prospect theory: an analysis of decision under risk.
Econometrica, 47(2), 263-291.
Kahneman, D., & Tversky, A. (1996). On the reality of cognitive illusions. Psychological
Review, 103(3), 582-591.
Kaplan, M. F. (1981). Amount of information and polarity of attraction. Bulletin of the
Psychonomic Society, 18, 23–26.
Kaufmann, M., & Betsch, T. (2009). Origins of the sample-size effect in explicit evaluative
judgment. Experimental Psychology, 56(5), 344-353.
Kaufmann, L., Carter, C. R., & Buhrmann, C., (2010). Debiasing the supplier selection
decision: a taxonomy and conceptualization. International Journal of Physical
Distribution & Logistics Management, 40(10), 792–821.
https://doi.org/10.1108/09600031011093214
Keren, G., & Lewis, C. (2000). Even Bernoulli might have been wrong: A comment on
intuitions about sample size', Journal of Behavioral Decision Making, 13, 125-132.

CONSUMER OVERESTIMATION OF DONATION AMOUNT
116
Kerr, N. L. (1989). Illusions of efficacy: The effect of group size on perceived efficacy in social
dilemmas. Journal of Experimental Social Psychology, 25, 287-313.
Khalili, O. (2010). Mobile giving meets mobile marketing, but are Americans ready? Cause
Capitalism (Blog), November. http://causecapitalism.com/mobile giving meets mobile
marketing but are americans-ready/
Kim, H. J., Kim, J-I., & Han, W. H. (2005). The effects of cause related marketing on company
and brand attitude. Seoul Journal of Business, 11(2), 83-117.
Kim, Y. J., & Lee, W. (2009). Overcoming consumer skepticism in cause-related marketing:
The effects of corporate social responsibility and donation size claim objectivity.
Journal of Promotion Management, 15(4), 465–483.
Klemz, B. R., & Gruca, T. S. (2003). Dueling or the battle royale? The impact of task
complexity on the evaluation of entry threat. Psychology & Marketing, 20(11), 999-
1015.
Koschate-Fischer, N., Huber, née S. I. V., & Hoyer, W. D. (2016). When will price increases
associated with company donations to charity be perceived as fair? Journal of the
Academy of Marketing Science: Official Publication of the Academy of Marketing
Science, 44(5), 608. https://doi.org/10.1007/s11747-015-0454-5
Koschate-Fischer, N., Stefan, I. V., & Hoyer, W. D. (2012). Willingness to pay for cause-
related marketing : the impact of donation amount and moderating effects. Journal Of
Marketing Research : JMR, 49(6), 910-927
CONSUMER OVERESTIMATION OF DONATION AMOUNT
117
Kotler, P., & Lee, N. (2011). Corporate Social Responsibility; doing the most good for your
company and your cause. New Jersey: John Wiley & Sons.
Koundouri, P., & Kourogenis, N. (2011). On the Distribution of Crop Yields: Does the Central
Limit Theorem Apply? American Journal of Agricultural Economics, 93(5), 1341–
1357. https://doi.org/10.1093/ajae/aar055
Krell, C., & Grant, H. (2010). Naive learning algorithms utilized for the prediction of stock
prices to compare economic models of decision making. IEEE, Proceedings of the 2010
Winter Simulation Conference B. Johansson, S. Jain, J. Montoya-Torres, J. Hugan, &
E. Yücesan, eds.
Kroll, C. (1996). Consumers note marketers' good causes: Roper? Advertising Age, November
11, p.51.
Kropp, F., Holden, S. J. S., & Lavack, A. M. (1999). Cause-related marketing and values in
Australia. International Journal of Nonprofit & Voluntary Sector Marketing, 4(1), 69.
Kruger, J. (1999). Lake Wobegon be gone! The “below-average effect” and the egocentric
nature of comparative ability judgments. Journal of Personality and Social Psychology,
77(2), 221–232.
Kruglanski, A. W., Friedland, N., & Farkash, E. (1984). Lay person’s sensitivity to statistical
information: The case of high perceived applicability. Journal of Personality and Social
Psychology, 46, 503–518.
Ku H., & Hung, Y., (2019). Framing effects of per‐person versus aggregate prices in group
meals. Journal of Consumer Behaviour, 18(1), 43–52. https://doi.org/10.1002/cb.1743
CONSUMER OVERESTIMATION OF DONATION AMOUNT
118
Kuesten, C., Chopra, P., Bi, J., & Meiselman, H. L. (2014). A global study using PANAS (PA
and NA) scales to measure consumer emotions associated with aromas of phytonutrient
supplements. Food Quality And Preference, 33, 86-97.
doi:10.1016/j.foodqual.2013.11.004
Kumar, A., & Lim, S. S. (2008). How Do Decision Frames Influence the Stock Investment
Choices of Individual Investors? Management Science, 54(6), 1052.
https://doi.org/10.1287/mnsc.1070.0845
Kuncel, N. R., Credé, M., & Thomas, L. L. (2005). The validity of self-reported grade point
averages, class ranks, and test scores: A meta-analysis and review of the literature.
Review of Educational Research, 75(1), 63–82.
Lafferty, B. A., Lueth, A. K. & McCafferty, R. (2016). An Evolutionary Process Model of
Cause-Related Marketing and Systematic Review of the Empirical Literature.
Psychology & Marketing, 33(11), 951-970.
Landreth,S., Pirsch, J., & Garretson, J. A. (2004). Cause-related marketing campaign donation
structures: Maximizing firm benefit and minimizing consumer mistrust, in Marketing
and Public Policy Proceedings, Debbie Scammons and Marlys Mason and Rob Mayer
(Eds.). Salt Lake City, Utah.
Langen, N., Grebitus, C., & Hartmann, M. (2011). Is there need for more transparency and
efficiency in cause-related marketing? International Journal on Food System
Dynamics, 1(4), 366-381.

CONSUMER OVERESTIMATION OF DONATION AMOUNT
119
Langer, T., & Weber, M. (2001). Prospect theory, mental accounting and differences in
aggregated and segregated evaluation of lottery portfolios. Management Science, 47(5),
716-733.
Larrick, R.P. (2004), “Debiasing”, in Koehler, D.J. and Harvey, N. (Eds), Blackwell
Handbooks of Experimental Psychology, Blackwell, Malden, MA, pp. 317-37.
Lavrakas, P. (2008). Favorability ratings. In P. J. Lavrakas (Ed.), Encyclopedia of survey
research methods (pp. 272-272). Thousand Oaks, CA: SAGE Publications, Inc. doi:
10.4135/9781412963947.n180
LeBoeuf, R. A., & Shafir, E. (2006). The long and short of it: Physical anchoring effects.
Journal of Behavioral Decision Making, 19(4), 393–406.
LeFevre, J., Greenham, S. L, & Waheed, N. (1993). The development of procedural and
conceptual knowledge in computational estimation. Cognition and Instruction, 11,
95-132.
LeFevre, J. A., Sadesky, G. S., & Bisanz, J. (1996). Selection of procedures in mental
addition: Reassessing the problem size effect in adults. Journal of Experimental
Psychology: Learning, Memory, and Cognition, 22(1), 216.
Lemaire, P., Lecacheur, M., & Farioli, F. (2000). Children's Strategy Use in Computational
Estimation. Canadian Journal of Experimental Psychology, 54(2), 141-148.
Levin, D. M. (1988). The opening of vision: Nihilism and the postmodern situation. London:
Routledge.

CONSUMER OVERESTIMATION OF DONATION AMOUNT
120
Levin, I. P., & Gaeth, G. J. (1988). How consumers are affected by the framing of attribute
info. Journal of Consumer Research, 15(3), 374-374.
Light, R. J., & Margolin, B. H. (1971). An Analysis of Variance for Categorical Data. Journal
of the American Statistical Association, 66(335), 534.
https://doi.org/10.1080/01621459.1971.10482297
Lim, S. S. (2006). Do investors integrate losses and segregate gains? Mental accounting and
investor trading decisions. Journal of Business. 79(5), 2539–2573.
List, J. A. (2004). Neoclassical Theory versus Prospect Theory: Evidence from the
marketplace. Econometrica, 72(2), 615-625.
Liu, H., & Chiu, Y. (2015). Sales framing, mental accounting, and discount assignments. Asia
Pacific Management Review, 20, 201-209.
https://doi.org/10.1016/j.apmrv.2015.01.002
Lucas, R., & Prescott, E. (1971). Investment under uncertainty, Econometrica, 39(5), 659-81.
Marketing News. (1987). Charge-card consumers choose charities for their
contributions. 21(21, October 9), 10.
Marshall, G. N., Wortman, C. B., Kusulas, J. W., Hervig, L. K., & Vickers Jr., R. R. (1992).
Distinguishing optimism from pessimism: Relations to fundamental dimensions of
mood and personality. Journal of Personality and Social Psychology, 62(6), 1067-
1074.

CONSUMER OVERESTIMATION OF DONATION AMOUNT
121
Mayer, E. R. Stull, A. T., Campbell, J., Almeroth, K., Bimber, B., Chun, D., & Knight, A.
(2007). Overestimation bias in self-reported SAT scores. Education Psychological
Review, 19(4), 443–454.
Meissner, P., & Wulf, T. (2017). The effect of cognitive diversity on the illusion of control bias
in strategic decisions: An experimental investigation. European Management Journal,
35(4), 430–439. https://doi.org/10.1016/j.emj.2016.12.004
Meyer, H. (1999). When the cause is just. Journal of Business Strategy, 20(6), 27-31.
Merz, E. L., Malcarne, V. L., Roesch, S. C., Ko, C. M., Emerson, M., Roma, V. G., & Sadler,
G. R. (2013). Psychometric properties of Positive and Negative Affect Schedule
(PANAS) original and short forms in an African American community sample. Journal
of affective disorders, 151(3), 942–949. https://doi.org/10.1016/j.jad.2013.08.011
Meyers-Levy, J., & Maheswaran, D. (1990). Message framing effects on product judgments.
In Goldberg, E., Gorn, G., & Pollay, R.W. (Eds), Advances in Consumer Research,
17, Association for Consumer Research, 531-534.
Miller, G. A. (1956). The magical number seven, plus or minus two: Some limits on our
capacity for processing information. Psychological Review, 63, 81-97.
Minton, E. A., & Cornwell, T. B. (2016), The Cause Cue Effect: Cause-Related Marketing and
Consumer Health Perceptions. Journal of Consumer Affairs, 50, 372–402.
https://doi.org/10.1111/joca.12091
Moen, D. H., & Powell, J. E. (2005). Illustrating the central limit theorem through Microsoft
excel simulations. College Teaching Methods & Styles Journal (CTMS), 1(2), 35-46.

CONSUMER OVERESTIMATION OF DONATION AMOUNT
122
Montibeller, G., & Winterfeldt, D. (2015). Cognitive and Motivational Biases in Decision and
Risk Analysis. Risk Analysis: An International Journal, 35(7), 1230-1251.
https://doi.org/10.1111/risa.12360
Moosmayer, D. C., & Fuljahn, A. (2010). Consumer perceptions of cause related marketing
campaigns. Journal of Consumer Marketing, 27(6), 543–549.
Müller, S. S., Fries, A. J., & Gedenk, K. (2014). Full Length Article: How much to give? —
The effect of donation size on tactical and strategic success in cause-related marketing.
International Journal of Research in Marketing, 31, 178-191.
https://doi.org/10.1016/j.ijresmar.2013.09.005
Murphy, I. P. (1997). Pillsbury Proves Charity, Marketing Begins at Home? Marketing News,
February 17, 16.
Mussweiler, T., & Englich, B. (2003). Adapting to the Euro: Evidence from bias reduction.
Journal of Economic Psychology, 24(3), 285-292.
Muth, J. (1961). Rational expectations and the theory of price movements, Econometrica, 29,
315-335.
Newell, A., & Simon, H. A. (1972). Human problem solving, 14, Englewood Cliffs, NJ:
Prentice-Hall.
Nisbett, R. E., Krantz, D. H., Jepson, C., & Kunda, Z. (1983). The use of statistical heuristics
in everyday inductive reasoning. Psychological Review, 90, 339–363.

CONSUMER OVERESTIMATION OF DONATION AMOUNT
123
Nisbett, R. E., & Ross, L. (1980). Human inference: Strategies and shortcomings of social
judgment. Englewood Cliffs, NJ: Prentice Hall.
Nordstrom, C. R., Williams, K. B., & LeBreton, J. M. (1996). The effect of cognitive load on
the processing of employment selection information. Basic and Applied Social
Psychology, 18, 305-318.
Norman, G. (2010). Likert scales, levels of measurement and the “laws” of statistics. Advances
in Health Sciences Education, 15(5), pp. 625-632. Retrieved from:
https://link.springer.com/article/10.1007%2Fs10459-010-9222-y#citeas.
Olsen, G. D., Pracejus, J. W., & Brown, N. R. (2003). When profit equals price: Consumer
confusion about donation amounts in cause related marketing. Journal of Public Policy
and Marketing, 22, 170-180.
Oppenheimer, D. M., LeBoeuf, R. A., & Brewer, N. T. (2008). Anchors aweigh: A
demonstration of cross-modality anchoring and magnitude priming. Cognition, 106,
13-26.
Pavot, W., & Diener, E. (1993). Review of the satisfaction with life scale. Psychological
assessment, 5(2), 164.
Peng, J., Li, H., Miao, D., Feng, X., & Xiao, W. (2013). Five different types of framing effects
in medical situation: a preliminary exploration. Iranian Red Crescent medical
journal, 15(2), 161–165. https://www.ncbi.nlm.nih.gov/pmc/articles/PMC3652505/

CONSUMER OVERESTIMATION OF DONATION AMOUNT
124
Peracchio, L., & Meyers-Levey, J. (1997). Evaluating Persuasion-Enhancing Techniques from
a Resource-Matching Perspective. Journal of Consumer Research, 24 (September),
178–191.
Perry, P. R. (1985). Portfolio Serial Correlation and Non-Synchronous Trading. Journal of
Financial and Quantitative Analysis, 20(4), 517.
Perry, V. G. (2008). Is Ignorance Bliss? Consumer Accuracy in Judgments about Credit
Ratings. The Journal of Consumer Affairs, 42(2), 189-205.
Piaget, J., & Inhelder, B. (1975). The origin of the idea of chance. New York: Norton. (Original
work published 1951).
Podsakoff, P. M., MacKenzie, S. B., Lee, J. Y., & Podsakoff, N. P. (2003). Common Method
Biases in Behavioral Research: A Critical Review of the Literature and Recommended
Remedies, Journal of Applied Psychology, 88: 879-903.
Polonsky, M. J., & Wood, G. (2001). Can the overcommercialization of cause-related
marketing harm society? Journal of Macromarkerting, 21(1), 8-22.
Pracejus, J. W., Deng, Q. (Claire), Olsen, G. D., & Messinger, P. R. (2020). Fit in cause-related
marketing: An integrative retrospective. Journal of Global Scholars of Marketing
Science, 30(2), 105–114. https://doi.org/10.1080/21639159.2018.1509365
Pracejus, J. W., Olsen, G. D., & Brown, N. R. (2004). On the Prevalence and Impact of Vague
Quantifiers in the Advertising of Cause Related Marketing (CRM). Journal of
Advertising, 32, 19-28.

CONSUMER OVERESTIMATION OF DONATION AMOUNT
125
Proctor, J (2015). CBC News Analysis. Starbucks 'Race Together' campaign stirs controversy
and coffee to court cash [online]. Available at : http://www.cbc.ca/news/canada/british-
columbia/starbucks-race-together-campaign-stirs-controversy-and-coffee-to-court-
cash-1.3000491
Read, D., Loewenstein, G., & Rabin, M. (1999). Choice bracketing. Journal of Risk and
Uncertainty, 19, 171–197.
Redelmeier, D. A., & Tversky, A. (1990). Occasional Notes: Discrepancy between Medical
Decisions for Individual Patients and for Groups. The New England Journal of
Medicine, 322(16), 1162-1164. Retrieved May 17, 2011, from ProQuest Nursing &
Allied Health Source. (Document ID: 2835022).
Redelmeier, D. A., & Tversky, A. (1992). On the Framing of Multiple Prospects. Psychological
Science, 3(3), 191.
Reeves, T., & Lockhart, R. S. (1993). Distributional Versus Singular Approaches to Probability
and Errors in Probabilistic Reasoning. Journal of Experimental Psychology: General
122(2), 207-226.
Renshon, J. (2009). Assessing Capabilities in International Politics: Biased Overestimation and
the Case of the Imaginary ‘Missile Gap’. The Journal of Strategic Studies, 32(1), 115-
147.
Rickard, S. (2012). Electoral Systems, Voters' Interests and Geographic Dispersion. British
Journal of Political Science, 42(4), 855-877. Retrieved September 17, 2020, from
http://www.jstor.org/stable/23274170

CONSUMER OVERESTIMATION OF DONATION AMOUNT
126
Robinson, M. D., & Kirkeby, B. S. (2005). Happiness as a belief system: Individual differences
and priming in emotion judgments. Personality and Social Psychology Bulletin, 31,
1134–1144.
Robinson, M. D., & Von Hippel, W. (2006). Rose-colored priming effects: Life satisfaction
and affective priming. The Journal of Positive Psychology, 1(4), 187-197.
Rosenberg, M. (1979). Conceiving the Self. New York, NY: Basic Books.
Ross III, J. K., Patterson, L. T., & Stutts, M. A. (1992). Consumer perceptions of organizations
that use cause-related marketing. Journal of the Academy of Marketing Science, 20(1),
93-97.
Ross, J. K., Stutts, M. A., & Patterson, L. T. (1991). Tactical considerations for the effective
use of cause-related marketing. Journal of Applied Business Research, 7(2), 58-65.
Samuelson, P. A. (1947). Foundations of Economic Analysis, Harvard University Press,
Boston, MA.
Sang Gyu Kwak, & Jong Hae Kim. (2017). Central limit theorem: the cornerstone of modern
statistics. Korean Journal of Anesthesiology, 70(2), 144–156.
https://doi.org/10.4097/kjae.2017.70.2.144
Sanna, L. J., Schwarz, N., & Stocker, S. L. (2002). When debiasing backfires: accessible
content and accessibility experiences in debiasing hindsight. Journal of Experimental
Psychology: Learning, Memory and Cognition, 3, 497.
Savage, L. J. (1954). The Foundations of Statistics, Wiley, New York, NY.
CONSUMER OVERESTIMATION OF DONATION AMOUNT
127
Schiller, Z. (1988). Doing Well by Doing Good. Business Week, 3082, 53-57.
Schulz-Hardt, S., Jochims, M. & Frey, D. (2002). Productive conflict in group decision
making: genuine and contrived dissent as strategies to counteract biased information
seeking. Organizational Behavior and Human Decision Processes, 88(2), 563-586.
Schwarz, N., & Clore, G. L. (1983). Mood, misattribution and judgments of well-being:
Informative and directive functions of affective states. Journal of Personality and
Social Psychology, 45, 513–523.
Sedlmeier, P., & Gigerenzer, G. (1997). Intuitions about sample size: The empirical law of
large numbers. Journal of Behavioral Decision Making, 10, 33–51.
Seidlitz, L., & Diener, E. (1993). Memory for positive and negative life events: Theories for
the differences between happy and unhappy persons. Journal of Personality and Social
Psychology, 64, 654–663.
Shaban, R. Z. (2005). Theories of clinical judgment and decision-making: A review of the
theoretical literature. Journal of Emergency Primary Health Care, 3(1-2).
Shavitt, S., Sanbonmatsu, D., Smittipatana, S., & Posavac, S. (1999). Broadening the
conditions for illusory correlation formation: Implications for judging of minority
groups. Basic and Applied Social Psychology, 21, 263–279.
Shirota, Y., & Suzuki, S. (2014). Visualization of the central limit theorem and 95 percent
confidence intervals. Gakushuin Economics Papers, 50(4), 125-136.

CONSUMER OVERESTIMATION OF DONATION AMOUNT
128
Siegler, R. S. (1987). The perils of averaging over strategies: An example from children's
addition. Journal of Experimental Psychology: General, 116, 250-264.
Simon, H. A. (1955). A behavioural model of rational choice. Quarterly Journal of Economics,
69(1), 99-118.
Slovic, P., & Lichtenstein, S. (1971). Comparison of Bayesian and regression approaches to
the study of information processing in judgment. Organizational Behavior and Human
Performance, 6 (6), 649-744.
Smith, S. M., & Alcorn, D. S. (1991). Cause Marketing: A New Direction in the Marketing of
Corporate Responsibility. Journal of Consumer Marketing, 8(Summer), 19-35.
Smith, A. R., & Price, C. P. (2010). Sample size bias in the estimation of means. Psychonomic
Bulletin & Review, 17 (4), 499-503.
Soman, D. (2004). Framing, loss aversion, and mental accounting. Blackwell handbook of
judgment and decision making, 379-398.
Stanforth, N., & Hauck, W. (2010). The effects of ethical framing on consumer price
perceptions. Journal of Fashion Marketing and Management, 14(4), 615-623.
Steul, M. (2006). Does the framing of investment portfolios influence risk-taking behavior?
Some experimental results. Journal of Economic Psychology. 27(4), 557-570.
Stewart, D. (2010a). DDBA-804: Research Methodologies & Techniques, Study Guide –
Experimental Design, Athabasca University, Week 5.

CONSUMER OVERESTIMATION OF DONATION AMOUNT
129
Stewart, D. (2010b). DDBA-804: Research Methodologies & Techniques Seminar Discussions
– Experimental Design, Athabasca University, Week 5.
Strahilevitz, M. (1999). The effects of product type and donation magnitude on willingness to
pay more for a charity-linked brand. Journal of Consumer Psychology, 8(3), 215-241.
Strahilevitz, M., & Myers, J. (1998). Donations to charity as purchase incentives: How well
they work may depend on what you are trying to sell. Journal of Consumer Research,
24(4), 434–446.
Suh, E., Diener, E., & Fujita, F. (1996). Events and subjective well-being: Only recent events
matter. Journal of Personality and Social Psychology, 70, 1091–1102.
Sullivan, G. & Artino Jr., A. R. (2013). Analyzing and Interpreting Data from Likert-Type
Scales. Journal of Graduate Medical Education. 5(4), pp. 541-542.
Tal, G. (2011). Overestimations in forecasting new transportation demand management
policies: Chronicle of an error foretold. Ph.D. dissertation, University of California,
Davis, United States -- California. Retrieved July 4, 2011, from Dissertations & Theses:
Full Text. (Publication No. AAT 3336345).
Tan, C., Teo, H., & Benbasat, I. (2010). Assessing Screening and Evaluation Decision Support
System: A Resource-Matching Approach. Information Systems Research, Linthicum,
21(2), 305-330.
Thaler, R. H. (1993). Advances in Behavioral Finance, Russel Sage Foundations, New York,
NY.
CONSUMER OVERESTIMATION OF DONATION AMOUNT
130
Thaler, R. H. (1999). Mental accounting matters. Journal of Behavioral Decision Making, 12,
183-206.
Thaler, R. H. (2000). From homo economicus to homo sapiens. Journal of Economic
Perspectives, 14(1), 133-41.
Thaler, R. H., & Johnson, E. J. (1990). Gambling with the house money and trying to break
even: The effects of prior outcomes on risky choice. Management Science. 36 643–660.
Tiberghien, K., De Smedt, B., Fias, W., & Lyons, I. M. (2019). Distinguishing between
cognitive explanations of the problem size effect in mental arithmetic via
representational similarity analysis of fMRI data. Neuropsychologia, 132.
https://doi.org/10.1016/j.neuropsychologia.2019.107120
Treen, E., Atanasova, C., Pitt, L., & Johnson, M. (2016). Evidence from a Large Sample on
the Effects of Group Size and Decision-Making Time on Performance in a Marketing
Simulation Game. Journal of Marketing Education, 38(2), 130-137.
Tsiros, M., & Irmak, C. (2020). Lowering the Minimum Donation Amount Increases
Consumer Purchase Likelihood of Products Associated with Cause-Related
Marketing Campaigns. Journal of Marketing Research (JMR), 57(4), 755–770.
https://doi.org/10.1177/0022243720916463
Tversky, A., & Kahneman, D. (1974). Judgment under Uncertainty: Heuristics and Biases.
Science, New Series, 185(4157), 1124-113.
CONSUMER OVERESTIMATION OF DONATION AMOUNT
131
Tversky, A., & Kahneman, D. (1980). Causal schemas in judgments under uncertainty. In
Progress in Social Psychology, ed. M. Fishbein, 1:49-72. Hillsdale, NJ: Erlbaum. 240
pp.
Tversky, A., & Kahneman, D. (1986). Rational choice and the framing of decisions. Journal
of Business, 59(4), 251-78.
Varadarajan, R. P., & Menon, A. (1988). Cause-related marketing: a coalignment of marketing
strategy and corporate philanthropy. Journal of Marketing, 52(3), 58-74.
Venkatraman, S., Aloysius, J. A., & Davis, F. D. (2006). Multiple prospect framing and
decision behavior: The mediational roles of perceived riskiness and perceived
ambiguity. Organizational Behavior and Human Decision Processes, 101(1), 59–73.
https://doi.org/10.1016/j.obhdp.2006.04.006
Vlachos, P. A., Koritos, C. D., Krepapa, A., Tasoulis, K., & Theodorakis, I. G. (2016).
Containing cause-related marketing skepticism: A comparison across donation frame
types. Corporate Reputation Review, 19(1), 4-21.
von Neumann, J., & Morgenstern, O. (1947). Theory of Games and Economic Behavior, 2nd
ed., Princeton University Press, Princeton, NJ.
Watson, D., & Clark, L. A. (1984). Negative Affectivity: The disposition to experience
aversive emotional states. Psychological Bulletin, 96, 465-490.

CONSUMER OVERESTIMATION OF DONATION AMOUNT
132
Watson, D., Clark, L. A., & Tellegen, A. (1988). Development and validation of brief measures
of positive and negative affect: The PANAS scales. Journal of Personality and Social
Psychology, 54(6), 1063-1070.
Watson, D., & Tellegen, A. (1985). Toward a consensual structure of mood. Psychological
Bulletin, 98, 219-235.
Webb, D. J., & Mohr, L. A. (1998). A Typology of Consumer Responses to Cause-Related
Marketing: From Skeptics to Socially Concerned. Journal of Public Policy &
Marketing, 17(2), 226-238.
Wei, S., Ang, T., & Liou, R.-S. (2020). Does the global vs. local scope matter? Contingencies
of cause-related marketing in a developed market. Journal of Business Research, 108,
201–212. https://doi.org/10.1016/j.jbusres.2019.11.018
Weick, K. E. (1984). Small wins: Redefining the scale of social problems. American
Psychologist, 39, 40-49.
Winterich, K. P., & Barone, M. J. (2011). Warm Glow or Cold, Hard Cash? Social Identity
Effects on Consumer Choice for Donation Versus Discount Promotions. Journal of
Marketing Research, 48 (February), 855–868.
Witek, L. (2016). Influence of Socio-Demographic Characteristics of Consumers on Attitudes
Towards Cause Related Marketing. Acta Universitatis Agriculturae et Silviculturae
Mendelianae Brunensis, 64(6), 2173–2182.
https://doi.org/10.11118/actaun201664062173

CONSUMER OVERESTIMATION OF DONATION AMOUNT
133
Witek, L. & Hall, H. (2016). Prosumption use in creation of cause related marketing programs
through crowdsourcing. Procedia Economics and Finance, 39: 212 – 218.
Wong, K. F. E., & Kwong, J. Y. Y. (2005). Comparing two tiny giants or two huge dwarfs?
Preference reversals owing to number size framing. Organizational Behavior and
Human Decision Processes, 98(1), 54–65. https://doi.org/10.1016/j.obhdp.2005.04.002
Wu, S., & Hung, J. (2008). A performance evaluation model of CRM on non-profit
organizations. Total Quality Management & Business Excellence, 19(4), 321.
Retrieved February 20, 2011, from ABI/INFORM Global. (Document
ID: 1460438051)
Yauch, C., & Steudel, H. (2003). Complementary Use of Qualitative and Quantitative Cultural
Assessment Methods. Organizational Research Methods, 6(4), 465-481.
Zheng, L., Zhu, Y., & Jiang, R. (2019). The Mediating Role of Moral Elevation in Cause-
Related Marketing: A Moral Psychological Perspective. Journal of Business Ethics,
156(2), 439–454. https://doi.org/10.1007/s10551-017-3614-3
Zolner, K., Compeau, L., Jones, J., & Munger, J. (2010). Consumers' Perceptions of Nonprofit
Solicitations: Some Preliminary Evidence on Framing and Price Effects. Journal of
Nonprofit & Public Sector Marketing, 22, 1-13
Zumbo, B. D., & Zimmerman, D. W. (1993). Is the selection of statistical methods governed
by level of measurement? Canadian Psychology, 34, 390-400.

CONSUMER OVERESTIMATION OF DONATION AMOUNT
134
Appendix 1: Pre-Test Questionnaire
Consumer Estimation of Donation Amount in Cause-Related Marketing _PRE TEST
Introduction
Thank you for agreeing to complete this survey. Your participation is appreciated and it
will help to shape the outcome of the research. The research study is titled "Consumer
Overestimation of Donation Amount in Cause-Related Marketing. The study is being
conducted by Ken Atere from Athabasca University, Alberta.
Purpose of this research study is to gauge the extent of respondents’ familiarity and
disposition towards business corporations whose charities support children’s health,
recreational and social service issues in Canada. This survey will take approximately 8
minutes to complete. Your participation in this survey is absolutely voluntary and you
can withdraw at any time. You are at liberty to omit any question. Responses will be
anonymous and will be used in confidence.
At the end of the survey, you will be entered in a draw where you can win $100. If you
have questions about the survey, please email: [email protected]

CONSUMER OVERESTIMATION OF DONATION AMOUNT
135
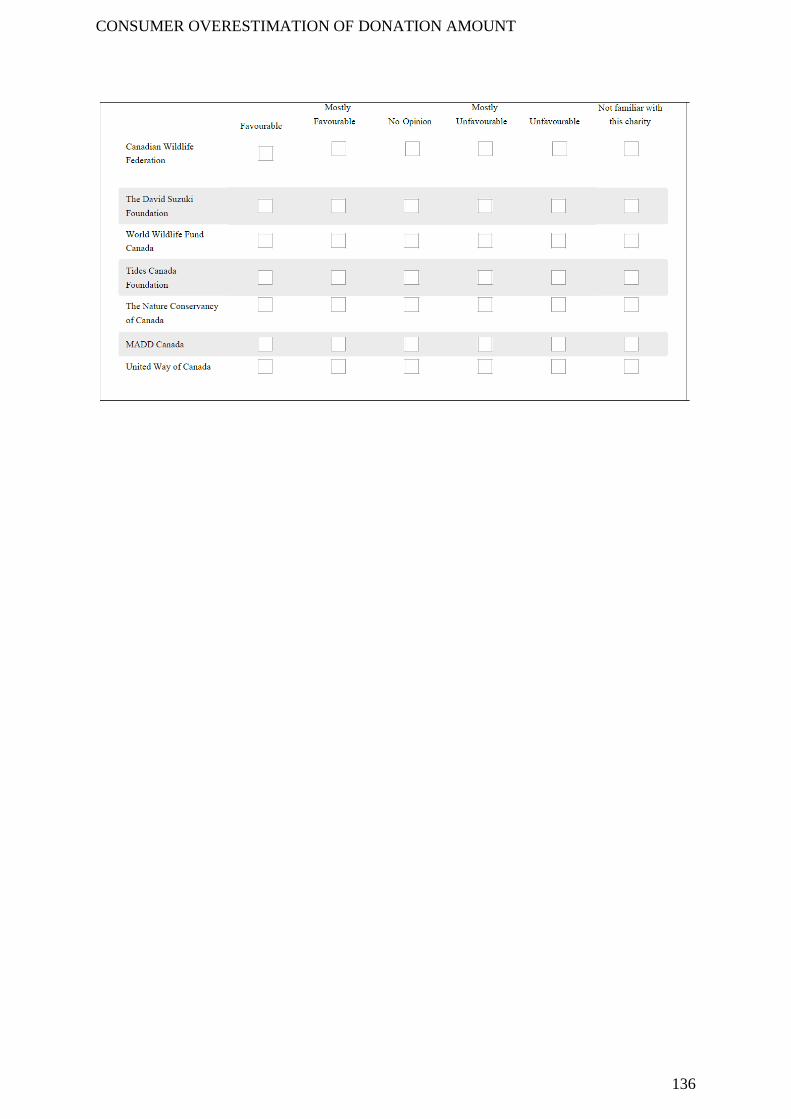
CONSUMER OVERESTIMATION OF DONATION AMOUNT
136

CONSUMER OVERESTIMATION OF DONATION AMOUNT
137

CONSUMER OVERESTIMATION OF DONATION AMOUNT
138

CONSUMER OVERESTIMATION OF DONATION AMOUNT
139

CONSUMER OVERESTIMATION OF DONATION AMOUNT
140

CONSUMER OVERESTIMATION OF DONATION AMOUNT
141

CONSUMER OVERESTIMATION OF DONATION AMOUNT
142
Appendix 2: Example of Main Experiment Questionnaire
Consumer Estimation of Donation Amount in Cause-Related
Marketing (Vague Quantifier & 2 Causes Portfolio Conditions)
Welcome to My Survey
Thank you for agreeing to complete this survey. Your participation is appreciated and it
will help to shape the outcome of the research. The research study is titled "Consumer
Estimation of Donation Amount in Cause-Related Marketing". The study is being
conducted by Ken Atere from Athabasca University, Alberta.
Purpose of this research study is to gauge the extent of respondents’ familiarity and
disposition towards business corporations whose charities support children’s health,
recreational and social service issues in Canada. This survey will take approximately 8
minutes to complete. Your participation in this survey is absolutely voluntary and you
can withdraw at any time. You are at liberty to omit any question. Responses will be
anonymous and will be used in confidence.
At the end of the survey, you will be entered in a draw where you can win $100.
If you have questions about the survey, please email: [email protected]

CONSUMER OVERESTIMATION OF DONATION AMOUNT
143

CONSUMER OVERESTIMATION OF DONATION AMOUNT
144

CONSUMER OVERESTIMATION OF DONATION AMOUNT
145
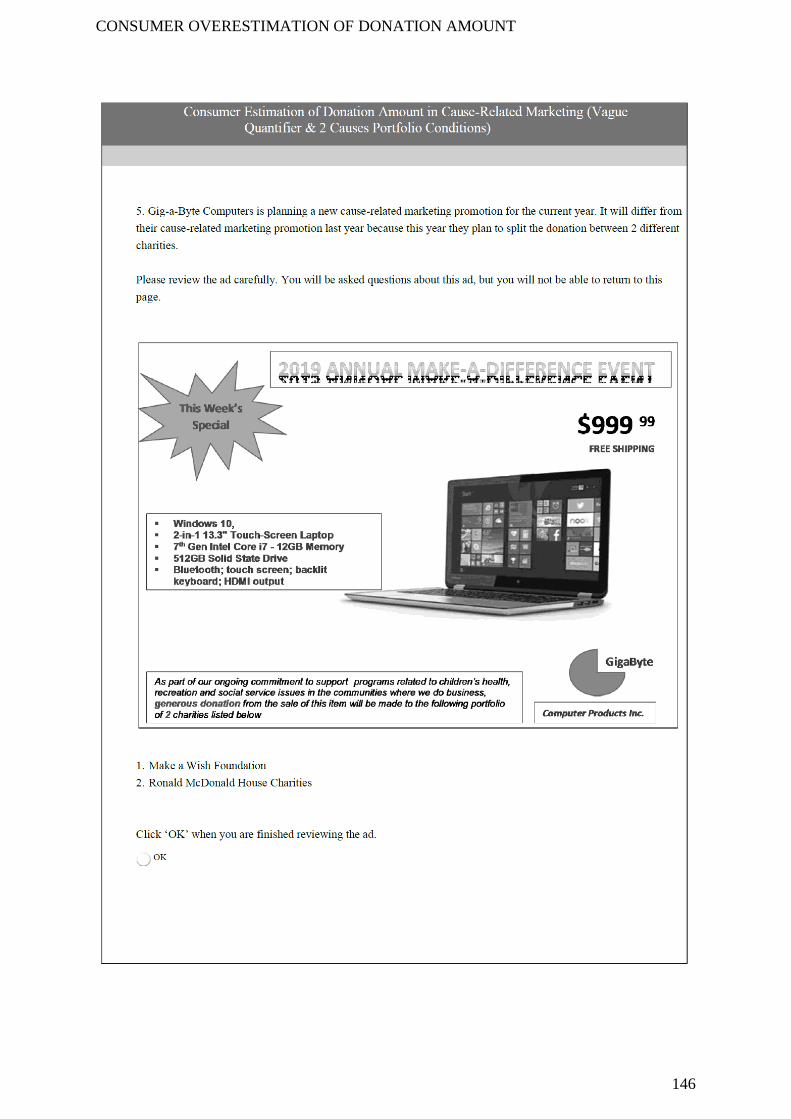
CONSUMER OVERESTIMATION OF DONATION AMOUNT
146

CONSUMER OVERESTIMATION OF DONATION AMOUNT
147

CONSUMER OVERESTIMATION OF DONATION AMOUNT
148

CONSUMER OVERESTIMATION OF DONATION AMOUNT
149

CONSUMER OVERESTIMATION OF DONATION AMOUNT
150

CONSUMER OVERESTIMATION OF DONATION AMOUNT
151

CONSUMER OVERESTIMATION OF DONATION AMOUNT
152

153
Appendix 3: Research Ethics Board (REB) Approval
CERTIFICATION OF ETHICAL APPROVAL
The Athabasca University Research Ethics Board (AUREB) has reviewed and approved the research project noted
below. The AUREB is constituted and operates in accordance with the current version of the Tri-Council Policy
Statement: Ethical Conduct for Research Involving Humans (TCPS) and Athabasca University Policy and
Procedures.
Ethics File No.: 23544
Principal Investigator: Mr. Ken Atere, Graduate Student Faculty of Business\Doctorate in Business Administration
Supervisor: Dr. Shaun McQuitty (Supervisor)
Project Title: Consumer Overestimation of Donation Amount in Cause-Related Marketing Campaigns: Effect of Multiple Cause
Portfolio Size and Framing
Effective Date: August 01, 2019 Expiry Date: July 31, 2020
Restrictions:
Any modification or amendment to the approved research must be submitted to the AUREB for approval.
Ethical approval is valid for a period of one year. An annual request for renewal must be submitted and approved
by the above expiry date if a project is ongoing beyond one year.
A Project Completion (Final) Report must be submitted when the research is complete (i.e. all participant contact
and data collection is concluded, no follow-up with participants is anticipated and findings have been made
available/provided to participants (if applicable)) or the research is terminated.
Approved by: Date: August 1, 2019
Saud Taj, Chair Faculty of Business, Departmental Ethics Review Committee
________________________________________________________________________________
Athabasca University Research Ethics Board
University Research Services, Research Centre
1 University Drive, Athabasca AB Canada T9S 3A3
E-mail [email protected]
Telephone: 780.675.6718