Embed Size (px)
Citation preview

Plant & CellPhysiol. 14: 1081-1097 (1973)
Photophosphorylation in intact algae: Effects ofinhibitors, intensity of light, electronacceptor and donors
Glenn W. Bedell II and Govindjee
Department of Botany, University of Illinois, Urbana, Illinois 61801 U. S. A.
(Received May 1, 1973)
The luciferin-luciferase method was used to determine ATP extracted from dark-maintained and light-exposed samples of the green alga Chlorella pyrenoidosa and of theblue-green alga Anacystis nidulans. A few measurements on Synechococcus lividus (a blue-green thermophile, clone 65°C) are also reported.
1. The light-minus-dark ATP levels (JATP) from aerobic cells of Chlorella andAnacystis were negative; however, JATP from Synechococcus was positive. Large positiveJATP was obtained in regularly grown (RG: moderate light) Chlorella treated witholigomycin; dark levels were reduced, light levels remained essentially unaffected. Inhigh-light exposed (HLE) Chlorella, oligomycin reduced both light and dark ATP levels,but positive A ATP was still obtained. However, in Anacystis, which has a differentorganization of thylakoid membrane, oligomycin severely reduced both the light andthe dark ATP levels and the JATP remained negative.
2. The oligomycin (12 fit*) treated Chlorella and the untreated Anacystis and Syne-chococcus show the presence of cyclic photophosphorylation under conditions in which thenon-cyclic electron flow from photosystem II to photosystem I is blocked by 10 f*M3-(3,4-dichlorophenyl)-l,l-dimethylurea (DCMU), or not allowed to operate by theabsence of CO2. Cyclic photophosphorylation ranged from 10-30% of the maximumJATP in RG, to 40-50% in HLE Chlorella. In RG Chlorella, cyclic and non-cyclic (inthe absence of DCMU) photophosphorylation (JATP) saturate at about 103 ergs cm"2
sec"1 and 104 ergs cm-2 sec"1 red (>640 nm) light, respectively; a lag was observed inthe light curve.
3. In Chlorella, the addition of the photosystem I electron acceptor methyl viologen(MV; 1 nut) increased JATP by twofold. Further addition of DCMU (25 ^M) reducedthis to the level observed with DCMU alone. If 1 mil reduced dichlorophenol indo-phenol or phenazine methosulphate (DCPIPH2 or PMSH2, respectively) was addedalong with DCMU, the JATP level was 30-40% of the control. Further addition ofMV increased the JATP to be 70-80% of that of the control. These and other resultsconfirm the presence of both non-cyclic and cyclic photophosphorylation in vivo, theformer predominating in Chlorella, and the latter in Anacystis and Synechococcus.
Abbreviations: DA, dark adapted celb; JATP, light minus dark ATP levels; DCMU, 3-(3,4-dichlorophenyl)-1,1-dimethyl urea; DCPIPH2, reduced dichlorophenol indophenol; HLE, highlight exposed cells; MV, methyl viologen; PMSH2, reduced phenazine methosulfate; RG, regularlygrown cells; S13, 5-chloro-3-t-butyl-2'-chloro-4'-nitrosalicylanilide.
1081
at University of Illinois at U
rbana-Cham
paign on July 7, 2010 http://pcp.oxfordjournals.org
Dow
nloaded from

1082 G. W. Bedell II and Govindjee
Most measurements of photophosphorylation have been made on isolatedchloroplasts, which can be induced to yield very high rates of photophosphorylationupon the addition of ADP, inorganic phosphate and various cofactors (see review,/). The results from such studies in isolated chloroplasts may not reflect whatoccurs in whole cells. For example, pseudo-cyclic photophosphorylation, observedin isolated chloroplasts, is believed not to exist in whole cells (2). Also, veryhigh rates of photophosphorylation have never been obtained from whole cells.Though the presence of ATP in photosynthetic organisms was first observed inextracts from intact cells of the green alga Chlorella in the early 1950's (3, 4), fewworkers measured photophosphorylation in vivo (5, 6, see ref. 7 for earlier literature).Usually, under aerobic conditions, negative light-minus-dark ATP levels (<dATP)were observed (8). Recently, Oelze-karow and Butler (5) showed definite positive^dATP in greening bean leaves, feasible only because of the low drain on ATPduring the early stages of development of the chloroplast.
Interpretation of the results of in vivo ATP measurement is complex. Themeasured in vivo ATP levels reflect the transitory ATP pool that exists as a resultof the flux between the rates of synthesis (by photophosphorylation and oxidativephosphorylation) and the rates of utilization (by photosynthetic CO2 fixationand other synthetic reactions). The obvious starting point for a study of in vivophotophosphorylation is to diminish or shut down oxidative phosphorylation bythe addition of specific poisons, anaerobiosis, or a combination of both. Further-more, conditions should be chosen to diminish or shut down ATP utilization pro-cesses. This can be accomplished partially by using specific poisons and/or usingshort-term light exposures, as photosynthetic CO2 fixation (utilizing ATP) is aslow process (see Bassham, 9). (Most attempts to measure in vivo photophos-phorylation have involved at least several minutes of illumination (e.g., see 5,6, 10).)
Several reports on different aspects of ATP measurement have recently ap-peared in the literature (11—13). Evidence is presented in this paper that theZlATP, normally negative in Chlorella, can be made positive by adding the properpoison(s), e.g., oligomycin, and using short periods of illumination (~20sec).However, in Anacystis, oligomycin decreases both dark and light-induced phos-phorylation, maintaining negative ^dATP. We report parallel measurementsof O2 evolution and JATP in oligomycin-treated Chlorella with increasing con-centrations of DCMU (3-(3,4-dichlorophenyl)-l,l-dimethylurea). At those con-centrations of DGMU when O2 evolution was reduced to zero, positive 2IATPwas measured (cyclic phosphorylation). In blue-green alga Anacystis (or Syn-echococcus, without oligomycin) .JATP changed from negative (or less positive)to positive (or more positive) values as the DCMU concentration was increased,suggesting a relatively important role of cyclic phosphorylation in these algae.Experiments with added electron acceptor, methyl viologen (MV) and donors,reduced 2,6-dichlorophenol indophenol and phenazine methosulphate (DCPIPH2and PMSH2), confirm the presence of both noncyclic and cyclic photophosphory-lation, the former dominating in green algae and the latter in blue-green algae.Light curves of the two types of phosphorylation in vivo suggest that cyclic saturatesat ten times lower intensity than noncylcic in algae.
at University of Illinois at U
rbana-Cham
paign on July 7, 2010 http://pcp.oxfordjournals.org
Dow
nloaded from

Photophosphorylation in algae 1083
Materials and methods
Algal culture and sample preparation.
Chlorella pyrenoidosa and Anacystis nidulans were grown in inorganic media undercontinuous illumination as previously described (14). Chllorella grown in thismanner is referred to as regularly grown (RG). Cells placed in the dark for24 hr prior to the experiments are referred to as dark-adapted (DA). Chlorellacells exposed to two 100 watt tungsten bulbs (25 cm away from flask) for 24 hrpreceeding the experiments are referred to as high light-exposed (HLE). Syn-echococcus lividus (a blue-green thermophile, 65°C clone) was also autotrophicallygrown, with some nitriloacetic acid added as a chelating agent (15). It was grownat 65°C, gassed and stirred with 0.5% CO2 in air under high intensity tungstenillumination (one 500 watt and one 150 watt bulb 20 cm from flask).
Samples for the experiments were taken from the Chlorella culture 3 to 6 daysafter inoculation; 5 to 7 days for Anacystis and Synechococcus. The cells, after washing,were suspended in carbonate-bicarbonate buffer (0.1 M, pH 8.2); we chose thisbuffer because it provided optimum pH for ATP synthesis (3) and O2 evolution(16) in Chlorella. The cells were kept in the dark for one hr, diluted in dim greenlight to give an absorbance of 0.3 (50% absorption) at the 678 nm chlorophylla peak, and finally left for 20 to 40 min with any added chemicals for equilibration.Suspensions, when necessary, were made anaerobic by gassing during the latterdark waiting period with 100% argon.
Absorption measurements.
The absorption spectra were measured with a recording spectrophotometer(Bausch and Lomb Co., Rochester, N.Y., model Spectronic 505; half-band width,5 nm) equipped with an Ulbricht integrating sphere.
The absorbance of chlorophyll, extracted from Chlorella with 100% methanoland from Anacystis with 80% acetone in water, was measured in another spectro-photometer (Cary Instruments, Monrovia, Calif, model 14), and its concentrationwas calculated according to McKinney (17). (Also, see Strain and Svec, ref.18).
Oxygen measurements.
The differential manometer (closed type) and experimental procedures formanometry were as previously described (19). Pressure changes due to oxygenexehange were determined every minute by measuring the meniscii of themanometer fluid with the aid of cathetometers. White and monochromatic(5 to 10 nm half-band width) light were obtained from the Emerson-Lewismonochromator. Intensity measurements were made with a large surface bolometer.The rate of O2 evolution was also measured by a stationary platinum/Ag-AgClelectrode similar to that of Bannister and Vrooman (20). The O2 concentrationof the algal samples was measured by using a teflon covered Clark-type O2electrode (Yellow Springs Instrument Co., Yellow Springs, Ohio) with a YSImodel 53 monitor. The sample chamber and the electrode holder, built by oneof the authors (21), had a small volume (1.2 ml) with the magnetic stirring atvery close proximity to the electrode to increase the response and sensitivity.
at University of Illinois at U
rbana-Cham
paign on July 7, 2010 http://pcp.oxfordjournals.org
Dow
nloaded from

1084 G. W. Bedell II and Govindjee
Illumination system for ATP measurements.
The illumination source for the ATP measurements was a 1000 watt tungstenlamp regulated by a (Variac) autotransformer connected to a constant voltagepower supply. White light was passed through two filters, a Corning glass C.S.1-97 and a Schott glass M978. The emission spectrum of this light, measuredwith an Isco spectroradiometer, had a peak at 600 nm with 50% emission at 500and 700 nm. The total light intensity was 7.5 X 10⁴ ergs cm"2 sec"1 as measuredby a Yellow Springs radiometer (Yellow Springs Instrument Co., Yellow Springs,Ohio, model 63).
ATP measurements.
The ATP content of the algal samples was determined with a luciferin-Inciferase(firefly) technique sensitive to picogram amounts of ATP (22). Two ml of cellsuspension was given the proper actinic illumination or dark treatment for thespecified time and temperature (5°C for Chlorella and Anacystis and 65°C for Syn-echococcus). The sample was quicly (<2 sec) poured into 3.0 ml boiling glycinebuffer (20 RIM, NH4+ free, pH 7.7, from Calbiochem Corp., Los Angeles, Calif.),boiled for 15 min, and then placed in an ice bath to bring it quickly to room tempera-ture. The tubes were then centrifuged for 10 min at 3000 Xg to remove celldebris. The total volume of each tube was adjusted to 5.0 ml (for other details,see ref. 21).
For the ATP determination, 0.75 ml of cell extract was transferred to 1.0 cmpathlength glass cuvettes, mounted in the measuring instrument (see ref. 21) con-taining an Electra Megadyne Inc. 9558 B photomultiplier, and injected with 0.25 mlof the firefly enzyme extract1. The height of the initial signal, measured witha Heathkit Servo recorder, was found to be proportional to the total amount ofATP present in the sample2. The amount of ATP contained in each samplewas determined from an ATP standard curve, prepared using the above techniques;this curve was perfectly linear in the 0-100 nanomole range.
Results
Characteristics of regularly grown and high light-exposed Chlorella cells.
Before making ATP measurements, we measured some of the characteristicsof RG and HLE Chlorella. These are summarized in Table 1. An interestingpoint to note is that RG (or DA) cells showed the usual Emerson enhancement( = [R(S + L) —R(S) ]/R(L), where R is the rate of O2 evolution, S and L represent650 nm and 710 nm light, respectively), whereas HLE cells showed a lack of it.
1 The firefly enzyme extract was prepared by adding 5.0 ml of glass distilled water to 50 mg of buffered(0.05 M KAsO4 and 0.02 M MgSO4, pH 7.4) firefly lantern extract (Sigma Chemical Co., St. Louis,Mo., FLE-50) at room temperature. After 20 min, the milky suspension was cleared by 30 mincentrifugation at 10,000 Xg at 5°C.2 The residual ATP in 0.25 ml of firefly enzyme (lOmg ml-1), upon injection into 0.75 ml of buffer,contained 10 to 20 picomoles per ml. This is negligible, as 0.75 ml extracts from 2.0 ml of algal cellsusually contain 10 to 100 nanomoles of ATP.
at University of Illinois at U
rbana-Cham
paign on July 7, 2010 http://pcp.oxfordjournals.org
Dow
nloaded from
15.8x10°0.32
1.3
3.8
4.6
3.5
7.9xl0«0.62
1.67
14.6
6.0
0.5
Photophosphorylation in algae 1085
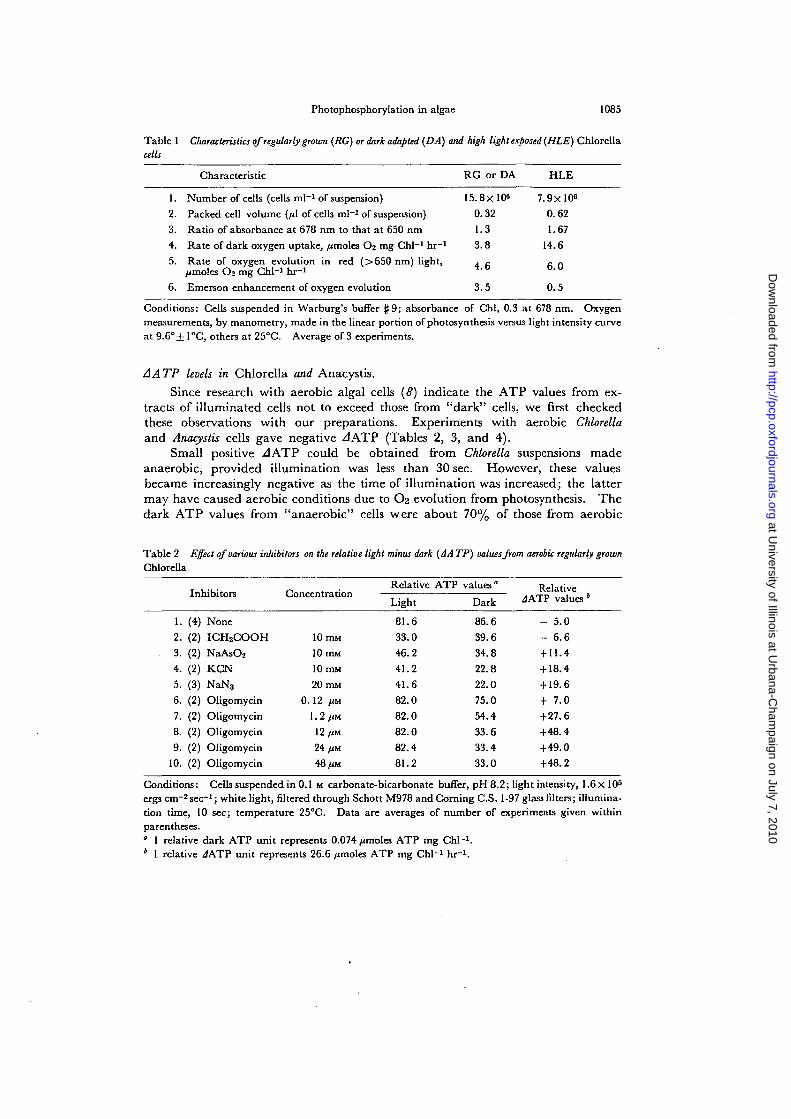
Table 1 Characteristics of regularly grown (RG) or dark adapted (DA) and high light exposed (HLE) Chlorellacells
Characteristic RG or DA HLE
1. Number of cells (cells ml"1 of suspension)2. Packed cell volume (//I of cells ml"1 of suspension)3. Ratio of absorbance at 678 nm to that at 650 nm4. Rate of dark oxygen uptake, /tmoles O'j mg Chi"1 hr"1
5. Rate of oxygen evolution in red (>650 nm) light,/imoles O2 mg Chi"1 hr-1
6. Emerson enhancement of oxygen evolution
Conditions: Cells suspended in Warburg's buffer f 9; absorbance of Chi, 0.3 at 678 nm. Oxygenmeasurements, by manometry, made in the linear portion of photosynthesis versus light intensity curveat 9.6°± 1°C, others at 25°C. Average of 3 experiments.
AATP levels in Chlorella and Anacystis.
Since research with aerobic algal cells (8) indicate the ATP values from ex-tracts of illuminated cells not to exceed those from "dark" cells, we first checkedthese observations with our preparations. Experiments with aerobic Chlorellaand Anacystis cells gave negative JATP (Tables 2, 3, and 4).
Small positive AATP could be obtained from Chlorella suspensions madeanaerobic, provided illumination was less than 30 sec. However, these valuesbecame increasingly negative as the time of illumination was increased; the lattermay have caused aerobic conditions due to O2 evolution from photosynthesis. Thedark ATP values from "anaerobic" cells were about 70% of those from aerobic
Table 2 Effect of various inhibitors on the relative light minus dark (A A TP) values from aerobic regularly grownChlorella
Relative ATP values" RelativeInhibitors Concentration t A r™ , __ j
Light Dark J A T P v a l u e s
81.633.046.241.241.682.082.082.082.481.2
Conditions: Cells suspended in 0.1 M carbonate-bicarbonate buffer, pH 8.2; light intensity, 1.6 x 10⁵
ergs cm"2 sec"1; white light, filtered through Schott M978 and Corning C.S. 1-97 glass filters; illumina-tion time, 10 sec; temperature 25°C. Data are averages of number of experiments given withinparentheses.' 1 relative dark ATP unit represents 0.074/unoles ATP mg Chi"1.* 1 relative 4ATP unit represents 26.6 /imoles ATP mg Chi"1 hr"1.
1. (4)2. (2)
3. (2)
4. (2)
5. (3)
6. (2)
7. (2)
8. (2)
9. (2)
10. (2)
NoneICH2COOH
NaAsOa
KCN
NaN3
Oligomycin
Oligomycin
Oligomycin
Oligomycin
Oligomycin
10 mM
10 mM
10 mM
20mM
0 .12 /iM
1.2 (M
12 /iM
24 HM
48 /M
86.639.634.822.822.075.054.433.633.433.0
- 5.0- 6.6+ 11.4+ 18.4+ 19.6+ 7.0+ 27.6+48.4+49.0+48.2
at University of Illinois at U
rbana-Cham
paign on July 7, 2010 http://pcp.oxfordjournals.org
Dow
nloaded from
1086 G. W. Bedell II and Govindjee
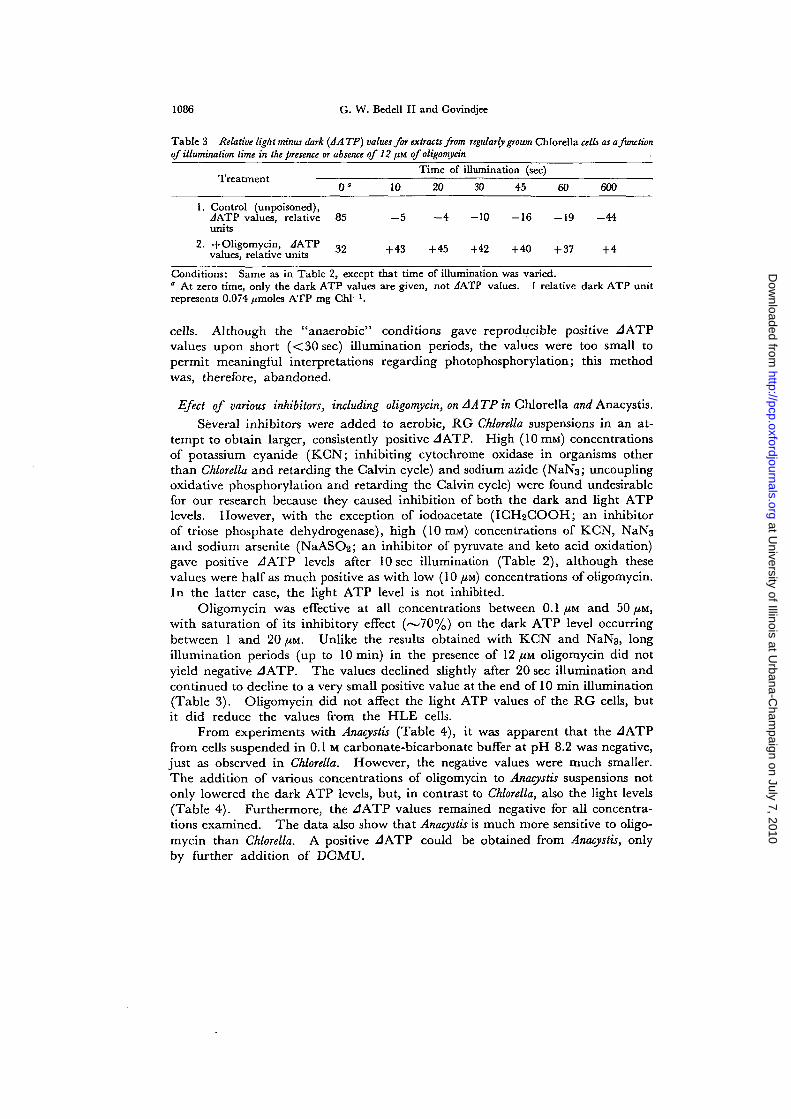
Table 3 Relative light minus dark {A A TP) values for extracts from regularly grown Chlorella cells as a functionof illumination time in the presence or absence of 12 /M of oligomycin
Time of illumination (sec)Treatment
0 " 10 20 30 45 60 600
1. Control (unpoisoned),JATP values, relative 85 - 5 - 4 -10 - 1 6 - 1 9 - 4 4units
2. +Oligomydn, JATP n ^ 4 5 4 2 w 3 y 4values, relative units
Conditions: Same as in Table 2, except that time of illumination was varied.* At zero time, only the dark ATP values are given, not JATP values. 1 relative dark ATP unitrepresents 0.074 /imoles ATP mg Chi-1.
cells. Although the "anaerobic" conditions gave reproducible positive JATPvalues upon short (<30 sec) illumination periods, the values were too small topermit meaningful interpretations regarding photophosphorylation; this methodwas, therefore, abandoned.
Eject of various inhibitors, including oligomycin, on A A TP in Chlorella arcrf Anacystis.
Several inhibitors were added to aerobic, RG Chlorella suspensions in an at-tempt to obtain larger, consistently positive A ATP. High (10 mM) concentrationsof potassium cyanide (KCN; inhibiting cytochrome oxidase in organisms otherthan Chlorella and retarding the Calvin cycle) and sodium azide (NaN3; uncouplingoxidative phosphorylation and retarding the Calvin cycle) were found undesirablefor our research because they caused inhibition of both the dark and light ATPlevels. However, with the exception of iodoacetate (ICH2COOH; an inhibitorof triose phosphate dehydrogenase), high (10 HIM) concentrations of KCN, NaN3and sodium arsenite (NaASC>2; an inhibitor of pyruvate and keto acid oxidation)gave positive /1ATP levels after 10 sec illumination (Table 2), although thesevalues were half as much positive as with low (10 /M) concentrations of oligomycin.In the latter case, the light ATP level is not inhibited.
Oligomycin was effective at all concentrations between 0.1 fiu and 50 JAM,with saturation of its inhibitory effect (~70%) on the dark ATP level occurringbetween 1 and 20 /JM. Unlike the results obtained with KCN and NaN3, longillumination periods (up to 10 min) in the presence of 12 /xu oligomycin did notyield negative ZlATP. The values declined slightly after 20 sec illumination andcontinued to decline to a very small positive value at the end of 10 min illumination(Table 3). Oligomycin did not affect the light ATP values of the RG cells, butit did reduce the values from the HLE cells.
From experiments with Anacystis (Table 4), it was apparent that the JATPfrom cells suspended in 0.1 M carbonate-bicarbonate buffer at pH 8.2 was negative,just as observed in Chlorella. However, the negative values were much smaller.The addition of various concentrations of oligomycin to Anacystis suspensions notonly lowered the dark ATP levels, but, in contrast to Chlorella, also the light levels(Table 4). Furthermore, the JATP values remained negative for all concentra-tions examined. The data also show that Anacystis is much more sensitive to oligo-mycin than Chlorella. A positive ^ATP could be obtained from Anacystis, onlyby further addition of DCMU.
at University of Illinois at U
rbana-Cham
paign on July 7, 2010 http://pcp.oxfordjournals.org
Dow
nloaded from
Photophosphorylation in algae 1087
Table 4 Relative light minus dark A TP (JA TP) levels in Anacystis as a function of the concentration ofoligomycin
1.
2.
3.
4.
5.
6.
7.
Concentrations
Control
+0.21 /JM Oligomycin
+0.6 jUM Oligomycin
+2.4 /IM Oligomycin
+6.0 fin Oligomycin
+ 12 /JM Oligomycin
+ 12 /XM Oligomycin +25 ftM DCMU
Light
28.4
14.8
13.7
12.8
12.6
12.6
14.2
ATP levels, relative
Dark0
33.0
15.9
14.8
14.6
14.5
14.8
12.0
units
JATP*
- 4 . 6
- 1 . 1
- 1 . 1
- 1 . 8
- 1 . 9
- 2 . 2
+2.2Conditions: Cells suspended in carbonate-bicarbonate buffer, 0.1 M, pH 8.2; absorbance, 0.3at 678 nm; illumination, 20 sec, orange (>540) light (4x 10⁵ ergs cm"2 sec-1) at 25°C.Average of 2 experiments." 1 relative dark ATP unit represents 0.074 /unoles ATP mg Chl-i.4 1 relative JATP unit represents 13.3 /jmoles ATP mg Chi-1 hr"1.
Effect of oligomycin on the steady state (lOmin) oxygen evolution and the ATP levels inRG and HLE Chlorella cells.
Since the addition of oligomycin to Chlorella cells permitted a positive .indicating photophosphorylation activity, it was necessary to make comparativemeasurements on oxygen exchange (see Table 5). Two correlations can be ob-served in untreated cells in these long term (10 min) experiments: (1) the darkATP levels increase as the rate of dark O2 uptake increases, as ATP productionis coupled to electron flow; (2) as the rate of photosynthesis increases, the A ATPlevels decrease because ATP produced in light is being more fully utilized inCO2 fixation reactions. Superimposed on this effect is the oligomycin effect thatallows us to observe positive .JATP. Furthermore, we note that HLE cells hadhigher light and dark ATP levels than in RG cells (see below).
Table 5 Oxygen exchange and light and dark ATP values during steady state in regularly grown and high lightexposed Chlorella
1. Control, regularlygrown
2. Control, high lightexposed
3. + Oligomycin,regularly grown
4. + Oligomycin, highlight exposed
Oxygen uptake ( —) or evolution,/imoles O2 mg Chi-1 h i - 1
(by manometry)
(1) (2) (3)Light Dark Photosynthesis
61.1 -10.8 +71.9
38.9 -23.2 +62.1
47.3 - 6 . 9 +54.2
27.8 -11.6 +39.4
Lighi
39.0
82.1
37.1
55.6
Relative ATP
(2)t Dark'
77.2
105.5.
26.8
52.2
values
(3)JATP 4
-38.2
-23.4 •
+ 10.3
+3.4
Conditions: Aerobic; illumination time, 10 min; white light intensity 3.5 XlO5 ergs cm-2 sec*1;suspension absorbance (at 678 nm), 0.3 in carbonate-bicarbonate buffer, 0.1 M, pH 8.2. Averageof 4 experiments." 1 relative dark ATP unit represents 0.074 /zmoles ATP mg Chi"1.4 1 relative JATP unit represents 0.4/*moles ATP mg Chi-1 hr-1.
at University of Illinois at U
rbana-Cham
paign on July 7, 2010 http://pcp.oxfordjournals.org
Dow
nloaded from

1088 G. W. Bedell II and Govindjee
Effect of DCMU on oxygen evolution and A TP levels in Chlorella.
In order to distinguish cyclic from non-cyclic photophosphorylation, electrontransport from photosystem II to photosystem I was blocked by DCMU (23).The effects of this poison were examined as a function of concentration for bothO2 evolution and ATP levels in both RG and HLE oligomycin-treated Chlorella.Fig. 1A shows that 0.25 feu DCMU suppresses 40% of the JATP levels, and 60%of the O2 evolution in RG Chlorella. 25 /HM DCMU, however, completely inhibitsO2 evolution but only 70% of JATP, indicating the presence of cyclic photo-phosphorylation.
Since HLE Chlorella cells were shown to have no Emerson enhancement effect(Table 1) and it has been suggested that its absence may be correlated to the higherATP levels occurring in these cells (24), a series of experiments identical to thepreceeding was done on these HLE cells. Fig. IB shows that 0.25 /JM DCMUsuppresses 25% of the JATP levels and only 45% of the oxygen evolution. How-ever, 25 /JM DCMU inhibited the ATP level by only 50%, although oxygen evolutionwas completely eliminated, again indicating, but more clearly, the presence ofcyclic photophosphorylation. The cylcic photophosphorylation levels were alwayshigher in the HLE than in the RG cells. Thus, it appears that the absence ofEmerson enhancement effect in HLE cells parallels the higher "cyclic" ATP(see ref. 24 for a possible explanation).
£
(A)
I0 ' 4 M
(B)
ICI"6 1 0 " ' 10"* M
(DCMU] 1PCMU]
Fig. 1. Effect of two different concentrations ( Z 5 x 10~7 M or 0.25 /M and 2.5X 10~5M or 25/XM) ofDCMU on the light minus dark (AATP) levels and oxygen evolution in oligomycin (12/M) treated regularlygrown (A) and high light exposed Chlorella cells (B). OD at 678 nm, 0.3. Oxygen measured onplatinum rate electrode; phosphate buffer, 0.1M, pH 8.0; gassed with 5% CO2, 2% Oa and 93%N2 mixture; illumination time, 4 min; values given, measured at 20 sec (A) or 1 min (B); redlight (>640 nm; M978 Schott, C.S. 2-64 and C.S. 1-97 Corning glass filters); light intensity,2xlO5 ergs cm~2 sec"1; temperature, 25°C. Aaverage of 3 experiments.
Effect of DCMU on AATP and oxygen evolution in Anacystis.
For comparative purposes the techniques and buffers used were nearly thesame as those used in the Chlorella studies, minus oligomycin. As the concentrationof DCMU is increased, the O2 level is lowered and the JATP level becomes less
at University of Illinois at U
rbana-Cham
paign on July 7, 2010 http://pcp.oxfordjournals.org
Dow
nloaded from
Photophosphorylation in algae 1089
Table 6 Relative net oxygen evolution and light minus dark ATP {AATP) levels as a function of DCMUconcentration from Anacystis
1. Control
2. +0.25/IM DCMU3. +25 /M DCMU
4. +25 IM DCMU +1 HM Si
ATP levels, relative units
Light
(1) 35. 1(2) 36.7
36.7(1) 42.0(2) 46.7
a 24.6
Dark0
39.238.137.937.138.128.2
JATP*
-4 .1-1 .4- 1 . 2+ 4.9+8.7-3 .6
Rate of Os evloution,relative units
(1) 253(2) 240
158
(1) 12(2) 15
—
Percentcontrol
100
100
63
5
6
—
Conditions: Cells suspended in carbonate-bicarbonate buffer, 0.1 M, pH 8.2; absorbance, 0.3 at678 run; illumination, 20 sec, orange (>540) light (4x 10⁵ ergs cm"2 sec"1) at 25°C. Oxygen levelsmeasured under similar conditions on the platinum rate electrode. Average of 2 experiments.(1) and (2) experiments with separate cultures." 1 relative dark ATP unit represents 0.074 /tmoles ATP mg Chi"1.4 1 relative JATP unit represents 13.3 /rnioles ATP mg Chi-* hr-1.
Table 7 Relative net oxygen evolution and light minus dark A TP (AA TP) levels in Synechococcus
ATP values, relative units Rate of O2 evolution,
1.
2.
3.
Control
+25 /iM
+ 1 mia
DCMU
MV
Light
33.5
34.8
24.1
Da
22.
22.
21.
rk°
2
0
7
ATP4
+ 11.3
+ 12.8
+ 2.4
relative units
92
32
—
Conditions: Same as for Table 6, except that the temperature was 65CC. Oxygen measurementswere made under similar conditions on the concentration electrode (Clark-type). Average of2 experiments." 1 relative dark ATP unit represents 0.074 //moles ATP mg Chi-1.4 1 relative JATP unit represents 13.3/imoles ATP mg Chi-1 hr-1.
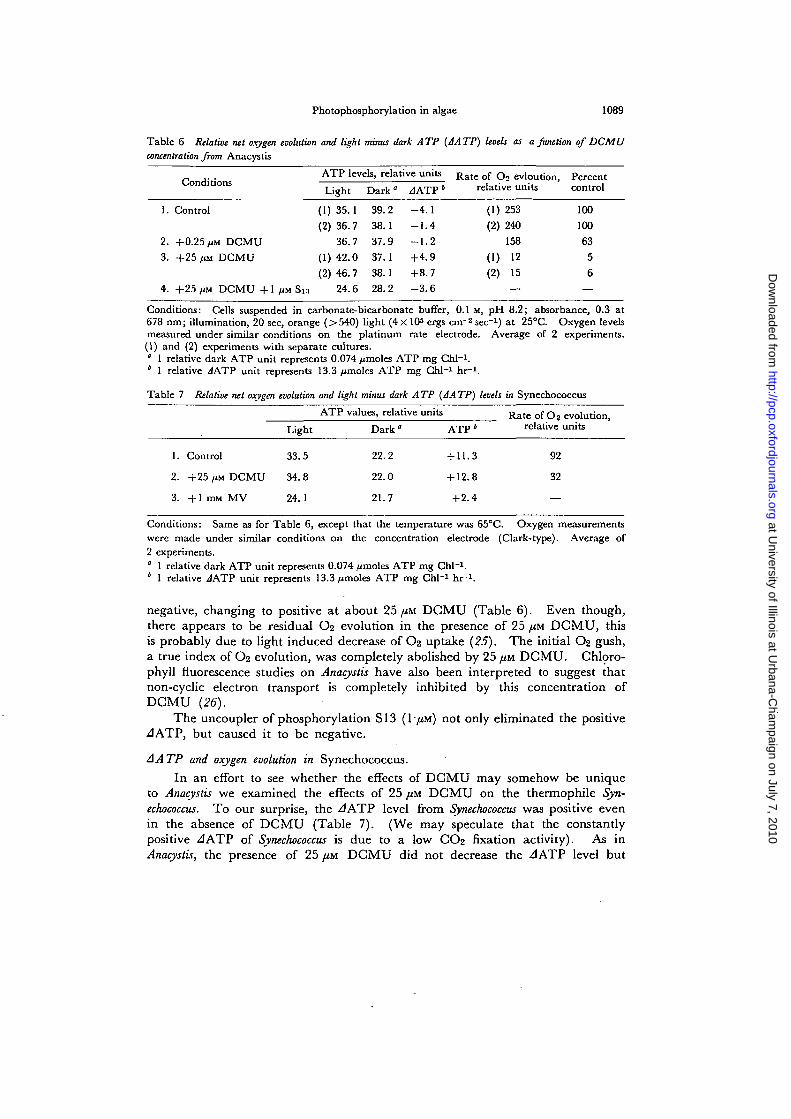
negative, changing to positive at about 25 fiu DCMU (Table 6). Even though,there appears to be residual O2 evolution in the presence of 25 fiM DCMU, thisis probably due to light induced decrease of O2 uptake (25). The initial O2 gush,a true index of O2 evolution, was completely abolished by 25 /M DCMU. Chloro-phyll fluorescence studies on Anacystis have also been interpreted to suggest thatnon-cyclic electron transport is completely inhibited by this concentration ofDCMU {26).
The uncoupler of phosphorylation S13 (1/<M) not only eliminated the positive4ATP, but caused it to be negative.
AATP and oxygen evolution in Synechococcus.In an effort to see whether the effects of DCMU may somehow be unique
to Anacystis we examined the effects of 25 /JM DCMU on the thermophile Syn-echococcus. To our surprise, the ^lATP level from Synechococcus was positive evenin the absence of DCMU (Table 7). (We may speculate that the constantlypositive ^ATP of Synechococcus is due to a low CO2 fixation activity). As inAnacystis, the presence of 25 /J.M DCMU did not decrease the JATP level but
at University of Illinois at U
rbana-Cham
paign on July 7, 2010 http://pcp.oxfordjournals.org
Dow
nloaded from

1090 G. W. Bedell II and Govindjee
permitted it to become slightly more positive. When 1 mM MV was added in theabsence of DCMU to Synechococcus, the /1ATP level was strongly reduced, notstimulated as in the case of Chlorella (see below). This difference may be relatedto the higher rate of cyclic than non-cyclic photophosphorylation in blue-greenalgae. (The MV had little or no effect on the dark ATP level.).
Effect of absence of CO2 on A ATP and oxygen evolution in Chlorella.ZlATP data in Fig. 1 show that both cyclic (in the presence of DCMU) and
non-cyclic photophosphorylation are present in Chlorella. However, one could askwhether the addition of DCMU induced the cyclic photophosphorylation. Afurther check, therefore, would be to observe the effect of the absence of CO2 onthe A ATP levels and on O2 evolution; a deprivation of CO2 should ultimatelyshut down O2 evolution and concomitant non-cyclic photophosphorylation butleave cyclic photophosphorylation unaffected. The latter may be expected tobe higher than we normally observe in the presence of CO2 because the rate of ATPutilization would be reduced. Furthermore, since the non-cyclic electron transportpathway is effectively blocked by the absence of CO2, cyclic levels should remainunaffected by the further addition of DCMU (25 fm). Our results were in agree-ment with these expectations (data not shown). The absence of CO2 loweredthe oligomycin-treated (control) value by about 65% and this level did not changeupon the addition of 25 fiM DCMU, the suspending medium being phosphate buffer(0.1 M, pH 8.2).
A ATP levels as a function of light intensityin Chlorella.The preceeding experiments showed that positive .JATP levels could be
observed in oligomycin (12 fiu) treated Chlorella cells, even in the presence of25 /AM DCMU which stopped all O2 evolution; this suggested that both cyclic andnon-cyclic photophosphorylation operate in Chlorella. The question was raised:could cyclic and non-cyclic photophosphorylation, which represent two separatepathways, be further separated without the addition of DCMU ? PMS supportedcyclic photophosphorylation in chloroplasts has been reported to require about200,000 lux of white light for saturation (27), whereas non-cyclic photophosphory-lation saturated at about 20,000 lux (28). Hence, non-cyclic and cyclic photo-phosphorylation might be separated into two phases by measuring JATP asa function of light intensity.
The oligomycin-treated Chlorella suspensions showed an initial lag in thelight-curves for JATP. This may correspond to the low intensity lag observedin chloroplasts (1, 29). Under white light (not shown), positive JATP valuesappeared at about 103 ergs cm"2 sec"1, slowly increasing and then rising rapidlyuntil saturation was reached at about 2 X 10⁴ ergs cm"2 sec"1. A plot of the relativelight minus dark (.JATP) values calculated from the measurement of ATP extractedfrom Chlorella cells exposed to red light of varied intensities (at close intervals)showed a multiphasic curve in the absence of DCMU (Fig. 2) under aerobic con-ditions. After a "lag" to an intensity of about 400 ergs cm~2 sec"1, ATP photo-production rises and saturates at about 1 X Wergs cm"2 sec"1, and again at 1 X10⁴ergs cm~2 sec"1 as noted above. The average JATP levels obtained underanaerobic conditions for two intensities gave results similar to those observed inaerobic conditions.
at University of Illinois at U
rbana-Cham
paign on July 7, 2010 http://pcp.oxfordjournals.org
Dow
nloaded from

Photophosphorylation in algae 1091
0.02 0 04 QO6QO8 0.1 0.2 0.4 0.6 0.8 L0
Incident Intensity, XIO4 ergs ccfiNec1
Fig. 2. Relative A ATP values as a function of intensity of red (>640nm) light in oligomycin (12/JM)poisoned regularly grown Chlorella cells in the presence or absence of DCMU (25 /at) and under aerobic oranaerobic conditions. Symbols: -A~> 10 sec illumination at 685 nm (8 nm half-bandwidth),average of 5 experiments (aerobic); -A~i 10 sec illumination at 657 nm (10 nm half-bandwidth),average of 6 experiments (aerobic); -Q- , 20 sec illumination at >640 nm (aerobic); -X- , 20 secillumination at >640nm with DCMU, average of 4 experiments (aerobic); - 0 - , 20 sec illumina-tion at >640 nm, average of 2 experiments (4 tube-pairs, anaerobic); and -O~> 20 secillumination at >640 nm with DCMU, average of 4 experiments (anaerobic). (Note thelogarithmic scale of the abscissa.)
In the presence of 25 fiu DCMU, and under aerobic or anaerobic conditions,the A ATP levels between 4 x 10² ergs cm"2 sec"1 and 4 x 10³ ergs cm"2 sec"1 ap-peared to be slightly depressed. For intensities above 4 x 10³ergs cm"2 sec"1 thevalues clearly appear to be at the same level as at the first saturation level. Theratio of the saturation level for A ATP in the presence of DCMU to that in theabsence of DCMU was higher (0.28) here than we observed (0.12) in some othersamples of RG Chlorella cells. However, under anaerobic conditions and in theabsence of CO2 (in the presence or absence of DCMU) we have observed as higha ratio as ~0.37. For HLE cells under aerobic conditions and in the presenceof 25 /iM DCMU this ratio was the highest (0.50) we ever observed in Chlorella(see Fig. 1).
Effect of various electron donors and acceptors on A ATP in Chlorella.
To provide an additional check on whether we were able to distinguish bet-ween cyclic and non-cyclic photophosphorylation in Chlorella we examined theeffects of various electron donors, acceptors, inhibitors, and an uncoupler on theAATP levels of oligomycin poisoned Chlorella.
The addition of methyl viologen (MV) to oligomycin (12 ^M) treated RGChlorella affects the A ATP values in two ways depending on the concentration(Fig. 3). Low concentrations of MV (1 /XM) caused an inhibition of 25 percent,whereas high concentrations (1 nm) caused a stimulation of about 100 percentwhen compared to the A ATP values of the control (also see Table 8). [Theillumination time was 20 sec with red (640 nm) light (1.1 X 10⁵ ergs cm"2 sec"1).]The addition of various concentrations of MV to DCMU (25 /MM) and oligomycin
at University of Illinois at U
rbana-Cham
paign on July 7, 2010 http://pcp.oxfordjournals.org
Dow
nloaded from

1092 G. W. Bedell II and Govindjee
OCMU'PMS
id6 id5 id" id3
CONCENTRATION. M
Fig. 3. Effect of various concentrations of different electronacceptors or donors in the presence or absence of 25 /JM DCMU onthe light minus dark ATP {A ATP) values from oligomycin treatedregularly grown Chlorella. (In the text, we have used /JMfor 10~6M, and nw for 10~3M for convenience.) Cellssuspended in carbonate-bicarbonate buffer (0.1 M, pH 8.2);suspension absorbance, 0.3 at 678 nm, under aerobic con-ditions at 25°G. Cells were exposed for 20 sec to anintensity of 1.1 XlO5 ergs cm-2 sec"1 of red (>640 nm)light. DCMU plus MV data are average of 2 experiments,the other points of at least 3 experiments.
(12 JUM) treated Chlorella cells usually left the .4 ATP values essentially unchanged(Fig. 3, x - x ) .
id ATP levels of Chlorella which were treated with 12 fJM oligomycin and25 /xu DCMU were stimulated by the addition of either DCPIPH2 or PMSH2 tothe reaction medium (Fig. 3, A—A and O—O, respectively). (It should bepointed out that 10 mM sodium ascorbate, in the presence of 12 /J,M oligomycin,has no effect on ATP in Chlorella cells.) For all concentrations used, PMSH2 wasslightly more effective than DGPIPH2 in increasing the ZlATP level in the presenceof DCMU. 1 mM PMSH2, the highest concentration used, restored about 50
Table 8 Effect of electron acceptors, donors, inhibitors and an uncoupler on oligomycin (12 fiM.) treated Chlorollacells
Treatment
1. Control2. DCPIP (Oxidized)3. MV4. DCMU5. DCMU + MV6. DCMU+DCPIPH27. DCMU+PMSH2
8. DCMU+DCPIPH2+MV9. DCMU+PMSH2+MV
10. DCMU+cycloheximide
11. DCMU+S13
Relative ATP
Light
51.661.586.223.323.627.632.441.245.426.118.6
Dark"
19.318.419.119.418.917.819.018.118.819.419.4
values
J ATP*
+ 32.3+ 43.1+ 67.1+ 3.8+4.7+ 9.8
+ 13.4+ 23.1+ 26.6+ 6.7- 0 . 8
Percentcontrol
100.0
133.4
207.7
12.0
14.5
30.3
41.7
71.5
82.5
20.9
0.0
Conditions: Same as in Fig. 3. Concentrations: Oxidized or reduced DCPIP, 1 HIM; MV, 1 mM;DCMU, 25 /MM; PMSH2, 1 HIM; cycloheximide, 17 /JM; and S13 (5-C1, 3-t-butyl, 2'-Cl, 4'-NO2-salicyl-anilide), 1 yUM; 5 /*M DCPIP and PMS were reduced by 10 mM sodium ascorbate. Average of atleast 3 experiments. For comparison, cycloheximide and Si3 data were normalized to DCMU valuesin dark.0 1 relative dark ATP unit represents 0.074 /imoles mg Chi-1.4 1 relative 4ATP unit represents 13.3/*moles mg Chi-1 hi-1.
at University of Illinois at U
rbana-Cham
paign on July 7, 2010 http://pcp.oxfordjournals.org
Dow
nloaded from

Photophosphorylation in algae 1093
percent of the control A ATP level that had been reduced by the addition of DCMU;DCPIPH2 restored only 30 percent of the control value. Subsequent addition of1 mil MV further increased the AATP value by twofold (Table 8): the DCPIPH2value rose from about 30 percent to about 72 percent and the PMSH2 value rosefrom about 42 percent to about 83 percent of the control.
The solid black square plotted in Fig. 3 represents the average AATP levelobtained as a result of adding 1 mM oxidized PMS in the presence of DCMU underanaerobic as well as aerobic conditions. In the presence of oxidized PMS or par-tially reduced PMS (50 //M PMS plus 25 /MM sodium ascorbate) the AATP level inthe presence of DCMU was always reduced to zero. The same result was observedwith about 100 times lower concentration of PMS. The above results maysuggest that PMS does not induce cyclic photophosphorylation in intact Chlorella.
Since reactions other than CO2 fixation, such as cytoplasmic protein synthesis,utilize ATP, we checked if cycloheximide (an inhibitor of cytoplasmic proteinsynthesis) would further reduce ATP utilization and create an increase in theapparent cyclic photophosphorylation level: 17 /JM cycloheximide did induce anincrease in the /1ATP level which had been established in the presence of 25 /LCMDCMU and oligomycin. The 12% AATP level increased to 21%.
The test of any photophosphorylation is whether or not it can be uncoupled.The addition of 1 /J,M of the powerful uncoupler S13 completely eliminated the^lATP level which had been present in the presence of oligomycin and DCMUonly (Table 8). The decrease, as a percentage of the control, was from 12 tozero.
Data obtained upon blue (340 nm to 620 nm) light (incident intensity, 1.1 X10⁵ ergs cm"2 sec"1) illumination showed results (not shown) similar to those ob-tained with red (>640 nm) light reported in Table 8.
Discussion
Sensitivity to oligomycin: positive A ATP.
Our studies on the effect of oligomycin on the ATP levels from aerobic cellsof the eukaryotic green alga Chlorella (RG) and the prokaryotic blue-green algaAnacystis clearly show (Tables 2^4) that this inhibitor of oxidative phosphorylation(30, 31) has different in vivo effects on the ATP levels in the two organisms. Whilelow concentrations (12 /JM) of oligomycin were observed to have little effect on thelight ATP levels obtained from RG Chlorella cells, the dark ATP levels were alwayssuppressed by at least 50%, thus giving positive AATP. In contrast, similar orsmaller amounts of oligomycin added to the Anacystis cells always severely suppressedboth the light and the dark ATP values. Furthermore, oligomycin treatment alwayspermitted the AATP of Chlorella cells to become positive with short illuminationperiods, whereas the A ATP of Anacystis cells always remained negative in thepresence or absence of this treatment.
Although there are no other reports of the effects of oligomycin on intactalgal cells, results obtained by other investigators (30), using isolated spinachorganelles, have indicated that photophosphorylation is insensitive to these con-centrations of oligomycin, whereas mitochondrial phosphorylation is completely
at University of Illinois at U
rbana-Cham
paign on July 7, 2010 http://pcp.oxfordjournals.org
Dow
nloaded from

1094 G. W. Bedell II and Govindjee
inhibited: this explains the differential effect of oligomycin on the dark and lightATP levels in the RG eukaryotic green alga Chlorella. In contrast, one may specu-late from some of our results that the blue-green algal photophosphorylation anddark phosphorylation have identical or similar steps and therefore oligomycincauses a decrease in both the dark and light ATP levels. This would be consistentwith the findings that respiratory and photosynthetic processes of blue-green algaeshare certain components (32, 33). Since blue-green algae are prokaryotic, re-sembling photosynthetic bacteria in organization, it is important to point out thatour results would also be consistent with the observation that the coupling factorsfor photophosphorylation and "respiration" in membrane preparations fromRhodopseudomonas capsulaia (34) are interchangeable. (For a discussion on evolutionof eukaryotes from prokaryotes, see ref 35.)
In HLE Chlorella cells oligomycin also decreases both light and dark ATPlevels, although /1ATP is positive. Perhaps, other factors, e.g., exposure of"coupling factor" to different environment, and the permeability of oligomycin tothylakoids of algae examined, must also be considered.
Negative A ATP.Regardless of the experimental conditions, aerobic Chlorella cells, suspended
in carbonate-bicarbonate buffer (0.1 M, pH 8.2), always produced a negative^lATP (cf. ref. 8; Tables 2-4). We did not expect to find the ATP utilizationreactions in the light to exceed the combined synthesis reactions during 15 secillumination periods; this time should have been short enough to insure that mostfixed CO2 would be in the form of 3-phosphoglyceric acid, as Bassham (9) hasobserved. After an extended dark period, perhaps, the combined synthetic reactionsin the light are unable to meet the utilization requirements during the first fewminutes of illumination. The net result is that initially the organism must drawon the ATP pool built up in the dark. It is clear that an equilibrium must bereached at some point since algae do grow well in continuous light. [We alsonote that Lewenstein and Bachofen (13) reported positive A ATP in their Chlorellacells; we do not know the reasons for these different results.]
Cyclic versus non-cyclic; intensity dependence.
The occurrence of cyclic phosphorylation in vivo was shown by Forti andParisi (36). Parallel measurements on O2 evolution and photophosphorylationas a function of increasing DCMU concentration (Fig. 1; Table 6) show greaterratio of cyclic to non-cyclic phosphorylation in Anacystis than in Chlorella. HLEChlorella had greater ratio of cyclic to non-cyclic than RG Chlorella.
Curves for AATP as a function of light intensity begin with a lag, which maybe the same low intensity lag observed in chloroplast preparations (Fig. 2) (seereview, 7), followed by an increase that saturates between 1 and 4xl03ergs cm*2
sec"1. Most hypotheses advanced to explain this lag involve the filling of a pool,i.e., hydrogen ion gradients across the chloroplast membrane (37) or high energyintermediates (38). Supposedly, photophosphorylation proceeds only when thispool is "filled" (/).
The low-intensity saturation curve was almost insensitive to DCMU at aconcentration (25 /AM) which completely stopped all oxygen evolution by the
at University of Illinois at U
rbana-Cham
paign on July 7, 2010 http://pcp.oxfordjournals.org
Dow
nloaded from

Photophosphorylation in algae 1095
regularly grown (RG) and high light exposed (HLE) Chlorella cells, whereas thesecond level saturation at a 10 times higher intensity was sensitive to the sameconcentration of DCMU. The DCMU lowered the second level to that of thefirst. Therefore, it can be concluded that in Chlorella cells cyclic photophosphory-lation (that goes on in the presence of DCMU) saturates at 10 times lower intensitythan the DCMU sensitive non-cyclic photophosphorylation. This conclusionwould be in agreement with previous data (2, 7, 39, 40) in algae. Also, the secondDCMU sensitive AATP level saturated at the same intensity of red light at whichoxygen evolution saturated in Chlorella (41). These results are opposite to theresults obtained from isolated chloroplasts that had been exposed to white light(/, 28) that show a higher saturation for cyclic than for non-cyclic photophosphory-lation.
Effect of electron acceptor and donors.
The addition of high concentration of methyl viologen to Chlorella causes adramatic increase in J A T P (Table 8; Fig. 3)—this is most likely due to the decreasein ATP utilization by the Calvin cycle as the latter is shut off due to electrons fromsystem I being shunted to methyl viologen instead of to NADP+ (42). Furtheraddition of DCMU stops the non-cyclic flow of electrons and reduces the JATPto the lower level of cyclic photophosphorylation. Addition of DCPIPH2 orPMSH2 to DCMU-treated cells increased JATP because electron flow begins tooperate. Further addition of methyl viologen causes an efficient non-cyclic flowof electrons from DCPIPH2 (or PMSH2) to methyl viologen causing an increasein zlATP. Thus, these results with electron acceptors and donors confirm thatin Chlorella non-cyclic photophosphorylation predominates over cyclic photo-phosphorylation. In contrast, in blue-green algae (Anacystis and Synechococcus)A ATP is more positive in the presence of DCMU than in its absence suggesting thatcyclic photophosphorylation may predominate non-cyclic in these algae.
We are grateful to Dr. Prasanna Mohanty for his help in O2 measurements, to Dr. P. Hamm ofthe Monsanto Chemical Corp., St. Louis, Mo. for a gift of Si3and to Dr. R. Castenholz of the Universityof Oregon at Eugene, for Synechococcus.
References
( 1) Avron, M. and J. Neumann: Photophosphorylation in chloroplasts. Ann. Rev. Plant Physiol.
19: 137-166 (1968).
( 2) Raven, J.: The role of cyclic and pseudocyclic photophosphorylation in photosynthetic 14CO2fixation in Hydrodictyon qfricanum. J. Ex.pt. Bot. 21: 1-16 (1970).
( 3 ) Kandler, O.: Uber die Beziehungen zwischen Phosphathaushalt und Photosynthese. I I . Z.Natar/orsch. 9b: 625-644 (1954).
(4) Strehler, B. and J. Totter: Firefly luminescence in the study of energy transfer mechanisms.I. Substrate and enzyme determination. Arch. Biochem. Biophys. 40: 28-41 (1952).
( 5 ) Oelze-Karow, H. and W. Butler: The development of photophosphorylation and photosynthesisin greening bean leaves. Plant Physiol. 48: 621-625 (1971).
( 6) St. John, J.: Comparative effects of Diuron and Chloropropham on ATP levels in Chlorella.WeedSdence 19: 274-276 (1971).
at University of Illinois at U
rbana-Cham
paign on July 7, 2010 http://pcp.oxfordjournals.org
Dow
nloaded from
1096 G. W. Bedell II and Govindjee
( 7) Urbach, W. and W. Kaiser: Changes of ATP levels in green algae and intact chloroplasts bydifferent photosynthetic reactions. In Proceedings of the Second International Congress on Photo-synthesis Research, Stresa. Edited by G. Forti, M. Avron and A. Melandri. p. 1401-1411(1972).
( 8) Strehler, B.: Firefly luminescence in the study of energy transfer mechanisms. II. Adenosinetriphosphate and photosynthesis. Arch. Biochem. Biophys. 43: 28-41 (1953).
(9) Bassham, J.: Photosynthesis: the path of carbon. In Plant Biochemistry. Edited by J. Bonnerand J . Varner. Academic Press, Inc. New York. p. 875-902 (1965).
(10) Pedersen, T., M. Kirk, and J. Bassham: Light-dark transients in levels of intermediate com-pounds during photosynthesis in air adapted Chlorella. Physiol. Plant. 19: 219-231 (1966).
(11) Kylin, A., I. Sundberg and J. E. Tillberg: Titration with 3-(3,4-dichlorophenyl)-l,l-dimethy-lurea (DCMU) as evidence for several photophosphorylation sites in Scenedesmus. Plant Physiol.47: 376-383 (1972).
(12) Bornefeld, T., J . Domanski and W. Simonis: Influence of light conditions, gassing andinhibitors on photophosphorylation and the ATP-level in Anacystis nidulans. In Proceedings ofthe Second International Congress on Photosynthesis Research, Stresa. p . 1379-1386 (1972).
(13) Lewenstein, A. and R. Bachofen: Transient induced oscillations in the level of ATP in Chlorellafusca. Biochim. Biophys. Ada 267: 80-85 (1972).
(14) Govindjee and E. Rabinowitch: Action spectrum of the "second Emerson effect". Biophys. J.
1: 73-89 (1960).
(15) Sheridan, R.: Photochemical and dark reduction of sulfate and thiosulfate to hydrogen sulfidein Synechococcus Hindus. Ph. D. dissertation. University of Oregon, Eugene (1966).
(16) Emerson, R. and L. Green: Effect of hydrogen-ion concentration on Chlorella photosynthesis.Plant Physiol. 13: 157-168 (1938).
(17) McKinney, G.: Absorption of light by chlorophyll solutions. J. Biol. Chem. 140: 315-322(1941).
(18) Strain, H. and W. Svec: Extraction, separation, estimation, and isolation of the chlorophylls.In The Chlorophylls. Edited by L. P. Vernon and G. R. Seely. Academic Press, Inc. New York,p. 21-66 (1966).
(19) Emerson, R. and R. Chalmers: Transient changes in cellular gas exchange and the problem ofmaximum efficiency of photosynthesis. Plant Physiol. 30: 504-529 (1955).
(20) Bannister, T. and M. Vrooman: Enhancement of the photosynthesis of Chlorella pyrenoidosa asa function of far-red and short-wave illuminations. Plant Physiol. 39: 622-629 (1964).
(21) Bedell, G., I I : Photophosphorylation in intact algae. Ph D. dissertation. University ofIllinois at Urbana-Champaign (1972).
(22) Lyman, G. and J. DeVincenzo: Determination of picogram amounts of ATP using the luciferin-luciferase system. Anal. Biochem. 21: 435-443 (1967).
(23) Gingras, G. and C. Lemasson: A study of the mode of action of 3-(4-Ghlorophenyl)-l,l-di-methylurea on photosynthesis. Biochim. Biophys. Ada 109: 67-78 (1965).
(24) Govindjee, J. Munday, Jr., and G. Papageorgiou: Fluorescence studies with algae: Changeswith time and preillumination. Broohhaven Symp. Biol. 19: 434—445 (1967).
(25) Hoch, G., O. Owens and B. Kok: Photosynthesis and respiration. Arch. Biochem. Biophys. 101:171-180 (1963).
(26) Mohanty, P.: Regulation of chlorophyll fluorescence during photosynthesis: A study of thefactors affecting changes in yield and emission of chlorophyll fluorescence in intact algal cellsand isolated chloroplasts. Doctoral dissertation. University of Illinois at Urbana-Champaign.(1972).
(27) Avron, M.: Photophosphorylation by swiss-chard chloroplasts. Biochim. Biophys. Acta 40:257-272 (1960).
(28) Jagendorf, A and M. Avron: Cofactors and rates of photosynthetic phosphorylation by spinachchloroplasts. J. Biol. Chem. 231: 277-290 (1967).
at University of Illinois at U
rbana-Cham
paign on July 7, 2010 http://pcp.oxfordjournals.org
Dow
nloaded from
Photophosphorylation in algae 1097
(29) Shen, Y. and G. Shen: Studies on photophosphorylation. II. The "light intensity effect"and intermediate steps of photophosphorylation. Sci. Sinica (Peking) 11: 1097-1106 (1962).
(30) Avron, M. and N. Shavit: Inhibitors and uncouplers of photophosphorylation. Biochim.Biophys. Ada 109: 317-331 (1965).
(31) Huijong, F. and E. Slater: The use of oligomycin as an inhibitor of oxidative phosphorylation.J. Biochem. (Tokyo) 49: 493-501 (1961).
(32) Biggins, J.: Respiration in blue-green algae. J. Bad. 99: 570-575. (1969).(33) Lang, N.: The fine structure of blue-green algae. Ann. Rev. Microbiol. 22: 15-46 (1968).(34) Melandry, B., A. Baccarini-Melandri, A. San Pietro, and H. Gest: Interchangeability of
phosphorylation-coupling factors in photosynthetic and respiratory energy conversion. Science174: 514-516 (1971).
(35) Margulis, L.: Origin of eukaryotic cells. Yale Univ. Press, New Haven, p. 349 (1970).(36) Forti, G. and B. Parisi: Evidence for the occurrence of cyclic photophosphorylation in vivo.
Biochim. Biophys. Ada 71: 1-6 (1963).(37) Jagendorf, A. and E. Uribe: Photophosphorylation and the chemiosmotic hypothesis. In:
Energy conversion by the photosynthetic apparatus. Brookhaven Symp. Biol. 19: 215—245 (1967).(35) Sakurai, H., M. Nishimura and A. Takamiya: Studies on photophosphorylation. I. Two-step
excitation kinetics of photophosphorylation. Plant & Cell Physiol. 6: 309-324 (1965).(39) Tanner, W. and O. Kandler: The lack of relationship between cyclic photophosphorylation
and photosynthetic CO» fixation. In Progress in Photosynthesis Research, Tubingen. Edited byH. Metzner. 3: 1217-1223 (1969).
(40) Rensen, J.: Action of some herbicides in photosynthesis of Scenedesmus as studied by their effectson oxygen evolution and cyclic photophosphorylation. Meded. Landbouwhogeschool,Wegeningen. 71-9: 1-80 (1971).
(41) Bonaventura, C. and J. Myers: Fluorescence and oxygen evolution from Chlorella pyrenoidosa.Biochim. Biophys. Ada 189: 366-383 (1969).
(42) Black, C : Chloroplast reactions with dipyridyl salts. Biochim. Biophys. Ada 120: 332-340(1966). at U
niversity of Illinois at Urbana-C
hampaign on July 7, 2010
http://pcp.oxfordjournals.orgD
ownloaded from

at University of Illinois at U
rbana-Cham
paign on July 7, 2010 http://pcp.oxfordjournals.org
Dow
nloaded from


![Friday Night Funkin' Minus (MINUS...3/19/2021 Friday NightFunkin' Minus (MINUS MOM & BF SKINS) [Friday NightFunkin'] [Skin Mods] 2/ 2 Feedback Bugs Support Site](https://img.dokumen.tips/doc/110x75/614011f6e59fcb3c636a4315/friday-night-funkin-minus-minus-3192021-friday-nightfunkin-minus-minus.jpg)