Embed Size (px)
Citation preview
At the cutting edge of skills development
At the cutting edge of skills development

ii
Enquiries: Mabu Raphotle Tel. No.: 011 372 3312 E-mail: [email protected]
01 AUGUST 2019
ATTENTION: Ms Melissa Erra The Director: SETA Support and Learnerships, DHET 123 Francis Baard Street PRETORIA Dear Ms Erra
SUBMISSION OF THE FINAL 2020 – 2025 ETD SECTOR SKILLS PLAN
The Education, Training and Development Practices (ETDP) Sectoral Education and Training Authority
(SETA) is pleased to submit the Sector Skills Plan (SSP) for the period 2020 – 2025. The Sector Skills
Plan has been prepared in accordance with the National Skills Development Plan (NSDP), 2030 as well
as the Sector Skills Plan Framework Requirements, 2019. It has taken into consideration the feedback
received on the first draft of the SSP recently submitted to DHET.
It has also drawn from the lessons learnt in the past strategic period (2015 – 2019) including current
debates around skills development, as well as sector specific and broader national discussions around
the growth and development of the economy. The National Development Plan (NDP) and The
Industrial Policy Action Plan (IPAP), 2018 are the two key mechanisms through which government
intends to stimulate economic growth and development and as such they were given specific
consideration in this SSP. The White Paper for Post School Education and Training (WPPSET) gives
effect to some of the principles outlined in the NDP and provides a roadmap for further development
of the education, training and skills development system. This has also been factored into this SSP.
Whilst the NDP emphasises the importance of science and innovation as the key development and a
change driver across all sectors, the ETDP SETA is prioritizing understanding the impact of the 4th
Industrial Revolution in the ETD sector in order to inform its response and interventions.
Although there are constrains in credible data caused by, among others, the limited number of
constituent employers who submit the workplace plans, this SSP provides the evidence base
presented by individual subsector research conducted, which the ETDP SETA Accounting Authority
will use to guide decision-making; and inform its Strategic, Annual Performance and Operational
plans, to ensure that the needs of the sector are appropriately addressed.
To further strengthen the quality of this SSP, the SETA has engaged and consulted with its
constituencies, governance structures as well as its management.
We look forward to the approval of this ETD SSP for 2020 – 2025.
Yours sincerely
______________________ __________________________
Nombulelo Nxesi Mr Duncan Hindle CEO: ETDP SETA Chairperson: ETDP SETA
iii
Contents A. APPROVAL OF THE ETD SECTOR SKILLS PLAN (2020 – 2025) ...........................................................VI B. FOREWORD .................................................................................................................................. VII C. ACRONYMS ................................................................................................................................. VIII D. EXECUTIVE SUMMARY ..................................................................................................................... X E. RESEARCH PROCESS AND METHODS ........................................................................................... XIV CHAPTER 1: SECTOR PROFILE ........................................................................................................................... 1
Introduction .................................................................................................................. 1 Scope of Coverage ......................................................................................................... 1 Key Role-Players ............................................................................................................ 3 Economic Performance ................................................................................................. 7
1.4.1 Sector Contribution to the Economy ........................................................................... 7 1.4.2 Sector Future Outlook .................................................................................................. 8 1.4.3 Comparison with other Sectors ................................................................................... 9
Employer Profile ............................................................................................................ 9 Labour Market Profile ................................................................................................. 18 Conclusion ................................................................................................................... 24
CHAPTER 2: KEY SKILLS CHANGE DRIVERS ..................................................................................................... 26 2.1 Introduction ................................................................................................................ 26 2.2 Factors affecting skills demand and supply ................................................................. 26
2.2.1 The Move of Early Childhood Development from Social Development to Basic Education ........................................................................................................... 26
2.2.2 Adequate Supply and Professionalization of ETD Workforce .................................... 26 2.2.3 Decline in Union Membership ................................................................................... 27 2.2.4 The Fourth Industrial Revolution ............................................................................... 28 2.2.5 Recognition of Prior Learning (RPL) to enhance opportunities for
employment ....................................................................................................... 28 2.2 Policy frameworks affecting skills demand and supply ............................................... 29 2.3 Conclusion ................................................................................................................... 32 CHAPTER 3: OCCUPATIONAL SHORTAGES AND SKILLS GAPS .......................................................................... 34 3.1 Introduction ................................................................................................................ 34 3.2 Sectoral Occupational Demand ................................................................................... 34 3.3 Extent and Nature of Supply ....................................................................................... 37
3.3.2 Supply Problems ........................................................................................................ 43 3.4 Sectoral Priority Occupations and Interventions (PIVOTAL List) ................................. 45
3.4.2 Envisaged Outcomes .......................................................................................... 46 3.5 Conclusion ................................................................................................................... 46 CHAPTER 4: SECTOR PARTNERSHIPS .............................................................................................................. 47 4.1 Introduction ................................................................................................................ 47 4.2 Existing Partnerships ................................................................................................... 47
4.2.1 Project Partnerships Model ............................................................................... 47 4.2.2 Problem-Oriented Partnerships Model .............................................................. 48 4.2.3 Programme-Delivery Partnerships Model.......................................................... 49
4.3 Proposed New Partnerships ........................................................................................ 49 4.4 Conclusion ................................................................................................................... 50 CHAPTER 5: SETA MONITORING AND EVALUATION ....................................................................................... 51 5.1 Introduction and Background ..................................................................................... 51 5.2 ETDP SETA APPROACH TO M&E .................................................................................. 51
5.2.1 Monitoring of Programmes and Projects ........................................................... 52 5.2.2 Quarterly and Annual Reporting ........................................................................ 52 5.2.3 Evaluation Studies .............................................................................................. 53
5.3 A Reflection on SETA Performance ............................................................................. 53 5.4 Action Plan and Conclusion ......................................................................................... 54 CHAPTER 6: STRATEGIC SKILLS PRIORITY ACTIONS ........................................................................................ 56 6.1 Introduction ................................................................................................................ 56 6.3 Recommended priority Actions................................................................................... 59
iv
6.3.1 Skills Priorities for the Sector ............................................................................. 59 6.3.2 Measures to Support National Strategies .................................................................. 61
6.4 Conclusion ................................................................................................................... 63 REFERENCES .................................................................................................................................................. 64
LIST OF TABLES Table 1: Research Conducted per Constituency ................................................................................................................. xvi Table 2: Standard Industrial Classification (SIC 7 Coder Covered by the ETDP SETA) .......................................................... 1 Table 3: Key Role Players and their Roles in the ETD Sector ................................................................................................ 4 Table 4: Basic Education and PSET Sub-systems Budget Allocations in South Africa, 2014/15 – 2018/19 .......................... 8 Table 5: ETD Expenditure compared to other sectors – 2012 – 2017 .................................................................................. 9 Table 6: Number of Employers in the ETD Sector ................................................................................................................. 9 Table 7:Number of Public and Independent Schools in South Africa, 2014-2018 .............................................................. 11 Table 8: Number of Public and Independent school learners in South Africa, 2014- 2018 ................................................ 11 Table 9: Number of Public TVET Colleges and Student Enrolment in South Africa ............................................................ 12 Table 10: Types of universities, sizes and program offerings ............................................................................................. 13 Table 11: Number of Registered NGOs focusing on Education .......................................................................................... 14 Table 12: List of NRF-Recognized Research Institutions ..................................................................................................... 15 Table 13: Statutory Bodies, their focus and applicable legislation ..................................................................................... 17 Table 14: Number of Public and Independent Educators in Ordinary Schools, 2014-2018 ............................................... 19 Table 15: Public School Educators by Gender and Race per Province ................................................................................ 19 Table 16: Employee Composition at TVET Colleges by Category and Gender, 2016 .......................................................... 21 Table 17: Number of permanent staff in public HEIs, by population group, gender and personnel categories, 2017 ...... 21 Table 18: Provincial Breakdown of Education NGOs, 2016 ................................................................................................ 22 Table 19: Trade Union Employer Summary ........................................................................................................................ 23 Table 20: National Strategies and Implications for Skills Development in ETD Sector ....................................................... 29 Table 21: Hard-To-Fill-Vacancy List ..................................................................................................................................... 34 Table 22: List of Skills Gaps against Major Occupations in the ETD Sector ........................................................................ 36 Table 23: Provincial spread of Learners, lecturers and CLCs, 2016, 2017 .......................................................................... 39 Table 24: Qualification Status of TVET Lecturers ................................................................................................................ 41 Table 25: HEIs offering Library and Information Science Programmes .............................................................................. 42 Table 26: HEIs offering Archival Programmes .................................................................................................................... 42 Table 27: Total enrolments in the PSET System, 2012 -2016 ............................................................................................. 44 Table 28: Total graduations/completions in the PSET System, 2012 -2016 ....................................................................... 44 Table 29: Existing Project Partnerships ............................................................................................................................... 47 Table 30: Existing Problem-Oriented Partnerships ............................................................................................................. 48 Table 31: Existing Programme-Delivery Partnerships Model ............................................................................................. 49 Table 32: Proposed and planned Partnerships ................................................................................................................... 50 Table 33: Linkage between SSP, SP, APP and performance ................................................................................................ 54 Table 34: Medium-Term Interventions for ETD Subsectors ............................................................................................... 60 Table 35: Measures to Support National Strategies ........................................................................................................... 61

v
LIST OF FIGURES
Figure 1: ETDP SETA Subsector Skills Planning Research Methodology .............................................................................. xv Figure 2:Inflation adjusted spending trends (in percentage) of education departments: 2013/14 to 2018/19 (f) ............. 8 Figure 3: Spread and Location of Public HEIs (n=26) .......................................................................................................... 13 Figure 4: Number of Library Institutions according to Category (n=11 374) ...................................................................... 15 Figure 5: Archives and Record Service of South Africa ....................................................................................................... 15 Figure 6: Number of Registered Political Parties, 2019 ...................................................................................................... 16 Figure 7: Gender of Staff by job title .................................................................................................................................. 18 Figure 8: Age profile of Grade R educators ......................................................................................................................... 18 Figure 9: Age range of educators ........................................................................................................................................ 19 Figure 10: Number of Seats in National Assembly per Political Party (IEC, 2019) .............................................................. 24
vi
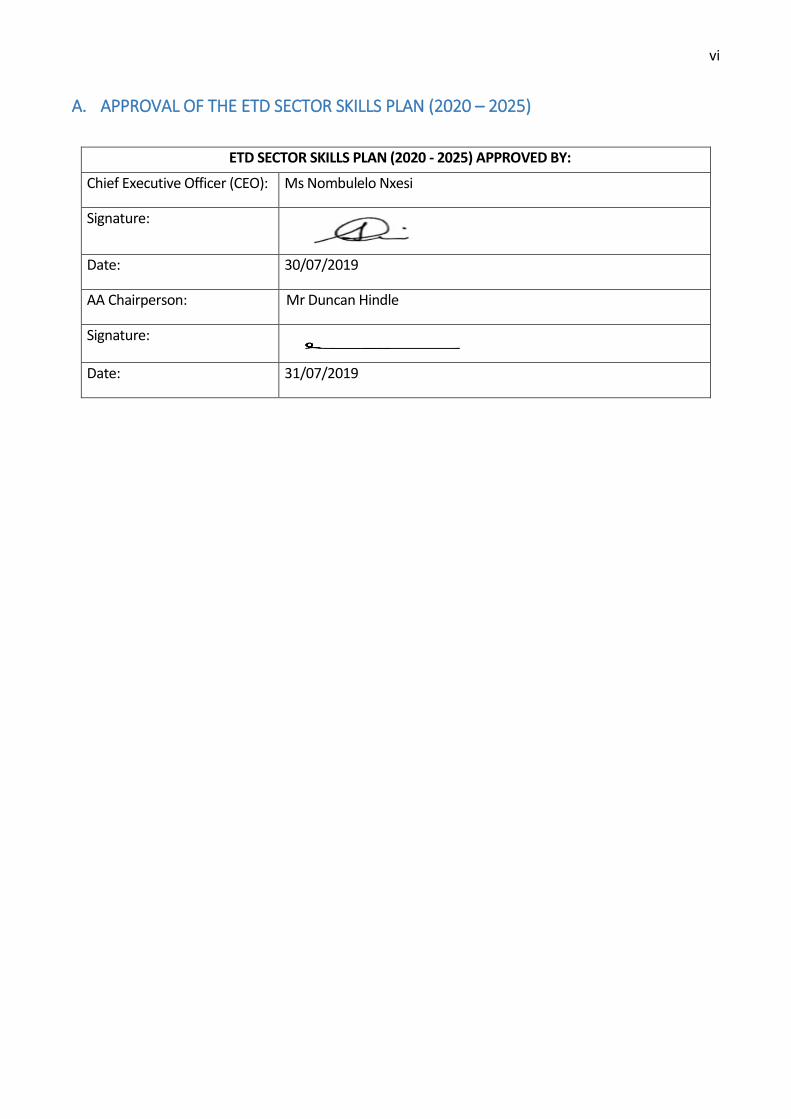
A. APPROVAL OF THE ETD SECTOR SKILLS PLAN (2020 – 2025)
ETD SECTOR SKILLS PLAN (2020 - 2025) APPROVED BY:
Chief Executive Officer (CEO): Ms Nombulelo Nxesi
Signature:
Date: 30/07/2019
AA Chairperson: Mr Duncan Hindle
Signature:
Date: 31/07/2019
vii
B. FOREWORD
This ETD Sector Skills Plans (SSP) for the period 2020 - 2025 marks a road map and the strategic overview
of the sector profile and it outlines the key skills change drivers, occupational shortage and skills gaps,
enabling partnerships and the strategic skills priority actions required within and across each of the 14
subsectors that the ETDP SETA is responsible for. As a new chapter 5 of the SSP, the Monitoring and
Evaluation (M&E) has been included to indicate SETA’s approach to M&E as well as mechanisms that
can be harnessed to assure achievement of the strategic skills priorities. It is accompanied by the
updated Continuous Improvement Plan (CIP), Executive Summary and the Top 10 Sectoral Priority
Occupations and Interventions (PIVOTAL List).
Its purpose is to align the ETD sector with key legislation and government policy imperatives that impact
on the sector including the newly gazetted National Skills Development Plan (NSDP) 2030, National
Development Plan (NDP) 2030, White Paper for Post School Education and Training 2013, New Growth
Path Framework (NGPF), Human Resource Development Strategy for South Africa 2010-2030 (HRDS-
SA), as well as Industrial Policy Action Plan (IPAP) 2018.
This SSP is a valuable tool for ETDP SETA stakeholders and a useful source of information for ETD service
providers, government officials, employers, unions, policy makers, SETA staff and the broader
community. It also provides the evidence-based information within which the SETA’s Accounting
Authority uses to guide decision-making; and informs its plans including the Strategic and Annual
Performance Plans.
The ETDP SETA hopes that this comprehensive SSP will contribute to the enhancement of the goals of a
developmental state and the strengthening of education and training in the ETD sector and the country
at large by consistently addressing the transformational imperatives. We continue to be grateful to our
stakeholders and key role players, especially from all our constituencies which form part of the ETDP
SETA, as well as research partners.
The Accounting Authority and the management of the ETDP SETA remains confident that the
achievement of goals set out in this SSP will be a positive contribution towards the aspirations of the
new NSDP specifically and Skills Development Act No. 97 of 1998 (as amended) in general.
MR DUNCAN HINDLE
CHAIRPERSON OF THE ETDP SETA
viii
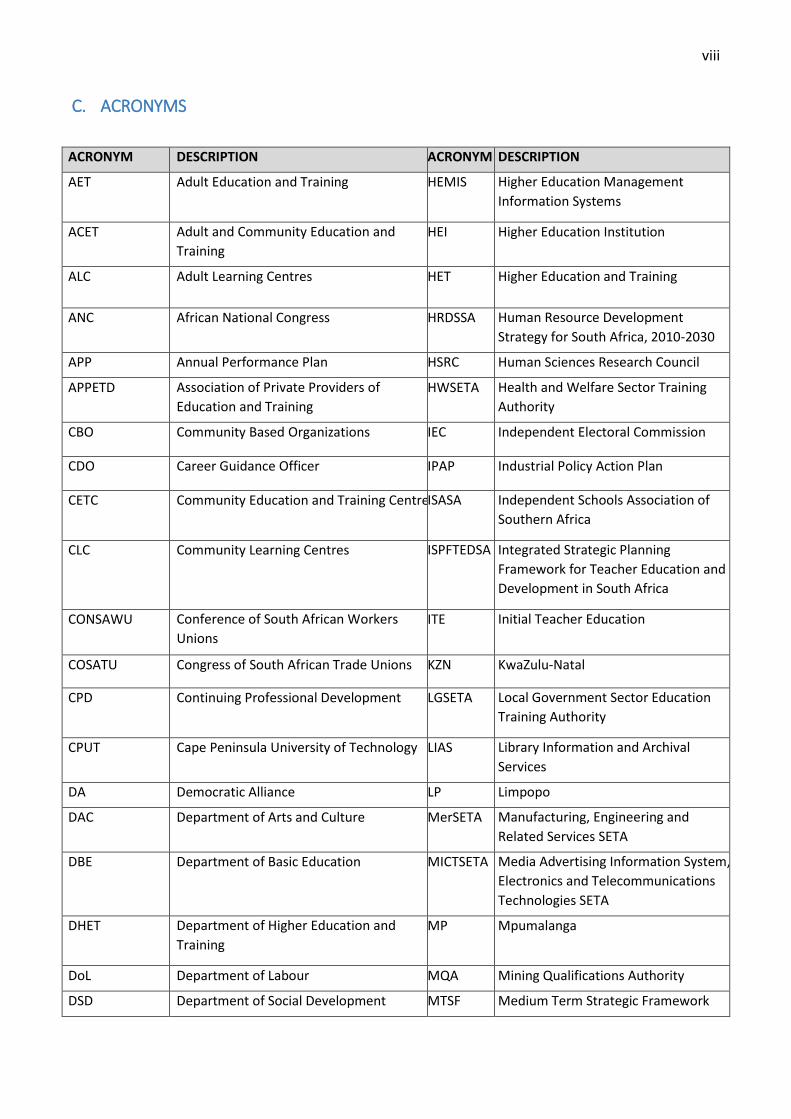
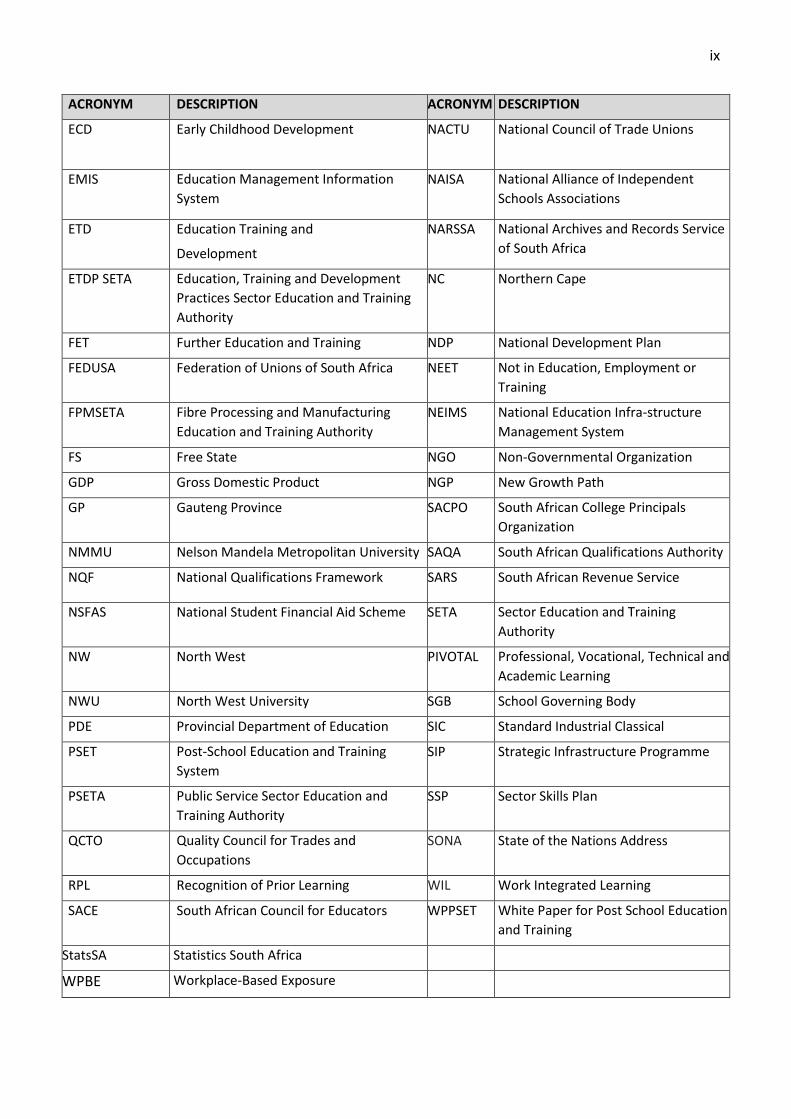
C. ACRONYMS
ACRONYM DESCRIPTION ACRONYM DESCRIPTION
AET
Adult Education and Training HEMIS Higher Education Management
Information Systems
ACET Adult and Community Education and
Training
HEI Higher Education Institution
ALC Adult Learning Centres HET Higher Education and Training
ANC African National Congress HRDSSA Human Resource Development
Strategy for South Africa, 2010-2030
APP Annual Performance Plan HSRC Human Sciences Research Council
APPETD Association of Private Providers of
Education and Training
HWSETA Health and Welfare Sector Training
Authority
CBO Community Based Organizations IEC Independent Electoral Commission
CDO Career Guidance Officer IPAP Industrial Policy Action Plan
CETC
Community Education and Training Centre ISASA Independent Schools Association of
Southern Africa
CLC Community Learning Centres ISPFTEDSA Integrated Strategic Planning
Framework for Teacher Education and
Development in South Africa
CONSAWU Conference of South African Workers
Unions
ITE Initial Teacher Education
COSATU Congress of South African Trade Unions KZN KwaZulu-Natal
CPD Continuing Professional Development LGSETA Local Government Sector Education
Training Authority
CPUT Cape Peninsula University of Technology LIAS Library Information and Archival
Services
DA Democratic Alliance LP Limpopo
DAC Department of Arts and Culture MerSETA Manufacturing, Engineering and
Related Services SETA
DBE Department of Basic Education MICTSETA Media Advertising Information System,
Electronics and Telecommunications
Technologies SETA
DHET
Department of Higher Education and
Training
MP Mpumalanga
DoL Department of Labour MQA Mining Qualifications Authority
DSD Department of Social Development MTSF Medium Term Strategic Framework
ix
ACRONYM DESCRIPTION ACRONYM DESCRIPTION
ECD Early Childhood Development NACTU
National Council of Trade Unions
EMIS Education Management Information
System
NAISA
National Alliance of Independent
Schools Associations
ETD Education Training and
Development
NARSSA National Archives and Records Service
of South Africa
ETDP SETA Education, Training and Development
Practices Sector Education and Training
Authority
NC
Northern Cape
FET Further Education and Training NDP National Development Plan
FEDUSA Federation of Unions of South Africa NEET Not in Education, Employment or
Training
FPMSETA Fibre Processing and Manufacturing
Education and Training Authority
NEIMS National Education Infra-structure
Management System
FS Free State NGO Non-Governmental Organization
GDP Gross Domestic Product NGP New Growth Path
GP Gauteng Province SACPO South African College Principals
Organization
NMMU Nelson Mandela Metropolitan University SAQA South African Qualifications Authority
NQF National Qualifications Framework SARS South African Revenue Service
NSFAS National Student Financial Aid Scheme SETA Sector Education and Training
Authority
NW North West PIVOTAL Professional, Vocational, Technical and
Academic Learning
NWU North West University SGB School Governing Body
PDE Provincial Department of Education SIC Standard Industrial Classical
PSET Post-School Education and Training
System
SIP Strategic Infrastructure Programme
PSETA Public Service Sector Education and
Training Authority
SSP Sector Skills Plan
QCTO Quality Council for Trades and
Occupations
SONA State of the Nations Address
RPL Recognition of Prior Learning WIL Work Integrated Learning
SACE South African Council for Educators WPPSET White Paper for Post School Education
and Training
StatsSA Statistics South Africa
WPBE Workplace-Based Exposure
x
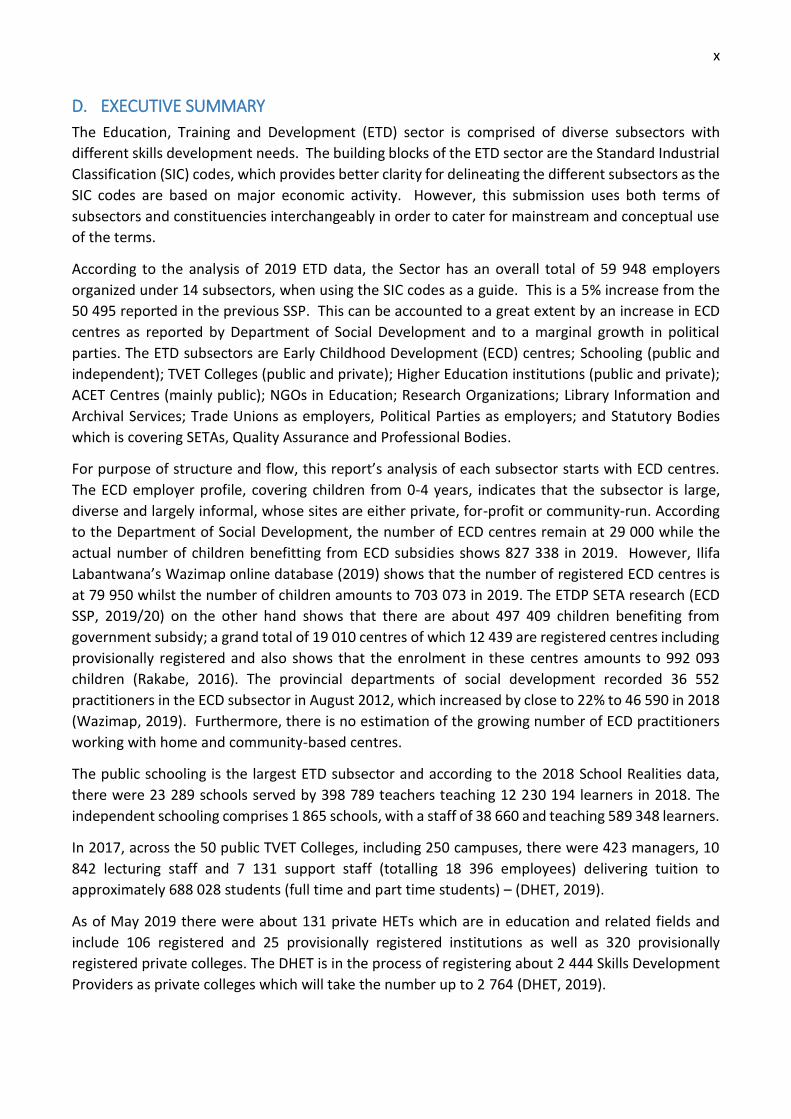
D. EXECUTIVE SUMMARY
The Education, Training and Development (ETD) sector is comprised of diverse subsectors with
different skills development needs. The building blocks of the ETD sector are the Standard Industrial
Classification (SIC) codes, which provides better clarity for delineating the different subsectors as the
SIC codes are based on major economic activity. However, this submission uses both terms of
subsectors and constituencies interchangeably in order to cater for mainstream and conceptual use
of the terms.
According to the analysis of 2019 ETD data, the Sector has an overall total of 59 948 employers
organized under 14 subsectors, when using the SIC codes as a guide. This is a 5% increase from the
50 495 reported in the previous SSP. This can be accounted to a great extent by an increase in ECD
centres as reported by Department of Social Development and to a marginal growth in political
parties. The ETD subsectors are Early Childhood Development (ECD) centres; Schooling (public and
independent); TVET Colleges (public and private); Higher Education institutions (public and private);
ACET Centres (mainly public); NGOs in Education; Research Organizations; Library Information and
Archival Services; Trade Unions as employers, Political Parties as employers; and Statutory Bodies
which is covering SETAs, Quality Assurance and Professional Bodies.
For purpose of structure and flow, this report’s analysis of each subsector starts with ECD centres.
The ECD employer profile, covering children from 0-4 years, indicates that the subsector is large,
diverse and largely informal, whose sites are either private, for-profit or community-run. According
to the Department of Social Development, the number of ECD centres remain at 29 000 while the
actual number of children benefitting from ECD subsidies shows 827 338 in 2019. However, Ilifa
Labantwana’s Wazimap online database (2019) shows that the number of registered ECD centres is
at 79 950 whilst the number of children amounts to 703 073 in 2019. The ETDP SETA research (ECD
SSP, 2019/20) on the other hand shows that there are about 497 409 children benefiting from
government subsidy; a grand total of 19 010 centres of which 12 439 are registered centres including
provisionally registered and also shows that the enrolment in these centres amounts to 992 093
children (Rakabe, 2016). The provincial departments of social development recorded 36 552
practitioners in the ECD subsector in August 2012, which increased by close to 22% to 46 590 in 2018
(Wazimap, 2019). Furthermore, there is no estimation of the growing number of ECD practitioners
working with home and community-based centres.
The public schooling is the largest ETD subsector and according to the 2018 School Realities data,
there were 23 289 schools served by 398 789 teachers teaching 12 230 194 learners in 2018. The
independent schooling comprises 1 865 schools, with a staff of 38 660 and teaching 589 348 learners.
In 2017, across the 50 public TVET Colleges, including 250 campuses, there were 423 managers, 10
842 lecturing staff and 7 131 support staff (totalling 18 396 employees) delivering tuition to
approximately 688 028 students (full time and part time students) – (DHET, 2019).
As of May 2019 there were about 131 private HETs which are in education and related fields and
include 106 registered and 25 provisionally registered institutions as well as 320 provisionally
registered private colleges. The DHET is in the process of registering about 2 444 Skills Development
Providers as private colleges which will take the number up to 2 764 (DHET, 2019).
xi
There are currently 26 public HEIs, which comprise “traditional universities” (eleven);
“comprehensive universities” (nine) and “universities of technology” (six). According to the DHET
2016 Statistics on Post School Education and Training (PSET), released in May 2019, there were 61
242 permanent staff employed in public higher education institutions which serviced 1 036 984 full-
time equivalent students (DHET, 2019).
The institutional profile of the ACET subsector covers both public and private adult learning centres.
In the public sector, the public adult learning centres (PALCs) are now known as Community Learning
Centres (CLCs), which are learning sites linked to the nine newly established institutions referred to
as Community Colleges which fall under the ambit of DHET. There was a combined total of 3 276
CLCs and Private ALCs in 2014 according to DHET’s National Plan of CET College system statistics. This
total includes 3 214 CLCs and 62 Private ALCs registered with the DHET (DHET, 2019a, p.3).
The database of the DSD (2019) shows that there are 85 248 registered NGOs in South Africa, of
which over 9 987 (average 11, 72%) focus on higher education, adult education and training,
vocational and technical schools, elementary, primary and secondary education as well as research.
Research underway to determine the labour profile in the subsector.
Research organizations focusing on education include science councils, non-governmental
organizations, higher education institutions, government sector and the business enterprise sector.
The profile of research organizations that pay levies to the ETDP SETA is limited and currently reflects
comprehensive data for 19 employers and these organizations employ over 2 500 employees.
The Library Information and Archival Services subsector is divided into two. According to the 2014
LIS Transformation Charter, the Library Information Services (LIS) includes six broad categories of
libraries namely the national libraries, public libraries, academic/University libraries (including TVET
Colleges and Research Councils), school libraries, special libraries (including the Library of Parliament
and Legal Deposit Centres), and Thusong Service Centres. Like LIS, the Archival Services has different
categories of organizations according to statutory collection, preservation and service delivery
responsibilities. The DAC & NCLIS (2015) indicates, South Africa has more than 11 374 libraries,
comprising 77 Higher Education libraries, 9 416 school libraries, 79 government
departmental libraries, one national library with two branches, SA library for the blind, and 1800
public libraries provided by provincial governments. The Archival Services is made up of the National
Archives and Records Service of South Africa (NARSSA), 9 provincial archives and records
management services and various councils and committees established to advise these services.
According to SEIFSA (20190, the Trade Union subsector has 253 unions. There are five main
Federations namely; Confederation of South African Workers Unions (CONSAWU), Congress of South
African Trade Unions (COSATU), Federation of Unions of South Africa (FEDUSA), the National Council
of Trade Unions (NACTU) and South African Federation of Trade Unions (SAFTU).
The Independent Electoral Commission (IEC) 2019 political parties’ register show that there are 606
registered political parties in South Africa, 265 of which operate at a national level whilst 341 are
regional parties. There are only 14 political parties represented in the national assembly with the
African National Congress (ANC) and Democratic Alliance (DA) considered to be the 2 largest with
over 150 employees each.

xii
The ETD sector is still grappling with issues of transformation across educational settings; quality of
learning programmes to meet changing needs; coordinating supply of teachers, practitioners and
lecturers to address gaps in specialisations; increasing the use of technology to enhance teaching and
learning as well as professionalizing the educator workforce. In order to address these issues the
Education, Training and Development Practices (ETDP) Sector Education Training Authority (SETA)’s
5 year Strategic Plan should be based on plans to achieve targets set out in the National Skills
Development Plan 2030, Medium Term Strategic Framework (MTSF) [2014-19]; New Growth Path
(NGP) Framework; National Development Plan (NDP) [Vision 2030]; Human Resources Development
Strategy (HRDS) 2010-2030; White Paper for Post-School Education and Training (PSET) [2013];
Integrated Strategic Planning Framework for Teacher Education in South Africa (ISPFTESA) [2011-
2025]; Strategic Infrastructure Programmes (SIPs), National Youth Policy (2014-2019) and Industrial
Policy Action Plan (IPAP) 2018.
Chapter 3 of this submission is about “Occupational Shortages and Skills Gaps” according to the
Updated DHET SSP Framework Requirements 2019. In this chapter, the document has analysed each
subsector according to three main sub-sections namely; Sectoral Occupational Demand; extent and
nature of supply and the Sectoral Priority Occupations and Interventions (PIVOTAL List). The analyses
of these sections show how the Hard-To-Fill-Vacancies occur in the ETD sector and the supply
pipelines of practitioners, teachers, lecturers, and researchers in particular subjects, phases and
levels across different geographical locations as well as varied employment conditions.
The analysis of the extent and nature of supply shows three aspects of supply; the supply of training
providers, both nationally and provincially; the supply of training/learning programmes and the
supply of occupational skills. While the ETD sector is fairly adequately supplied with training and
education providers mainly due to the fact that the sector is largely made up of education providers,
there is a shortage of customised, high impact, and fit-for-purpose learning programmes across
subsectors. The supply of occupational skills is varied but all subsectors show a shortage of priority
skills in varying degrees.
There is a specific focus on partnerships by the ETDP SETA, which is emanating from the analysis of
the SETA’s annual reports, indicating some partnerships are successful whilst others have not borne
any tangible results as yet. There are proposed partnerships planned to achieve the ETDP SETA
Annual Performance Plan (APP) targets, such as partnerships with TVET Colleges, DBE and DHET,
universities, associations in the ETD etc.
The newly introduced chapter 5 on Monitoring and Evaluation (M&E) indicated the SETA’s approach
to M&E as well as mechanisms that can be harnessed to ensure the achievement of the strategic
skills priorities and raised, among others the following:
Conduct an impact assessment to scientifically determine how far the SETA has achieved its
strategic outcomes oriented goals.
Conduct an implementation analysis or process evaluations to determine the causes to late
implementation of programmes and learner drop-outs as articulated in the annual reports.
Management responses to all recommendations that emanate from previous and future
evaluation studies conducted and these must ensure that continuous improvement plans are
developed to action each of the recommendations.

xiii
In responding to the skills development needs identified above, Chapter 6 proposes interventions for
the ETDP SETA. These various interventions proposed seek to address skills development needs
informed by the analysis of Chapters 1, 2, 3,4 and 5. The interventions fall into three broad themes
namely; ensuring quality teaching and learning in schools, TVET Colleges and HEIs through improving
the performance of teachers, practitioners and lecturers across the different contexts; ensuring
effective and efficient service delivery in public and private educational institutions through
improving administration, management, leadership, governance as well as research capacity to
support teaching and training professionals; and supporting transformation of the Post-Schooling,
Education and Training sector by supporting and increasing capacity in public and private PSET
entities where skills capacity is affected by increased access, success and progression within and
across public and private institutions and SETAs. These interventions are intended to inform the
direction of the Strategic Plan and programmes outlined in the Annual Performance Plan with the
aim of efficient and effective delivery of skills development mandate by the SETA.
xiv
E. RESEARCH PROCESS AND METHODS
The key question that this 2020 - 2025 SSP development seeks to answer is; what are skills priorities for
each of the ETDP SETA’s 14 subsectors in order to recommend skills priority actions for ETD sector? In
order to answer this question comprehensively, the approach is to follow the DHET’s updated SSP
Framework and Guidelines.
Furthermore, the ETDP SETA conducts subsector skills planning research which seek to investigate
nuanced skills issues and ultimately contributes to the development of the ETD SSP, using both
qualitative and quantitative, research methods.
The main reason for choosing a mixed method approach is that it enables a comprehensive approach
on investigating and validating skills planning information relating to key skills issues and skills priorities
for the following 14 subsectors: Early Childhood Development; Schooling (Provincial Departments of
Education, Independent and Public Schools); TVET colleges; Public Higher Education and Training; Public
and Private Adult Community Education and Training (ACET); Library and Archival Services; Non-
Governmental Organizations (NGOs); Research Organizations; Trade Unions and Political Parties both as
Employers as well as Statutory Bodies (comprised of Quality Assurance and Professional Bodies as well
as SETAs).
A mixed method research approach is used in the design of the following key research components
which feed into the development of the consolidated ETD SSP:
Analysis of Annexure 2 Work Skills Plans and Reports (WSPR) data of 2019 compared to 2018 submissions. Subsector Skills Planning research conducted in 2018 and 2019 to inform this submission are: TVET Colleges, Statutory Bodies, Independent Schooling and SGBs, Private FETs and HETs, Public HEIs, NGOs, Trade Unions and further influenced by the latest data of the research that is currently underway: Research Organizations, ECD, Schooling, Libraries and Archival Services. In these research, as indicated in Figure 1-0 below, surveys, interviews and focus groups were employed to collect and also validate data. For the other subsectors, the approach was to conduct primary/direct search of information relating to these constituencies and validated it through consultations such as focus groups, individual interviews and using questionnaires on key informants in the sector. Analysis of Annexure 2 WSPR Data
This submission has analysed the Hard-to-Fill Vacancies and Skills Gaps within the ETD sector based on
the Annexure 2 WSPR submissions of 2019. The Annexure 2 WSPR data requires quality checks and
triangulation with subsector reports and interviews of various constituent employers to strengthen its
reliability. Such data is also used to compile the ETDP SETA’s Scarce and Critical Skills Guide and Sectoral
Priority Occupations and Interventions (PIVOTAL) list.
Subsector Skills Planning Research
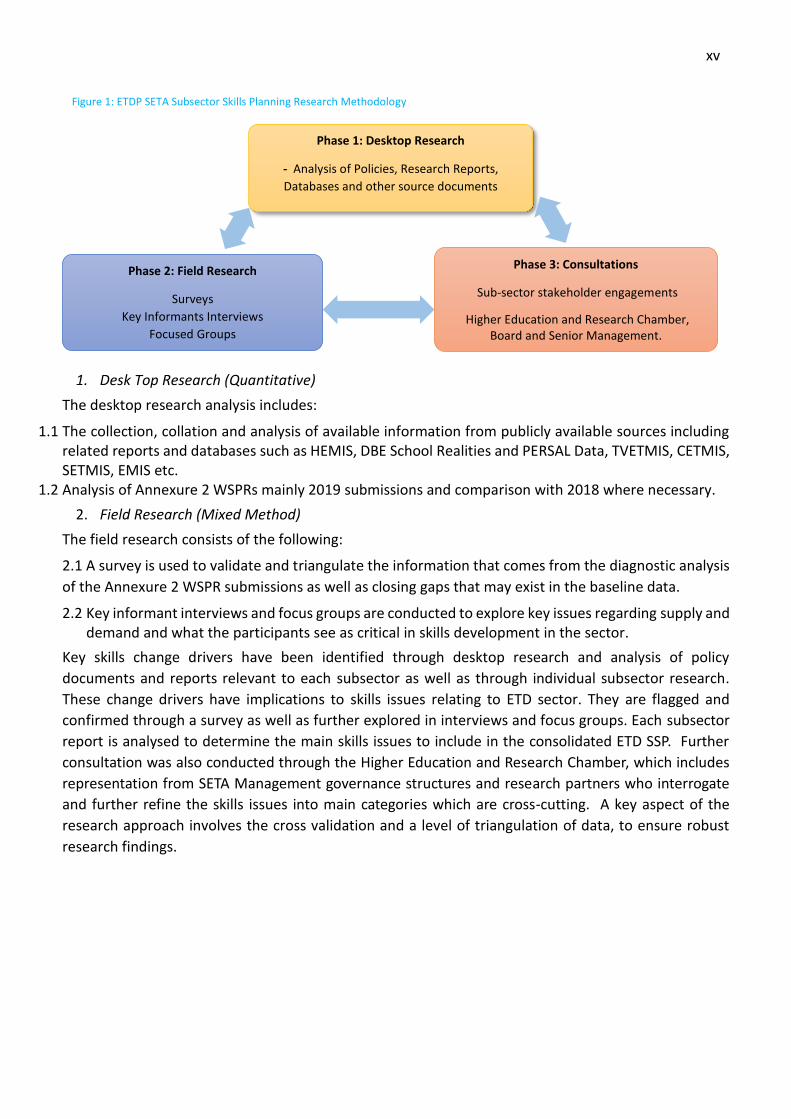
The subsector research comprises both quantitative and qualitative methodologies which incorporates
a two-pronged strategy of desktop and field research as captured in Figure 1-0 below.
xv
Figure 1: ETDP SETA Subsector Skills Planning Research Methodology
1. Desk Top Research (Quantitative)
The desktop research analysis includes:
1.1 The collection, collation and analysis of available information from publicly available sources including related reports and databases such as HEMIS, DBE School Realities and PERSAL Data, TVETMIS, CETMIS, SETMIS, EMIS etc.
1.2 Analysis of Annexure 2 WSPRs mainly 2019 submissions and comparison with 2018 where necessary.
2. Field Research (Mixed Method)
The field research consists of the following:
2.1 A survey is used to validate and triangulate the information that comes from the diagnostic analysis
of the Annexure 2 WSPR submissions as well as closing gaps that may exist in the baseline data.
2.2 Key informant interviews and focus groups are conducted to explore key issues regarding supply and demand and what the participants see as critical in skills development in the sector.
Key skills change drivers have been identified through desktop research and analysis of policy
documents and reports relevant to each subsector as well as through individual subsector research.
These change drivers have implications to skills issues relating to ETD sector. They are flagged and
confirmed through a survey as well as further explored in interviews and focus groups. Each subsector
report is analysed to determine the main skills issues to include in the consolidated ETD SSP. Further
consultation was also conducted through the Higher Education and Research Chamber, which includes
representation from SETA Management governance structures and research partners who interrogate
and further refine the skills issues into main categories which are cross-cutting. A key aspect of the
research approach involves the cross validation and a level of triangulation of data, to ensure robust
research findings.
Phase 1: Desktop Research
- Analysis of Policies, Research Reports,
Databases and other source documents
Phase 3: Consultations
Sub-sector stakeholder engagements
Higher Education and Research Chamber, Board and Senior Management.
Phase 2: Field Research
Surveys
Key Informants Interviews
Focused Groups
xvi
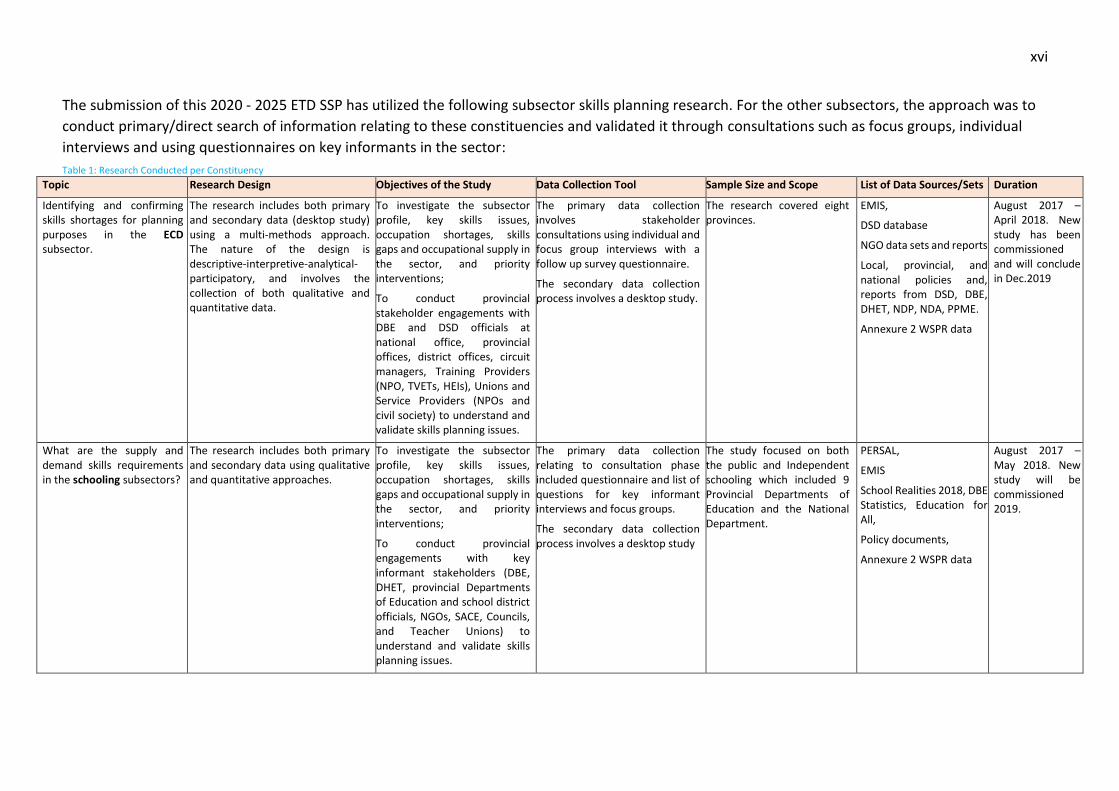
The submission of this 2020 - 2025 ETD SSP has utilized the following subsector skills planning research. For the other subsectors, the approach was to
conduct primary/direct search of information relating to these constituencies and validated it through consultations such as focus groups, individual
interviews and using questionnaires on key informants in the sector:
Table 1: Research Conducted per Constituency
Topic Research Design Objectives of the Study Data Collection Tool Sample Size and Scope List of Data Sources/Sets Duration
Identifying and confirming skills shortages for planning purposes in the ECD subsector.
The research includes both primary and secondary data (desktop study) using a multi-methods approach. The nature of the design is descriptive-interpretive-analytical-participatory, and involves the collection of both qualitative and quantitative data.
To investigate the subsector profile, key skills issues, occupation shortages, skills gaps and occupational supply in the sector, and priority interventions;
To conduct provincial stakeholder engagements with DBE and DSD officials at national office, provincial offices, district offices, circuit managers, Training Providers (NPO, TVETs, HEIs), Unions and Service Providers (NPOs and civil society) to understand and validate skills planning issues.
The primary data collection involves stakeholder consultations using individual and focus group interviews with a follow up survey questionnaire.
The secondary data collection process involves a desktop study.
The research covered eight provinces.
EMIS,
DSD database
NGO data sets and reports
Local, provincial, and national policies and, reports from DSD, DBE, DHET, NDP, NDA, PPME.
Annexure 2 WSPR data
August 2017 – April 2018. New study has been commissioned and will conclude in Dec.2019
What are the supply and demand skills requirements in the schooling subsectors?
The research includes both primary and secondary data using qualitative and quantitative approaches.
To investigate the subsector profile, key skills issues, occupation shortages, skills gaps and occupational supply in the sector, and priority interventions;
To conduct provincial engagements with key informant stakeholders (DBE, DHET, provincial Departments of Education and school district officials, NGOs, SACE, Councils, and Teacher Unions) to understand and validate skills planning issues.
The primary data collection relating to consultation phase included questionnaire and list of questions for key informant interviews and focus groups.
The secondary data collection process involves a desktop study
The study focused on both the public and Independent schooling which included 9 Provincial Departments of Education and the National Department.
PERSAL,
EMIS
School Realities 2018, DBE Statistics, Education for All,
Policy documents,
Annexure 2 WSPR data
August 2017 – May 2018. New study will be commissioned 2019.

xvii
Technical and Vocational Teachers in South Africa: scope, scale and preparation.
The research includes both primary and secondary data using both qualitative and quantitative approaches to cross-check data.
To investigate the subsector profile, key skills issues, occupation shortages, skills gaps and occupational supply in the sector, and priority interventions;
To understand and confirm skills priorities in the TVET sector.
The survey, through the administration of questionnaires, as well as undertaking key informant interviews (telephonic and face-to-face) and focus groups were conducted.
WSPR templates
The 2017 DHET data released in 2019, together with the 2016 data forms the basis for the official statistics reported in this project WSPR data of both 2018 & 2019 from 50 TVET Colleges.
HEMIS
Annexure 2 WSPR data
DHET survey data and reports
March 2017 – May 2018
The size, scope and skills need of the NGO as the subsector of the ETD.
The research includes both primary search of information using document analysis approach of various sources such as DSD Database and other reports, 2019 WSPR data and secondary (quantitative) data using questionnaires and focus groups with key informants (qualitative data).
To investigate the subsector profile, key skills issues, occupation shortages, skills gaps and occupational supply in the sector, and priority interventions.
The survey, through the administration of questionnaires, as well as undertaking key informant interviews (telephonic and face-to-face).
WSPR templates
NGOs (Education) focus groups covering all provinces.
Different sets of databases were used to conduct a primary search of information and document analysis.
DSD Database
WSPR 2019 data
Jan. 2019 - ongoing
Confirming the demand and supply of skills based on needs identified in the Higher Education Institutions.
The research includes both primary search of information using document analysis approach of various sources such as HEMIS database, DHET and other legislative documents, 2019 WSPR data and secondary (quantitative) data using questionnaires and focus groups [e.g. Higher Education and Research Organizations (HER) SETA Chamber, SSP Reference Group] with key informants (qualitative data).
To investigate the subsector profile, key skills issues, occupation shortages, skills gaps and occupational supply in the sector, and priority interventions.
The survey, through the administration of questionnaires, as well as undertaking key informant interviews (telephonic and face-to-face).
WSPR templates
SETA HER Chamber members SETA Management and Governance, Higher Education Institutions, Labour. SSP Reference Group members.
26 WSPR data for 2019 submissions.
Databases (HEMIS), research reports, legislative documents and WSPR 2019 data.
Jan. 2019 - ongoing
Adult Community Education and Training in South Africa
The research includes both primary search of information using document analysis approach of various sources such as HEMIS database, DHET and other legislative documents, 2019 WSPR data and
To investigate the subsector profile, key skills issues, occupation shortages, skills gaps and occupational supply in the sector, and priority interventions.
The survey, through the administration of questionnaires, as well as undertaking key informant interviews (telephonic and face-to-face).
SETA AET/ECD Chamber members representing SETA Management and Governance, Higher Education Institutions,
Databases (HEMIS), research reports, legislative documents and WSPR 2017 data from ETDP SETA.
March - June
2019
xviii
secondary (quantitative) data using questionnaires and focus groups (AET/ECD SETA Chamber, SSP Reference Group) with key informants (qualitative data).
WSPR templates
Labour. SSP Reference Group members.
21 AET WSPR data for 2019 submission.
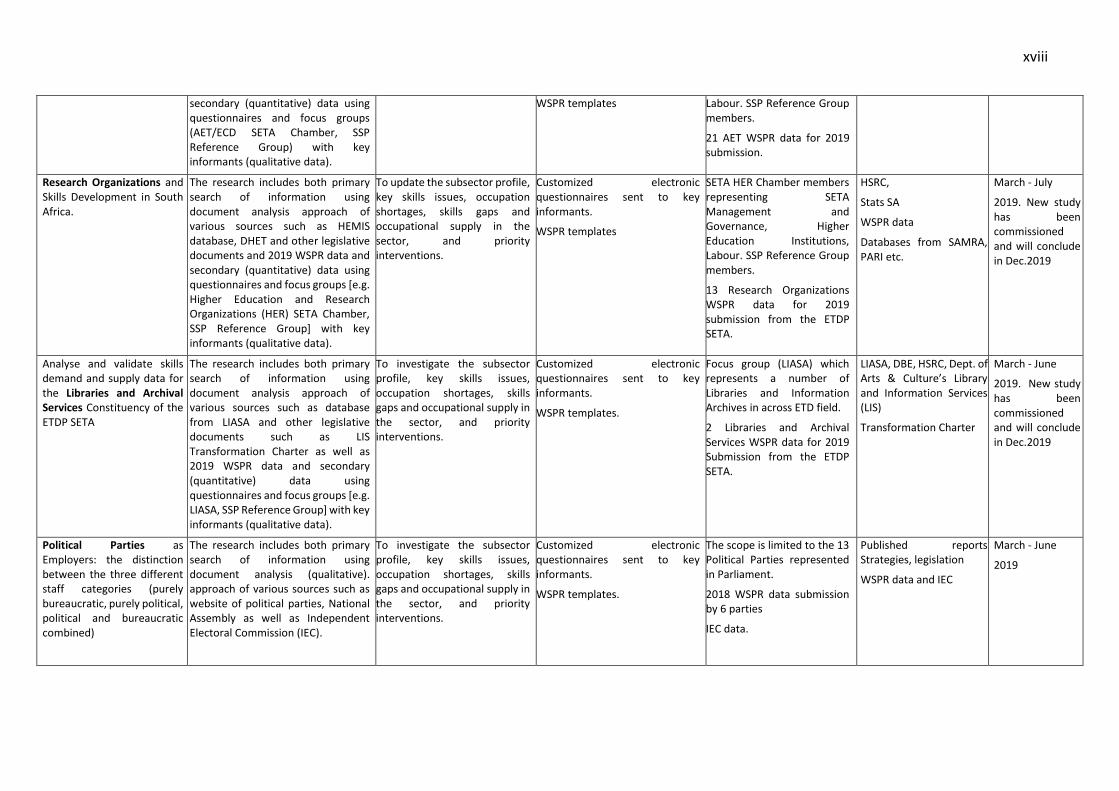
Research Organizations and Skills Development in South Africa.
The research includes both primary search of information using document analysis approach of various sources such as HEMIS database, DHET and other legislative documents and 2019 WSPR data and secondary (quantitative) data using questionnaires and focus groups [e.g. Higher Education and Research Organizations (HER) SETA Chamber, SSP Reference Group] with key informants (qualitative data).
To update the subsector profile, key skills issues, occupation shortages, skills gaps and occupational supply in the sector, and priority interventions.
Customized electronic questionnaires sent to key informants.
WSPR templates
SETA HER Chamber members representing SETA Management and Governance, Higher Education Institutions, Labour. SSP Reference Group members.
13 Research Organizations WSPR data for 2019 submission from the ETDP SETA.
HSRC,
Stats SA
WSPR data
Databases from SAMRA, PARI etc.
March - July
2019. New study has been commissioned and will conclude in Dec.2019
Analyse and validate skills demand and supply data for the Libraries and Archival Services Constituency of the ETDP SETA
The research includes both primary search of information using document analysis approach of various sources such as database from LIASA and other legislative documents such as LIS Transformation Charter as well as 2019 WSPR data and secondary (quantitative) data using questionnaires and focus groups [e.g. LIASA, SSP Reference Group] with key informants (qualitative data).
To investigate the subsector profile, key skills issues, occupation shortages, skills gaps and occupational supply in the sector, and priority interventions.
Customized electronic questionnaires sent to key informants.
WSPR templates.
Focus group (LIASA) which represents a number of Libraries and Information Archives in across ETD field.
2 Libraries and Archival Services WSPR data for 2019 Submission from the ETDP SETA.
LIASA, DBE, HSRC, Dept. of Arts & Culture’s Library and Information Services (LIS)
Transformation Charter
March - June
2019. New study has been commissioned and will conclude in Dec.2019
Political Parties as Employers: the distinction between the three different staff categories (purely bureaucratic, purely political, political and bureaucratic combined)
The research includes both primary search of information using document analysis (qualitative). approach of various sources such as website of political parties, National Assembly as well as Independent Electoral Commission (IEC).
To investigate the subsector profile, key skills issues, occupation shortages, skills gaps and occupational supply in the sector, and priority interventions.
Customized electronic questionnaires sent to key informants.
WSPR templates.
The scope is limited to the 13 Political Parties represented in Parliament.
2018 WSPR data submission by 6 parties
IEC data.
Published reports Strategies, legislation
WSPR data and IEC
March - June
2019
xix
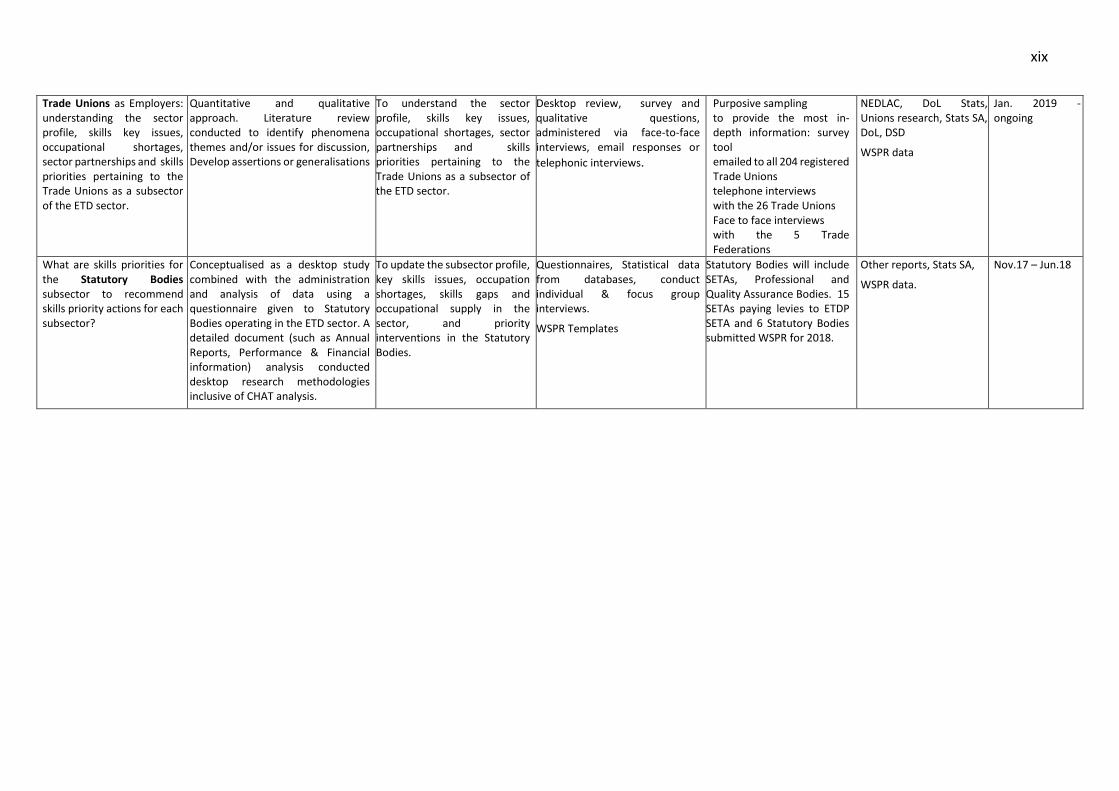
Trade Unions as Employers: understanding the sector profile, skills key issues, occupational shortages, sector partnerships and skills priorities pertaining to the Trade Unions as a subsector of the ETD sector.
Quantitative and qualitative approach. Literature review conducted to identify phenomena themes and/or issues for discussion, Develop assertions or generalisations
To understand the sector profile, skills key issues, occupational shortages, sector partnerships and skills priorities pertaining to the Trade Unions as a subsector of the ETD sector.
Desktop review, survey and qualitative questions, administered via face-to-face interviews, email responses or
telephonic interviews.
Purposive sampling to provide the most in-depth information: survey tool emailed to all 204 registered Trade Unions telephone interviews with the 26 Trade Unions Face to face interviews with the 5 Trade Federations
NEDLAC, DoL Stats, Unions research, Stats SA, DoL, DSD
WSPR data
Jan. 2019 - ongoing
What are skills priorities for the Statutory Bodies subsector to recommend skills priority actions for each subsector?
Conceptualised as a desktop study combined with the administration and analysis of data using a questionnaire given to Statutory Bodies operating in the ETD sector. A detailed document (such as Annual Reports, Performance & Financial information) analysis conducted desktop research methodologies inclusive of CHAT analysis.
To update the subsector profile, key skills issues, occupation shortages, skills gaps and occupational supply in the sector, and priority interventions in the Statutory Bodies.
Questionnaires, Statistical data from databases, conduct individual & focus group interviews.
WSPR Templates
Statutory Bodies will include SETAs, Professional and Quality Assurance Bodies. 15 SETAs paying levies to ETDP SETA and 6 Statutory Bodies submitted WSPR for 2018.
Other reports, Stats SA,
WSPR data.
Nov.17 – Jun.18

1
CHAPTER 1: SECTOR PROFILE
Introduction
This chapter will cover the five areas to better understand the profile of the ETD sector by looking
at individual subsectors. These areas include: scope of coverage and followed by role players,
economic profile of the sector, employer profile and labour market profile.
The Government Gazette’s and StatsSA’s Standard Industrial Classification and Industrial Policy
Action (IPAP) 2017/18 to 2019/20, State of the Nation speeches (2018 & 2019), recent budget
speeches of various departments and other data sources have all been used to determine the
formal allocation of the economic activities to different subsectors of the ETD.
Scope of Coverage
The ETDP SETA’s scope covers of 14 subsectors, which in some cases includes clusters of
economic activity. These subsectors include: ECD, Schooling (public and independent); TVET
Colleges (public and private); Higher Education institutions (public and private); ACET Centres
(public and private); NGOs in Education; Research Organizations; Library Information and
Archival Services; Trade Unions as employers, Political Parties as employers; and Statutory Bodies
which is covering SETAs, Quality Assurance and Professional Bodies.
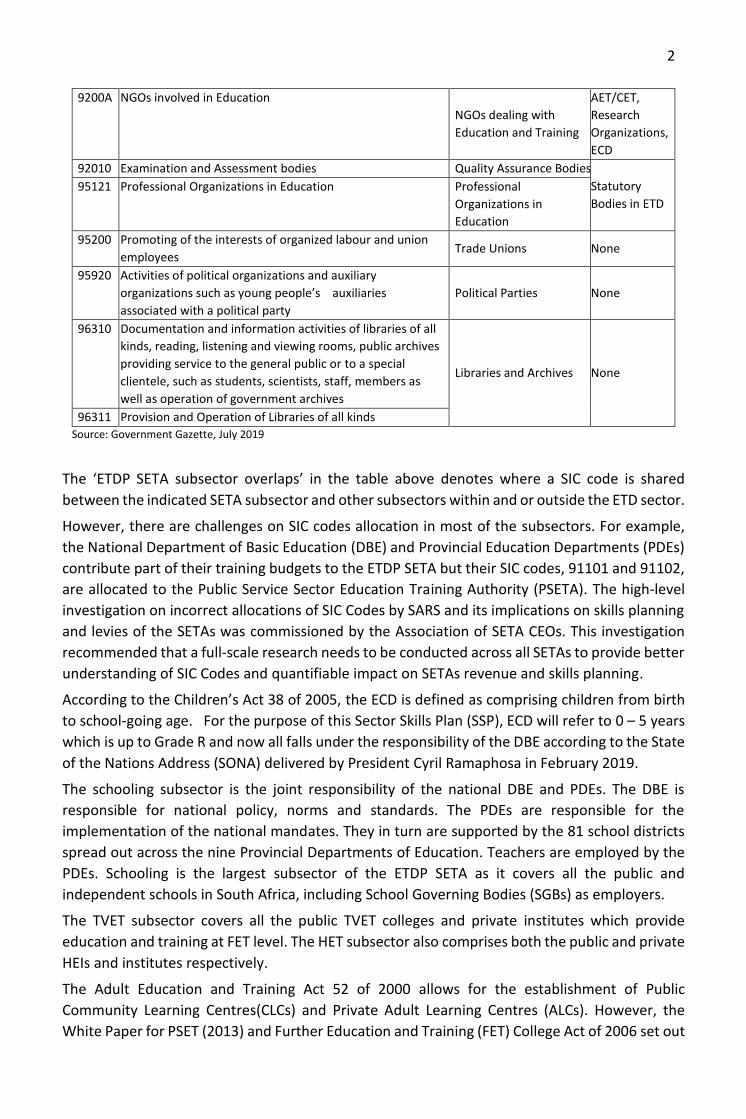
Based on the above scope of coverage, there are 17 Standard Industrial Classification (SIC) codes
as shown in Table 2 below which cover the SETA’s subsectors according to sub-groups or sub
economic sectors, denoted by the five digit and/letter code, indicating the major economic
activity (IPAP, 2017-18).
Table 2: Standard Industrial Classification (SIC 7 Coder Covered by the ETDP SETA)
SIC
Code MAJOR ECONOMIC ACTIVITY ETDP SETA SUBSECTOR
ETDP SETA
SUBSECTOR
OVERLAPS
87200 Interdisciplinary research and development, predominantly
on social sciences and humanities Research Organizations
NGOs, Private
Providers and
other SETAs 87132 Research and Development
92001 Pre-primary Education and Activities of after-school
centres
Early Childhood
Development Centres
Independent
Schools, NGOs
and LGSETA
Municipalities CLCs
92002 Primary and Secondary Education Independent Schools School
Governing
Bodies Public Schools
92004 Education by Technical Colleges and Technical Institutions TVET Colleges
Private
Providers
92005 Education by Universities of Technology Higher Education
Institutions
Private
Providers –
TVET and HET
92006 Education by Teacher Training Colleges or Education for
Further Training
92007 Post-secondary non-tertiary education
92008 Education by correspondence and private vocational
colleges Private FET and HET
Institutions
Private FET and
HET 92009 Other Educational Services - own account teachers, motor
vehicle driving schools tutors and music, dancing and other
art schools, Instruction for tourist guides etc.
2
Source: Government Gazette, July 2019
The ‘ETDP SETA subsector overlaps’ in the table above denotes where a SIC code is shared
between the indicated SETA subsector and other subsectors within and or outside the ETD sector.
However, there are challenges on SIC codes allocation in most of the subsectors. For example,
the National Department of Basic Education (DBE) and Provincial Education Departments (PDEs)
contribute part of their training budgets to the ETDP SETA but their SIC codes, 91101 and 91102,
are allocated to the Public Service Sector Education Training Authority (PSETA). The high-level
investigation on incorrect allocations of SIC Codes by SARS and its implications on skills planning
and levies of the SETAs was commissioned by the Association of SETA CEOs. This investigation
recommended that a full-scale research needs to be conducted across all SETAs to provide better
understanding of SIC Codes and quantifiable impact on SETAs revenue and skills planning.
According to the Children’s Act 38 of 2005, the ECD is defined as comprising children from birth
to school-going age. For the purpose of this Sector Skills Plan (SSP), ECD will refer to 0 – 5 years
which is up to Grade R and now all falls under the responsibility of the DBE according to the State
of the Nations Address (SONA) delivered by President Cyril Ramaphosa in February 2019.
The schooling subsector is the joint responsibility of the national DBE and PDEs. The DBE is
responsible for national policy, norms and standards. The PDEs are responsible for the
implementation of the national mandates. They in turn are supported by the 81 school districts
spread out across the nine Provincial Departments of Education. Teachers are employed by the
PDEs. Schooling is the largest subsector of the ETDP SETA as it covers all the public and
independent schools in South Africa, including School Governing Bodies (SGBs) as employers.
The TVET subsector covers all the public TVET colleges and private institutes which provide
education and training at FET level. The HET subsector also comprises both the public and private
HEIs and institutes respectively.
The Adult Education and Training Act 52 of 2000 allows for the establishment of Public
Community Learning Centres(CLCs) and Private Adult Learning Centres (ALCs). However, the
White Paper for PSET (2013) and Further Education and Training (FET) College Act of 2006 set out
9200A NGOs involved in Education
NGOs dealing with
Education and Training
AET/CET,
Research
Organizations,
ECD
92010 Examination and Assessment bodies Quality Assurance Bodies
Statutory
Bodies in ETD
95121 Professional Organizations in Education Professional
Organizations in
Education
95200 Promoting of the interests of organized labour and union
employees Trade Unions None
95920 Activities of political organizations and auxiliary
organizations such as young people’s auxiliaries
associated with a political party
Political Parties None
96310 Documentation and information activities of libraries of all
kinds, reading, listening and viewing rooms, public archives
providing service to the general public or to a special
clientele, such as students, scientists, staff, members as
well as operation of government archives
Libraries and Archives None
96311 Provision and Operation of Libraries of all kinds

3
the policy direction for the establishment of Community Education and Training Centres (CETCs).
As at the 1st of April 2016, nine CETCs had been officially established, to be known as Community
Colleges which are overseeing the functioning of the CLCs in the provinces.
The ETDP SETA is also responsible for servicing NGOs in education. However, the NGO sector in
South Africa comprises organizations whose orientation falls within different focus areas.
Furthermore, different stakeholders have different definitions and notions of civil society in
South Africa which is a broader umbrella term. Civil society organizations (CSOs) are more
commonly known as non-profit organizations (NPOs). For the purpose of this report the term
NGOs is used as a subsector falling under ETDP SETA. These will be those whose focus is on ETD,
research, policy and law.
There are various types of research organizations found in the public (Government, Science
Research Councils and Universities) and private sectors (Corporates and Small Business). The
ETDP SETA’s scope for research organizations covers these various types.
The Library Information and Archival Services subsector can be further differentiated and defined
as follows:
Libraries Sector comprises the Library and Information Services (LIS) namely national libraries, school libraries, public libraries, higher education libraries, special and government libraries and Thusong Service Centre Libraries; and
Archival Services comprises the Archival Services and Records Management within the Department of Arts and Culture and 9 provincial archives repositories and record centres. The scope of the ETDP SETA Trade Union subsector covers all the 253 (SEIFSA: 2019) registered
trade unions, affiliated and unaffiliated to federations. However, while there are now 24 trade
union federations in South Africa (South African Labour Guide, April 2017), the ETDP SETA
supports the four federations (COSATU, NACTU, SAFTU and FEDUSA) who operate at a national
level.
The ETDP SETA’s scope covers mainly political parties who are represented in the South African
parliament as well as those that might not be represented in the national assembly but are paying
levies to the ETDP SETA.
The Statutory Bodies subsector covers SETAs, Professional and Quality Assurance Bodies. Even
though not all entities pay levies, the SETA is supporting this subsector in order to nurture its
growth. Based on the SIC Codes, the professional bodies such as the South African Council of
Teachers (SACE) and the Education Labour Relation Council (ELRC); as well as the quality
assurance bodies including the Council for Quality Assurance of General and Further Education
(UMALUSI) and Quality Council for Trades and Occupations (QCTO) and Higher Education Quality
Council (HEQC), are supported by the ETDP SETA.
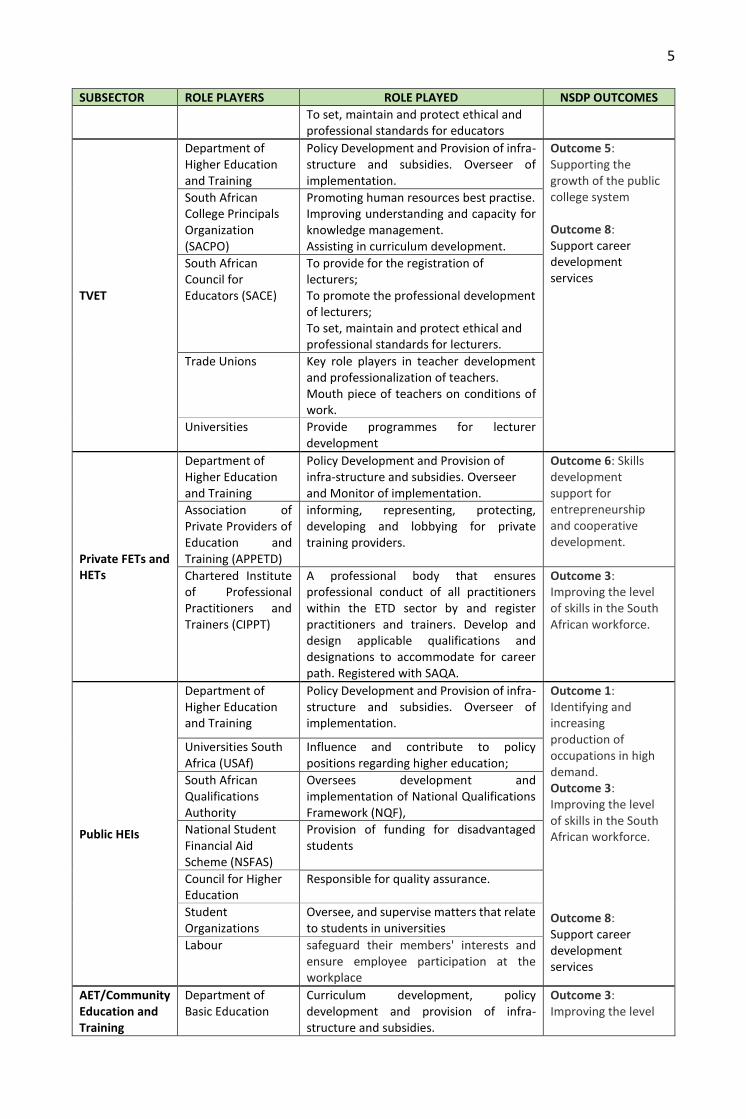
Key Role-Players
The ETD subsectors have their own role players which assist their functioning and the
provision of various skills development for employees. Table 3 below shows the key role
players in the sector as well as the role they play for each of the subsectors.
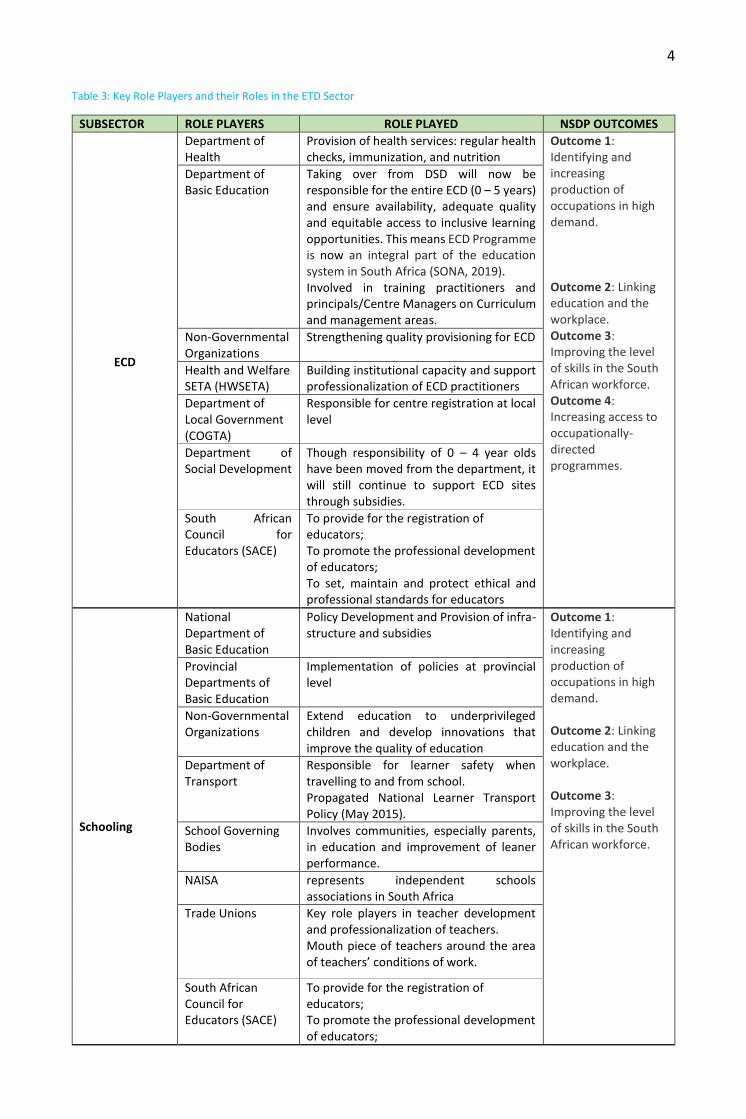
4 Table 3: Key Role Players and their Roles in the ETD Sector
SUBSECTOR ROLE PLAYERS ROLE PLAYED NSDP OUTCOMES
ECD
Department of Health
Provision of health services: regular health checks, immunization, and nutrition
Outcome 1: Identifying and increasing production of occupations in high demand. Outcome 2: Linking education and the workplace. Outcome 3: Improving the level of skills in the South African workforce. Outcome 4: Increasing access to occupationally-directed programmes.
Department of Basic Education
Taking over from DSD will now be responsible for the entire ECD (0 – 5 years) and ensure availability, adequate quality and equitable access to inclusive learning opportunities. This means ECD Programme is now an integral part of the education system in South Africa (SONA, 2019). Involved in training practitioners and principals/Centre Managers on Curriculum and management areas.
Non-Governmental Organizations
Strengthening quality provisioning for ECD
Health and Welfare SETA (HWSETA)
Building institutional capacity and support professionalization of ECD practitioners
Department of Local Government (COGTA)
Responsible for centre registration at local level
Department of Social Development
Though responsibility of 0 – 4 year olds have been moved from the department, it will still continue to support ECD sites through subsidies.
South African Council for Educators (SACE)
To provide for the registration of educators; To promote the professional development of educators; To set, maintain and protect ethical and professional standards for educators
Schooling
National Department of Basic Education
Policy Development and Provision of infra-structure and subsidies
Outcome 1: Identifying and increasing production of occupations in high demand. Outcome 2: Linking education and the workplace. Outcome 3: Improving the level of skills in the South African workforce.
Provincial Departments of Basic Education
Implementation of policies at provincial level
Non-Governmental Organizations
Extend education to underprivileged children and develop innovations that improve the quality of education
Department of Transport
Responsible for learner safety when travelling to and from school. Propagated National Learner Transport Policy (May 2015).
School Governing Bodies
Involves communities, especially parents, in education and improvement of leaner performance.
NAISA represents independent schools associations in South Africa
Trade Unions Key role players in teacher development and professionalization of teachers. Mouth piece of teachers around the area of teachers’ conditions of work.
South African Council for Educators (SACE)
To provide for the registration of educators; To promote the professional development of educators;
5
SUBSECTOR ROLE PLAYERS ROLE PLAYED NSDP OUTCOMES
To set, maintain and protect ethical and professional standards for educators
TVET
Department of Higher Education and Training
Policy Development and Provision of infra-structure and subsidies. Overseer of implementation.
Outcome 5: Supporting the growth of the public college system Outcome 8: Support career development services
South African College Principals Organization (SACPO)
Promoting human resources best practise. Improving understanding and capacity for knowledge management. Assisting in curriculum development.
South African Council for Educators (SACE)
To provide for the registration of lecturers; To promote the professional development of lecturers; To set, maintain and protect ethical and professional standards for lecturers.
Trade Unions Key role players in teacher development and professionalization of teachers. Mouth piece of teachers on conditions of work.
Universities Provide programmes for lecturer development
Private FETs and HETs
Department of Higher Education and Training
Policy Development and Provision of infra-structure and subsidies. Overseer and Monitor of implementation.
Outcome 6: Skills development support for entrepreneurship and cooperative development.
Association of Private Providers of Education and Training (APPETD)
informing, representing, protecting, developing and lobbying for private training providers.
Chartered Institute of Professional Practitioners and Trainers (CIPPT)
A professional body that ensures professional conduct of all practitioners within the ETD sector by and register practitioners and trainers. Develop and design applicable qualifications and designations to accommodate for career path. Registered with SAQA.
Outcome 3: Improving the level of skills in the South African workforce.
Public HEIs
Department of Higher Education and Training
Policy Development and Provision of infra-structure and subsidies. Overseer of implementation.
Outcome 1: Identifying and increasing production of occupations in high demand. Outcome 3: Improving the level of skills in the South African workforce. Outcome 8: Support career development services
Universities South Africa (USAf)
Influence and contribute to policy positions regarding higher education;
South African Qualifications Authority
Oversees development and implementation of National Qualifications Framework (NQF),
National Student Financial Aid Scheme (NSFAS)
Provision of funding for disadvantaged students
Council for Higher Education
Responsible for quality assurance.
Student Organizations
Oversee, and supervise matters that relate to students in universities
Labour safeguard their members' interests and ensure employee participation at the workplace
AET/Community Education and Training
Department of Basic Education
Curriculum development, policy development and provision of infra-structure and subsidies.
Outcome 3: Improving the level

6
SUBSECTOR ROLE PLAYERS ROLE PLAYED NSDP OUTCOMES
Department of Higher Education and Training
Policy development and provision of infra-structure and subsidies. Overseer and Monitor of implementation.
of skills in the South African workforce. Outcome 4: Increasing access to occupationally directed programmes.
Labour safeguard their members' interests and ensure employee participation at the workplace
Universities Provide programmes for lecturer and practitioner development
Non-Governmental Organizations
Department of Social Development
Provision of infra-structure and subsidies Outcome 3: Improving the level of skills in the South African workforce. Outcome 4: Increasing access to occupationally directed programmes.
Department of Health
Provision of heath care, rehabilitation and emergency response.
National Treasury Provision of financial management and support services
Library and archival Service (LIASA)
Department of Art and Culture
Provision of funding and oversee the development and implementation of sector policies.
National Library of South Africa
Primary resource and custodian of South Africa’s documentary heritage, promotes creative, effective and efficient universal access to information.
Library and Information Association of South Africa
Promote freedom of access to information as enshrined in the Constitution.
Trade Unions
Trade Union Federations
Represent and organize unions in bargaining matters and working conditions.
Outcome 7: Encouraging and supporting worker initiated training.
Department of Employment and Labour
Registration and regulation of unions’ activities
Political Parties
Funders Fund political activities for parties
IEC Registration of political parties, conducting and facilitating general and local government elections.
Statutory Bodies
SETAs: All the 21 SETAs
to contribute to the raising of skills, to bring skills to the employed, or those wanting to be employed, in their sector.
Outcome 3: Improving the level of skills in the South African workforce. Outcome 4: Increasing access to occupationally directed programmes.
Quality Assurance Bodies: Umalusi, QCTO and CHE
Umalusi: manage the standard of qualifications for general and further education and training. QCTO: to develop, design and maintain occupational standards, to quality assure the qualifications CHE: quality assurance and promotion in the higher education and training
Professional Bodies in ETD
Set and assess professional examinations. Provide support for Continuing Professional Development through learning opportunities.
7
Economic Performance
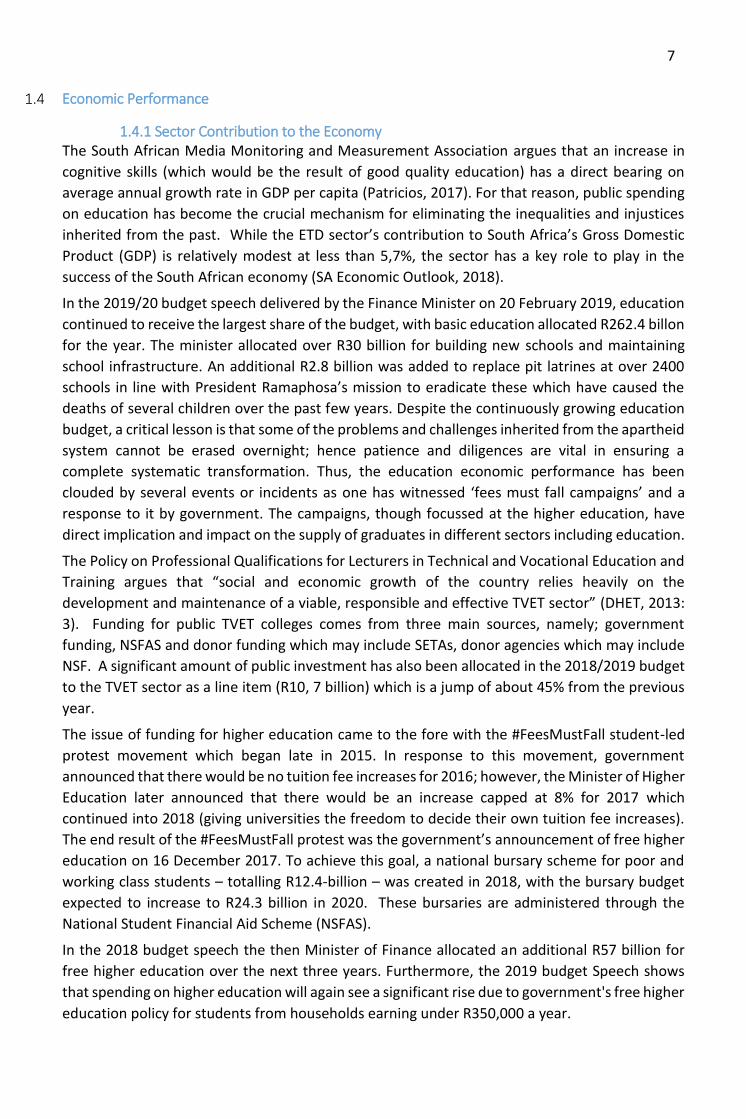
1.4.1 Sector Contribution to the Economy The South African Media Monitoring and Measurement Association argues that an increase in
cognitive skills (which would be the result of good quality education) has a direct bearing on
average annual growth rate in GDP per capita (Patricios, 2017). For that reason, public spending
on education has become the crucial mechanism for eliminating the inequalities and injustices
inherited from the past. While the ETD sector’s contribution to South Africa’s Gross Domestic
Product (GDP) is relatively modest at less than 5,7%, the sector has a key role to play in the
success of the South African economy (SA Economic Outlook, 2018).
In the 2019/20 budget speech delivered by the Finance Minister on 20 February 2019, education
continued to receive the largest share of the budget, with basic education allocated R262.4 billon
for the year. The minister allocated over R30 billion for building new schools and maintaining
school infrastructure. An additional R2.8 billion was added to replace pit latrines at over 2400
schools in line with President Ramaphosa’s mission to eradicate these which have caused the
deaths of several children over the past few years. Despite the continuously growing education
budget, a critical lesson is that some of the problems and challenges inherited from the apartheid
system cannot be erased overnight; hence patience and diligences are vital in ensuring a
complete systematic transformation. Thus, the education economic performance has been
clouded by several events or incidents as one has witnessed ‘fees must fall campaigns’ and a
response to it by government. The campaigns, though focussed at the higher education, have
direct implication and impact on the supply of graduates in different sectors including education.
The Policy on Professional Qualifications for Lecturers in Technical and Vocational Education and
Training argues that “social and economic growth of the country relies heavily on the
development and maintenance of a viable, responsible and effective TVET sector” (DHET, 2013:
3). Funding for public TVET colleges comes from three main sources, namely; government
funding, NSFAS and donor funding which may include SETAs, donor agencies which may include
NSF. A significant amount of public investment has also been allocated in the 2018/2019 budget
to the TVET sector as a line item (R10, 7 billion) which is a jump of about 45% from the previous
year.
The issue of funding for higher education came to the fore with the #FeesMustFall student-led
protest movement which began late in 2015. In response to this movement, government
announced that there would be no tuition fee increases for 2016; however, the Minister of Higher
Education later announced that there would be an increase capped at 8% for 2017 which
continued into 2018 (giving universities the freedom to decide their own tuition fee increases).
The end result of the #FeesMustFall protest was the government’s announcement of free higher
education on 16 December 2017. To achieve this goal, a national bursary scheme for poor and
working class students – totalling R12.4-billion – was created in 2018, with the bursary budget
expected to increase to R24.3 billion in 2020. These bursaries are administered through the
National Student Financial Aid Scheme (NSFAS).
In the 2018 budget speech the then Minister of Finance allocated an additional R57 billion for
free higher education over the next three years. Furthermore, the 2019 budget Speech shows
that spending on higher education will again see a significant rise due to government's free higher
education policy for students from households earning under R350,000 a year.
8
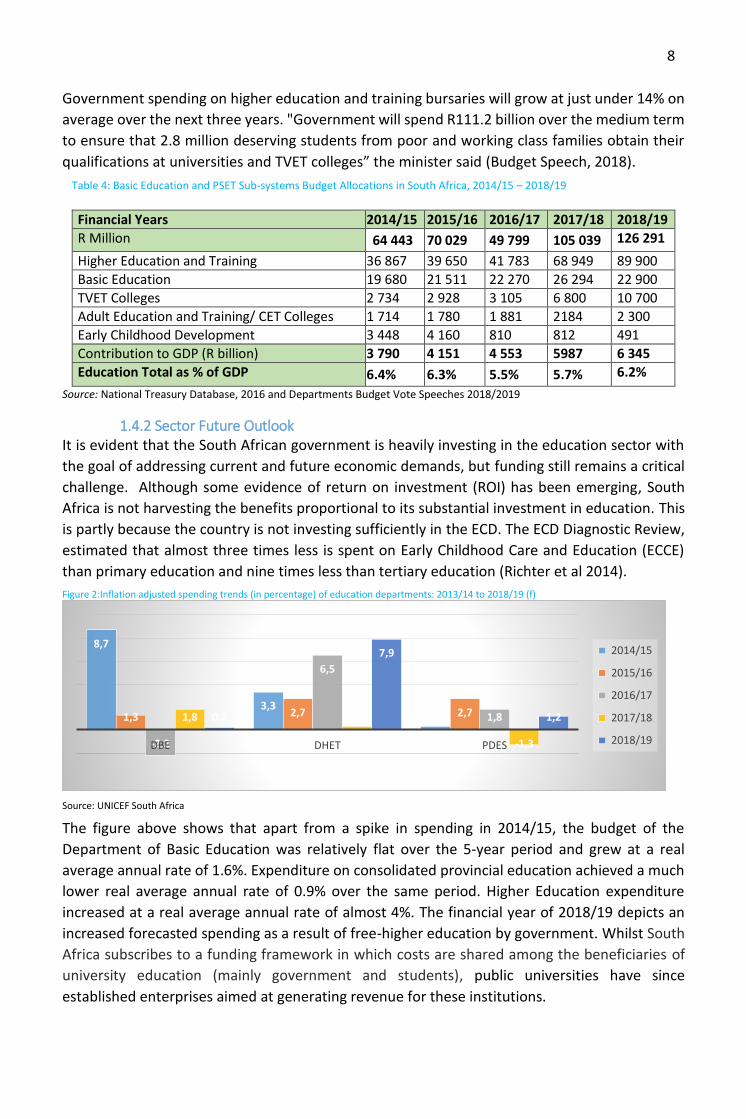
Government spending on higher education and training bursaries will grow at just under 14% on
average over the next three years. "Government will spend R111.2 billion over the medium term
to ensure that 2.8 million deserving students from poor and working class families obtain their
qualifications at universities and TVET colleges” the minister said (Budget Speech, 2018).
Table 4: Basic Education and PSET Sub-systems Budget Allocations in South Africa, 2014/15 – 2018/19
Source: National Treasury Database, 2016 and Departments Budget Vote Speeches 2018/2019
1.4.2 Sector Future Outlook It is evident that the South African government is heavily investing in the education sector with
the goal of addressing current and future economic demands, but funding still remains a critical
challenge. Although some evidence of return on investment (ROI) has been emerging, South
Africa is not harvesting the benefits proportional to its substantial investment in education. This
is partly because the country is not investing sufficiently in the ECD. The ECD Diagnostic Review,
estimated that almost three times less is spent on Early Childhood Care and Education (ECCE)
than primary education and nine times less than tertiary education (Richter et al 2014).
Figure 2:Inflation adjusted spending trends (in percentage) of education departments: 2013/14 to 2018/19 (f)
Source: UNICEF South Africa
The figure above shows that apart from a spike in spending in 2014/15, the budget of the
Department of Basic Education was relatively flat over the 5-year period and grew at a real
average annual rate of 1.6%. Expenditure on consolidated provincial education achieved a much
lower real average annual rate of 0.9% over the same period. Higher Education expenditure
increased at a real average annual rate of almost 4%. The financial year of 2018/19 depicts an
increased forecasted spending as a result of free-higher education by government. Whilst South
Africa subscribes to a funding framework in which costs are shared among the beneficiaries of
university education (mainly government and students), public universities have since
established enterprises aimed at generating revenue for these institutions.
8,7
3,30,31,3 2,7 2,7
-2,2
6,5
1,81,8 0,3
-1,3
0,2
7,9
1,2
DBE DHET PDES
2014/15
2015/16
2016/17
2017/18
2018/19
Financial Years 2014/15 2015/16 2016/17 2017/18 2018/19
R Million 64 443 70 029 49 799 105 039 126 291
Higher Education and Training 36 867 39 650 41 783 68 949 89 900
Basic Education 19 680 21 511 22 270 26 294 22 900
TVET Colleges 2 734 2 928 3 105 6 800 10 700
Adult Education and Training/ CET Colleges 1 714 1 780 1 881 2184 2 300
Early Childhood Development 3 448 4 160 810 812 491
Contribution to GDP (R billion) 3 790 4 151 4 553 5987 6 345
Education Total as % of GDP 6.4% 6.3% 5.5% 5.7% 6.2%
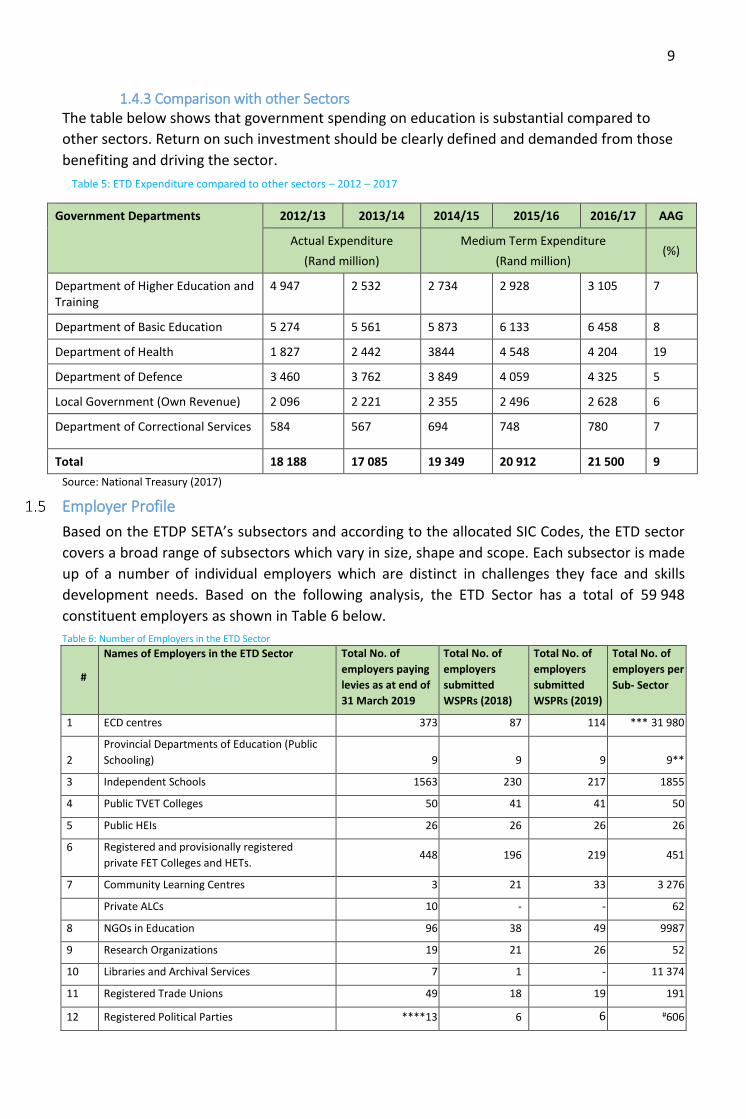
9
1.4.3 Comparison with other Sectors The table below shows that government spending on education is substantial compared to
other sectors. Return on such investment should be clearly defined and demanded from those
benefiting and driving the sector.
Table 5: ETD Expenditure compared to other sectors – 2012 – 2017
Source: National Treasury (2017)
Employer Profile
Based on the ETDP SETA’s subsectors and according to the allocated SIC Codes, the ETD sector
covers a broad range of subsectors which vary in size, shape and scope. Each subsector is made
up of a number of individual employers which are distinct in challenges they face and skills
development needs. Based on the following analysis, the ETD Sector has a total of 59 948
constituent employers as shown in Table 6 below.
Table 6: Number of Employers in the ETD Sector
#
Names of Employers in the ETD Sector
Total No. of
employers paying
levies as at end of
31 March 2019
Total No. of
employers
submitted
WSPRs (2018)
Total No. of
employers
submitted
WSPRs (2019)
Total No. of
employers per
Sub- Sector
1 ECD centres 373 87 114 *** 31 980
2
Provincial Departments of Education (Public
Schooling) 9 9 9 9**
3 Independent Schools 1563 230 217 1855
4 Public TVET Colleges 50 41 41 50
5 Public HEIs 26 26 26 26
6 Registered and provisionally registered
private FET Colleges and HETs. 448 196 219 451
7 Community Learning Centres 3 21 33 3 276
Private ALCs 10 - - 62
8 NGOs in Education 96 38 49 9987
9 Research Organizations 19 21 26 52
10 Libraries and Archival Services 7 1 - 11 374
11 Registered Trade Unions 49 18 19 191
12 Registered Political Parties ****13 6 6 #606
Government Departments 2012/13 2013/14 2014/15 2015/16 2016/17 AAG
Actual Expenditure
(Rand million)
Medium Term Expenditure
(Rand million) (%)
Department of Higher Education and Training
4 947 2 532 2 734 2 928 3 105 7
Department of Basic Education 5 274 5 561 5 873 6 133 6 458 8
Department of Health 1 827 2 442 3844 4 548 4 204 19
Department of Defence 3 460 3 762 3 849 4 059 4 325 5
Local Government (Own Revenue) 2 096 2 221 2 355 2 496 2 628 6
Department of Correctional Services 584 567 694 748 780 7
Total 18 188 17 085 19 349 20 912 21 500 9
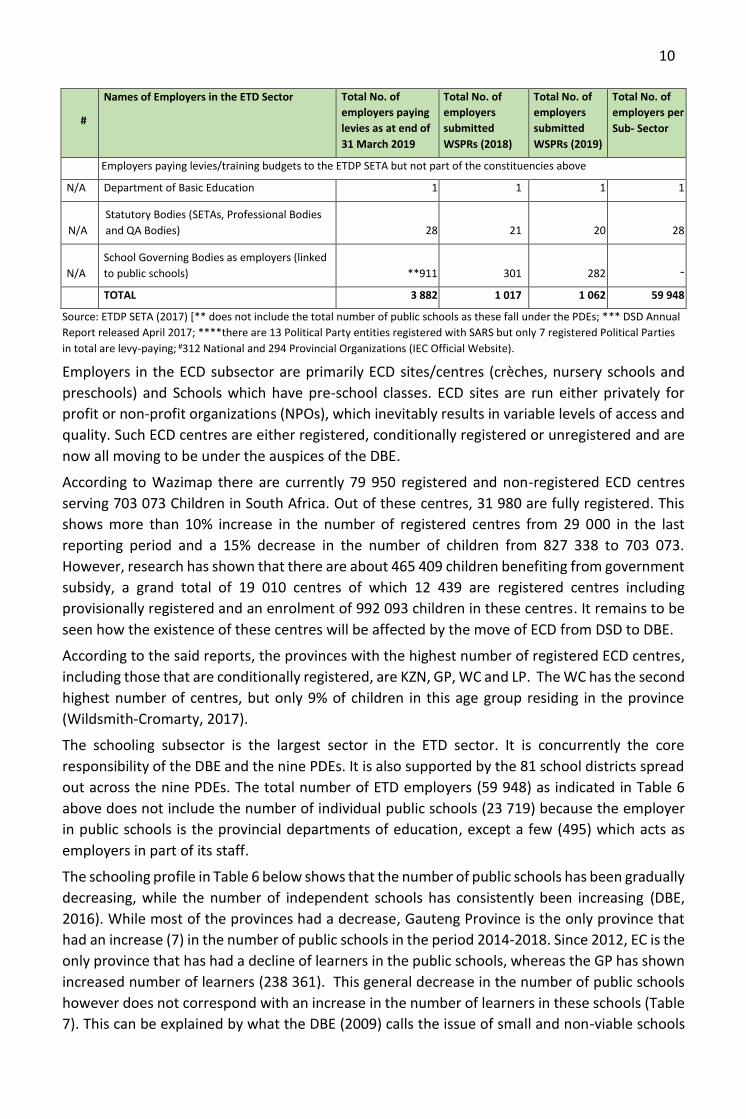
10
#
Names of Employers in the ETD Sector
Total No. of
employers paying
levies as at end of
31 March 2019
Total No. of
employers
submitted
WSPRs (2018)
Total No. of
employers
submitted
WSPRs (2019)
Total No. of
employers per
Sub- Sector
Employers paying levies/training budgets to the ETDP SETA but not part of the constituencies above
N/A Department of Basic Education 1 1 1 1
N/A
Statutory Bodies (SETAs, Professional Bodies
and QA Bodies) 28 21
20 28
N/A
School Governing Bodies as employers (linked
to public schools) **911 301
282 -
TOTAL 3 882 1 017 1 062 59 948
Source: ETDP SETA (2017) [** does not include the total number of public schools as these fall under the PDEs; *** DSD Annual
Report released April 2017; ****there are 13 Political Party entities registered with SARS but only 7 registered Political Parties
in total are levy-paying; #312 National and 294 Provincial Organizations (IEC Official Website).
Employers in the ECD subsector are primarily ECD sites/centres (crèches, nursery schools and
preschools) and Schools which have pre-school classes. ECD sites are run either privately for
profit or non-profit organizations (NPOs), which inevitably results in variable levels of access and
quality. Such ECD centres are either registered, conditionally registered or unregistered and are
now all moving to be under the auspices of the DBE.
According to Wazimap there are currently 79 950 registered and non-registered ECD centres
serving 703 073 Children in South Africa. Out of these centres, 31 980 are fully registered. This
shows more than 10% increase in the number of registered centres from 29 000 in the last
reporting period and a 15% decrease in the number of children from 827 338 to 703 073.
However, research has shown that there are about 465 409 children benefiting from government
subsidy, a grand total of 19 010 centres of which 12 439 are registered centres including
provisionally registered and an enrolment of 992 093 children in these centres. It remains to be
seen how the existence of these centres will be affected by the move of ECD from DSD to DBE.
According to the said reports, the provinces with the highest number of registered ECD centres,
including those that are conditionally registered, are KZN, GP, WC and LP. The WC has the second
highest number of centres, but only 9% of children in this age group residing in the province
(Wildsmith-Cromarty, 2017).
The schooling subsector is the largest sector in the ETD sector. It is concurrently the core
responsibility of the DBE and the nine PDEs. It is also supported by the 81 school districts spread
out across the nine PDEs. The total number of ETD employers (59 948) as indicated in Table 6
above does not include the number of individual public schools (23 719) because the employer
in public schools is the provincial departments of education, except a few (495) which acts as
employers in part of its staff.
The schooling profile in Table 6 below shows that the number of public schools has been gradually
decreasing, while the number of independent schools has consistently been increasing (DBE,
2016). While most of the provinces had a decrease, Gauteng Province is the only province that
had an increase (7) in the number of public schools in the period 2014-2018. Since 2012, EC is the
only province that has had a decline of learners in the public schools, whereas the GP has shown
increased number of learners (238 361). This general decrease in the number of public schools
however does not correspond with an increase in the number of learners in these schools (Table
7). This can be explained by what the DBE (2009) calls the issue of small and non-viable schools

11
where the government closes and merge small schools to create mega schools. The premise for
this is that large and better resourced schools are more likely to improve performance (Bantwini,
2017). However, there is no clear explanation of the decrease in the number of schools in the
independent schools (5.4% from 1966 to 1865) whilst learner enrolments are reported to be
increasing between 2017 and 2018 (DBE, 2018: School Realities Report). The fast growth of
independent schools between 2014 and 2017 has been highly concentrated in the Gauteng
Province (28%) and it is also indicated by growth in the number of learners (317 449 learners)
and the rising employment rate of educators.
Table 7:Number of Public and Independent Schools in South Africa, 2014-2018
Province Public Schools Independent Schools
2014 2015 2016 2017 2018 2014 2015 2016 2017 2018
Eastern Cape 5 554 5 527 5 210 5 389 5 210 178 200 207 180 199
Free State 1 306 1 260 1 214 1 184 1 117 70 72 68 71 70
Gauteng 2 070 2 080 2 083 2 078 2 077 651 700 730 831 759
KwaZulu-Natal 5 915 5 899 5 895 5 879 5 849 236 238 247 220 189
Limpopo 3 929 3 893 3 867 3 866 3 843 147 152 151 159 163
Mpumalanga 1 762 1 744 1 725 1 726 1 751 105 118 122 110 112
Northern Cape 551 552 545 550 545 26 29 30 59 37
North West 1 515 1 490 1 471 1 487 1 454 55 54 63 69 69
Western Cape 1 458 1 460 1 450 1 508 1 443 213 223 237 268 267
South Africa 24 060 23 905 23 719 23 79 23 289 1 681 1 786 1855 1 966 1865
Source: DBE, School Realities 2014 – 2018
Since 2014, EC, LP and KZN are the only provinces that had a decline of learners in the public
schools, whereas the GP has shown 9% increase in the number of learners from 1 944 486 in 2014
to 2 109 890 in 2018. However, EC and LP and other provinces (except MP & NC) registered an
increase of enrolments in independent schools whilst KZN has shown a marked decline of 32%.
Table 8: Number of Public and Independent school learners in South Africa, 2014- 2018
Province Public School Leaners Independent School Learners
2014 2015 2016 2017 2018 2014 2015 2016 2017 2018
EC 1 889 307 1 894 682 1 898 723 1 742 817 1 775 602 57 578 58 715 62 824 52 746 65 178
FS 656 408 666 024 671 712 683 762 688 976 15 882 16 680 16 637 17 725 18 190
GP 1 944 486 1 998 640 2 048 558 2 261 935 2 109 890 246 989 263 679 278 026 151 290 292 686
KZN 2 831 311 2 811 418 2 808 137 2 818 213 2 773 823 70 386 70 100 69 407 45 103 47 398
LP 1 665 516 1 694 884 1 706 725 1 717 779 1 659 635 55 069 58 850 58 830 58 688 65 156
MP 1 034 151 1 052 207 1 046 234 1 076 554 1 026 151 23 637 27 073 28 118 19 874 19 821
NC 284 908 286 509 287 435 290 327 291 461 4 096 3 630 4 080 2 050 3 878
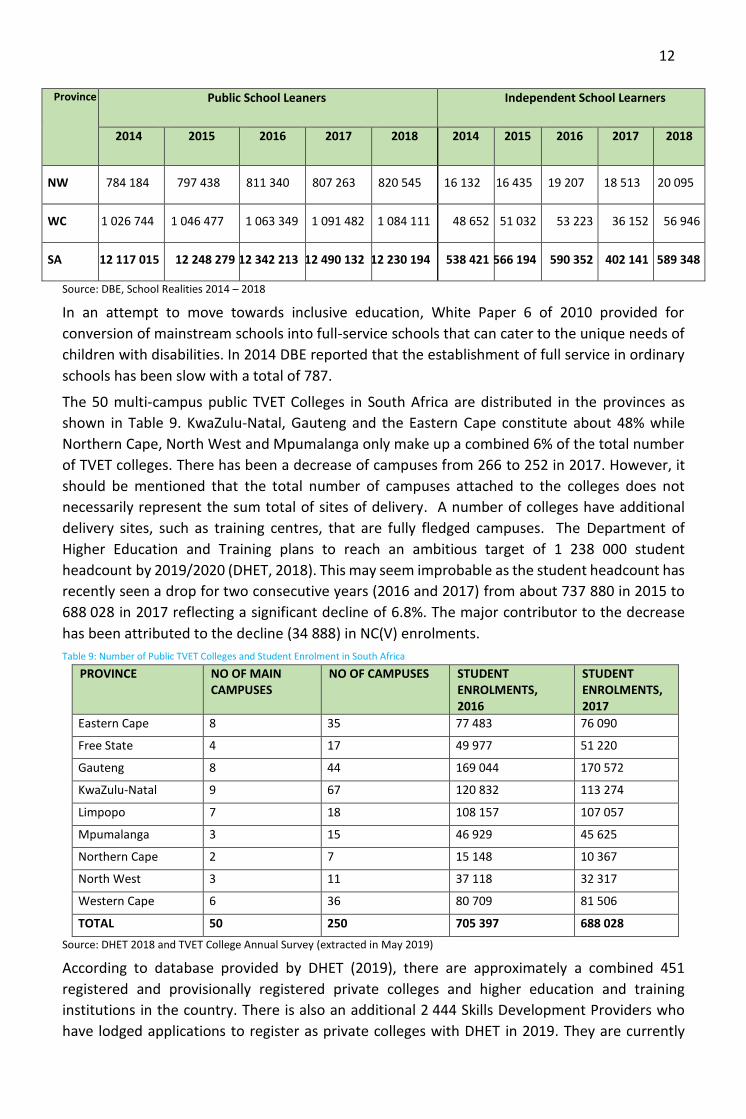
12
Province Public School Leaners Independent School Learners
2014 2015 2016 2017 2018 2014 2015 2016 2017 2018
NW 784 184 797 438 811 340 807 263 820 545 16 132 16 435 19 207 18 513 20 095
WC 1 026 744 1 046 477 1 063 349 1 091 482 1 084 111 48 652 51 032 53 223 36 152 56 946
SA 12 117 015 12 248 279 12 342 213 12 490 132 12 230 194 538 421 566 194 590 352 402 141 589 348
Source: DBE, School Realities 2014 – 2018
In an attempt to move towards inclusive education, White Paper 6 of 2010 provided for
conversion of mainstream schools into full-service schools that can cater to the unique needs of
children with disabilities. In 2014 DBE reported that the establishment of full service in ordinary
schools has been slow with a total of 787.
The 50 multi-campus public TVET Colleges in South Africa are distributed in the provinces as
shown in Table 9. KwaZulu-Natal, Gauteng and the Eastern Cape constitute about 48% while
Northern Cape, North West and Mpumalanga only make up a combined 6% of the total number
of TVET colleges. There has been a decrease of campuses from 266 to 252 in 2017. However, it
should be mentioned that the total number of campuses attached to the colleges does not
necessarily represent the sum total of sites of delivery. A number of colleges have additional
delivery sites, such as training centres, that are fully fledged campuses. The Department of
Higher Education and Training plans to reach an ambitious target of 1 238 000 student
headcount by 2019/2020 (DHET, 2018). This may seem improbable as the student headcount has
recently seen a drop for two consecutive years (2016 and 2017) from about 737 880 in 2015 to
688 028 in 2017 reflecting a significant decline of 6.8%. The major contributor to the decrease
has been attributed to the decline (34 888) in NC(V) enrolments.
Table 9: Number of Public TVET Colleges and Student Enrolment in South Africa
Source: DHET 2018 and TVET College Annual Survey (extracted in May 2019)
According to database provided by DHET (2019), there are approximately a combined 451
registered and provisionally registered private colleges and higher education and training
institutions in the country. There is also an additional 2 444 Skills Development Providers who
have lodged applications to register as private colleges with DHET in 2019. They are currently
PROVINCE NO OF MAIN CAMPUSES
NO OF CAMPUSES STUDENT ENROLMENTS, 2016
STUDENT ENROLMENTS, 2017
Eastern Cape 8 35 77 483 76 090
Free State 4 17 49 977 51 220
Gauteng 8 44 169 044 170 572
KwaZulu-Natal 9 67 120 832 113 274
Limpopo 7 18 108 157 107 057
Mpumalanga 3 15 46 929 45 625
Northern Cape 2 7 15 148 10 367
North West 3 11 37 118 32 317
Western Cape 6 36 80 709 81 506
TOTAL 50 250 705 397 688 028
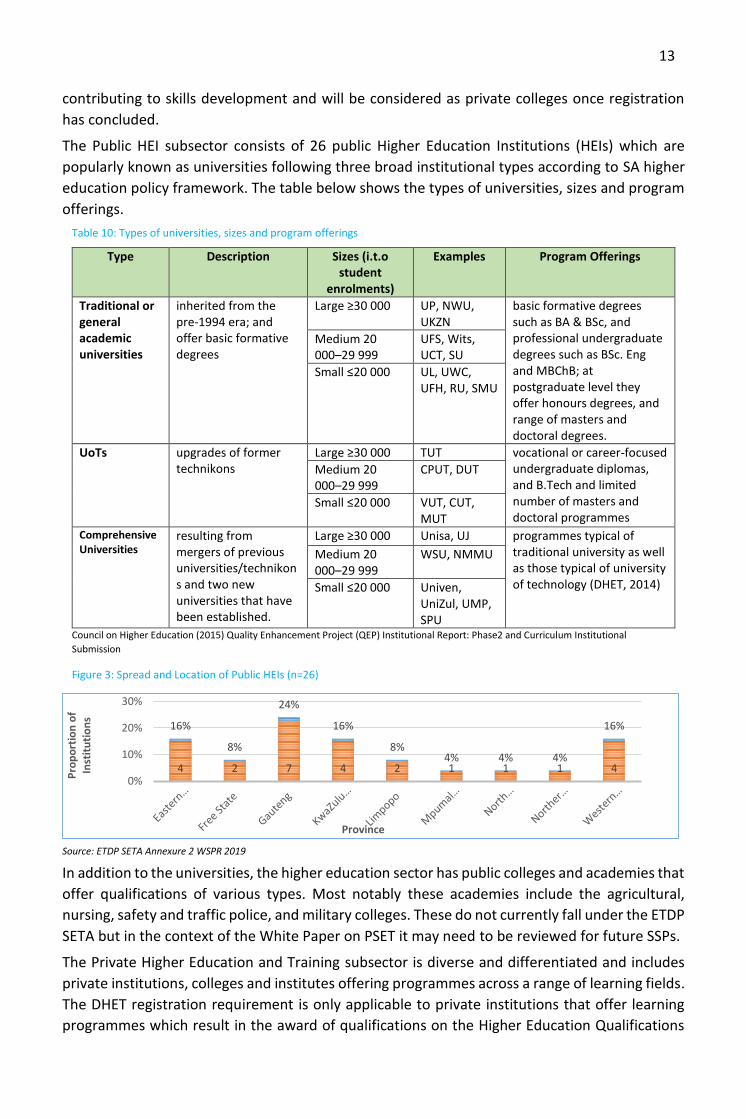
13
contributing to skills development and will be considered as private colleges once registration
has concluded.
The Public HEI subsector consists of 26 public Higher Education Institutions (HEIs) which are
popularly known as universities following three broad institutional types according to SA higher
education policy framework. The table below shows the types of universities, sizes and program
offerings.
Table 10: Types of universities, sizes and program offerings
Council on Higher Education (2015) Quality Enhancement Project (QEP) Institutional Report: Phase2 and Curriculum Institutional
Submission
Figure 3: Spread and Location of Public HEIs (n=26)
Source: ETDP SETA Annexure 2 WSPR 2019
In addition to the universities, the higher education sector has public colleges and academies that
offer qualifications of various types. Most notably these academies include the agricultural,
nursing, safety and traffic police, and military colleges. These do not currently fall under the ETDP
SETA but in the context of the White Paper on PSET it may need to be reviewed for future SSPs.
The Private Higher Education and Training subsector is diverse and differentiated and includes
private institutions, colleges and institutes offering programmes across a range of learning fields.
The DHET registration requirement is only applicable to private institutions that offer learning
programmes which result in the award of qualifications on the Higher Education Qualifications
16%
8%
24%
16%
8%4% 4% 4%
16%
4 2 7 4 2 1 1 1 40%
10%
20%
30%
Pro
po
rtio
n o
f In
stit
uti
on
s
Province
Type Description Sizes (i.t.o student
enrolments)
Examples Program Offerings
Traditional or general academic universities
inherited from the pre-1994 era; and offer basic formative degrees
Large ≥30 000 UP, NWU, UKZN
basic formative degrees such as BA & BSc, and professional undergraduate degrees such as BSc. Eng and MBChB; at postgraduate level they offer honours degrees, and range of masters and doctoral degrees.
Medium 20 000–29 999
UFS, Wits, UCT, SU
Small ≤20 000 UL, UWC, UFH, RU, SMU
UoTs
upgrades of former technikons
Large ≥30 000 TUT vocational or career-focused undergraduate diplomas, and B.Tech and limited number of masters and doctoral programmes
Medium 20 000–29 999
CPUT, DUT
Small ≤20 000 VUT, CUT, MUT
Comprehensive Universities
resulting from mergers of previous universities/technikons and two new universities that have been established.
Large ≥30 000 Unisa, UJ programmes typical of traditional university as well as those typical of university of technology (DHET, 2014)
Medium 20 000–29 999
WSU, NMMU
Small ≤20 000 Univen, UniZul, UMP, SPU
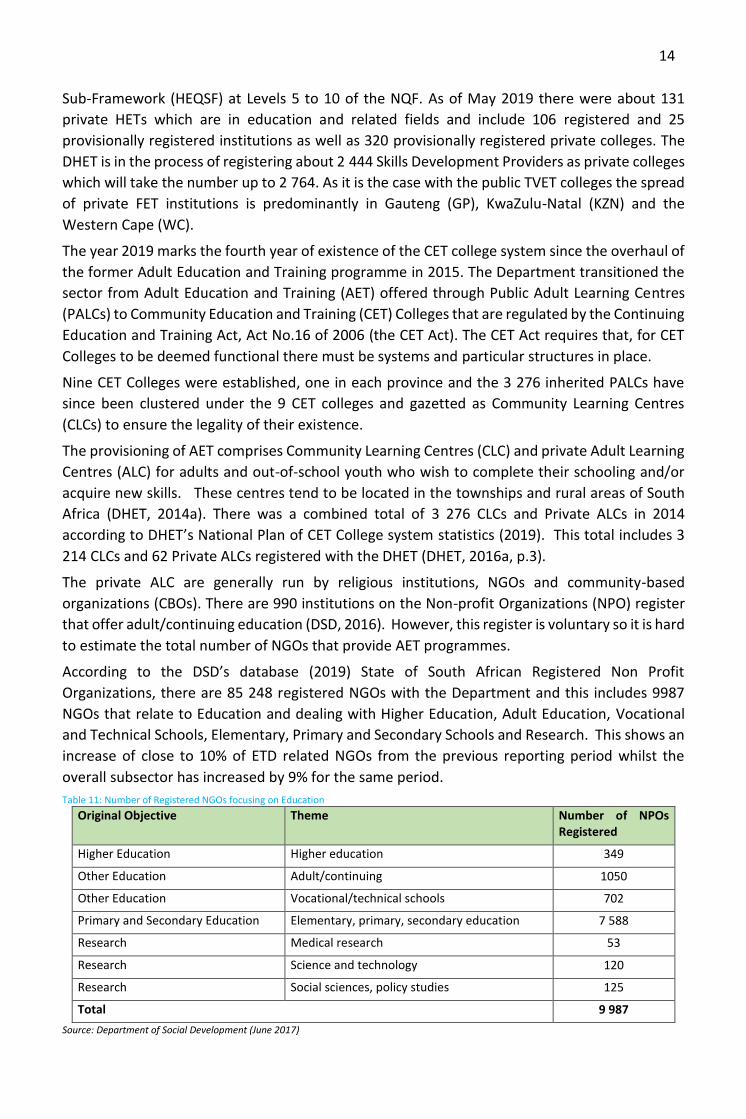
14
Sub-Framework (HEQSF) at Levels 5 to 10 of the NQF. As of May 2019 there were about 131
private HETs which are in education and related fields and include 106 registered and 25
provisionally registered institutions as well as 320 provisionally registered private colleges. The
DHET is in the process of registering about 2 444 Skills Development Providers as private colleges
which will take the number up to 2 764. As it is the case with the public TVET colleges the spread
of private FET institutions is predominantly in Gauteng (GP), KwaZulu-Natal (KZN) and the
Western Cape (WC).
The year 2019 marks the fourth year of existence of the CET college system since the overhaul of
the former Adult Education and Training programme in 2015. The Department transitioned the
sector from Adult Education and Training (AET) offered through Public Adult Learning Centres
(PALCs) to Community Education and Training (CET) Colleges that are regulated by the Continuing
Education and Training Act, Act No.16 of 2006 (the CET Act). The CET Act requires that, for CET
Colleges to be deemed functional there must be systems and particular structures in place.
Nine CET Colleges were established, one in each province and the 3 276 inherited PALCs have
since been clustered under the 9 CET colleges and gazetted as Community Learning Centres
(CLCs) to ensure the legality of their existence.
The provisioning of AET comprises Community Learning Centres (CLC) and private Adult Learning
Centres (ALC) for adults and out-of-school youth who wish to complete their schooling and/or
acquire new skills. These centres tend to be located in the townships and rural areas of South
Africa (DHET, 2014a). There was a combined total of 3 276 CLCs and Private ALCs in 2014
according to DHET’s National Plan of CET College system statistics (2019). This total includes 3
214 CLCs and 62 Private ALCs registered with the DHET (DHET, 2016a, p.3).
The private ALC are generally run by religious institutions, NGOs and community-based
organizations (CBOs). There are 990 institutions on the Non-profit Organizations (NPO) register
that offer adult/continuing education (DSD, 2016). However, this register is voluntary so it is hard
to estimate the total number of NGOs that provide AET programmes.
According to the DSD’s database (2019) State of South African Registered Non Profit
Organizations, there are 85 248 registered NGOs with the Department and this includes 9987
NGOs that relate to Education and dealing with Higher Education, Adult Education, Vocational
and Technical Schools, Elementary, Primary and Secondary Schools and Research. This shows an
increase of close to 10% of ETD related NGOs from the previous reporting period whilst the
overall subsector has increased by 9% for the same period.
Table 11: Number of Registered NGOs focusing on Education
Original Objective Theme Number of NPOs Registered
Higher Education Higher education 349
Other Education Adult/continuing 1050
Other Education Vocational/technical schools 702
Primary and Secondary Education Elementary, primary, secondary education 7 588
Research Medical research 53
Research Science and technology 120
Research Social sciences, policy studies 125
Total 9 987
Source: Department of Social Development (June 2017)

15
The employer profile of research organizations in the ETD subsector is difficult to ascertain as
data available from research databases is not structured in terms of the SETA landscape and
demarcation. Table 12 below shows the number of research organizations which are recognized
by the National Research Foundation (NRF). The NRF was established as an independent
government agency, through the National Research Foundation Act (Act No 23 of 1998).
Table 12: List of NRF-Recognized Research Institutions
Universities Research Councils
National Facilities and Research Institutions
Museums Other entities that conducts research as part of their mandate
Total
Number 23 5 13 8 11 60
The Library Information and Archival Services comprises national and provincial library and
archival institutions, most of which are in the public sphere. According to the DAC & NCLIS (2015),
there are six main categories of libraries as depicted in Figure 4. The DAC & NCLIS (2015)
indicates, South Africa has more than 11 374 libraries, comprising 77 Higher Education libraries,
9 416 school libraries, 79 government departmental libraries, one national library with two
branches, SA library for the blind, and 1800 public libraries provided by provincial governments.
Source: DAC & NCLIS: The State of Libraries in South Africa 2019
The National Archives and Records Service of South Africa (NARSSA) is a key public entity under
the Department of Arts and Culture and its records originate mainly from national, provincial and
local government. There are nine provincial archives and records services as illustrated in Figure
5. Figure 5: Archives and Record Service of South Africa
According to SEIFSA (2019), the Trade Union subsector has 253 unions. There are five main
Federations namely; Confederation of South African Workers Unions (CONSAWU), Congress of
National Archives and Record Service of South Arica
National Archives and Records
Service DirectorateState Herald
Records Management and
Information Systems
Archival ServicesNational Film, Video and Sound Archives
Coordination
KZN LP KZN WC NC EC MP NW FS
Operates as a Programme within the Dept of Arts and Culture
Operates under Provincial Departments
National Archivist
Director Director
Provincial archives repositories and record centres
Figure 4: Number of Library Institutions according to Category (n=11 374)
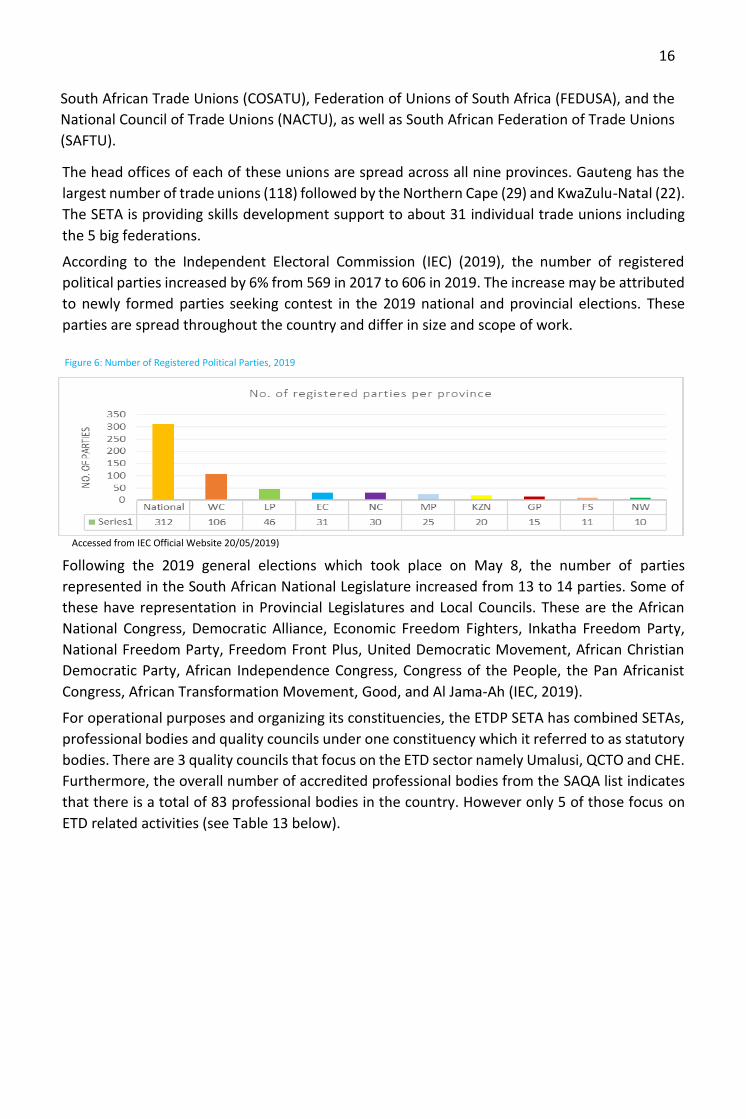
16
South African Trade Unions (COSATU), Federation of Unions of South Africa (FEDUSA), and the
National Council of Trade Unions (NACTU), as well as South African Federation of Trade Unions
(SAFTU).
The head offices of each of these unions are spread across all nine provinces. Gauteng has the
largest number of trade unions (118) followed by the Northern Cape (29) and KwaZulu-Natal (22).
The SETA is providing skills development support to about 31 individual trade unions including
the 5 big federations.
According to the Independent Electoral Commission (IEC) (2019), the number of registered
political parties increased by 6% from 569 in 2017 to 606 in 2019. The increase may be attributed
to newly formed parties seeking contest in the 2019 national and provincial elections. These
parties are spread throughout the country and differ in size and scope of work.
Accessed from IEC Official Website 20/05/2019)
Following the 2019 general elections which took place on May 8, the number of parties
represented in the South African National Legislature increased from 13 to 14 parties. Some of
these have representation in Provincial Legislatures and Local Councils. These are the African
National Congress, Democratic Alliance, Economic Freedom Fighters, Inkatha Freedom Party,
National Freedom Party, Freedom Front Plus, United Democratic Movement, African Christian
Democratic Party, African Independence Congress, Congress of the People, the Pan Africanist
Congress, African Transformation Movement, Good, and Al Jama-Ah (IEC, 2019).
For operational purposes and organizing its constituencies, the ETDP SETA has combined SETAs,
professional bodies and quality councils under one constituency which it referred to as statutory
bodies. There are 3 quality councils that focus on the ETD sector namely Umalusi, QCTO and CHE.
Furthermore, the overall number of accredited professional bodies from the SAQA list indicates
that there is a total of 83 professional bodies in the country. However only 5 of those focus on
ETD related activities (see Table 13 below).
Figure 6: Number of Registered Political Parties, 2019
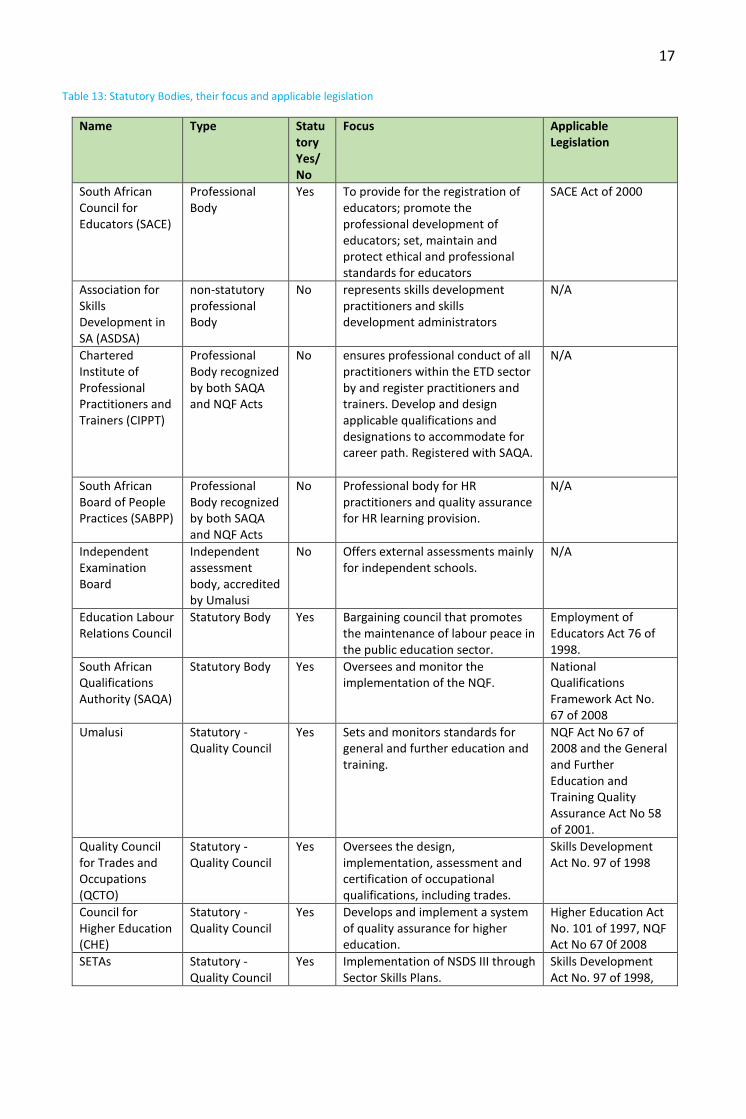
17
Table 13: Statutory Bodies, their focus and applicable legislation
Name Type Statutory Yes/No
Focus Applicable Legislation
South African Council for Educators (SACE)
Professional Body
Yes To provide for the registration of educators; promote the professional development of educators; set, maintain and protect ethical and professional standards for educators
SACE Act of 2000
Association for Skills Development in SA (ASDSA)
non-statutory professional Body
No represents skills development practitioners and skills development administrators
N/A
Chartered Institute of Professional Practitioners and Trainers (CIPPT)
Professional Body recognized by both SAQA and NQF Acts
No ensures professional conduct of all practitioners within the ETD sector by and register practitioners and trainers. Develop and design applicable qualifications and designations to accommodate for career path. Registered with SAQA.
N/A
South African Board of People Practices (SABPP)
Professional Body recognized by both SAQA and NQF Acts
No Professional body for HR practitioners and quality assurance for HR learning provision.
N/A
Independent Examination Board
Independent assessment body, accredited by Umalusi
No Offers external assessments mainly for independent schools.
N/A
Education Labour Relations Council
Statutory Body Yes Bargaining council that promotes the maintenance of labour peace in the public education sector.
Employment of Educators Act 76 of 1998.
South African Qualifications Authority (SAQA)
Statutory Body Yes Oversees and monitor the implementation of the NQF.
National Qualifications Framework Act No. 67 of 2008
Umalusi Statutory - Quality Council
Yes Sets and monitors standards for general and further education and training.
NQF Act No 67 of 2008 and the General and Further Education and Training Quality Assurance Act No 58 of 2001.
Quality Council for Trades and Occupations (QCTO)
Statutory - Quality Council
Yes Oversees the design, implementation, assessment and certification of occupational qualifications, including trades.
Skills Development Act No. 97 of 1998
Council for Higher Education (CHE)
Statutory - Quality Council
Yes Develops and implement a system of quality assurance for higher education.
Higher Education Act No. 101 of 1997, NQF Act No 67 0f 2008
SETAs Statutory - Quality Council
Yes Implementation of NSDS III through Sector Skills Plans.
Skills Development Act No. 97 of 1998,
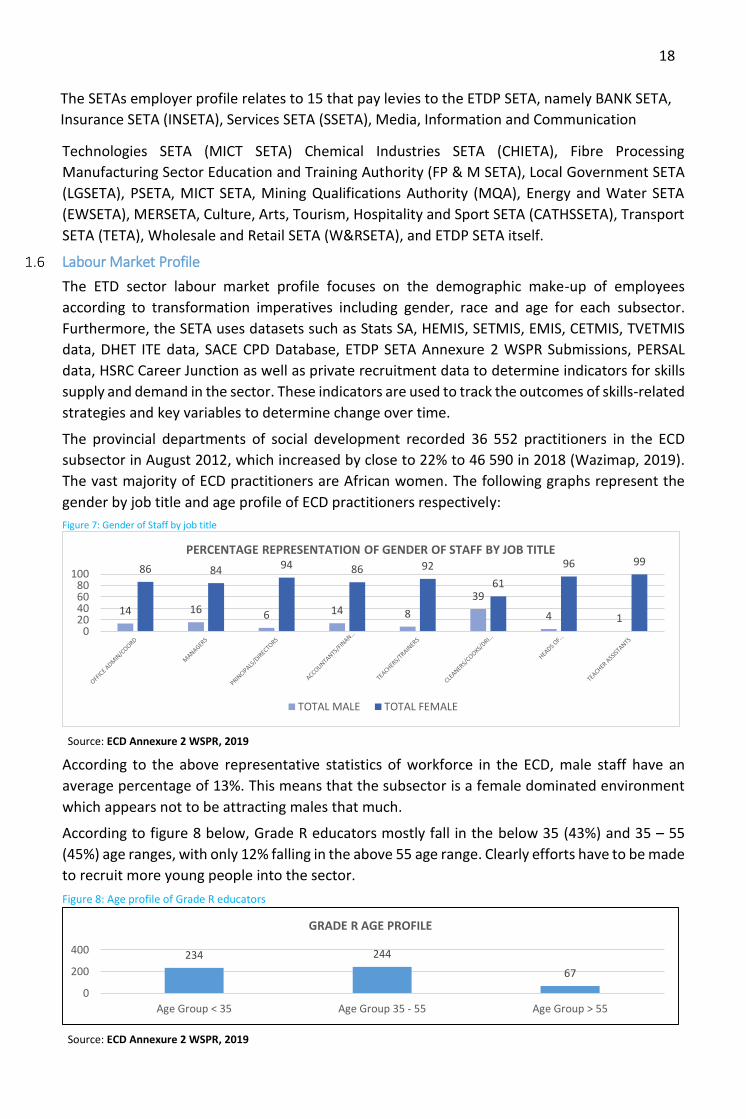
18
The SETAs employer profile relates to 15 that pay levies to the ETDP SETA, namely BANK SETA,
Insurance SETA (INSETA), Services SETA (SSETA), Media, Information and Communication
Technologies SETA (MICT SETA) Chemical Industries SETA (CHIETA), Fibre Processing
Manufacturing Sector Education and Training Authority (FP & M SETA), Local Government SETA
(LGSETA), PSETA, MICT SETA, Mining Qualifications Authority (MQA), Energy and Water SETA
(EWSETA), MERSETA, Culture, Arts, Tourism, Hospitality and Sport SETA (CATHSSETA), Transport
SETA (TETA), Wholesale and Retail SETA (W&RSETA), and ETDP SETA itself.
Labour Market Profile
The ETD sector labour market profile focuses on the demographic make-up of employees
according to transformation imperatives including gender, race and age for each subsector.
Furthermore, the SETA uses datasets such as Stats SA, HEMIS, SETMIS, EMIS, CETMIS, TVETMIS
data, DHET ITE data, SACE CPD Database, ETDP SETA Annexure 2 WSPR Submissions, PERSAL
data, HSRC Career Junction as well as private recruitment data to determine indicators for skills
supply and demand in the sector. These indicators are used to track the outcomes of skills-related
strategies and key variables to determine change over time.
The provincial departments of social development recorded 36 552 practitioners in the ECD
subsector in August 2012, which increased by close to 22% to 46 590 in 2018 (Wazimap, 2019).
The vast majority of ECD practitioners are African women. The following graphs represent the
gender by job title and age profile of ECD practitioners respectively:
Figure 7: Gender of Staff by job title
Source: ECD Annexure 2 WSPR, 2019
According to the above representative statistics of workforce in the ECD, male staff have an
average percentage of 13%. This means that the subsector is a female dominated environment
which appears not to be attracting males that much.
According to figure 8 below, Grade R educators mostly fall in the below 35 (43%) and 35 – 55
(45%) age ranges, with only 12% falling in the above 55 age range. Clearly efforts have to be made
to recruit more young people into the sector.
Figure 8: Age profile of Grade R educators
Source: ECD Annexure 2 WSPR, 2019
14 16 6 14 8
39
4 1
86 84 94 86 92
61
96 99
020406080
100
PERCENTAGE REPRESENTATION OF GENDER OF STAFF BY JOB TITLE
TOTAL MALE TOTAL FEMALE
234 244
67
0
200
400
Age Group < 35 Age Group 35 - 55 Age Group > 55
GRADE R AGE PROFILE

19
Table 14 below shows the number of public and independent educators in ordinary schools from
2014-2018 according to provinces. Between 2014- 2018 the numbers of educators have grown
from 390608 to 398789 (2% increase) in the public schools and from 34 482 to 38 660 (12%
increase) in the independent schools. KZN has the highest number of public school educators (90
288 in 2018) followed by Gauteng (69 180) and the EC (59 324). It is worth noting that while KZN
also dominates in the number of public schools and the number of learners, GP only comes
second in the number of educators and learners but with a less number of schools compared to
LP which has more schools with less learners and educators. On the other side GP owns 52% (20
062) of the total number of independent school educators, followed by the WC with 12% (4 785)
and KZN with 9% (3 590) in 2018. NC has the least number of teaching staff in both public and
independent schools.
Table 14: Number of Public and Independent Educators in Ordinary Schools, 2014-2018
Province Public School Educators Independent School Educators
2014 2015 2016 2017 2018 2014 2015 2016 2017 2018
EC 61260 61147 58372 60324 59324 2 998 3 109 3 257 3135 3 289
FS 23631 22 632 22 465 22601 22640 921 1 029 1 058 989 1 101
GP 60782 61597 63092 71263 69180 16 483 17 757 18 986 17336 20062
KZN 90497 81638 84 810 90561 90 288 5 063 4 855 4 989 2779 3590
LP 54704 53310 51650 50 825 51 640 2 552 2 620 2 768 2911 3089
MP 33 613 33461 34034 33294 33 681 1 387 1 692 370 1 252 1144
NC 8 880 8 826 8 841 10091 10227 302 336 295 142 376
NW 25004 24116 24876 27054 26128 1 082 1 010 1 232 1178 1224
WC 32237 32 886 33254 33143 35681 3 694 4 072 4 264 4 442 4785
SA 390608 379613 381394 399156 398789 34 482 36 480 37 219 34164 38 660
Source: DBE: School Realities 2014 - 2018
The data in Figure 9 shows the age range of South African teachers. There seems to be a
concerning number of teachers entering the retirement zone, especially in the KZN, LP and GP
PDEs. This means that these provinces need to be aggressive in the recruitment of young teachers
who will replace the aging workforce as they will soon be exiting the system.
Figure 9: Age range of educators
Source: PERSAL data, as at March 2017
Table 15: Public School Educators by Gender and Race per Province
PROVINCE AFRICAN ASIAN COLOURED WHITE GRAND TOTAL %
Eastern Cape
44 847 255 3 422 3 110 51 634 13,55%
0
10000
20000
30000
40000
EC FS GP KZN LP MP NW NC WC
Age Range of Educators
20-29YRS 30-39YRS 40-49YRS 50-59YRS 60-69YRS

20
PROVINCE AFRICAN ASIAN COLOURED WHITE GRAND TOTAL %
Female 32 489 169 2 186 2 378 37 222 9,77%
Male 12 358 86 1 236 732 14 412 3,78%
Free State 18 389 12 440 3 522 22 363 5,87%
Female 12 671 10 294 2 697 15 672 4,11%
Male 5 718 2 146 825 6 691 1,76%
Gauteng 47 808 1 878 2 136 14 230 66 052 17,34%
Female 34 549 1 528 1 506 11 305 48 888 12,83%
Male 13 259 350 630 2 925 17 164 4,50%
KwaZulu/Natal 81 503 8 476 860 2 641 93 480 24,53%
Female 59 477 6 173 652 2 148 68 450 17,97%
Male 22 026 2 303 208 493 25 030 6,57%
Limpopo Province 48 915 39 16 1 022 49 992 13,12%
Female 29 684 22 9 765 30 480 8,00%
Male 19 231 17 7 257 19 512 5,12%
Mpumalanga 28 749 164 84 2 796 31 793 8,34%
Female 19 073 99 58 2 150 21 380 5,61%
Male 9 676 65 26 646 10 413 2,73%
North West 21 927 110 231 2 635 24 903 6,54%
Female 15 556 69 146 2 044 17 815 4,68%
Male 6 371 41 85 591 7 088 1,86%
Northern Cape 4 383 10 4 178 1 277 9 848 2,58%
Female 3 080 6 2 836 1 007 6 929 1,82%
Male 1 303 4 1 342 270 2 919 0,77%
Western Cape 7 179 137 17 160 6 469 30 945 8,12%
Female 5 277 99 11 337 4 837 21 550 5,66%
Male 1 902 38 5 823 1 632 9 395 2,47%
Grand Total 303 700 11 081 28 527 37 702 381 010
Total % 79,7% 2,9% 7,5% 9,9% 100% Source: PERSAL data, as at March 2017
About 79.7% of public school educators are Africans, followed by Whites (9.9%), Coloureds (7.5%)
and Asians (2.9%) (DHET, 2017). The highest population of African educators are from KwaZulu-
Natal (81 503), Limpopo (48 15), Gauteng (47 808) and Eastern Cape (44 847). The Western Cape
and Northern Cape have the least number of African educators. The Western Cape (6 469) is
second after Gauteng (14 230) to have a large number of White educators, while Limpopo (1 022)
and Northern Cape (1 277) had few White educators. A large group of Coloured educators are
from the Western Cape (17 160) whilst the province with least number of Coloured educators is
Limpopo (16). Most of the Asian educators are from KwaZulu-Natal (8 476) and Gauteng (1 878)
whilst the least are in the Free State (12) and Northern Cape (10).
The majority of educators fall in the category of REQV 14 (57.8%) which accounts for 220 205
educators, REQV 13 (15%) and REQV 15 (16%). REQV 14 is an entry level into the teaching
profession as it equates to a four-year teaching degree. However, the system still has a sizeable
number of teachers with REQV 13 especially from the older staff. Research shows that in June
2018 women made up 72.5% of state-paid teachers, but only 37.3% are principals (Nuraan, 2018
and Chech, 2018).
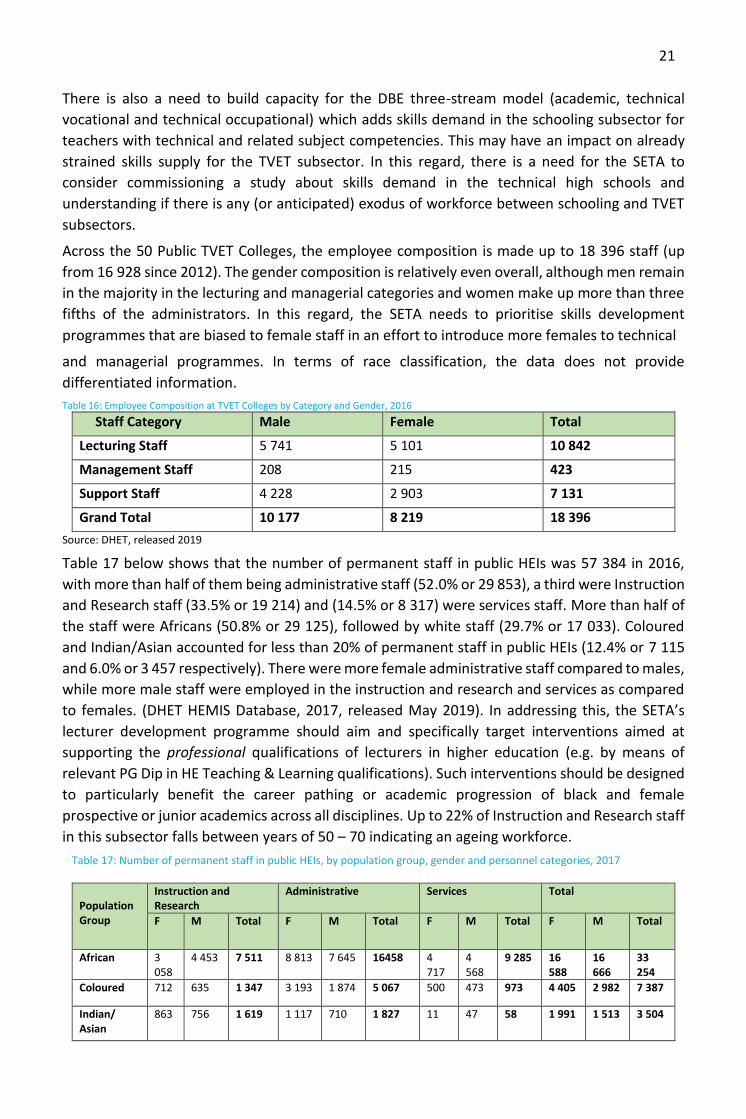
21
There is also a need to build capacity for the DBE three-stream model (academic, technical
vocational and technical occupational) which adds skills demand in the schooling subsector for
teachers with technical and related subject competencies. This may have an impact on already
strained skills supply for the TVET subsector. In this regard, there is a need for the SETA to
consider commissioning a study about skills demand in the technical high schools and
understanding if there is any (or anticipated) exodus of workforce between schooling and TVET
subsectors.
Across the 50 Public TVET Colleges, the employee composition is made up to 18 396 staff (up
from 16 928 since 2012). The gender composition is relatively even overall, although men remain
in the majority in the lecturing and managerial categories and women make up more than three
fifths of the administrators. In this regard, the SETA needs to prioritise skills development
programmes that are biased to female staff in an effort to introduce more females to technical
and managerial programmes. In terms of race classification, the data does not provide
differentiated information.
Table 16: Employee Composition at TVET Colleges by Category and Gender, 2016
Staff Category Male Female Total
Lecturing Staff 5 741 5 101 10 842
Management Staff 208 215 423
Support Staff 4 228 2 903 7 131
Grand Total 10 177 8 219 18 396
Source: DHET, released 2019
Table 17 below shows that the number of permanent staff in public HEIs was 57 384 in 2016,
with more than half of them being administrative staff (52.0% or 29 853), a third were Instruction
and Research staff (33.5% or 19 214) and (14.5% or 8 317) were services staff. More than half of
the staff were Africans (50.8% or 29 125), followed by white staff (29.7% or 17 033). Coloured
and Indian/Asian accounted for less than 20% of permanent staff in public HEIs (12.4% or 7 115
and 6.0% or 3 457 respectively). There were more female administrative staff compared to males,
while more male staff were employed in the instruction and research and services as compared
to females. (DHET HEMIS Database, 2017, released May 2019). In addressing this, the SETA’s
lecturer development programme should aim and specifically target interventions aimed at
supporting the professional qualifications of lecturers in higher education (e.g. by means of
relevant PG Dip in HE Teaching & Learning qualifications). Such interventions should be designed
to particularly benefit the career pathing or academic progression of black and female
prospective or junior academics across all disciplines. Up to 22% of Instruction and Research staff
in this subsector falls between years of 50 – 70 indicating an ageing workforce.
Table 17: Number of permanent staff in public HEIs, by population group, gender and personnel categories, 2017
Population Group
Instruction and Research
Administrative Services Total
F M Total F M Total F M Total F M Total
African 3 058
4 453 7 511 8 813 7 645 16458 4 717
4 568
9 285 16 588
16 666
33 254
Coloured 712 635 1 347 3 193 1 874 5 067 500 473 973 4 405 2 982 7 387
Indian/ Asian
863 756 1 619 1 117 710 1 827 11 47 58 1 991 1 513 3 504
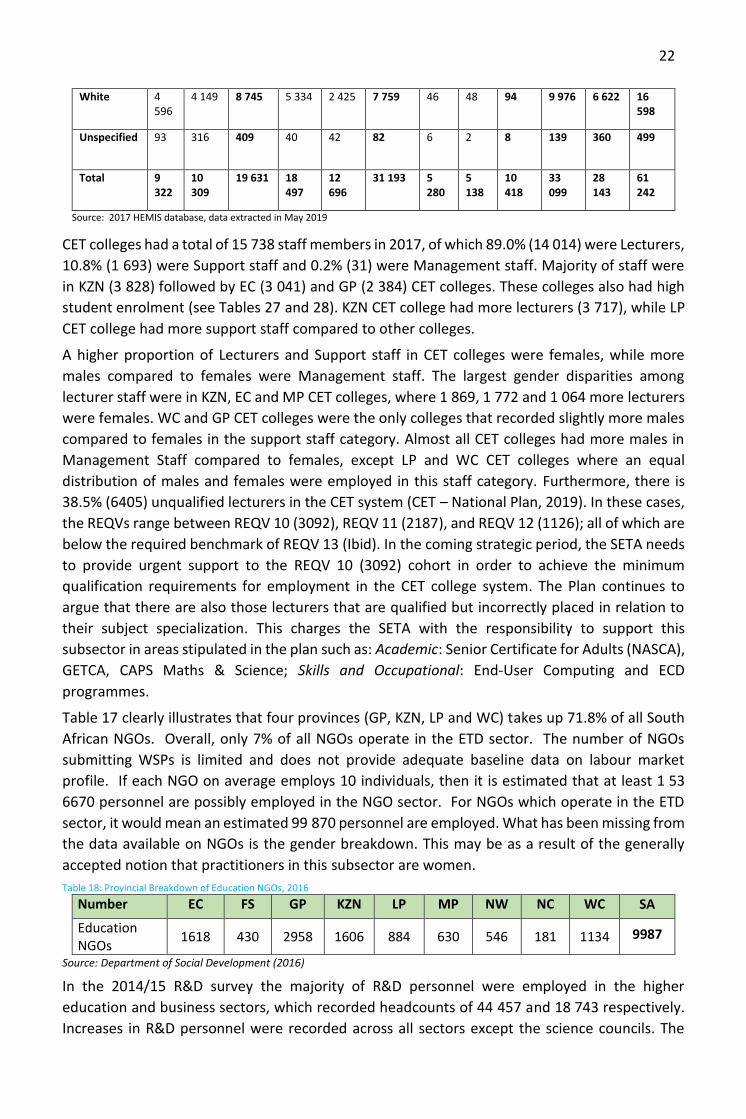
22
Source: 2017 HEMIS database, data extracted in May 2019
CET colleges had a total of 15 738 staff members in 2017, of which 89.0% (14 014) were Lecturers,
10.8% (1 693) were Support staff and 0.2% (31) were Management staff. Majority of staff were
in KZN (3 828) followed by EC (3 041) and GP (2 384) CET colleges. These colleges also had high
student enrolment (see Tables 27 and 28). KZN CET college had more lecturers (3 717), while LP
CET college had more support staff compared to other colleges.
A higher proportion of Lecturers and Support staff in CET colleges were females, while more
males compared to females were Management staff. The largest gender disparities among
lecturer staff were in KZN, EC and MP CET colleges, where 1 869, 1 772 and 1 064 more lecturers
were females. WC and GP CET colleges were the only colleges that recorded slightly more males
compared to females in the support staff category. Almost all CET colleges had more males in
Management Staff compared to females, except LP and WC CET colleges where an equal
distribution of males and females were employed in this staff category. Furthermore, there is
38.5% (6405) unqualified lecturers in the CET system (CET – National Plan, 2019). In these cases,
the REQVs range between REQV 10 (3092), REQV 11 (2187), and REQV 12 (1126); all of which are
below the required benchmark of REQV 13 (Ibid). In the coming strategic period, the SETA needs
to provide urgent support to the REQV 10 (3092) cohort in order to achieve the minimum
qualification requirements for employment in the CET college system. The Plan continues to
argue that there are also those lecturers that are qualified but incorrectly placed in relation to
their subject specialization. This charges the SETA with the responsibility to support this
subsector in areas stipulated in the plan such as: Academic: Senior Certificate for Adults (NASCA),
GETCA, CAPS Maths & Science; Skills and Occupational: End-User Computing and ECD
programmes.
Table 17 clearly illustrates that four provinces (GP, KZN, LP and WC) takes up 71.8% of all South
African NGOs. Overall, only 7% of all NGOs operate in the ETD sector. The number of NGOs
submitting WSPs is limited and does not provide adequate baseline data on labour market
profile. If each NGO on average employs 10 individuals, then it is estimated that at least 1 53
6670 personnel are possibly employed in the NGO sector. For NGOs which operate in the ETD
sector, it would mean an estimated 99 870 personnel are employed. What has been missing from
the data available on NGOs is the gender breakdown. This may be as a result of the generally
accepted notion that practitioners in this subsector are women.
Table 18: Provincial Breakdown of Education NGOs, 2016
Number EC FS GP KZN LP MP NW NC WC SA
Education NGOs
1618 430 2958 1606 884 630 546 181 1134 9987
Source: Department of Social Development (2016)
In the 2014/15 R&D survey the majority of R&D personnel were employed in the higher
education and business sectors, which recorded headcounts of 44 457 and 18 743 respectively.
Increases in R&D personnel were recorded across all sectors except the science councils. The
White 4 596
4 149 8 745 5 334 2 425 7 759 46 48 94 9 976 6 622 16 598
Unspecified 93 316 409 40 42 82 6 2 8 139 360 499
Total 9 322
10 309
19 631 18 497
12 696
31 193 5 280
5 138
10 418
33 099
28 143
61 242

23
science councils reported a lower R&D personnel headcount of 4 836 in 2014/15 compared to
the 5 884 in 2013/14. The reduction was found to be in the category of ‘other personnel directly
supporting R&D’. Fieldwork investigation revealed that certain science councils had previously
misinterpreted the criteria used to count ‘other personnel’, and had over-reported personnel in
this category. The recorded headcount of R&D personnel in the not-for-profit sector increased
from 1 017 in 2013/14 to 1 471 in 2014/15 owing to R&D entities with large numbers of R&D
personnel participating in the survey for the first time. The government sector headcounts
remained largely unchanged.
Table 19: Trade Union Employer Summary
ETDP SETA, 2019
The Trade Union subsector comprises of two main categories of employees namely Trade Union
employees and Trade Union Office Bearers. An attempt to provide a labour market from the
Annexure 2 WSPR analysis has been made in this submission. According to the analysis the trade
union sector is dominated by males. The majority of employees in the trade union sector are
African. The most popular age group in the sector are employees between 35 to 55 years old –
see Table 19 above.
The Library and Archives subsector is dominated by females mostly holding positions as
managers, librarians, library assistants, clerical staff and support staff. Males dominate the
archivist and technician positions. According to the Archival Platform Report, public archives are
drastically under-capacitated (2016). Newly established archival services like Gauteng, Northern
Union
Number Employed
Male
Female
Age Race
People with
Disability
<35 <35 – 55 >55
African
Coloured
Indian
White
IMATU 119 38 81 23 75 21 50 19 8 42 0
NUM 183 116 67 25 113 45 179 4 0 0 0
PSA 247 100 147 43 159 45 156 25 11 55 1
SAMWU 129 57 72 36 75 18 110 16 3 0 0
HOSPERSA 117 59 58 26 72 19 74 12 10 16 0
DITSELA LABOUR INSTITUTION
15 6 9 0 13 2 12 3 0 0 0
UASA 114 63 51 11 63 40 31 5 7 91 1
AMCU 65 38 9 12 33 2 46 0 0 1 0
PAWUSA 26 11 15 6 16 4 7 18 0 1 0
SADTU 154 51 103 29 109 16 140 10 3 1 0
FEDUSA 11 3 8 1 7 3 6 3 0 2 0
NAPTOSA GP 26 15 11 1 17 8 15 4 1 6 0
NAPTOSA WC 16 5 11 3 9 4 3 7 1 5 0
NAPTOSA (H/O) 26 15 11 1 17 8 15 4 1 6 0
NUMSA 351 203 148 37 259 55 324 23 2 2 0
POPCRU 69 29 40 16 48 5 69 0 0 0 0
NUPSAW 66 37 29 16 33 17 59 5 1 1 0
SACTWU 113 50 63 19 80 14 66 33 12 2 1
Grand Total 1821 881 922 304 1181 318 1347 187 59 225 3

24
Cape and Mpumalanga are reportedly “drastically understaffed” (ibid). In some instances, interns
have been trained to mitigate the impact of shortages.
Figure 10 below depicts the number of seats in Parliament for 14 parties represented in the
National Assembly. Based on this, the key political parties (with 10 and more representatives in
parliament) at a national level can be regarded as the: ANC, DA, EFF, IFP and +FF.
Figure 10: Number of Seats in National Assembly per Political Party (IEC, 2019)
Source: Independent Electoral Commission (IEC, 2019).
In terms of the demographics, based on the analysis of limited number of Annexure 2 WSPR
submissions received from political parties, gender and youth representation is fairly consistent
with that of the country’s demographic profile. The race profile for male employees, is fairly
representative of the national profile, with the female race profile being less representative.
People with disabilities are under-represented in this subsector.
Based on the provisional ETDP SETA data, a total of 10 SETAs submitted their Annexure 2 WSPRs
in 2019/2020. In those that submitted, PSETA is the only one which is categorised as a small
organization (0-49). There are 2 which can be categorized as large organizations (150+) and those
are: MERSETA, and W&R SETA. The rest fall into the medium size (50 – 149) namely: SSETA,
INSETA, LG SETA, FP&M SETA, CATHSSETA, BANK SETA and ETDP SETA.
Conclusion
The ETD sector covers a diverse grouping of employers with approximately 59 948 from both the
private and public sector, each categorized according to 17 SIC codes which cover 14 major
subsectors which includes clusters of economic activity that are cross-cutting. This calls for
engagement among all stakeholders on SIC Codes allocation such as other SETAs, SARS, DHET
and StatsSA etc. There is also a need for a targeted approach to mobilize employers that are not
submitting Annexure 2 WSPRs in order to improve the current 27% (1 062 of 3 882 levy-paying
employers) submission rate and encourage accurate and reliable workplace skills planning data.
This chapter has further shown that the economic performance of the sector is mainly reliant on
government funding and does not generate its own income. Although South Africa subscribes to
a funding framework in which costs are shared among the beneficiaries of university education
(mainly government and students), some of the public higher education institutions have since
established business enterprises aimed at generating revenue for these institutions and the SETA
is currently investigating this issue through public HEI subsector research. The chapter has also
raised an issue around investigating the implications of the move of ECD from DSD to DBE on its
centres, qualifications of practitioners and funding for this sector. The subject of ageing has also
featured as an issue threatening workforce in the ETD generally and especially in the ECD, public
schooling and higher education institutions (specifically on instruction and research). Apart from
efforts to recruit and to encourage young people into these careers, the SETA will also need to

25
consider ways it can contribute to and support career pathing or academic progression of black
and female prospective or junior academics across all disciplines of the previously disadvantaged
as a way of dealing with transformation in the HEI sector. In doing this, it may need to ensure
that lecturer development programme aims specifically at supporting the professional
qualifications of lecturers in higher education (e.g. relevant PG Dip in HE Teaching & Learning
qualifications) takes this into consideration. It also came out that the KZN PDE needs to devise
measures to deal with ageing workforce in schooling on an urgent basis. It also needs to further
probe the decline in learner enrolments in the province (2014 – 2018) both from public (2%) and
independent (32%) schools. It’s been mentioned also that whilst female teachers make
approximately 72,5% of total teacher workforce in public schooling, only 37,3% are principals.
This is a transformation imperative that needs to be addressed using skills development among
other interventions. Furthermore, the chapter has shown that there is a need for the SETA to
consider commissioning a study about skills demand in the technical high schools and
understanding if there is any (or anticipated) exodus of workforce between schooling and TVET
subsectors.
There is also significance for the SETA to go beyond skills needs in the formal but also in the
informal sector with a view to expand ways it can contribute to unemployment.

26
CHAPTER 2: KEY SKILLS CHANGE DRIVERS
2.1 Introduction
There is a myriad of factors that can affect a sector and cause it to move in a particular way.
Factors to consider include, political; economic; socio-cultural; technological; also
legal/legislative, and environmental. This chapter looks at the specific change drivers and policy
frameworks which affect skills demand and supply in the ETD sector. The SETA has used the
individual subsector studies conducted which employed qualitative approach to determine these
factors. These studies have in the main used the framework of a study conducted by the Labour
Market Intelligence Partnership (LMIP), which analysed the current supply of, and demand for,
skills in South Africa (ETDP SETA, 2016). The key approach in deciding which of these identified
factors or drivers will be included in this SSP has been among others, the number of ETD
subsectors it impacts, the size of the subsector, its importance towards the economy and how it
contributes or relate to National Strategies and Plans.
The South African Government has identified the lack of high-level skills as a significant constraint
in the development of a knowledge-based economy.
2.2 Factors affecting skills demand and supply
2.2.1 The Move of Early Childhood Development from Social Development to Basic Education President’s Ramaphosa’s announcement about the move of ECD from DSD to DBE (SONA, 2019),
comes with implications for DBE and the ECD, TVET Colleges, public higher education
institutions and SACE as ETD subsectors. Among others, the implications will be more on ECD
centres, livelihoods and accessibility of caregivers, qualifications of practitioners and funding for
this sector (Peacock, 2019). It is not clear how the move will take place without proper public
consultations since according to Children’s Act 38 of 2005, the responsibility of registering,
supporting and monitoring ECD centres lies with the Department of Social Development.
However, it is important for role players and stakeholders to ready themselves by anticipating
what the move will entail for their respective areas. The DBE in partnerships with the public
higher education institutions and TVET Colleges may need to embark on improving the
qualification levels of ECD practitioners through full qualifications and RPL programmes. SACE
on the other hand is expected to facilitate the professionalization of these practitioners. The
ETDP SETA will also be central in facilitating these processes and also the funding to upskill the
practitioners, caregivers, and managers of the ECD centres.
2.2.2 Adequate Supply and Professionalization of ETD Workforce Mathematics, Science and Technology has proven to be fundamental in influencing any
country’s economy and the fact that South Africa ranks among the lowest performing countries
in terms of mathematics and science achievement scale scores (TIMSS, 2015). This has long-
term impact in that it results to a low number and quality of teachers produced by the system.
In response to this, the SETA provides bursaries to and fund workplace experience for teacher
education students giving priority to those studying towards mathematics and science. This will
ensure that there are sufficiently and adequately trained teachers in these areas. There is also
limited supply of teachers, practitioners and TVET lectures in these areas: Foundation Phase
(African languages), Special Needs and in new technologies such as Mechatronics, Renewable
Energy and nano-technology (ETDP SETA, 2018, p. 54). These inadequate supply of ETD
workforce has greatest of impact in the rural areas of the country. In order to address these

27
challenges, the DHET developed a five-year Teaching and Learning Development Capacity
Improvement Programme 2015 – 2020, aimed at strengthening the quality and capacity of
teacher education programmes for ECD, schooling, TVET colleges, Community Colleges and
university education (DHET, 2016, p. 86). The ETDP SETA plays a critical role in positioning its
skills development initiatives to focus on practitioner/teacher and lecturer development to
ensure quality teaching and learning and commissioned research on Work Integrated Learning
(WIL), qualifications development and RPL in the TVET and ECD sectors.
Another critical factor is the myriad of policies relating to teaching qualification development
and professionalization of the schooling, ECD and TVET sectors as espoused in the following
policies and programmes:
- Minimum Requirement of Teacher Education Qualifications need to address the
inadequate training of Grade R practitioners who do not meet the qualification
requirements relating for the Diploma in Grade R Teaching.
- The introduction of the Policy on Professional Qualifications for TVET is aimed at
addressing TVET lecturers’ lack of teaching qualifications.
- The Professional Teaching Standards by SACE for the schooling sector is the process of
improving the status and standing of teaching, and includes four key professionalising
processes of (i) initial teacher training (ITE), (ii) induction, (iii) registration of teachers,
(iv) continuing professional development (CPD). Whilst the SETA is prioritizing its funding
towards SACE-endorsed programmes aimed at both teachers and TVET College
lecturers, there is still a need for the SETA to engage with SACE to clarify the role the
SETA can play in the complete process of teacher professionalization.
2.2.3 Decline in Union Membership
Between 1990 and 2017, trade union membership has declined from 47% to 28%. This finding is
supported by Wood and Dibben, 2008, who argued that between 2000 to 2017 there has been a
weakening of the union movement as the gap between leaders and members has widened, and
unions’ ability to mobilise members has declined. It could be argued that there has been some
lateral movement from one union to another as seen in the increase in number of the newly
registered unions. Infighting within unions over managerial control of the union has seen union
membership dwindle over the years with disgruntled members opting to form splinter unions
further diluting the bargaining power that unions previously enjoyed. However, the movement
of members does not explain the entire decrease in membership numbers. The weakening of
the union movement may also be indicative to a great extent, of the country’s economic growth
path and rise in unemployment. It is becoming a growing phenomenon that due to the changing
economic circumstances of employees, they choose to accept ‘unprotected’ forms of work, over
paying the union membership fees. The decreasing membership has resulted in fewer union
employees. This is seen in the number of hard to fill vacancies where unions claim that they
cannot fill these vacancies because they can no longer offer these positions. The unions are
forced to prioritise their involvement in discussions as they don’t have the workforce to service
all forums.
What may compound the challenge for unions is a general trend towards decentralised
bargaining at enterprise level and a seeming move towards individualism – where employees

28
prefer to represent themselves on labour matters. The decentralization of bargaining makes it
difficult for the unions (especially for the smaller ones) to ensure effective representation at all
forums because of demands that this places on their resources and the time that it takes to
prepare representatives for the discussions. Since labour is represented in governance and other
structures of various public institutions such as public schools, TVET Colleges, public HEIs, CET
centres, SETAs, quality councils and other statutory bodies as well as in cooperate employers,
improving the skills of more of its representatives (on areas such as governance, policy
development, negotiation and leadership skills, etc.) will improve understanding, transformation
agenda and the working relationship of the unions and the employers in all the sectors especially
the ETD.
2.2.4 The Fourth Industrial Revolution Professor Klaus Schwab (2016), calls the Fourth Industrial Revolution, a range of new
technologies that are fusing the physical, digital and biological worlds, impacting all disciplines,
economies and industries, and even challenging ideas about what it means to be human. South
African educational institutions and workplaces are not immune to the influence of the
Revolution.
The influence and use of technology across educational institutions and workplaces impacts on
trainers/teachers, learners and workers’ ability to teach, learn and acquire skills. In particular, e-
learning, multimedia, social media and technological devices can enhance teaching and learning
situations (Macdonald, 2004). There is a need for skills development interventions which are
tailored to suit the needs of the staff in the context of teaching and learning through technology.
Distance education and online systems are critical across PSET institutions if open learning
platforms are to be used. The SETA needs to discover its role through the determination and
production of more relevant skills in the context of the rapidly increasing online learning and
demand. It can do this by a careful analysis of what the changes are in the labour market as well
as how the ETD labour market will be affected. In response to this, the SETA seeks to establish a
research partnership with one of the universities to further probe the Fourth Industrial Revolution
and its impact on skills development especially in the ETD Sector. Furthermore, the SETA needs
to explore the possibility of accrediting some of the online courses in the ETD and related fields.
2.2.5 Recognition of Prior Learning (RPL) to enhance opportunities for employment
RPL is seen in the SA context as principles and processes through which the prior knowledge
and /or skills of a person are made visible and are assessed for the purposes of certification,
alternative access and admission and future learning and development (QCTO, 2014). It is done
in order to increase access to occupationally-directed programmes for employability. There are
more aging and unqualified staff especially in the ECD sector and Community Development
centres than those that are young joining these sectors. The unqualified staff has experience
but mostly unable to attend formal training aiming at upgrading their qualifications. The SETA
has received significant number of RPL requests from both the ECD and Community
Development practitioners. In response to this the SETA has conducted a study so as to
“understand RPL practices of TVET Colleges that were supported financially by the ETDP SETA….
with the purpose of identifying the best practice model for the RPL that could be used in the
development and implementation of WIL related staff qualifications” (Nduna, 2018, pg.4).
However, based on recent experiences and recommendations of the mentioned research in the
implementation of RPL, the SETA needs to review the RPL rollout and its funding models in order
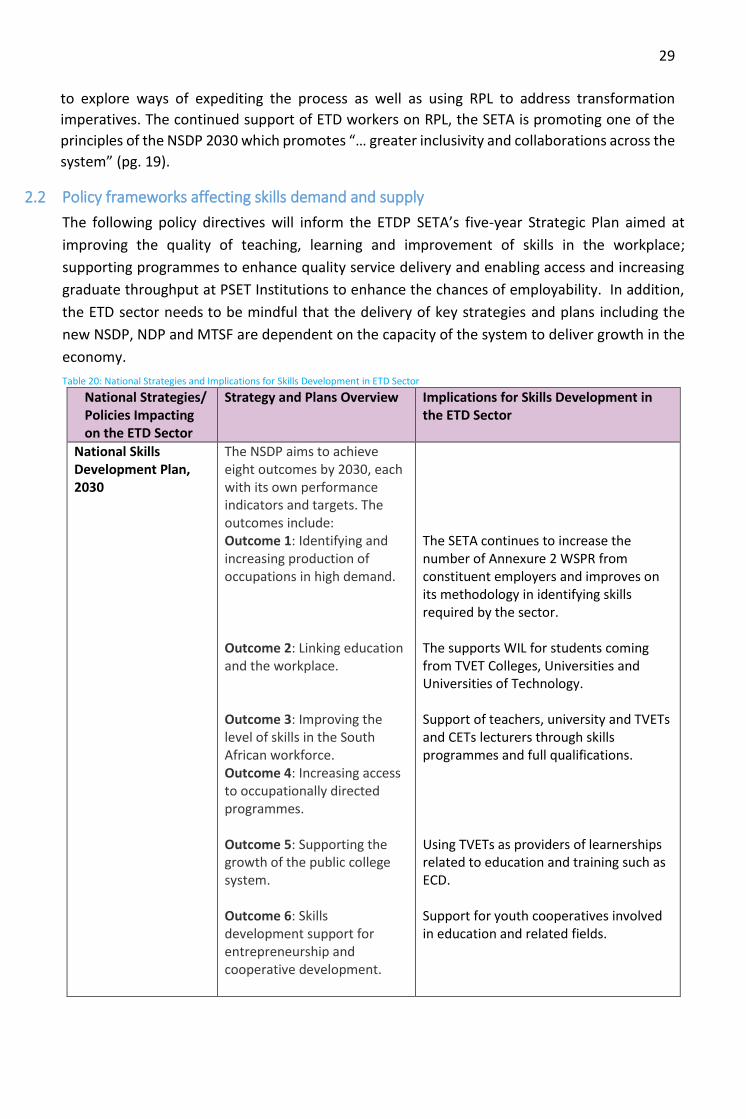
29
to explore ways of expediting the process as well as using RPL to address transformation
imperatives. The continued support of ETD workers on RPL, the SETA is promoting one of the
principles of the NSDP 2030 which promotes “… greater inclusivity and collaborations across the
system” (pg. 19).
2.2 Policy frameworks affecting skills demand and supply
The following policy directives will inform the ETDP SETA’s five-year Strategic Plan aimed at
improving the quality of teaching, learning and improvement of skills in the workplace;
supporting programmes to enhance quality service delivery and enabling access and increasing
graduate throughput at PSET Institutions to enhance the chances of employability. In addition,
the ETD sector needs to be mindful that the delivery of key strategies and plans including the
new NSDP, NDP and MTSF are dependent on the capacity of the system to deliver growth in the
economy.
Table 20: National Strategies and Implications for Skills Development in ETD Sector
National Strategies/ Policies Impacting on the ETD Sector
Strategy and Plans Overview Implications for Skills Development in the ETD Sector
National Skills Development Plan, 2030
The NSDP aims to achieve eight outcomes by 2030, each with its own performance indicators and targets. The outcomes include: Outcome 1: Identifying and increasing production of occupations in high demand. Outcome 2: Linking education and the workplace. Outcome 3: Improving the level of skills in the South African workforce. Outcome 4: Increasing access to occupationally directed programmes. Outcome 5: Supporting the growth of the public college system. Outcome 6: Skills development support for entrepreneurship and cooperative development.
The SETA continues to increase the number of Annexure 2 WSPR from constituent employers and improves on its methodology in identifying skills required by the sector. The supports WIL for students coming from TVET Colleges, Universities and Universities of Technology. Support of teachers, university and TVETs and CETs lecturers through skills programmes and full qualifications. Using TVETs as providers of learnerships related to education and training such as ECD. Support for youth cooperatives involved in education and related fields.

30
National Strategies/ Policies Impacting on the ETD Sector
Strategy and Plans Overview Implications for Skills Development in the ETD Sector
Outcome 7: Encouraging and supporting worker initiated training. Outcome 8: Supporting career development services.
Supporting trade unions as constituent employers of the SETA in areas such as governance. Training and employing Career Guidance Officers (CDOs) into the TVET sector. Developing and distributing Career Guides to all the provinces in the country.
Industrial Policy Action Plan 2018
It is the Government’s policy and plan which has the over-arching objective of enhancing the productive capabilities of the economy. It also seeks to make a concerted effort to ensure that support for investment is integrated with support for transformation.
The implications of the IPAP is to ensure fit-for-purpose qualifications and skills programmes are developed and available to address skills needs and the mastery of new technologies and ultimately design capabilities especially in the manufacturing sector.
The New Growth Path (NGP): Framework.
The strategy that lays out dynamic vision on how South Africa can collectively (business, labour and government) achieve a more developed, democratic, cohesive and equitable economy and society over the medium term, in the context of sustained growth.
Accord 1: National Skills Accord The goals of the National Skills Accord have implications for ETD in terms of strengthening partnerships relating to training teachers and lecturers and placement in the workplace. Accord 2: Basic Education and Partnership with Schools The Accord 2 has implications for the way it works with the DBE to focus on quality education delivery for learners. Accord 5: Employment Accord The implication of the Accord requires relevant programmes to be developed and the SETA has identified specific programmes to place unemployed learners on programmes particularly related to schooling and second chance programme. Furthermore the SETA will continue to support unemployed youth through internships, bursaries, workplace placements, young people with disabilities and widening access to RPL programmes.
Human Resource Development Strategy 2010-2030
The systematic strategy for South Africa which comprises of formal and explicit activities that are aimed at enhancing skills, knowledge and abilities of individuals in order to improve their productivity in their areas of work.
The implications of the HRDS speaks to the shortages of researchers, teachers and lecturers required and increase graduates’ entry into the workforce taking into account race, gender and geographical locations and other transformative imperatives. To address this, the SETA utilizes its research chair programme to
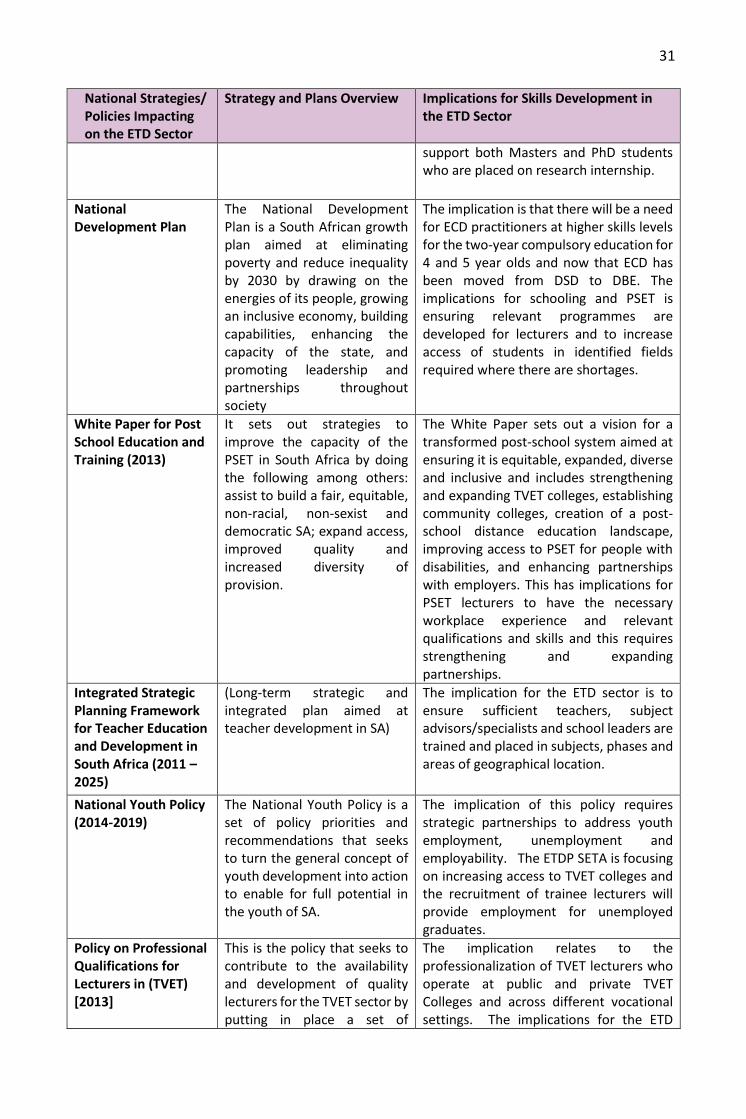
31
National Strategies/ Policies Impacting on the ETD Sector
Strategy and Plans Overview Implications for Skills Development in the ETD Sector
support both Masters and PhD students who are placed on research internship.
National Development Plan
The National Development Plan is a South African growth plan aimed at eliminating poverty and reduce inequality by 2030 by drawing on the energies of its people, growing an inclusive economy, building capabilities, enhancing the capacity of the state, and promoting leadership and partnerships throughout society
The implication is that there will be a need for ECD practitioners at higher skills levels for the two-year compulsory education for 4 and 5 year olds and now that ECD has been moved from DSD to DBE. The implications for schooling and PSET is ensuring relevant programmes are developed for lecturers and to increase access of students in identified fields required where there are shortages.
White Paper for Post School Education and Training (2013)
It sets out strategies to improve the capacity of the PSET in South Africa by doing the following among others: assist to build a fair, equitable, non-racial, non-sexist and democratic SA; expand access, improved quality and increased diversity of provision.
The White Paper sets out a vision for a transformed post-school system aimed at ensuring it is equitable, expanded, diverse and inclusive and includes strengthening and expanding TVET colleges, establishing community colleges, creation of a post-school distance education landscape, improving access to PSET for people with disabilities, and enhancing partnerships with employers. This has implications for PSET lecturers to have the necessary workplace experience and relevant qualifications and skills and this requires strengthening and expanding partnerships.
Integrated Strategic Planning Framework for Teacher Education and Development in South Africa (2011 – 2025)
(Long-term strategic and integrated plan aimed at teacher development in SA)
The implication for the ETD sector is to ensure sufficient teachers, subject advisors/specialists and school leaders are trained and placed in subjects, phases and areas of geographical location.
National Youth Policy (2014-2019)
The National Youth Policy is a set of policy priorities and recommendations that seeks to turn the general concept of youth development into action to enable for full potential in the youth of SA.
The implication of this policy requires strategic partnerships to address youth employment, unemployment and employability. The ETDP SETA is focusing on increasing access to TVET colleges and the recruitment of trainee lecturers will provide employment for unemployed graduates.
Policy on Professional Qualifications for Lecturers in (TVET) [2013]
This is the policy that seeks to contribute to the availability and development of quality lecturers for the TVET sector by putting in place a set of
The implication relates to the professionalization of TVET lecturers who operate at public and private TVET Colleges and across different vocational settings. The implications for the ETD
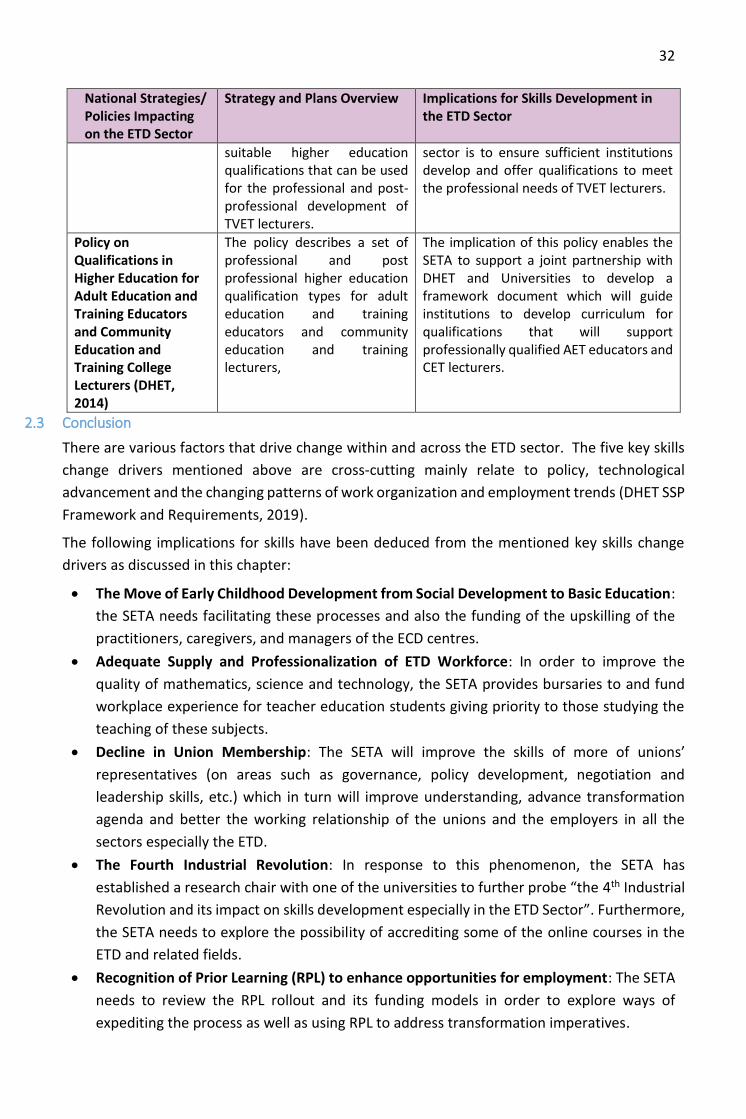
32
National Strategies/ Policies Impacting on the ETD Sector
Strategy and Plans Overview Implications for Skills Development in the ETD Sector
suitable higher education qualifications that can be used for the professional and post-professional development of TVET lecturers.
sector is to ensure sufficient institutions develop and offer qualifications to meet the professional needs of TVET lecturers.
Policy on Qualifications in Higher Education for Adult Education and Training Educators and Community Education and Training College Lecturers (DHET, 2014)
The policy describes a set of professional and post professional higher education qualification types for adult education and training educators and community education and training lecturers,
The implication of this policy enables the SETA to support a joint partnership with DHET and Universities to develop a framework document which will guide institutions to develop curriculum for qualifications that will support professionally qualified AET educators and CET lecturers.
2.3 Conclusion
There are various factors that drive change within and across the ETD sector. The five key skills
change drivers mentioned above are cross-cutting mainly relate to policy, technological
advancement and the changing patterns of work organization and employment trends (DHET SSP
Framework and Requirements, 2019).
The following implications for skills have been deduced from the mentioned key skills change
drivers as discussed in this chapter:
The Move of Early Childhood Development from Social Development to Basic Education:
the SETA needs facilitating these processes and also the funding of the upskilling of the
practitioners, caregivers, and managers of the ECD centres.
Adequate Supply and Professionalization of ETD Workforce: In order to improve the
quality of mathematics, science and technology, the SETA provides bursaries to and fund
workplace experience for teacher education students giving priority to those studying the
teaching of these subjects.
Decline in Union Membership: The SETA will improve the skills of more of unions’
representatives (on areas such as governance, policy development, negotiation and
leadership skills, etc.) which in turn will improve understanding, advance transformation
agenda and better the working relationship of the unions and the employers in all the
sectors especially the ETD.
The Fourth Industrial Revolution: In response to this phenomenon, the SETA has
established a research chair with one of the universities to further probe “the 4th Industrial
Revolution and its impact on skills development especially in the ETD Sector”. Furthermore,
the SETA needs to explore the possibility of accrediting some of the online courses in the
ETD and related fields.
Recognition of Prior Learning (RPL) to enhance opportunities for employment: The SETA
needs to review the RPL rollout and its funding models in order to explore ways of
expediting the process as well as using RPL to address transformation imperatives.
33
This chapter has also discussed the key national strategies and plans which have implications for
skills especially in the ETD sector. The introduction of the new NSDP, 2030 mandated from the
White Paper for Post School Education and Training highlights the trajectory the skills
development agencies should to fulfil the goals of the NDP, 2030 aimed at addressing
transformation within and across educational institutions among other things. Bantwini and
Letseka (2017) state that business leaders and politicians constantly look to education as a means
to building successful economies. All of these skills issues and national strategies require
aggressive focus to increase the pool of human resources to provide relevant skills across all
educational settings including workplaces which will be important for the growth of the
economy.

34
CHAPTER 3: OCCUPATIONAL SHORTAGES AND SKILLS GAPS
3.1 Introduction
According to Keevy, Green and Malik (2014) a stable and well qualified teaching force, aligned to
the needs of the education system, is essential to ensure the effective delivery of quality
education in any country. As a move towards ensuring a well-qualified teaching (including
lecturing and instructional practices) force this chapter explores the occupational shortages and
skills gaps in the ETD sector, in order to identify and understand the occupation-specific Hard-To-
Fill-Vacancies (HTFVs), the extent and nature of supply across the ETD sector. The list of HTFVs
and Skills Gaps identified through Annexure 2 WSPR process were used in a process of developing
the Sectoral Priority Occupations and Interventions (PIVOTAL) list which informs priority
interventions of the SETA for the coming year. However, these were confirmed through a data
triangulation where employers and key informant interviews were utilized.
3.2 Sectoral Occupational Demand
Occupations affected by hard-to-fill vacancies and reasons
Whilst the main reason for the HTFV is related to the period it takes to fill such vacancies, the
causes showed to be related to, amongst others, lack of experience, irrelevant qualifications,
poor remuneration and equity considerations. Prominent in the reasons for the HTFV is the lack
of experience and irrelevant qualifications. According to 2019 Annexure 2 WSPR submissions
data, these reasons were cited mainly by the schooling subsector (both public and independent)
in occupations such as Senior Secondary School Teacher (Grades 10-12) specialising in
Mathematics, Foundation Phase, Physical Science etc. The other reason that was cited by most
of the ETD organizations related to lack of experience, especially when it comes to occupations
like University Lecturer. However, the main reason for the ECD subsector in occupations such
as Early Childhood Development Practitioner, persistently relates to lack of qualifications
upgrade and relevance meant to meet the requirements of the occupation.
Table 21: Hard-To-Fill-Vacancy List
Subsector OFO Code & Occupation
Number
(Shortage) Reasons
AET/ACET 2017-232131 –Adult Education Teacher 92 Lack of relevant experience
and poor remuneration
Early Childhood Development 2017-234201 - Early Childhood
Development Practitioner 220
Lack of relevant qualification
Lack of relevant experience
and poor remuneration
Political Parties
2017- 133105 - Information Technology
Manager 11 Lack of relevant experience
2017-121905-Programme or Project
Manager 15 Lack of relevant experience
Private FETs and HETs
2017-231101 - University Lecturer 118
Lack of relevant
qualification
2017-134502 - FET College Principal 15 Lack of relevant qualification
2017-121101 - Finance Manager 22 Lack of relevant experience
2017-134503 - Faculty Head 34 Lack of relevant experience
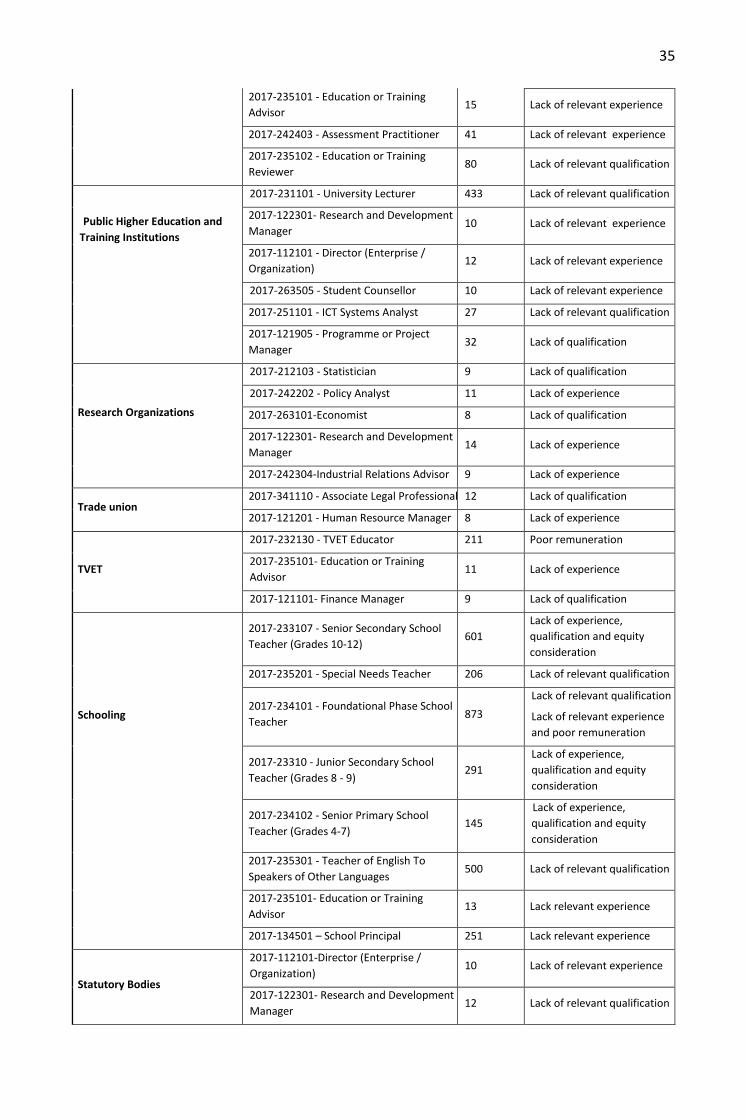
35
2017-235101 - Education or Training
Advisor 15 Lack of relevant experience
2017-242403 - Assessment Practitioner 41 Lack of relevant experience
2017-235102 - Education or Training
Reviewer 80 Lack of relevant qualification
Public Higher Education and
Training Institutions
2017-231101 - University Lecturer 433 Lack of relevant qualification
2017-122301- Research and Development
Manager 10 Lack of relevant experience
2017-112101 - Director (Enterprise /
Organization) 12 Lack of relevant experience
2017-263505 - Student Counsellor 10 Lack of relevant experience
2017-251101 - ICT Systems Analyst 27 Lack of relevant qualification
2017-121905 - Programme or Project
Manager 32 Lack of qualification
Research Organizations
2017-212103 - Statistician 9 Lack of qualification
2017-242202 - Policy Analyst 11 Lack of experience
2017-263101-Economist 8 Lack of qualification
2017-122301- Research and Development
Manager 14 Lack of experience
2017-242304-Industrial Relations Advisor 9 Lack of experience
Trade union 2017-341110 - Associate Legal Professional 12 Lack of qualification
2017-121201 - Human Resource Manager 8 Lack of experience
TVET
2017-232130 - TVET Educator 211 Poor remuneration
2017-235101- Education or Training
Advisor 11 Lack of experience
2017-121101- Finance Manager 9 Lack of qualification
Schooling
2017-233107 - Senior Secondary School
Teacher (Grades 10-12) 601
Lack of experience,
qualification and equity
consideration
2017-235201 - Special Needs Teacher 206 Lack of relevant qualification
2017-234101 - Foundational Phase School
Teacher 873
Lack of relevant qualification
Lack of relevant experience
and poor remuneration
2017-23310 - Junior Secondary School
Teacher (Grades 8 - 9) 291
Lack of experience,
qualification and equity
consideration
2017-234102 - Senior Primary School
Teacher (Grades 4-7) 145
Lack of experience,
qualification and equity
consideration
2017-235301 - Teacher of English To
Speakers of Other Languages 500 Lack of relevant qualification
2017-235101- Education or Training
Advisor 13 Lack relevant experience
2017-134501 – School Principal 251 Lack relevant experience
Statutory Bodies
2017-112101-Director (Enterprise /
Organization) 10 Lack of relevant experience
2017-122301- Research and Development
Manager 12 Lack of relevant qualification
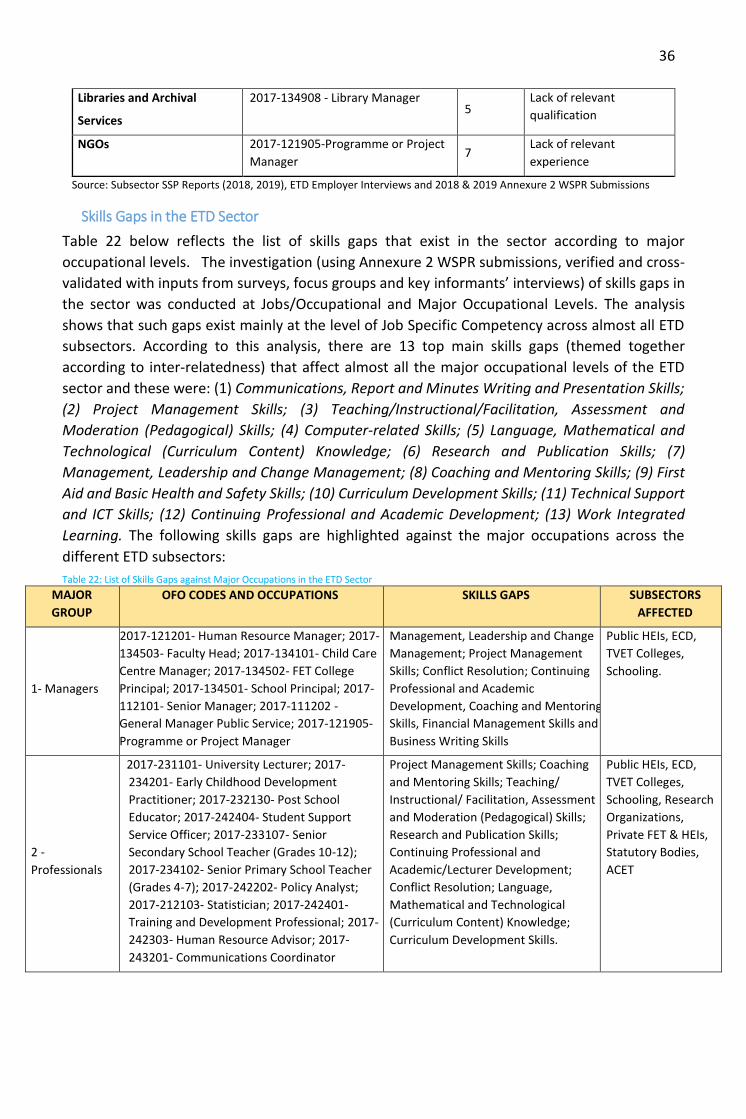
36
Libraries and Archival
Services
2017-134908 - Library Manager 5
Lack of relevant
qualification
NGOs 2017-121905-Programme or Project
Manager 7
Lack of relevant
experience
Source: Subsector SSP Reports (2018, 2019), ETD Employer Interviews and 2018 & 2019 Annexure 2 WSPR Submissions
Skills Gaps in the ETD Sector
Table 22 below reflects the list of skills gaps that exist in the sector according to major
occupational levels. The investigation (using Annexure 2 WSPR submissions, verified and cross-
validated with inputs from surveys, focus groups and key informants’ interviews) of skills gaps in
the sector was conducted at Jobs/Occupational and Major Occupational Levels. The analysis
shows that such gaps exist mainly at the level of Job Specific Competency across almost all ETD
subsectors. According to this analysis, there are 13 top main skills gaps (themed together
according to inter-relatedness) that affect almost all the major occupational levels of the ETD
sector and these were: (1) Communications, Report and Minutes Writing and Presentation Skills;
(2) Project Management Skills; (3) Teaching/Instructional/Facilitation, Assessment and
Moderation (Pedagogical) Skills; (4) Computer-related Skills; (5) Language, Mathematical and
Technological (Curriculum Content) Knowledge; (6) Research and Publication Skills; (7)
Management, Leadership and Change Management; (8) Coaching and Mentoring Skills; (9) First
Aid and Basic Health and Safety Skills; (10) Curriculum Development Skills; (11) Technical Support
and ICT Skills; (12) Continuing Professional and Academic Development; (13) Work Integrated
Learning. The following skills gaps are highlighted against the major occupations across the
different ETD subsectors:
Table 22: List of Skills Gaps against Major Occupations in the ETD Sector
MAJOR
GROUP
OFO CODES AND OCCUPATIONS SKILLS GAPS SUBSECTORS
AFFECTED
1- Managers
2017-121201- Human Resource Manager; 2017-
134503- Faculty Head; 2017-134101- Child Care
Centre Manager; 2017-134502- FET College
Principal; 2017-134501- School Principal; 2017-
112101- Senior Manager; 2017-111202 -
General Manager Public Service; 2017-121905-
Programme or Project Manager
Management, Leadership and Change
Management; Project Management
Skills; Conflict Resolution; Continuing
Professional and Academic
Development, Coaching and Mentoring
Skills, Financial Management Skills and
Business Writing Skills
Public HEIs, ECD,
TVET Colleges,
Schooling.
2 -
Professionals
2017-231101- University Lecturer; 2017-
234201- Early Childhood Development
Practitioner; 2017-232130- Post School
Educator; 2017-242404- Student Support
Service Officer; 2017-233107- Senior
Secondary School Teacher (Grades 10-12);
2017-234102- Senior Primary School Teacher
(Grades 4-7); 2017-242202- Policy Analyst;
2017-212103- Statistician; 2017-242401-
Training and Development Professional; 2017-
242303- Human Resource Advisor; 2017-
243201- Communications Coordinator
Project Management Skills; Coaching
and Mentoring Skills; Teaching/
Instructional/ Facilitation, Assessment
and Moderation (Pedagogical) Skills;
Research and Publication Skills;
Continuing Professional and
Academic/Lecturer Development;
Conflict Resolution; Language,
Mathematical and Technological
(Curriculum Content) Knowledge;
Curriculum Development Skills.
Public HEIs, ECD,
TVET Colleges,
Schooling, Research
Organizations,
Private FET & HEIs,
Statutory Bodies,
ACET
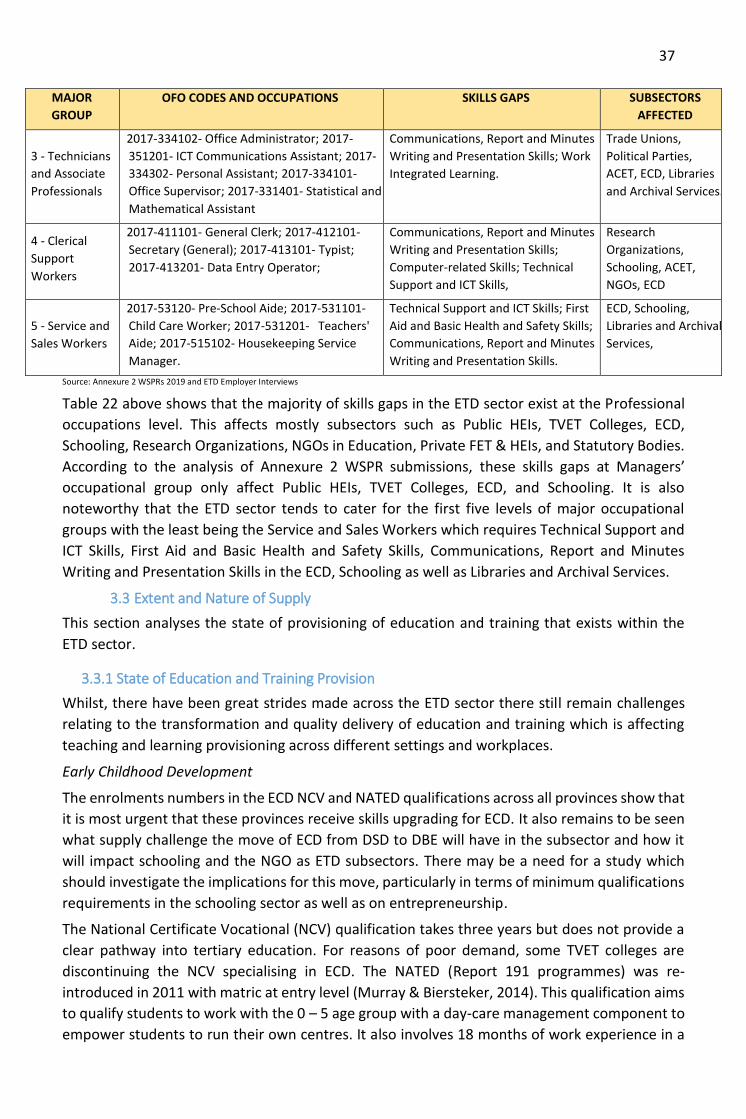
37
MAJOR
GROUP
OFO CODES AND OCCUPATIONS SKILLS GAPS SUBSECTORS
AFFECTED
3 - Technicians
and Associate
Professionals
2017-334102- Office Administrator; 2017-
351201- ICT Communications Assistant; 2017-
334302- Personal Assistant; 2017-334101-
Office Supervisor; 2017-331401- Statistical and
Mathematical Assistant
Communications, Report and Minutes
Writing and Presentation Skills; Work
Integrated Learning.
Trade Unions,
Political Parties,
ACET, ECD, Libraries
and Archival Services.
4 - Clerical
Support
Workers
2017-411101- General Clerk; 2017-412101-
Secretary (General); 2017-413101- Typist;
2017-413201- Data Entry Operator;
Communications, Report and Minutes
Writing and Presentation Skills;
Computer-related Skills; Technical
Support and ICT Skills,
Research
Organizations,
Schooling, ACET,
NGOs, ECD
5 - Service and
Sales Workers
2017-53120- Pre-School Aide; 2017-531101-
Child Care Worker; 2017-531201- Teachers'
Aide; 2017-515102- Housekeeping Service
Manager.
Technical Support and ICT Skills; First
Aid and Basic Health and Safety Skills;
Communications, Report and Minutes
Writing and Presentation Skills.
ECD, Schooling,
Libraries and Archival
Services,
Source: Annexure 2 WSPRs 2019 and ETD Employer Interviews
Table 22 above shows that the majority of skills gaps in the ETD sector exist at the Professional
occupations level. This affects mostly subsectors such as Public HEIs, TVET Colleges, ECD,
Schooling, Research Organizations, NGOs in Education, Private FET & HEIs, and Statutory Bodies.
According to the analysis of Annexure 2 WSPR submissions, these skills gaps at Managers’
occupational group only affect Public HEIs, TVET Colleges, ECD, and Schooling. It is also
noteworthy that the ETD sector tends to cater for the first five levels of major occupational
groups with the least being the Service and Sales Workers which requires Technical Support and
ICT Skills, First Aid and Basic Health and Safety Skills, Communications, Report and Minutes
Writing and Presentation Skills in the ECD, Schooling as well as Libraries and Archival Services.
3.3 Extent and Nature of Supply
This section analyses the state of provisioning of education and training that exists within the
ETD sector.
3.3.1 State of Education and Training Provision
Whilst, there have been great strides made across the ETD sector there still remain challenges
relating to the transformation and quality delivery of education and training which is affecting
teaching and learning provisioning across different settings and workplaces.
Early Childhood Development
The enrolments numbers in the ECD NCV and NATED qualifications across all provinces show that
it is most urgent that these provinces receive skills upgrading for ECD. It also remains to be seen
what supply challenge the move of ECD from DSD to DBE will have in the subsector and how it
will impact schooling and the NGO as ETD subsectors. There may be a need for a study which
should investigate the implications for this move, particularly in terms of minimum qualifications
requirements in the schooling sector as well as on entrepreneurship.
The National Certificate Vocational (NCV) qualification takes three years but does not provide a
clear pathway into tertiary education. For reasons of poor demand, some TVET colleges are
discontinuing the NCV specialising in ECD. The NATED (Report 191 programmes) was re-
introduced in 2011 with matric at entry level (Murray & Biersteker, 2014). This qualification aims
to qualify students to work with the 0 – 5 age group with a day-care management component to
empower students to run their own centres. It also involves 18 months of work experience in a
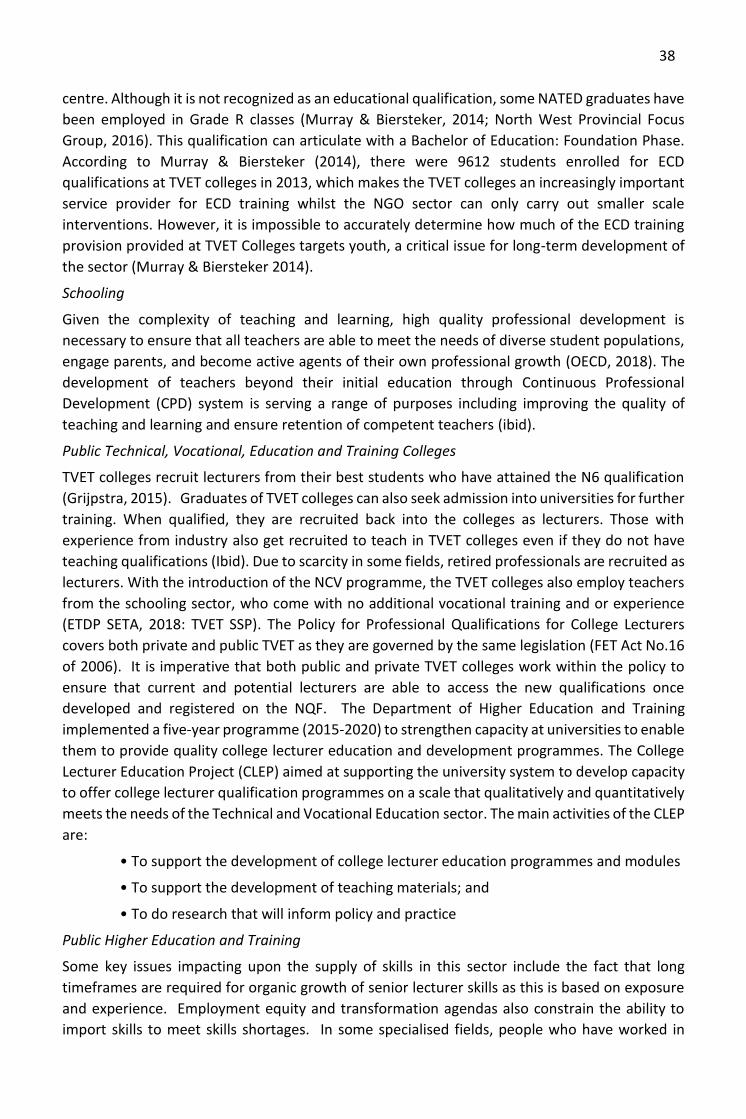
38
centre. Although it is not recognized as an educational qualification, some NATED graduates have
been employed in Grade R classes (Murray & Biersteker, 2014; North West Provincial Focus
Group, 2016). This qualification can articulate with a Bachelor of Education: Foundation Phase.
According to Murray & Biersteker (2014), there were 9612 students enrolled for ECD
qualifications at TVET colleges in 2013, which makes the TVET colleges an increasingly important
service provider for ECD training whilst the NGO sector can only carry out smaller scale
interventions. However, it is impossible to accurately determine how much of the ECD training
provision provided at TVET Colleges targets youth, a critical issue for long-term development of
the sector (Murray & Biersteker 2014).
Schooling
Given the complexity of teaching and learning, high quality professional development is
necessary to ensure that all teachers are able to meet the needs of diverse student populations,
engage parents, and become active agents of their own professional growth (OECD, 2018). The
development of teachers beyond their initial education through Continuous Professional
Development (CPD) system is serving a range of purposes including improving the quality of
teaching and learning and ensure retention of competent teachers (ibid).
Public Technical, Vocational, Education and Training Colleges
TVET colleges recruit lecturers from their best students who have attained the N6 qualification
(Grijpstra, 2015). Graduates of TVET colleges can also seek admission into universities for further
training. When qualified, they are recruited back into the colleges as lecturers. Those with
experience from industry also get recruited to teach in TVET colleges even if they do not have
teaching qualifications (Ibid). Due to scarcity in some fields, retired professionals are recruited as
lecturers. With the introduction of the NCV programme, the TVET colleges also employ teachers
from the schooling sector, who come with no additional vocational training and or experience
(ETDP SETA, 2018: TVET SSP). The Policy for Professional Qualifications for College Lecturers
covers both private and public TVET as they are governed by the same legislation (FET Act No.16
of 2006). It is imperative that both public and private TVET colleges work within the policy to
ensure that current and potential lecturers are able to access the new qualifications once
developed and registered on the NQF. The Department of Higher Education and Training
implemented a five-year programme (2015-2020) to strengthen capacity at universities to enable
them to provide quality college lecturer education and development programmes. The College
Lecturer Education Project (CLEP) aimed at supporting the university system to develop capacity
to offer college lecturer qualification programmes on a scale that qualitatively and quantitatively
meets the needs of the Technical and Vocational Education sector. The main activities of the CLEP
are:
• To support the development of college lecturer education programmes and modules
• To support the development of teaching materials; and
• To do research that will inform policy and practice
Public Higher Education and Training
Some key issues impacting upon the supply of skills in this sector include the fact that long
timeframes are required for organic growth of senior lecturer skills as this is based on exposure
and experience. Employment equity and transformation agendas also constrain the ability to
import skills to meet skills shortages. In some specialised fields, people who have worked in
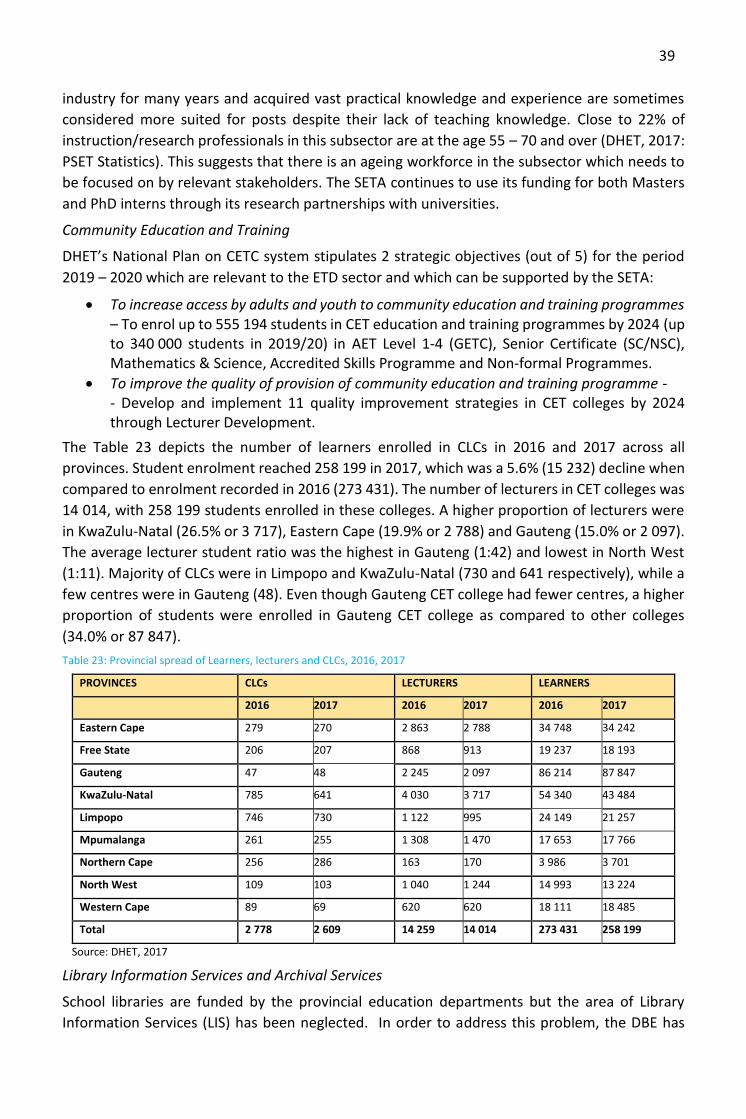
39
industry for many years and acquired vast practical knowledge and experience are sometimes
considered more suited for posts despite their lack of teaching knowledge. Close to 22% of
instruction/research professionals in this subsector are at the age 55 – 70 and over (DHET, 2017:
PSET Statistics). This suggests that there is an ageing workforce in the subsector which needs to
be focused on by relevant stakeholders. The SETA continues to use its funding for both Masters
and PhD interns through its research partnerships with universities.
Community Education and Training
DHET’s National Plan on CETC system stipulates 2 strategic objectives (out of 5) for the period
2019 – 2020 which are relevant to the ETD sector and which can be supported by the SETA:
To increase access by adults and youth to community education and training programmes – To enrol up to 555 194 students in CET education and training programmes by 2024 (up to 340 000 students in 2019/20) in AET Level 1-4 (GETC), Senior Certificate (SC/NSC), Mathematics & Science, Accredited Skills Programme and Non-formal Programmes.
To improve the quality of provision of community education and training programme - - Develop and implement 11 quality improvement strategies in CET colleges by 2024 through Lecturer Development.
The Table 23 depicts the number of learners enrolled in CLCs in 2016 and 2017 across all
provinces. Student enrolment reached 258 199 in 2017, which was a 5.6% (15 232) decline when
compared to enrolment recorded in 2016 (273 431). The number of lecturers in CET colleges was
14 014, with 258 199 students enrolled in these colleges. A higher proportion of lecturers were
in KwaZulu-Natal (26.5% or 3 717), Eastern Cape (19.9% or 2 788) and Gauteng (15.0% or 2 097).
The average lecturer student ratio was the highest in Gauteng (1:42) and lowest in North West
(1:11). Majority of CLCs were in Limpopo and KwaZulu-Natal (730 and 641 respectively), while a
few centres were in Gauteng (48). Even though Gauteng CET college had fewer centres, a higher
proportion of students were enrolled in Gauteng CET college as compared to other colleges
(34.0% or 87 847).
Table 23: Provincial spread of Learners, lecturers and CLCs, 2016, 2017
PROVINCES CLCs LECTURERS LEARNERS
2016 2017 2016 2017 2016 2017
Eastern Cape 279 270 2 863 2 788 34 748 34 242
Free State 206 207 868 913 19 237 18 193
Gauteng 47 48 2 245 2 097 86 214 87 847
KwaZulu-Natal 785 641 4 030 3 717 54 340 43 484
Limpopo 746 730 1 122 995 24 149 21 257
Mpumalanga 261 255 1 308 1 470 17 653 17 766
Northern Cape 256 286 163 170 3 986 3 701
North West 109 103 1 040 1 244 14 993 13 224
Western Cape 89 69 620 620 18 111 18 485
Total 2 778 2 609 14 259 14 014 273 431 258 199
Source: DHET, 2017
Library Information Services and Archival Services
School libraries are funded by the provincial education departments but the area of Library
Information Services (LIS) has been neglected. In order to address this problem, the DBE has

40
devised a plan with Treasury for centralized and classroom libraries for primary and secondary
schools at a cost of R700 million over the 2017-2019 period to enable the first phase focusing on
seven of the weakest provinces.
Across all subsectors, there is a need for customized and fit-for-purpose programmes designed
for teachers and lecturers as part of continuing professional development. In order to achieve
this, there is a need for better coordination and collaboration through developing and harnessing
partnerships between public and private entities including NGOs, in order to utilize experience
and best practices.
Early Childhood Development
A great deal of expertise and experience in ECD exists in the NGO sector. Many of the NGO
providers service rural and remote areas and provide support to learners in ECD sites.
The need for partnerships between Government, TVET colleges and the NGO community remains
critical to enhance capacity and utilize experience existing within the sector. It is worth noting
that there are about 3,297,390 children between the ages of three and five who are in need of
ECD services while there are only 29 000 centres and 46 571 practitioners. However, there are
827 338 children benefitting from these centres. This gives an average ratio of 21.2 children to 1
practitioner if all the children are attending a centre. In principle, then, there is a huge demand
which needs to be met in the future if universal access to quality ECD is to be achieved. Supply is
affected by the low level of qualified and professionally trained staff. The DSD ECD Audit (2014)
shows that about 40% of ECD managers and principals had below grade 12 while 55% had no
qualifications.
Schooling
Based on the estimations from various studies, between 20 000 and 30 000 new teachers are
required to enter the public schooling system each year (Van Broekhuizen, 2016, p.31). Within
the cohort of ITE graduates it includes students “who are already employed as teachers, some
who have no intention of seeking employment… some who seek to become teachers but cannot
find employment despite applying for teaching posts, and some who both want to work as
teachers and are able to find suitable positions in which they subsequently employed”. However,
it should be noted only the last group of new ITE graduates increase the supply of qualified
teachers in the country” (Ibid, p. 31). The role and contribution of Universities becomes
important in producing sufficient quantities of ITE graduates to satisfy the demand for qualified
new teaching, particularly in subjects and phases, where there are shortages.
TVET Colleges
Training providers include Public and Private TVET Colleges, as well as NGOs who are not
registered as colleges. Currently, there is unavailability of sufficiently customised training
programmes which constitutes a gap in the provision of pre- and in-service training of TVET
college lecturers. The findings of the latest ETD report on TVET subsector provides a fairly
detailed breakdown in terms of the four categories of the TVET lecturer qualification status for
each province and employment status (see Table 24).
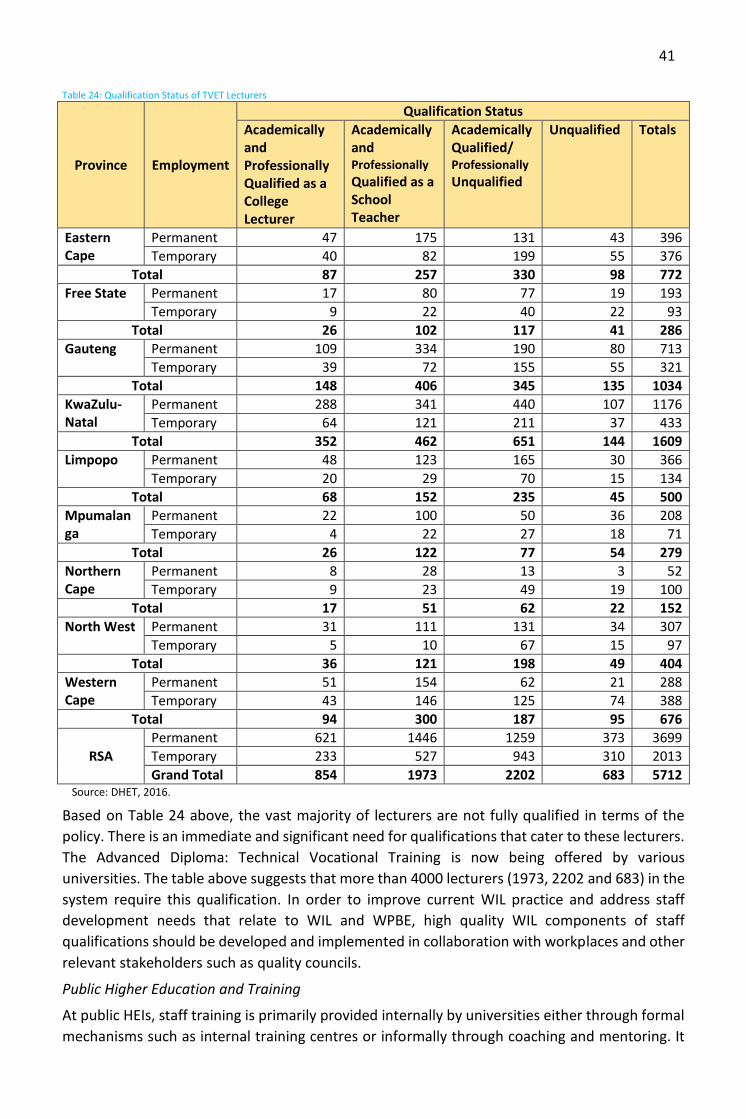
41
Table 24: Qualification Status of TVET Lecturers
Province Employment
Qualification Status
Academically and Professionally Qualified as a College Lecturer
Academically and Professionally Qualified as a School Teacher
Academically Qualified/ Professionally Unqualified
Unqualified Totals
Eastern Cape
Permanent 47 175 131 43 396
Temporary 40 82 199 55 376
Total 87 257 330 98 772
Free State Permanent 17 80 77 19 193
Temporary 9 22 40 22 93
Total 26 102 117 41 286
Gauteng Permanent 109 334 190 80 713
Temporary 39 72 155 55 321
Total 148 406 345 135 1034
KwaZulu-Natal
Permanent 288 341 440 107 1176
Temporary 64 121 211 37 433
Total 352 462 651 144 1609
Limpopo Permanent 48 123 165 30 366
Temporary 20 29 70 15 134
Total 68 152 235 45 500
Mpumalanga
Permanent 22 100 50 36 208
Temporary 4 22 27 18 71
Total 26 122 77 54 279
Northern Cape
Permanent 8 28 13 3 52
Temporary 9 23 49 19 100
Total 17 51 62 22 152
North West Permanent 31 111 131 34 307
Temporary 5 10 67 15 97
Total 36 121 198 49 404
Western Cape
Permanent 51 154 62 21 288
Temporary 43 146 125 74 388
Total 94 300 187 95 676
RSA
Permanent 621 1446 1259 373 3699
Temporary 233 527 943 310 2013
Grand Total 854 1973 2202 683 5712 Source: DHET, 2016.
Based on Table 24 above, the vast majority of lecturers are not fully qualified in terms of the
policy. There is an immediate and significant need for qualifications that cater to these lecturers.
The Advanced Diploma: Technical Vocational Training is now being offered by various
universities. The table above suggests that more than 4000 lecturers (1973, 2202 and 683) in the
system require this qualification. In order to improve current WIL practice and address staff
development needs that relate to WIL and WPBE, high quality WIL components of staff
qualifications should be developed and implemented in collaboration with workplaces and other
relevant stakeholders such as quality councils.
Public Higher Education and Training
At public HEIs, staff training is primarily provided internally by universities either through formal
mechanisms such as internal training centres or informally through coaching and mentoring. It
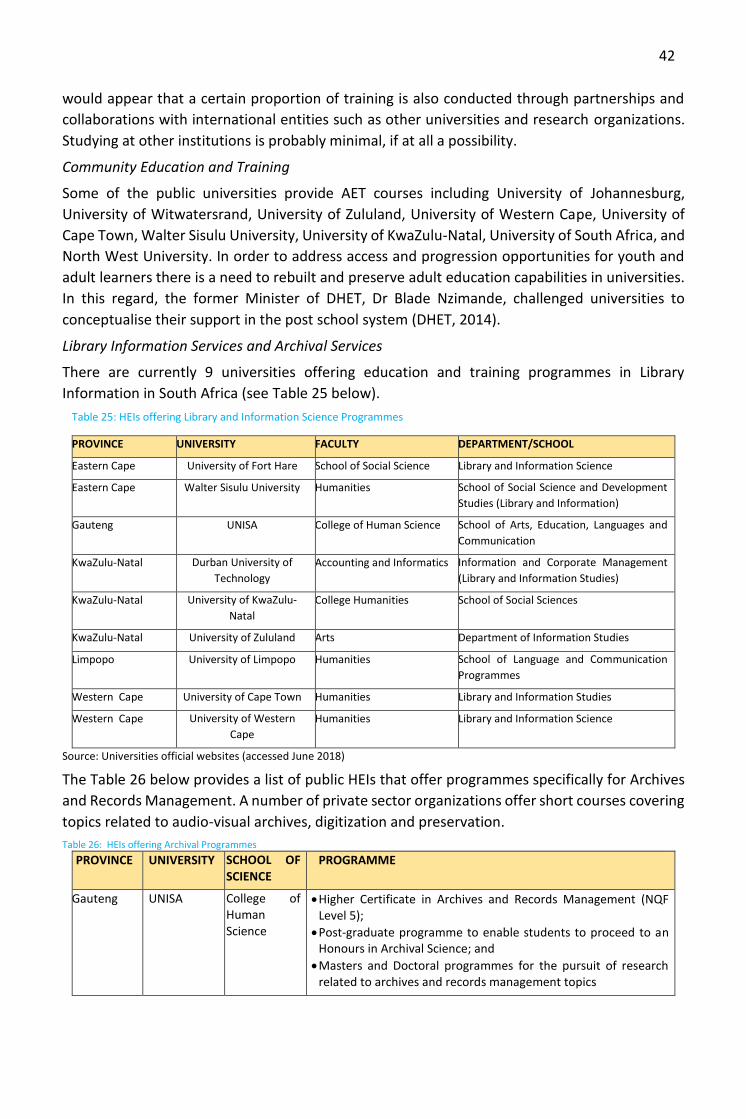
42
would appear that a certain proportion of training is also conducted through partnerships and
collaborations with international entities such as other universities and research organizations.
Studying at other institutions is probably minimal, if at all a possibility.
Community Education and Training
Some of the public universities provide AET courses including University of Johannesburg,
University of Witwatersrand, University of Zululand, University of Western Cape, University of
Cape Town, Walter Sisulu University, University of KwaZulu-Natal, University of South Africa, and
North West University. In order to address access and progression opportunities for youth and
adult learners there is a need to rebuilt and preserve adult education capabilities in universities.
In this regard, the former Minister of DHET, Dr Blade Nzimande, challenged universities to
conceptualise their support in the post school system (DHET, 2014).
Library Information Services and Archival Services
There are currently 9 universities offering education and training programmes in Library
Information in South Africa (see Table 25 below).
Table 25: HEIs offering Library and Information Science Programmes
Source: Universities official websites (accessed June 2018)
The Table 26 below provides a list of public HEIs that offer programmes specifically for Archives
and Records Management. A number of private sector organizations offer short courses covering
topics related to audio-visual archives, digitization and preservation.
Table 26: HEIs offering Archival Programmes
PROVINCE UNIVERSITY SCHOOL OF SCIENCE
PROGRAMME
Gauteng UNISA College of Human Science
Higher Certificate in Archives and Records Management (NQF Level 5);
Post-graduate programme to enable students to proceed to an Honours in Archival Science; and
Masters and Doctoral programmes for the pursuit of research related to archives and records management topics
PROVINCE UNIVERSITY FACULTY DEPARTMENT/SCHOOL
Eastern Cape University of Fort Hare School of Social Science Library and Information Science
Eastern Cape Walter Sisulu University Humanities School of Social Science and Development
Studies (Library and Information)
Gauteng UNISA College of Human Science School of Arts, Education, Languages and
Communication
KwaZulu-Natal Durban University of
Technology
Accounting and Informatics Information and Corporate Management
(Library and Information Studies)
KwaZulu-Natal University of KwaZulu-
Natal
College Humanities School of Social Sciences
KwaZulu-Natal University of Zululand Arts Department of Information Studies
Limpopo University of Limpopo Humanities School of Language and Communication
Programmes
Western Cape University of Cape Town Humanities Library and Information Studies
Western Cape University of Western
Cape
Humanities Library and Information Science
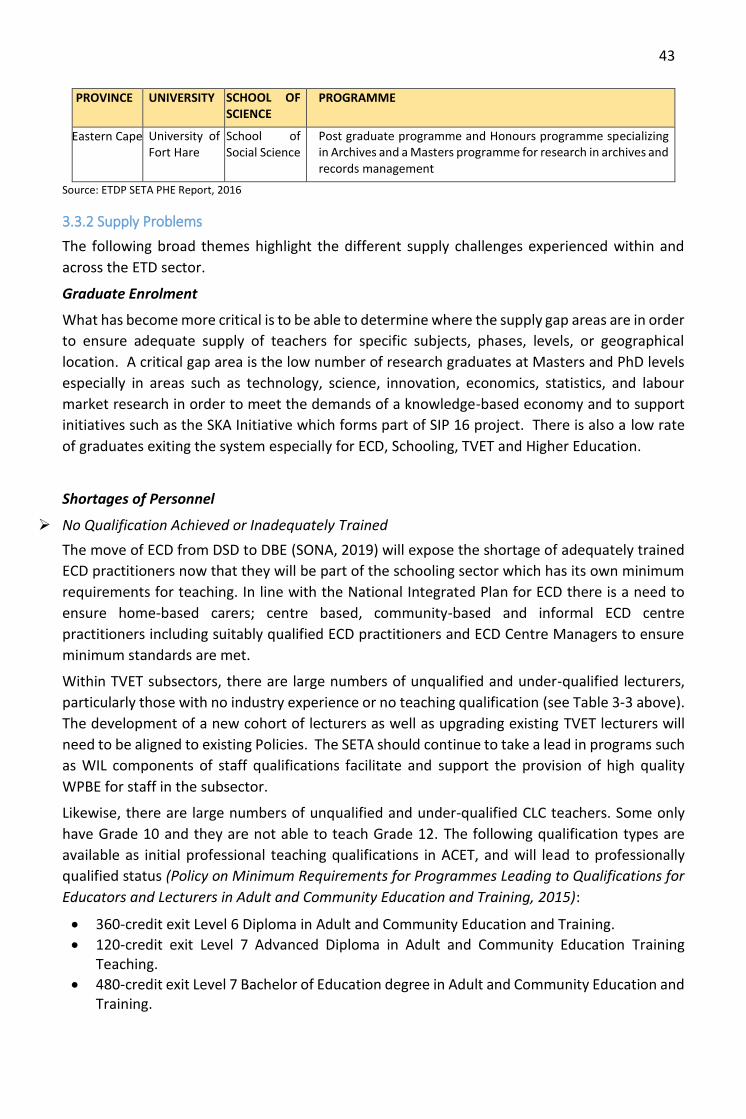
43
PROVINCE UNIVERSITY SCHOOL OF SCIENCE
PROGRAMME
Eastern Cape University of Fort Hare
School of Social Science
Post graduate programme and Honours programme specializing in Archives and a Masters programme for research in archives and records management
Source: ETDP SETA PHE Report, 2016
3.3.2 Supply Problems
The following broad themes highlight the different supply challenges experienced within and
across the ETD sector.
Graduate Enrolment
What has become more critical is to be able to determine where the supply gap areas are in order
to ensure adequate supply of teachers for specific subjects, phases, levels, or geographical
location. A critical gap area is the low number of research graduates at Masters and PhD levels
especially in areas such as technology, science, innovation, economics, statistics, and labour
market research in order to meet the demands of a knowledge-based economy and to support
initiatives such as the SKA Initiative which forms part of SIP 16 project. There is also a low rate
of graduates exiting the system especially for ECD, Schooling, TVET and Higher Education.
Shortages of Personnel
No Qualification Achieved or Inadequately Trained
The move of ECD from DSD to DBE (SONA, 2019) will expose the shortage of adequately trained
ECD practitioners now that they will be part of the schooling sector which has its own minimum
requirements for teaching. In line with the National Integrated Plan for ECD there is a need to
ensure home-based carers; centre based, community-based and informal ECD centre
practitioners including suitably qualified ECD practitioners and ECD Centre Managers to ensure
minimum standards are met.
Within TVET subsectors, there are large numbers of unqualified and under-qualified lecturers,
particularly those with no industry experience or no teaching qualification (see Table 3-3 above).
The development of a new cohort of lecturers as well as upgrading existing TVET lecturers will
need to be aligned to existing Policies. The SETA should continue to take a lead in programs such
as WIL components of staff qualifications facilitate and support the provision of high quality
WPBE for staff in the subsector.
Likewise, there are large numbers of unqualified and under-qualified CLC teachers. Some only
have Grade 10 and they are not able to teach Grade 12. The following qualification types are
available as initial professional teaching qualifications in ACET, and will lead to professionally
qualified status (Policy on Minimum Requirements for Programmes Leading to Qualifications for
Educators and Lecturers in Adult and Community Education and Training, 2015):
360-credit exit Level 6 Diploma in Adult and Community Education and Training.
120-credit exit Level 7 Advanced Diploma in Adult and Community Education Training Teaching.
480-credit exit Level 7 Bachelor of Education degree in Adult and Community Education and Training.
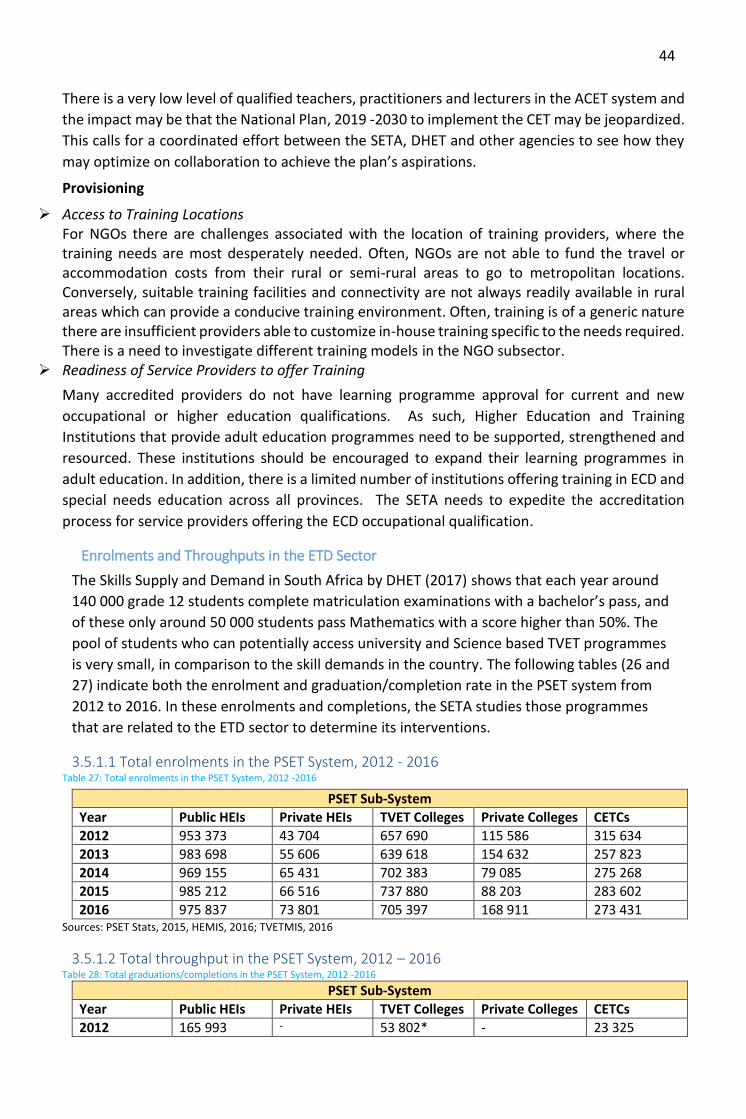
44
There is a very low level of qualified teachers, practitioners and lecturers in the ACET system and
the impact may be that the National Plan, 2019 -2030 to implement the CET may be jeopardized.
This calls for a coordinated effort between the SETA, DHET and other agencies to see how they
may optimize on collaboration to achieve the plan’s aspirations.
Provisioning
Access to Training Locations For NGOs there are challenges associated with the location of training providers, where the training needs are most desperately needed. Often, NGOs are not able to fund the travel or accommodation costs from their rural or semi-rural areas to go to metropolitan locations. Conversely, suitable training facilities and connectivity are not always readily available in rural areas which can provide a conducive training environment. Often, training is of a generic nature there are insufficient providers able to customize in-house training specific to the needs required. There is a need to investigate different training models in the NGO subsector.
Readiness of Service Providers to offer Training
Many accredited providers do not have learning programme approval for current and new
occupational or higher education qualifications. As such, Higher Education and Training
Institutions that provide adult education programmes need to be supported, strengthened and
resourced. These institutions should be encouraged to expand their learning programmes in
adult education. In addition, there is a limited number of institutions offering training in ECD and
special needs education across all provinces. The SETA needs to expedite the accreditation
process for service providers offering the ECD occupational qualification.
Enrolments and Throughputs in the ETD Sector
The Skills Supply and Demand in South Africa by DHET (2017) shows that each year around
140 000 grade 12 students complete matriculation examinations with a bachelor’s pass, and
of these only around 50 000 students pass Mathematics with a score higher than 50%. The
pool of students who can potentially access university and Science based TVET programmes
is very small, in comparison to the skill demands in the country. The following tables (26 and
27) indicate both the enrolment and graduation/completion rate in the PSET system from
2012 to 2016. In these enrolments and completions, the SETA studies those programmes
that are related to the ETD sector to determine its interventions.
3.5.1.1 Total enrolments in the PSET System, 2012 - 2016 Table 27: Total enrolments in the PSET System, 2012 -2016
Sources: PSET Stats, 2015, HEMIS, 2016; TVETMIS, 2016
3.5.1.2 Total throughput in the PSET System, 2012 – 2016 Table 28: Total graduations/completions in the PSET System, 2012 -2016
PSET Sub-System
Year Public HEIs Private HEIs TVET Colleges Private Colleges CETCs
2012 165 993 - 53 802* - 23 325
PSET Sub-System
Year Public HEIs Private HEIs TVET Colleges Private Colleges CETCs
2012 953 373 43 704 657 690 115 586 315 634
2013 983 698 55 606 639 618 154 632 257 823
2014 969 155 65 431 702 383 79 085 275 268
2015 985 212 66 516 737 880 88 203 283 602
2016 975 837 73 801 705 397 168 911 273 431
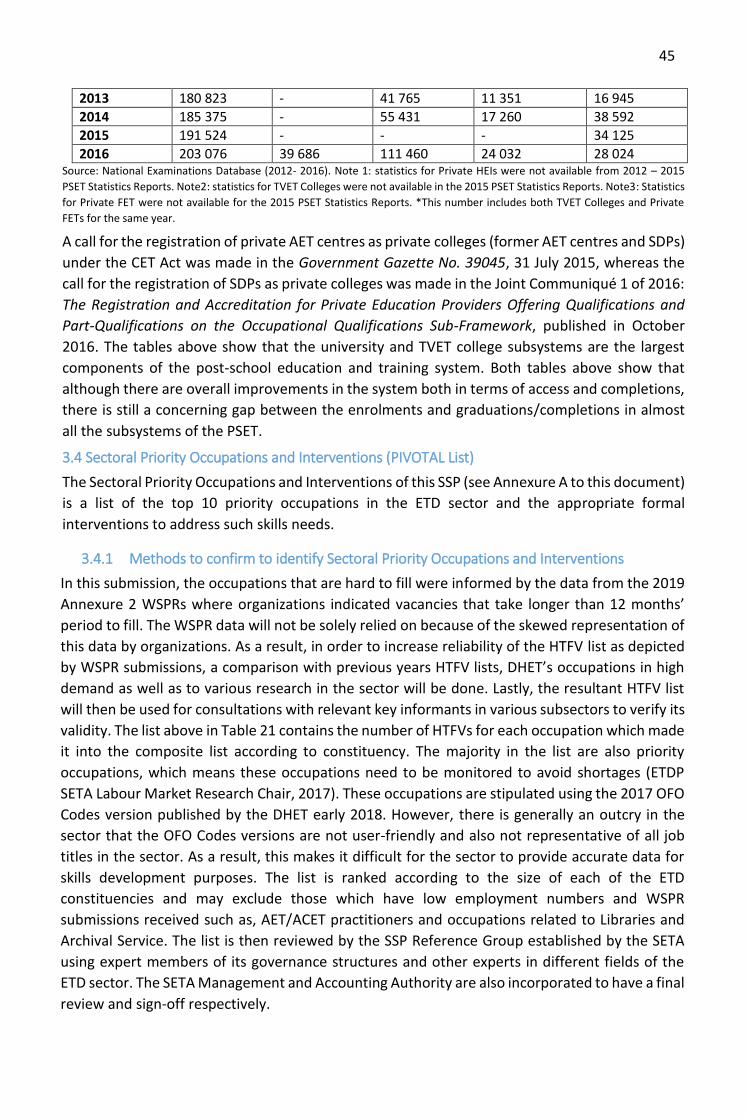
45
2013 180 823 - 41 765 11 351 16 945
2014 185 375 - 55 431 17 260 38 592
2015 191 524 - - - 34 125
2016 203 076 39 686 111 460 24 032 28 024 Source: National Examinations Database (2012- 2016). Note 1: statistics for Private HEIs were not available from 2012 – 2015
PSET Statistics Reports. Note2: statistics for TVET Colleges were not available in the 2015 PSET Statistics Reports. Note3: Statistics
for Private FET were not available for the 2015 PSET Statistics Reports. *This number includes both TVET Colleges and Private
FETs for the same year.
A call for the registration of private AET centres as private colleges (former AET centres and SDPs)
under the CET Act was made in the Government Gazette No. 39045, 31 July 2015, whereas the
call for the registration of SDPs as private colleges was made in the Joint Communiqué 1 of 2016:
The Registration and Accreditation for Private Education Providers Offering Qualifications and
Part-Qualifications on the Occupational Qualifications Sub-Framework, published in October
2016. The tables above show that the university and TVET college subsystems are the largest
components of the post-school education and training system. Both tables above show that
although there are overall improvements in the system both in terms of access and completions,
there is still a concerning gap between the enrolments and graduations/completions in almost
all the subsystems of the PSET.
3.4 Sectoral Priority Occupations and Interventions (PIVOTAL List)
The Sectoral Priority Occupations and Interventions of this SSP (see Annexure A to this document)
is a list of the top 10 priority occupations in the ETD sector and the appropriate formal
interventions to address such skills needs.
3.4.1 Methods to confirm to identify Sectoral Priority Occupations and Interventions
In this submission, the occupations that are hard to fill were informed by the data from the 2019
Annexure 2 WSPRs where organizations indicated vacancies that take longer than 12 months’
period to fill. The WSPR data will not be solely relied on because of the skewed representation of
this data by organizations. As a result, in order to increase reliability of the HTFV list as depicted
by WSPR submissions, a comparison with previous years HTFV lists, DHET’s occupations in high
demand as well as to various research in the sector will be done. Lastly, the resultant HTFV list
will then be used for consultations with relevant key informants in various subsectors to verify its
validity. The list above in Table 21 contains the number of HTFVs for each occupation which made
it into the composite list according to constituency. The majority in the list are also priority
occupations, which means these occupations need to be monitored to avoid shortages (ETDP
SETA Labour Market Research Chair, 2017). These occupations are stipulated using the 2017 OFO
Codes version published by the DHET early 2018. However, there is generally an outcry in the
sector that the OFO Codes versions are not user-friendly and also not representative of all job
titles in the sector. As a result, this makes it difficult for the sector to provide accurate data for
skills development purposes. The list is ranked according to the size of each of the ETD
constituencies and may exclude those which have low employment numbers and WSPR
submissions received such as, AET/ACET practitioners and occupations related to Libraries and
Archival Service. The list is then reviewed by the SSP Reference Group established by the SETA
using expert members of its governance structures and other experts in different fields of the
ETD sector. The SETA Management and Accounting Authority are also incorporated to have a final
review and sign-off respectively.
46
Annexure A to this report shows the top 10 occupational priorities that inform the Sectoral
Priority Occupations and Interventions for the ETD sector. These priorities have been informed
by the Hard-to-Fill-Vacancy list across subsectors. The list provides the basis for informing the
ETDP SETA APP interventions. As may be expected, the schooling subsector has the majority of
the list with the Librarian and AET slightly making it into the list because of their size.
3.4.2 Envisaged Outcomes
The envisaged outcomes of the sectoral priority occupations and interventions is that it will
address some of the supply constrains in the sector for example: by training more ECD
Practitioners, Mathematics and Science teachers will address the shortage in these areas.
Furthermore, the interventions such as African Languages for the Foundation Phase seeks to
address the quality of education at foundation phase of schooling because, as studies indicate
that teaching and learning in mother tongue at that level of schooling enhances understanding.
To a great extent, the identification of these priority occupations and interventions will also assist
the SETA to respond to some of the change drivers mentioned in Chapter 2 of this document such
as the fourth Industrial Revolution by rolling out programmes such as Computer Applications,
Civil Technology, Electrical Technology and ICT programmes for the schooling system.
3.5 Conclusion The extent and nature of skills demand varies within and across the ETD subsectors. The current
methodology and analysis to determine the top 10 sectoral priority occupations in a sector as
wide as ETD is a challenge in that it limits entry of other occupations from smaller subsectors into
the list. To address the challenge posed by the OFO Codes, the SETA will have to (through
consultations with all stakeholders) engage in an exercise of mapping all ETD jobs to occupations
as represented in the versions. The supply issues in the sector has meant that the SETA requires
to re-align some of its partnerships such as with TVET Colleges, NGOs and DBE especially when it
comes to the move of ECD from DSD to DBE. This can be effectively done through a study that
will investigate the implications of the move. It has also been mentioned in this chapter that in
order to address TVET staff development needs, the SETA should continue to take a lead in
programs such as WIL components of staff qualifications and facilitate the provision of high
quality WPBE for staff in the subsector. Among other things, the state of education and training
in the ETD sector indicates that there is a seeming ageing of workforce especially in the schooling
and universities which are the biggest subsectors in the ETD.
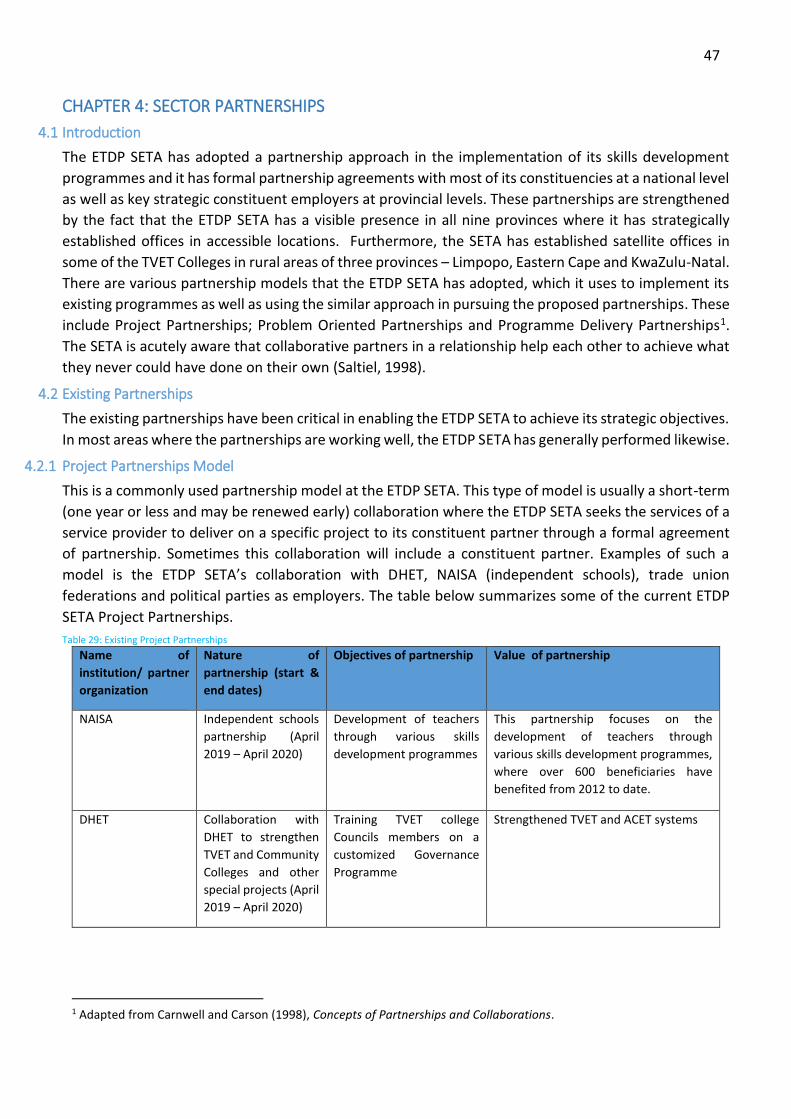
47
CHAPTER 4: SECTOR PARTNERSHIPS
4.1 Introduction
The ETDP SETA has adopted a partnership approach in the implementation of its skills development
programmes and it has formal partnership agreements with most of its constituencies at a national level
as well as key strategic constituent employers at provincial levels. These partnerships are strengthened
by the fact that the ETDP SETA has a visible presence in all nine provinces where it has strategically
established offices in accessible locations. Furthermore, the SETA has established satellite offices in
some of the TVET Colleges in rural areas of three provinces – Limpopo, Eastern Cape and KwaZulu-Natal.
There are various partnership models that the ETDP SETA has adopted, which it uses to implement its
existing programmes as well as using the similar approach in pursuing the proposed partnerships. These
include Project Partnerships; Problem Oriented Partnerships and Programme Delivery Partnerships1.
The SETA is acutely aware that collaborative partners in a relationship help each other to achieve what
they never could have done on their own (Saltiel, 1998).
4.2 Existing Partnerships
The existing partnerships have been critical in enabling the ETDP SETA to achieve its strategic objectives.
In most areas where the partnerships are working well, the ETDP SETA has generally performed likewise.
4.2.1 Project Partnerships Model
This is a commonly used partnership model at the ETDP SETA. This type of model is usually a short-term
(one year or less and may be renewed early) collaboration where the ETDP SETA seeks the services of a
service provider to deliver on a specific project to its constituent partner through a formal agreement
of partnership. Sometimes this collaboration will include a constituent partner. Examples of such a
model is the ETDP SETA’s collaboration with DHET, NAISA (independent schools), trade union
federations and political parties as employers. The table below summarizes some of the current ETDP
SETA Project Partnerships.
Table 29: Existing Project Partnerships
Name of
institution/ partner
organization
Nature of
partnership (start &
end dates)
Objectives of partnership Value of partnership
NAISA Independent schools
partnership (April
2019 – April 2020)
Development of teachers
through various skills
development programmes
This partnership focuses on the
development of teachers through
various skills development programmes,
where over 600 beneficiaries have
benefited from 2012 to date.
DHET Collaboration with
DHET to strengthen
TVET and Community
Colleges and other
special projects (April
2019 – April 2020)
Training TVET college
Councils members on a
customized Governance
Programme
Strengthened TVET and ACET systems
1 Adapted from Carnwell and Carson (1998), Concepts of Partnerships and Collaborations.

48
National Youth
Cooperatives
Partnership with
Youth Cooperatives
(April 2019 – April
2020)
Supporting Youth
Cooperatives and creating
jobs for young people.
collaboration with and supporting 21
Youth Cooperatives and creating jobs for
young people. Supported 18 in 2018/19
and 21 for 2019/20
Trade union
federations and
political parties
Partnership with 26
trade unions and 6
Political Parties (April
2019 – April 2020)
To deliver customized
programmes for trade
unions and political parties
Increased capacity of employees and
elected officials of these structures
4.2.2 Problem-Oriented Partnerships Model
This is similar to the Project Partnership model, except that the emphasis on this model is on long-term
collaboration with a view of addressing a specific problem. The ETDP SETA’s long-term collaboration
with all the public TVET Colleges, all provincial departments of education and all public HEIs has been
and continues to be effective. Examples of successful partnerships are summarized in the Table 30
below:
Table 30: Existing Problem-Oriented Partnerships
Institution/
partner
organization
Nature of partnership
(start & end dates)
Objectives of
partnership
Value of partnership
USAf Partnership with
Universities South Africa
(2020 – 2025)
(Annually)
To strengthen higher
education sub-sector
focusing on research,
HR practitioner,
leadership and lecturer
development.
Funding the Higher Education HR Practitioner and the Higher Education Leadership and Management (HELM) programmes; Developing the Higher Education sub-sector
skills plan.
Public HEIs Partnership with the 26
Public HEIs (2020 – 2025)
(Annually)
To implement various
skills development
programmes
Signed partnership agreements with 26 HEIs in place; and jointly implemented various skills development programmes.
TVET Colleges
Partnership with 50 TVET Colleges (2020 – 2025) (Annually)
To strengthen the TVET College system to be responsive to the ETD Sector and National Priorities
Jointly implemented various skills development programmes. Placement of youth as Career Development Officers (CDOs); Training of Lecturers and Managers on various programmes (Occupational Programmes for Lecturers as well as Leadership and Management Programmes for Managers). Extension of scope for TVET Colleges to implement ETDP SETA Learnerships.
Department of Education
Collaboration with the national and provincial departments of education (2020 – 2025) (Annually)
Capacitation of teachers, school managers and district officials
Through this collaboration over 20 000 teachers have benefited through short skills programmes to increase their content knowledge on gate way subjects such as Mathematics, Accounting Physical Sciences and Technology.
Research Initiative partnerships (which the SETA calls
Partnerships with three higher education institutions to contribute in the development of SSP and APPs. (2013- 2018). After review and re-
To contribute to the overall research of the SETA and strengthen the research capacity of the ETDP SETA and
Since inception of the project in 2013, over 50 reports have been produced, which contributed to the development of the SSP Updates and APPs.

49
Institution/
partner
organization
Nature of partnership
(start & end dates)
Objectives of
partnership
Value of partnership
Research Chairs)
conceptualization the partnership will continue from 2020 – 2023.
that of involved higher education institutions.
4.2.3 Programme-Delivery Partnerships Model
The Programme delivery partnership model has the same features with the Project Partnership, except
that the delivery model focuses on the delivery of all the ETDP SETA programmes, regardless of their life
span. Table 31 below depicts these programme delivery partnerships with various institutions of its
constituencies.
Table 31: Existing Programme-Delivery Partnerships Model
Name of
institution/ partner
organization
Nature of partnership (start
& end dates)
Objectives of
partnership
Value of partnership
SETAs and
Professional Bodies
Collaboration with 10 SETAs
and 2 Professional bodies.
2019 - 2020
To strengthen capacity through skills development.
Employees of SETAs and Professional bodies will be capacitated to discharge their responsibilities
Research Organizations Partnership
Partnerships with Research Organizations. 2019 - 2020
To strengthen research capacity of research organizations
Support to strengthen research capacity for research organizations.
Community Education and Training College (CETC) partnerships
Collaboration with CET Colleges. 2019 - 2020
To strengthen the CETC management teams; and training of practitioners
Collaboration with CETC to strengthen management and training practitioners.
TVET Colleges TVET Colleges partnerships to conduct RPL on behalf of the SETA on ECD and Community Development programmes. 2019 - 2020
To increase the number of qualified staff in the ECD and Community Development sectors
Addresses transformative imperative of those who were previously marginalized and increase the level of qualified practitioners in ECD and Community Development.
APPETD Partnership Partnership with APPETD to fund skills development programmes for Private Providers. 2019 - 2020
To support private providers paying levies to the ETDP SETA
Collaboration with various private providers to capacitate their employees on skills development
While the ETDP SETA has achieved working partnerships with most constituencies and individual
employers, in the main the initiatives were successful but not without challenges. The main challenge
in these partnerships relates to the different procurement approaches of involved parties which tended
to delay implementation of partnerships.
4.3 Proposed New Partnerships
The ETDP SETA continues to explore new partnerships to increase its pool of partners in the
implementation of its future plans. Some of the proposed partnerships are summarized in the table
below.

50
Table 32: Proposed and planned Partnerships
Name of
institution/
partner
organization
Nature of partnership
(start & end dates)
Objectives of
partnership
Value of partnership
Key departments
and stakeholders
Partnership with Key
departments and
stakeholders regarding
data for SSP. (2020 –
2025 reviewed annually).
To get data that feeds
into the ETDP SETA’s
annual SSP
Data sharing between ETSP SETA and
key departments to strengthen each
other’s research capacity.
SGB Associations
Partnerships
Partnerships with various
SGB associations. (2020 –
2025 reviewed annually)
To support internship
program and provide
skills programmes and
bursaries for members
of SGBs
Capacitating SGB members to do their
work.
Public HEIs Partnership with the 26 Public HEIs (2020 – 2025)
To conduct research and data analysis.
Credible research and data as well as transference of skills.
4.4 Conclusion
In conclusion, as a subsector based and stakeholder driven organization, the ETDP SETA values and
embraces various types of partnership models and continues to explore new models. This has
contributed to the SETA being able to achieve its targets on an annual basis. There is however a need
for the SETA to review those long-term partnerships to see if they enable the SETA to deliver on its skills
development mandate. By the same token, whilst the SETA considers to move aggressively in
establishing the new partnerships, it should as well maintain the current relationships going forward.
51
CHAPTER 5: SETA MONITORING AND EVALUATION
5.1 Introduction and Background Literature on monitoring and evaluation (M&E) contends that there is constant and growing pressure
on all government institutions including the ETDP SETA to be more responsive to the demands from
both internal and external stakeholders for good governance, which entails accountability and
transparency, greater development effectiveness, delivery of tangible results and better
performance. M&E provides a vehicle that supports management of policies, programmes and
projects. It also provides a powerful public management tool to assists organisations in achieving
results and helps to answer the so what question that stakeholders are constantly posing (Gorgens
and Kusek, 2009).
In most instances, the terms monitoring and evaluation are loosely used interchangeably to refer to
one and the same exercise while in fact they are two separate terms referring to different exercises.
Gorgens and Kusek (2009) explicitly define monitoring as a continuous function that uses the
systematic collection of data on specified indicators, to provide management and stakeholders with
the extent of progress and achievement of objectives and progress in the use of allocated funds.
While on the other end, evaluation is defined as a systematic and objective assessment of an ongoing
or completed project, programme or policy, including its design, implementation and results. This is
with the express purpose of determining the efficiency, effectiveness, impact and sustainability of
projects, programme or policy. It provides credible & useful information on lessons learnt into
decision-making processes of beneficiaries & sponsors.
The Department of Higher Education and Training (DHET, 2017), is emphatic on the importance of
using M&E for the improvement of service delivery and performance of all post-schooling
government institutions.
It is against the aforementioned background that ETDP SETA Accounting Authority as part of
institutionalising M&E and strengthening related organisational systems approved the ETDP
Performance Monitoring, Evaluation and Reporting Policy in 2015, which is reviewed biannually.
5.2 ETDP SETA APPROACH TO M&E While the approved SETA PME&R policy clearly prescribes roles and responsibilities of various
stakeholders involved in the M&E, it also articulates the organisational approach to M&E. According
to the policy, implementation of M&E within the ETDP SETA is supposed to take place in different
forms in order to provide multiple sources of data to support Sector Skills Planning, Strategic Planning
and Annual Performance Planning processes within ETDP-SETA.
However, the weakness in the current practice in the organisation including policy, there is no
documented process flow that clearly articulate integration from M&E to all forms of planning right
through to implementation and right back to monitoring, evaluation and reporting. Currently, M&E
is located in the Office of the CEO, which is the custodian of M&E policy and procedures, sector skills
planning takes place within research and skills planning area while strategic planning and annual
52
planning happens at various divisions and units within the organisation; and implementation is
planned and driven through the Office of COO, who is the custodian of programme implementation.
This has by default compromised that seamlessness machinery in the aforementioned key
interrelated areas.
Below is a brief description of key M&E components espoused in the current PME&R policy, on
hindsight, there is no clear assignment of roles and responsibilities and a clear documented cyclical
flow between these components and other SETA functional areas. This highlights another weakness
in the policy itself.
5.2.1 Monitoring of Programmes and Projects This is a general routine monitoring conducted on an ongoing basis, monthly, quarterly and annually
with the express purpose of generating data on pre-determined objectives during the
implementation of programmes and projects. Routine monitoring is conducted by respective
programme and project managers assigned specific performance indicators to report on. Routine
monitoring is done in conjunction with supportive supervision and data auditing exercise which
serves as an internal quality assurance mechanism of data gathered during monitoring in preparation
for various external data auditing/validation processes that are executed by various oversight
structures such as the Department of Higher Education and Training (DHET) and the National
Treasury through the Office of Auditor-General.
5.2.2 Quarterly and Annual Reporting In line with policy, the accounting authority and management also have a responsibility of preparing
a range of performance reports that provide relevant information to the right people at the right
time for the various purposes. These reports are expected to: (i) present information in an accessible
way; (ii) avoid information overload – focus on priorities; (iii) use as much “real time” information as
possible; (iv) highlight indicators where performance calls for concern; (v) explain the reasons for
any performance that is off target; (vi) set out corrective actions that will be taken to bring
performance back on track; (vii) identify success and achievement as well as problems; (viii)
demonstrate self-awareness while; (ix) focusing on the bigger picture in respect to achievement of
the organisational strategic outcome oriented goals.
Reporting to DHET is done in a prescribed format which is part of the service level agreement (SLA)
entered into between the ETDP SETA and DHET every year. The ETDP SETA’s Quarterly Monitoring
Report (SQMR) is submitted by the Accounting Authority on a quarterly basis to DHET and contains
the extent to which set target in the SLA are achieved. Also, the SETA reports to the National Treasury
in a prescribed format/template in terms of the National Treasury Instruction Note 2 of 2014/15,
which entails information on finances, performance information and related matters within 30 days
after the end of each quarter. The accuracy and completeness of the quarterly reports to these
oversight structures is confirmed by the signature of the Accounting Authority. All of the above

53
mentioned report cumulatively culminate to annual reports served to various stakeholders including
Parliament.
5.2.3 Evaluation Studies As indicated earlier, evaluation studies are systematic, once-off and objective assessments designed
to develop or contribute to a generalised knowledge on the significance of ongoing or completed
programmes and project, in order to determine their efficacy, effectiveness, impact and
sustainability. In order to maintain objectiveness in conducting such assessment, all SETA evaluations
are out sourced to qualified evaluation providers (private or public). The SETA has also established
an internal Evaluation Steering Committee comprised of programme/projects stakeholders, research
staff and the M&E staff to provide oversight on all evaluations conducted externally on behalf of the
SETA. In the current period, the SETA has conducted a number of evaluation studies including tracer
studies and impact studies. The studies have produced good reports with substantive and clear
recommendations for the SETA to review programmes and projects design, implementation and
delivery.
Accompanying the PME&R policy, the SETA has developed specific standard operating procedures
(SOP) for each of the broad areas described above i.e. programmes and projects monitoring,
conducting evaluations, reporting on performance indicators and have lately added an SOP on
managing performance information. The SOPs are meant to provide a step by step guidance to assist
programmes and projects staff to execute requirements of policy prescripts. These mechanisms are
particularly in place as an attempt to build M&E capacity within the organisation but also to
institutionalise best practice M&E within the SETA. The strength of these is that they are recent and
in line with the requirements from DHET and Department of Performance Monitoring and
Evaluations (DPME) in the Office of the Presidency.
While these documents are in place and provide new thinking and new ways of doing business, it has
been difficult to enforce compliance in certain areas due to varied and complex reasons including
organisational silos and general resistance by implementing units to any change introduced. This will
require a solid and sound organisational change management strategies and mechanisms and also a
review of the organisational structure to break down organisational silo mentality. This must be
championed at the highest organisational level.
5.3 A Reflection on SETA Performance The 2019-2020 ETD Sector Skills Plan Update identified three broad skills development priorities: (a)
ensuring quality of teaching and learning in schools, TVETs Colleges, ECD Centres CETCs and Public
HEIs; (b) ensuring effective and efficient service delivery in public and private educational institutions;
and (c) supporting the transformation of the post-schooling and educational institutions. In order to
address and support these skills development priorities, the SETA identified three programmes in the
strategic plan and APP: (i) Improved quality teaching and learning in institutions; (ii) youth
development and student support; and (iii) skills development for ETD constituencies.
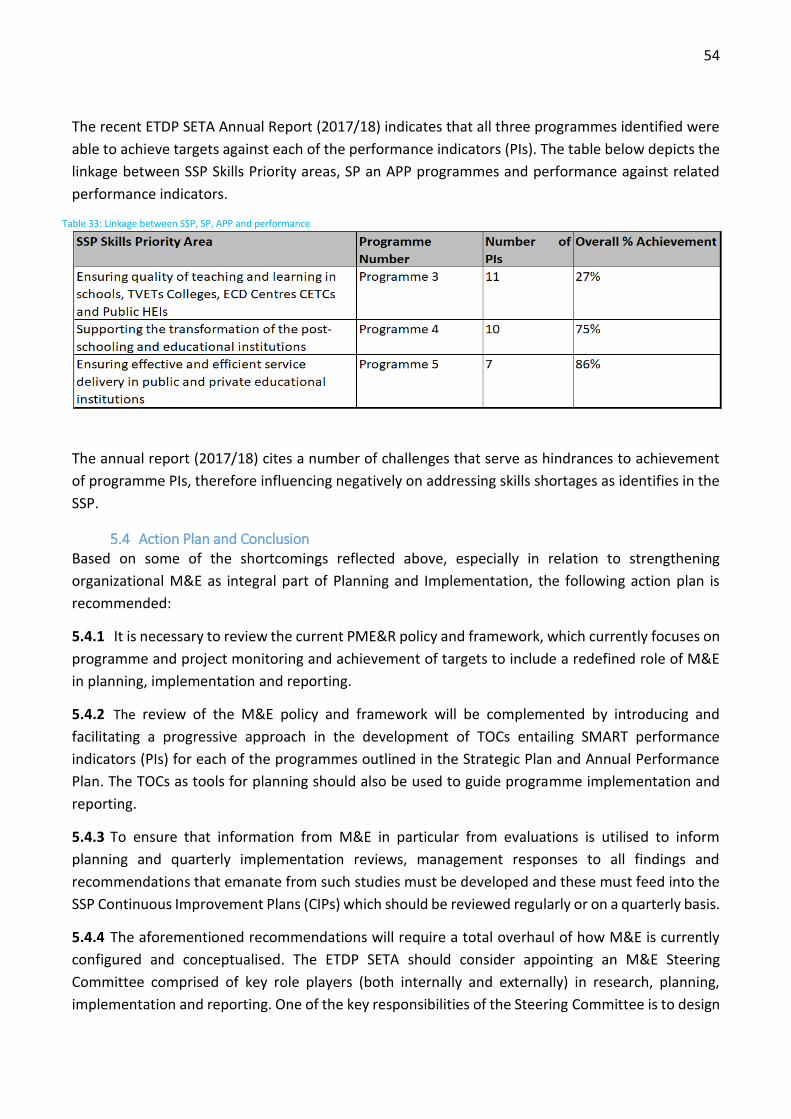
54
The recent ETDP SETA Annual Report (2017/18) indicates that all three programmes identified were
able to achieve targets against each of the performance indicators (PIs). The table below depicts the
linkage between SSP Skills Priority areas, SP an APP programmes and performance against related
performance indicators.
Table 33: Linkage between SSP, SP, APP and performance
The annual report (2017/18) cites a number of challenges that serve as hindrances to achievement
of programme PIs, therefore influencing negatively on addressing skills shortages as identifies in the
SSP.
5.4 Action Plan and Conclusion Based on some of the shortcomings reflected above, especially in relation to strengthening
organizational M&E as integral part of Planning and Implementation, the following action plan is
recommended:
5.4.1 It is necessary to review the current PME&R policy and framework, which currently focuses on
programme and project monitoring and achievement of targets to include a redefined role of M&E
in planning, implementation and reporting.
5.4.2 The review of the M&E policy and framework will be complemented by introducing and
facilitating a progressive approach in the development of TOCs entailing SMART performance
indicators (PIs) for each of the programmes outlined in the Strategic Plan and Annual Performance
Plan. The TOCs as tools for planning should also be used to guide programme implementation and
reporting.
5.4.3 To ensure that information from M&E in particular from evaluations is utilised to inform
planning and quarterly implementation reviews, management responses to all findings and
recommendations that emanate from such studies must be developed and these must feed into the
SSP Continuous Improvement Plans (CIPs) which should be reviewed regularly or on a quarterly basis.
5.4.4 The aforementioned recommendations will require a total overhaul of how M&E is currently
configured and conceptualised. The ETDP SETA should consider appointing an M&E Steering
Committee comprised of key role players (both internally and externally) in research, planning,
implementation and reporting. One of the key responsibilities of the Steering Committee is to design
55
and drive the change management strategy to mete out issues of change resistance and
organisational silo mentality. Furthermore, this committee could also oversee implementation of
sectoral strategic skills priorities through planning, implementation and reporting.
5.4.5 As part of its mandate, the M&E Steering Committee must ensure that an organisational-wide
‘three to five years’ evaluations plan is in place. The plan should include various types of evaluations
to be conducted at various intervals. Critical to the evaluation plan is to conduct an impact
assessment to scientifically determine the SETA’s progress towards the achievement of its strategic
outcomes-oriented goals. The evaluation plan should make a provision for implementation analysis
or process evaluations to determine the causes of late implementation of programmes and learner
drop outs as articulated in recent reports to be key organisational challenges.
In conclusion, in all of the above recommendations, action plans and execution, a very well
capacitated organisational M&E will definitely play a pivotal role.
56
CHAPTER 6: STRATEGIC SKILLS PRIORITY ACTIONS
6.1 Introduction
This chapter provides the highlights of the main findings from each of the previous chapters 1 to 5 as
well as indicates the recommended actions to address the main skills priorities and measures to support
national strategies in the ETD sector.
6.2 Key skills Findings from Previous Chapters
The analysis of the previous chapters highlights the following findings per chapter.
Chapter 1:
The ETD sector covers a diverse grouping of employers with approximately 59 948 from both the private
and public sector, each categorized according to 17 SIC codes which cover 14 major subsectors. There
is also a need for a targeted approach to mobilize employers that are not submitting Annexure 2 WSPRs
in order to improve the current 27% (1 062 of 3 882 levy-paying employers) submission rate and
encourage accurate and reliable workplace skills planning data.
This chapter has further shown that the economic performance of the sector is mainly reliant on
government funding and does not generate its own income. Although South Africa subscribes to a
funding framework in which costs are shared among the beneficiaries of university education (mainly
government and students), some of the public higher education institutions have since established
business enterprises aimed at generating revenue for these institutions and the SETA is currently
investigating this issue through public HEI subsector research. The chapter has also raised an issue
around investigating the implications of the move of ECD from DSD to DBE on its centres, qualifications
of practitioners and funding for this sector. The subject of ageing has also featured as an issue
threatening workforce in the ETD generally and especially in the ECD, public schooling and higher
education institutions (specifically on instruction and research). Apart from efforts to recruit and to
encourage young people into these careers, the SETA will also need to consider ways it can contribute
to and support career pathing or academic progression of black and female prospective or junior
academics across all disciplines of the previously disadvantaged as a way of dealing with transformation
in the HEI sector. In doing this, it may need to ensure that lecturer development programme aims
specifically at supporting the professional qualifications of lecturers in higher education (e.g. relevant
PG Dip in HE Teaching & Learning qualifications) takes this into consideration. It also came out that the
KZN PDE needs to devise measures to deal with ageing workforce in schooling on an urgent basis. It also
needs to further probe the decline in learner enrolments in the province (2014 – 2018) both from public
(2%) and independent (32%) schools. It’s been mentioned also that whilst female teachers make
approximately 72,5% of total teacher workforce in public schooling, only 37,3% are principals. This is a
transformation imperative that needs to be addressed using skills development among other
interventions. Furthermore, the chapter has shown that there is a need for the SETA to consider
commissioning a study about skills demand in the technical high schools and understanding if there is
any (or anticipated) exodus of workforce between schooling and TVET subsectors.
The chapter has also highlighted that in the coming strategic period, the SETA needs to provide urgent
support, to the REQV 10 (3092) cohort in order to achieve the minimum qualification requirements for
employment in the CET college system. Moreover, there are qualified lecturers in this subsector who
are incorrectly placed in relation to their subject specialization. This charges the SETA with the
responsibility to support this subsector in areas stipulated in the plan such as: Academic: Senior
57
Certificate for Adults (NASCA), GETCA, CAPS Maths & Science; Skills and Occupational: End-User
Computing and ECD programmes.
Chapter 2:
The following implications for skills have been deduced from the mentioned key skills change drivers as
discussed in this chapter:
The Move of Early Childhood Development from Social Development to Basic Education: It is
important for role players and stakeholders to ready themselves by anticipating what the move
will entail for their respective areas. The DBE in partnerships with the public higher education
institutions and TVET Colleges may need to embark on improving the qualification levels of ECD
practitioners through full qualifications and RPL programmes. SACE on the other hand is expected
to facilitate the professionalization of these practitioners. The ETDP SETA will also be central in
facilitating these processes and also the funding to upskill the practitioners, caregivers, and
managers of the ECD centres.
Adequate Supply and Professionalization of ETD Workforce: In order to improve the quality of
mathematics, science and technology, the SETA provides bursaries to and fund workplace
experience for teacher education students giving priority to those studying the teaching of these
subjects.
Decline in Union Membership: The SETA will improve the skills of more of unions’ representatives
(on areas such as governance, policy development, negotiation and leadership skills, etc.) which in
turn will improve understanding, advance transformation agenda and better the working
relationship of the unions and the employers in all the sectors especially the ETD.
The Fourth Industrial Revolution: In response to this, the SETA seeks to establish a research
partnership with one of the universities to further probe the Fourth Industrial Revolution and its
impact on skills development especially in the ETD Sector. Furthermore, the SETA needs to explore
the possibility of accrediting some of the online courses in the ETD and related fields.
Recognition of Prior Learning (RPL) to enhance opportunities for employment: The SETA needs
to review the RPL rollout and its funding models in order to explore ways of expediting the
process as well as using RPL to address transformation imperatives.
This chapter has also discussed the key national strategies and plans which have implications for skills
especially in the ETD sector. The introduction of the new NSDP, 2030 mandated from the White Paper
for Post School Education and Training highlights the trajectory the skills development agencies should
follow to fulfil the goals of the NDP, 2030 aimed at addressing transformation within and across
educational institutions among other things. All of these skills issues and national strategies require
aggressive focus to increase the pool of human resources to provide relevant skills across all educational
settings including workplaces which will be important for the growth of the economy.
Chapter 3:
Chapter 3 has indicated the extent and nature of skills demand varies within and across the ETD
subsectors. It has raised a concern about the limiting guide by DHET in the compilation of the top 10
sectoral priority occupations list results to the limited coverage of the sector. The chapter has also
58
shown a need to the SETA to review (through stakeholder consultations) the jobs regime in the sector
in order to address the challenges posed by the OFO Codes in a quest to eliminate poor quality of data
in skills planning process. The section has also shown a need to investigate the implications of the move
of ECD from DSD to DBE. The SETA should continue to take a lead in programs such as WIL components
of staff qualifications and facilitate the provision of high quality WPBE for staff in the TVET subsector.
Chapter 4
In conclusion, as a constituency-based and stakeholder-driven organization, the ETDP SETA values and
embraces various types of partnership models and continues to explore new ones. This has contributed
to the SETA being able to achieve, to a greater extent, its targets on an annual basis. There is however
a need for the SETA to review those long-term partnerships to see if they enable the SETA to deliver on
its skills development mandate. By the same token, whilst the SETA considers to move aggressively in
establishing new partnerships, it should as well maintain the current relationships going forward.
Chapter 5
It is necessary to review the current PME&R policy and framework, which currently focuses
on programme and project monitoring and achievement of targets to include a redefined role
of M&E in planning, implementation and reporting.
The review of the M&E policy and framework will be complemented by introducing and
facilitating a progressive approach in the development of TOCs entailing SMART performance
indicators (PIs) for each of the programmes outlined in the Strategic Plan and Annual
Performance Plan. The TOCs as tools for planning should also be used to guide programme
implementation and reporting.
To ensure that information from M&E in particular from evaluations is utilised to inform
planning and quarterly implementation reviews, management responses to all findings and
recommendations that emanate from such studies must be developed and these must feed
into the SSP Continuous Improvement Plans (CIPs) which should be reviewed regularly or on
a quarterly basis.
The aforementioned recommendations will require a total overhaul of how M&E is currently
configured and conceptualised. The CEO should consider appointing an M&E Steering
Committee comprised of key role players (both internally and externally) in research,
planning, implementation and reporting. One of the key responsibilities of the Steering
Committee is to design and drive the change management strategy to mete out issues of
change resistance and organisational silo mentality. Furthermore, this committee could also
oversee implementation of sectoral strategic skills priorities through planning,
implementation and reporting.
As part of its mandate, the M&E Steering Committee must ensure that an organisational-wide
‘three to five years’ evaluations plan is in place. The plan should include various types of
evaluations to be conducted at various intervals. Critical to the evaluation plan is to conduct
an impact assessment to scientifically determine the SETA’s progress towards the
achievement of its strategic outcomes-oriented goals. The evaluation plan should make a
provision for implementation analysis or process evaluations to determine the causes of late
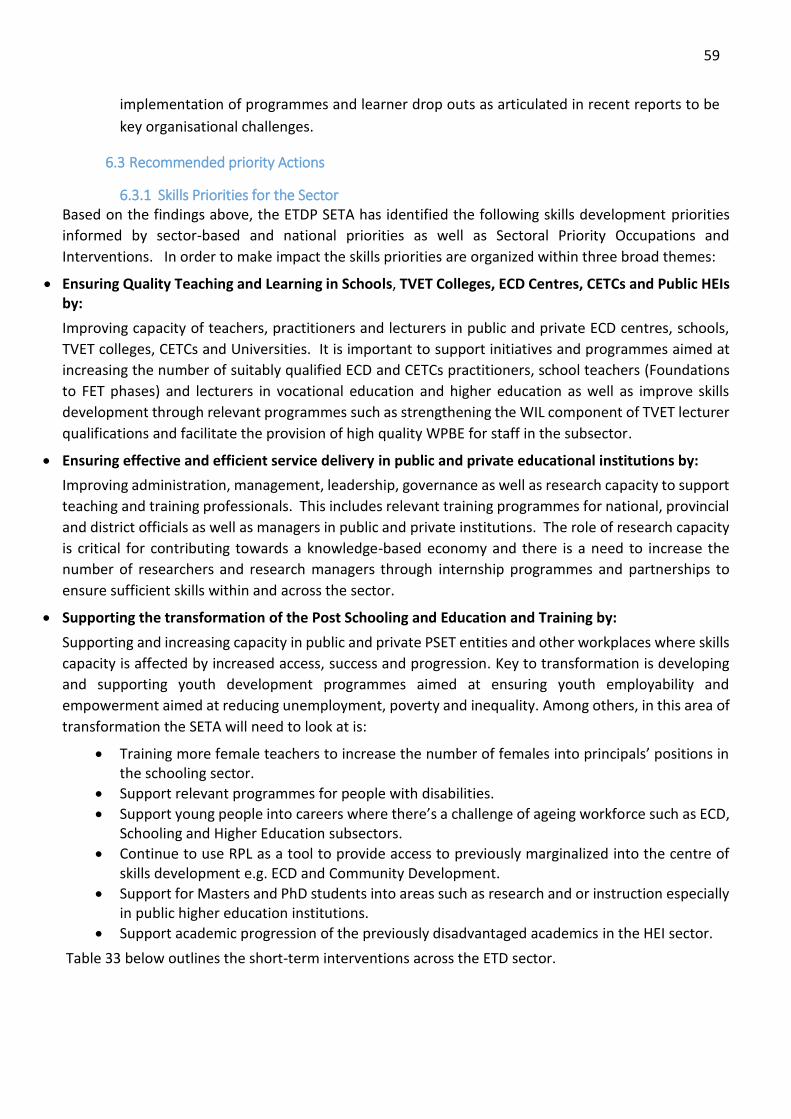
59
implementation of programmes and learner drop outs as articulated in recent reports to be
key organisational challenges.
6.3 Recommended priority Actions
6.3.1 Skills Priorities for the Sector Based on the findings above, the ETDP SETA has identified the following skills development priorities
informed by sector-based and national priorities as well as Sectoral Priority Occupations and
Interventions. In order to make impact the skills priorities are organized within three broad themes:
Ensuring Quality Teaching and Learning in Schools, TVET Colleges, ECD Centres, CETCs and Public HEIs by:
Improving capacity of teachers, practitioners and lecturers in public and private ECD centres, schools,
TVET colleges, CETCs and Universities. It is important to support initiatives and programmes aimed at
increasing the number of suitably qualified ECD and CETCs practitioners, school teachers (Foundations
to FET phases) and lecturers in vocational education and higher education as well as improve skills
development through relevant programmes such as strengthening the WIL component of TVET lecturer
qualifications and facilitate the provision of high quality WPBE for staff in the subsector.
Ensuring effective and efficient service delivery in public and private educational institutions by:
Improving administration, management, leadership, governance as well as research capacity to support
teaching and training professionals. This includes relevant training programmes for national, provincial
and district officials as well as managers in public and private institutions. The role of research capacity
is critical for contributing towards a knowledge-based economy and there is a need to increase the
number of researchers and research managers through internship programmes and partnerships to
ensure sufficient skills within and across the sector.
Supporting the transformation of the Post Schooling and Education and Training by:
Supporting and increasing capacity in public and private PSET entities and other workplaces where skills
capacity is affected by increased access, success and progression. Key to transformation is developing
and supporting youth development programmes aimed at ensuring youth employability and
empowerment aimed at reducing unemployment, poverty and inequality. Among others, in this area of
transformation the SETA will need to look at is:
Training more female teachers to increase the number of females into principals’ positions in the schooling sector.
Support relevant programmes for people with disabilities.
Support young people into careers where there’s a challenge of ageing workforce such as ECD, Schooling and Higher Education subsectors.
Continue to use RPL as a tool to provide access to previously marginalized into the centre of skills development e.g. ECD and Community Development.
Support for Masters and PhD students into areas such as research and or instruction especially in public higher education institutions.
Support academic progression of the previously disadvantaged academics in the HEI sector.
Table 33 below outlines the short-term interventions across the ETD sector.
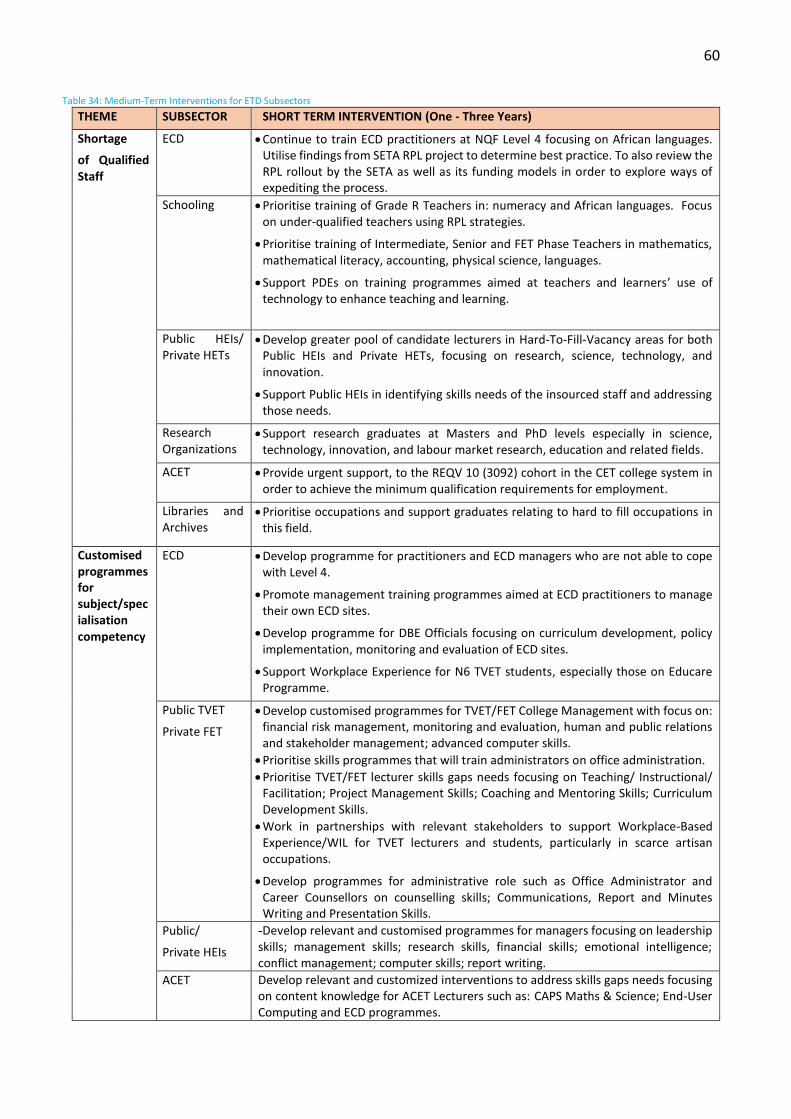
60
Table 34: Medium-Term Interventions for ETD Subsectors
THEME SUBSECTOR SHORT TERM INTERVENTION (One - Three Years)
Shortage
of Qualified Staff
ECD
Continue to train ECD practitioners at NQF Level 4 focusing on African languages. Utilise findings from SETA RPL project to determine best practice. To also review the RPL rollout by the SETA as well as its funding models in order to explore ways of expediting the process.
Schooling
Prioritise training of Grade R Teachers in: numeracy and African languages. Focus on under-qualified teachers using RPL strategies.
Prioritise training of Intermediate, Senior and FET Phase Teachers in mathematics, mathematical literacy, accounting, physical science, languages.
Support PDEs on training programmes aimed at teachers and learners’ use of technology to enhance teaching and learning.
Public HEIs/ Private HETs
Develop greater pool of candidate lecturers in Hard-To-Fill-Vacancy areas for both Public HEIs and Private HETs, focusing on research, science, technology, and innovation.
Support Public HEIs in identifying skills needs of the insourced staff and addressing those needs.
Research Organizations
Support research graduates at Masters and PhD levels especially in science, technology, innovation, and labour market research, education and related fields.
ACET Provide urgent support, to the REQV 10 (3092) cohort in the CET college system in order to achieve the minimum qualification requirements for employment.
Libraries and Archives
Prioritise occupations and support graduates relating to hard to fill occupations in this field.
Customised programmes for subject/specialisation competency
ECD Develop programme for practitioners and ECD managers who are not able to cope with Level 4.
Promote management training programmes aimed at ECD practitioners to manage their own ECD sites.
Develop programme for DBE Officials focusing on curriculum development, policy implementation, monitoring and evaluation of ECD sites.
Support Workplace Experience for N6 TVET students, especially those on Educare Programme.
Public TVET
Private FET
Develop customised programmes for TVET/FET College Management with focus on: financial risk management, monitoring and evaluation, human and public relations and stakeholder management; advanced computer skills.
Prioritise skills programmes that will train administrators on office administration.
Prioritise TVET/FET lecturer skills gaps needs focusing on Teaching/ Instructional/ Facilitation; Project Management Skills; Coaching and Mentoring Skills; Curriculum Development Skills.
Work in partnerships with relevant stakeholders to support Workplace-Based Experience/WIL for TVET lecturers and students, particularly in scarce artisan occupations.
Develop programmes for administrative role such as Office Administrator and Career Counsellors on counselling skills; Communications, Report and Minutes Writing and Presentation Skills.
Public/
Private HEIs
-Develop relevant and customised programmes for managers focusing on leadership skills; management skills; research skills, financial skills; emotional intelligence; conflict management; computer skills; report writing.
ACET Develop relevant and customized interventions to address skills gaps needs focusing on content knowledge for ACET Lecturers such as: CAPS Maths & Science; End-User Computing and ECD programmes.
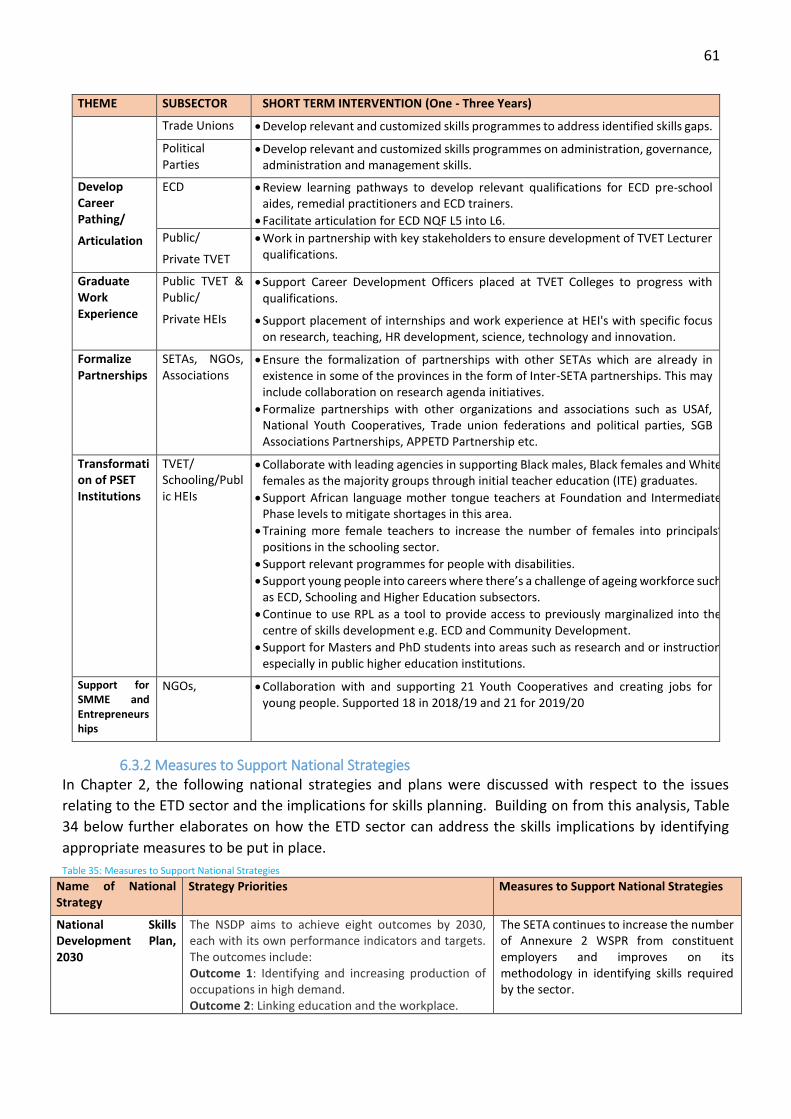
61
THEME SUBSECTOR SHORT TERM INTERVENTION (One - Three Years)
Trade Unions Develop relevant and customized skills programmes to address identified skills gaps.
Political Parties
Develop relevant and customized skills programmes on administration, governance, administration and management skills.
Develop Career Pathing/
Articulation
ECD Review learning pathways to develop relevant qualifications for ECD pre-school aides, remedial practitioners and ECD trainers.
Facilitate articulation for ECD NQF L5 into L6.
Public/
Private TVET
Work in partnership with key stakeholders to ensure development of TVET Lecturer qualifications.
Graduate Work Experience
Public TVET & Public/
Private HEIs
Support Career Development Officers placed at TVET Colleges to progress with qualifications.
Support placement of internships and work experience at HEI's with specific focus on research, teaching, HR development, science, technology and innovation.
Formalize Partnerships
SETAs, NGOs, Associations
Ensure the formalization of partnerships with other SETAs which are already in existence in some of the provinces in the form of Inter-SETA partnerships. This may include collaboration on research agenda initiatives.
Formalize partnerships with other organizations and associations such as USAf, National Youth Cooperatives, Trade union federations and political parties, SGB Associations Partnerships, APPETD Partnership etc.
Transformation of PSET Institutions
TVET/ Schooling/Public HEIs
Collaborate with leading agencies in supporting Black males, Black females and White females as the majority groups through initial teacher education (ITE) graduates.
Support African language mother tongue teachers at Foundation and Intermediate Phase levels to mitigate shortages in this area.
Training more female teachers to increase the number of females into principals’ positions in the schooling sector.
Support relevant programmes for people with disabilities.
Support young people into careers where there’s a challenge of ageing workforce such as ECD, Schooling and Higher Education subsectors.
Continue to use RPL as a tool to provide access to previously marginalized into the centre of skills development e.g. ECD and Community Development.
Support for Masters and PhD students into areas such as research and or instruction especially in public higher education institutions.
Support for SMME and Entrepreneurships
NGOs, Collaboration with and supporting 21 Youth Cooperatives and creating jobs for young people. Supported 18 in 2018/19 and 21 for 2019/20
6.3.2 Measures to Support National Strategies In Chapter 2, the following national strategies and plans were discussed with respect to the issues
relating to the ETD sector and the implications for skills planning. Building on from this analysis, Table
34 below further elaborates on how the ETD sector can address the skills implications by identifying
appropriate measures to be put in place.
Table 35: Measures to Support National Strategies
Name of National Strategy
Strategy Priorities Measures to Support National Strategies
National Skills Development Plan, 2030
The NSDP aims to achieve eight outcomes by 2030, each with its own performance indicators and targets. The outcomes include: Outcome 1: Identifying and increasing production of occupations in high demand. Outcome 2: Linking education and the workplace.
The SETA continues to increase the number of Annexure 2 WSPR from constituent employers and improves on its methodology in identifying skills required by the sector.
62
Name of National Strategy
Strategy Priorities Measures to Support National Strategies
Outcome 3: Improving the level of skills in the South African workforce. Outcome 4: Increasing access to occupationally directed programmes. Outcome 5: Supporting the growth of the public college system. Outcome 6: Skills development support for entrepreneurship and cooperative development. Outcome 7: Encouraging and supporting worker initiated training. Outcome 8: Supporting career development services.
The supports WIL for students coming from TVET Colleges, Universities and Universities of Technology. Support of teachers, university and TVETs and CETs lecturers through skills programmes and full qualifications. Using TVETs as providers of learnerships related to education and training such as ECD. Support for youth cooperatives involved in education and related fields. Supporting trade unions as constituent employers of the SETA in areas such as governance.
Developing and distributing Career Guides to all the provinces in the country.
New Growth Path (NGP): Framework
Implementing strategic partnerships with key role-players (DBE, PDEs, DHET, industry) to support:
- Workplace-based learning interventions and Workplace-Based Exposure for teachers/ lecturers.
- Training interventions in poorly performing schools. - Programmes on Green Skills for Teachers and Lecturers
Support training of HEI lecturers to gain appropriate competencies in order to improve student performance through academics achieving Masters and PhD programmes; to support TVET/FET college lecturers completing relevant programmes; to support skills development for subject content and methodology.
HRD Strategy 2010 2030
Providing funding to support enrolments in key specialization areas for teachers and lecturers.
Support 25 000 primary and secondary school teachers on subject content methodology and various skills programmes
National Development Plan 2030
Support training of ECD practitioners in registered and provisionally registered centres
Provide funding for new enrolments for schooling and PSET teachers/lecturers
Support skills development programmes to build human and institutional capacity in ECD and increase students’ access to further and higher education institutions through workplace learning programmes
White Paper for Post School Education and Training (2013)
Provide support to develop qualifications and skills programmes relating to workplace-based learning.
Increase students’ access to further and higher education institutions through workplace learning programmes
ISPFTED in South Africa (2011 – 2025)
Provide funding to train teachers/lecturers in key subjects, phases and areas of geographical location required.
Support 25 000 primary and secondary school teachers on subject content methodology and various skills programmes
Strategic Infrastructure Programmes (SIPS)
SIP 13 – To support training and placement of librarians in schools.
SIP 14 – To support DHET regarding Infrastructure development for HE.
SIP 16 to– To supports research relating to the Square Kilometre Array Project
Support skills development programmes to build human and institutional capacity relating to Libraries and Archives and Research.
National Youth Policy (2014-2019)
Support funding for trainee lecturers at TVET colleges. Support TVET/FET college lecturers completing relevant programmes.
National Disability Policy
Provide funding to increase enrolments for training of special needs teachers.
Support people with disabilities by enrolling at least 5% of all target beneficiaries on relevant programmes.
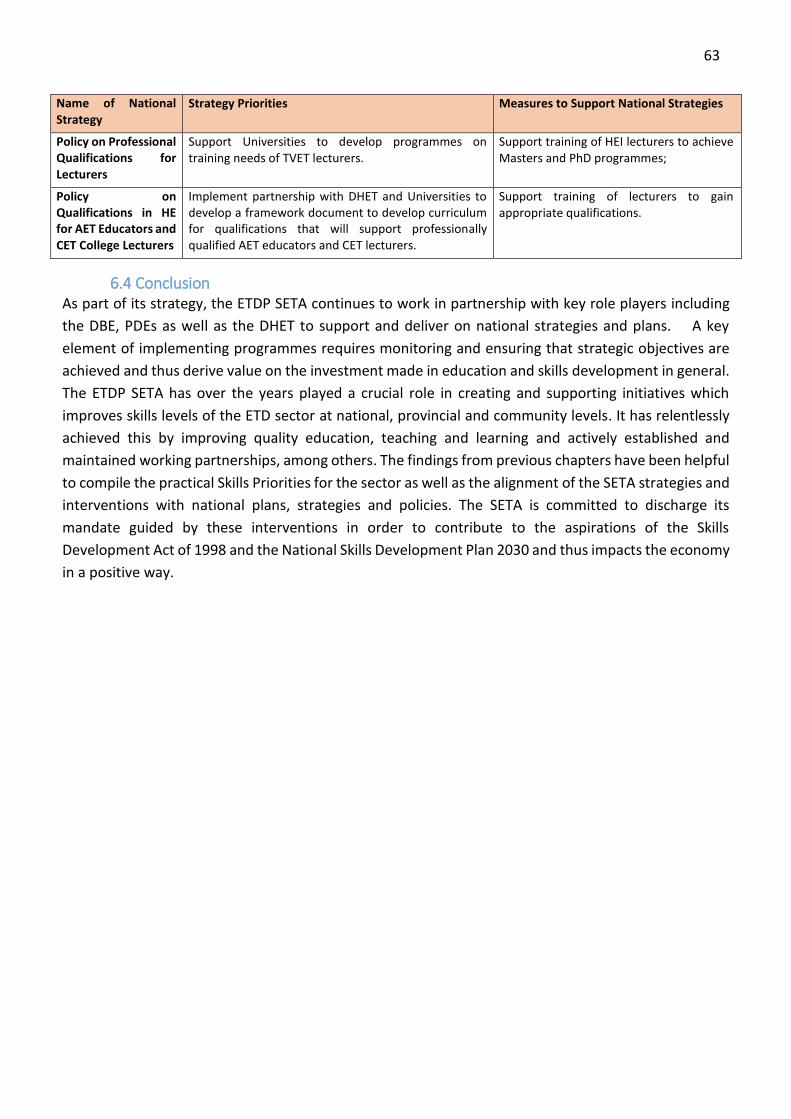
63
Name of National Strategy
Strategy Priorities Measures to Support National Strategies
Policy on Professional Qualifications for Lecturers
Support Universities to develop programmes on training needs of TVET lecturers.
Support training of HEI lecturers to achieve Masters and PhD programmes;
Policy on Qualifications in HE for AET Educators and CET College Lecturers
Implement partnership with DHET and Universities to develop a framework document to develop curriculum for qualifications that will support professionally qualified AET educators and CET lecturers.
Support training of lecturers to gain appropriate qualifications.
6.4 Conclusion As part of its strategy, the ETDP SETA continues to work in partnership with key role players including
the DBE, PDEs as well as the DHET to support and deliver on national strategies and plans. A key
element of implementing programmes requires monitoring and ensuring that strategic objectives are
achieved and thus derive value on the investment made in education and skills development in general.
The ETDP SETA has over the years played a crucial role in creating and supporting initiatives which
improves skills levels of the ETD sector at national, provincial and community levels. It has relentlessly
achieved this by improving quality education, teaching and learning and actively established and
maintained working partnerships, among others. The findings from previous chapters have been helpful
to compile the practical Skills Priorities for the sector as well as the alignment of the SETA strategies and
interventions with national plans, strategies and policies. The SETA is committed to discharge its
mandate guided by these interventions in order to contribute to the aspirations of the Skills
Development Act of 1998 and the National Skills Development Plan 2030 and thus impacts the economy
in a positive way.
| 64
REFERENCES
Bantwini, BD & Letseka, M. (2017). South African teachers caught between nation building and global
demands: Is there a way out/forward? Educational Studies. 52 (4), 329-345.
Blom, R. (2016). Report on Status of Private FET Colleges. Pretoria: DHET.
Career Junction. (2016). Career Junction Index. Accessed 15 June 2016.
Council of Higher Education. (2016). South African Higher Education Reviewed: Two Decades of Democracy.
Pretoria: CHE.
Czerniewicz, L and Carr, T. (2011). Growing Educational use of Technology in a Fast Changing Environment.
Centre for Educational Technology.
Department of Arts and Culture (DAC). (2010). The Demand for and Supply of Skills in Library and
Information Services, Archival Services and Records Management. South Africa: DAC.
Department of Arts and Culture (DAC) & NCLIS. (2014). The Library and Information Services (LIS)
Transformation Charter. Retrieved 16 April. 2016, from www.nlsa.ac.za.
Department of Arts and Culture (DAC). (2017). The state of Libraries in South Africa.
Department of Basic Education. (2011). Integrated Strategic Planning Framework for Teacher Education
and Development in South Africa: 2011 -2016. Pretoria: DBE
Department of Basic Education. (DBE). (2016a). School Realities, 2014. Pretoria: DBE.
Department of Basic Education. (DBE). (2014). NEIMS (National Education Infrastructure Management
System) Standard Report. Pretoria: DBE.
Department of Basic Education. (2015). TIMSS 2015 in South Africa: Highlights of Mathematics and Science
Achievement of Grade 9 South African Learners. Pretoria: DBE
Department of Education (DoE). (2001a). White Paper 5: Early Childhood Development. Pretoria: DoE.
Department of Education (DoE). (2001b). The Nationwide Audit of ECD provisioning in South Africa, DoE.
Department of Higher Education and Training (2010). Establishment of Sector Education and Training
Authorities (SETAs). Government Gazette Number 33756, dated 11 November 2010. Pretoria.
Department of Higher Education and Training (DHET). (2013a). (White Paper for Post-School Education
and Training: Building an Expanded, Effective and Integrated Post-School System. Pretoria: DHET.
Department of Higher Education and Training (DHET). (2013). Policy on Professional Qualifications for
Lecturers in Technical and Vocational Education and Training, Pretoria: DHET.
Department of Higher Education and Training (DHET) Register of Private Colleges and Higher Education
Institutions (released 22 March and 26 May 2017 respectively). Pretoria: DHET.
Department of Higher Education and Training (DHET. (2014). National Policy on Community Colleges.
Pretoria: DHET.
Department of Higher Education and Training (DHET). (2016a). Statistics on Post-School Education and
Training in South Africa: 2014. Released in March 2016. Pretoria: DHET.
Department of Higher Education and Training (DHET). (2016a). Statistics on Post-School Education and
Training in South Africa: 2016. Released in March 2018. Pretoria: DHET.
| 65
Department of Higher Education and Training (DHET). (2019). Sector Skills Plan Updated Framework and
Requirements. Pretoria: DHET.
Department of Higher Education and Training (DHET). (2016c). Relationships between Teacher Supply and
Demand and the Size, Shape and Substance of Teacher Education in South Africa. Pretoria: DHET.
Department of Higher Education and Training (DHET). (2019). The Community Education and Training
College System: National Plan for the implementation of the White Paper for Post-school Education and
Training System 2019-2030. Pretoria: DHET.
Department of Higher Education and Training (DHET). (2016d). Policy on Programmes leading to
Qualifications for Educators and Lecturers in Adult and Community Education and Training. Pretoria:
DHET.
Department of Higher Education and Training (DHET). (2016e). Progress Report on Skills for and through
SIPs – March 2016. Pretoria: DHET.
Department of Labour (2019) List of Registered Trade Unions in South Africa as on May 2019 [online]
http://www.labour.gov.za/DOL/downloads/documents/useful-documents/labour-
relations/regtradeunions sept2017.pdf
Department of Social Development DSD (2012) State of South African Registered Non-Profit Organizations
issued in Terms of the Non-Profit Organizations Act 71 of 1997.
Department of Social Development (DSD) (2014a). Database of registered NGOs in South Africa. Pretoria:
DSD.
Department of Social Development (DSD). (2014b). Outcomes of the ECD Audit. Pretoria: DSD.
Department of Social Development (DSD. (2014c). Annual Report for DSD 2012/2013. Pretoria: DSD.
Department of Social Development (DSD). (2016). Policy for Social Service Practitioners. Pretoria: DSD.
Earle, D. (2010). Tertiary Sector Performance Analysis and Reporting Division. New Zealand: Ministry of
Education.
Economic Development Department. (2011). The New Growth Path. Pretoria: EDD.
ETDP SETA. (2018). Annexure 2 Work Skills Plans and Reports data. Johannesburg: ETDP SETA.
ETDP SETA. (2019). Annexure 2 Work Skills Plans and Reports data for. Johannesburg: ETDP SETA.
ETDP SETA Research Chair for TVET. (2018). Report on TVET Lecturers. Johannesburg: ETDP SETA.
ETDP SETA Research Chair for Labour Market Intelligence in ETD Sector. (2018). Report on Specialised
Occupational List (SpOL) for ETD Sector. Johannesburg: ETDP SETA.
ETDP SETA Research Chair for Monitoring and Evaluation. (2018). Report on Tracking and Tracing of
Learners who completed ETDP SETA Programmes, 2015-2019. Johannesburg: ETDP SETA.
ETDP SETA. (2018) Annual Report for 2017/2018. Johannesburg: ETDP SETA.
ETDP SETA Research Chair for Schooling. (2018) Schooling Sector Skills Plan.
Grawitzky, R. (2007). SETAs – A Vehicle for the Skills Revolution. Cape Town: DPRU.
Human Sciences Research Council (HSRC) (2013). National Survey of Research and Experimental
Development (2012/2013). Released in December 2014. Pretoria: HSRC.
Independent Electoral Commission (IEC). (2016). Register of Political Parties in South Africa. Pretoria: IEC.
| 66
Keevy, J., Green, W., Manik, S. (2014). The Status of Migrant Teachers in South Africa. Pretoria: SAQA.
Kruss, G. and Petersen, I. (2016) Draft document titled Mapping Key Role-Players and SETA Partnerships.
Cape Town: HSRC.
Murray, C. and Biersteker, L. (2014). TVET Colleges: Contributions towards HR development in the Early
Childhood Development Sector. Cape Town: Ilifa Labantwana Technical Report.
National Planning Commission. (2012) National Development Plan 2030: Our Future –Make it Work.
Pretoria: The Presidency.
National Treasury. (2014). Medium Term Strategic Framework (2014-2019). RSA.
National Treasury (2017). Budget 2017: Estimate of National Expenditure. RSA.
Rakabe, E. 2016. Fiscal Arrangements for Financing and Delivery of ECD Infrastructure (in … Submission for
the division of Revenue 2016/2017: For an Equitable Sharing of National Revenue. South Africa: Financial
and fiscal commission. Page. 68 -79).
Rasooldeen, M. D. (2014). Technology remains core criteria for university education. Retrieved August 21,
2014, from http://www.arabnews.com/news/556396.
Republic of South Africa. (2005). Children’s Act Number 38. Government Gazette.
Republic of South Africa. (2013). Human Resource Development Strategy of South Africa. Pretoria.
Richter, L., Biersterker, L. Burns, J., Desmond, C. Feza, N.Harrison, D., Martin, P. Saloojee, H. & Slemming,
W. (2012). Diagnostic Review of Early Childhood Development. Pretoria: Department of Performance,
Monitoring and Evaluation & Inter-Departmental Steering Committee on ECD.
Statistics South Africa (StatsSA). (2013a). Memorandum to Statistics Statistician-General on SIC codes dated
27 February 2013. Pretoria: StatsSA.
South African Media Monitoring and Measurement Association (SAMMA).
South Africa (2013b) General Household Survey, Pretoria: StatsSA.
Statistics South Africa (StatsSA). (2016). Quarterly Labour Force Survey – Quarter 4, 2014. Pretoria: StatsSA.
StatsSA. (2014). National and provincial labour market: Youth. Pretoria: Statistics South Africa. Retrieved
from http://beta2.statssa.gov.za/publications/P02114.2/P02114.22014.pdf.
The Parliament of RSA [Online] https://www.parliament.gov.za/political-party-list .
The Presidency. (2016). National Youth Policy. Pretoria.
Van Broekhuizen. H. (2016). Teacher Supply in South Africa – A Focus on Initial Teacher Education Graduate
Production. Pretoria: The Presidency.
Wildsmith-Cromarty (2017) Preliminary Research Report On ECD: Stakeholder Consultations 2017 & 2016
Wazimap (2016). [Online] https://wazimap-ecd.code4sa.org/.
Macdonald, H. (2004) Geologic Puzzles: Morrison Formation, Starting Point. Retrieved Sept 9, 2004, from
http://serc.carleton.edu/introgeo/interactive/examples/morrisonpuzzle.html
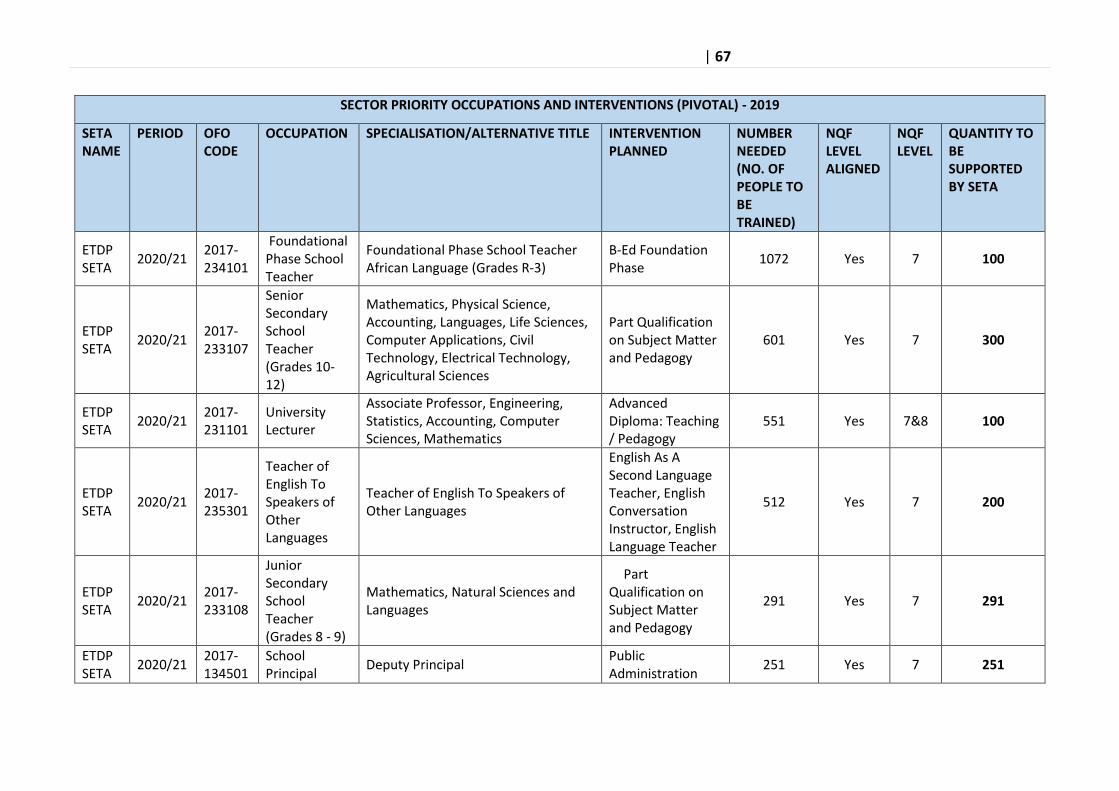
| 67
SECTOR PRIORITY OCCUPATIONS AND INTERVENTIONS (PIVOTAL) - 2019
SETA NAME
PERIOD OFO CODE
OCCUPATION SPECIALISATION/ALTERNATIVE TITLE INTERVENTION PLANNED
NUMBER NEEDED (NO. OF PEOPLE TO BE TRAINED)
NQF LEVEL ALIGNED
NQF LEVEL
QUANTITY TO BE SUPPORTED BY SETA
ETDP SETA
2020/21 2017-234101
Foundational Phase School Teacher
Foundational Phase School Teacher African Language (Grades R-3)
B-Ed Foundation Phase
1072 Yes 7 100
ETDP SETA
2020/21 2017-233107
Senior Secondary School Teacher (Grades 10-12)
Mathematics, Physical Science, Accounting, Languages, Life Sciences, Computer Applications, Civil Technology, Electrical Technology, Agricultural Sciences
Part Qualification on Subject Matter and Pedagogy
601 Yes 7 300
ETDP SETA
2020/21 2017-231101
University Lecturer
Associate Professor, Engineering, Statistics, Accounting, Computer Sciences, Mathematics
Advanced Diploma: Teaching / Pedagogy
551 Yes 7&8 100
ETDP SETA
2020/21 2017-235301
Teacher of English To Speakers of Other Languages
Teacher of English To Speakers of Other Languages
English As A Second Language Teacher, English Conversation Instructor, English Language Teacher
512 Yes 7 200
ETDP SETA
2020/21 2017-233108
Junior Secondary School Teacher (Grades 8 - 9)
Mathematics, Natural Sciences and Languages
Part Qualification on Subject Matter and Pedagogy
291 Yes 7 291
ETDP SETA
2020/21 2017-134501
School Principal
Deputy Principal Public Administration
251 Yes 7 251

| 68
SECTOR PRIORITY OCCUPATIONS AND INTERVENTIONS (PIVOTAL) - 2019
SETA NAME
PERIOD OFO CODE
OCCUPATION SPECIALISATION/ALTERNATIVE TITLE INTERVENTION PLANNED
NUMBER NEEDED (NO. OF PEOPLE TO BE TRAINED)
NQF LEVEL ALIGNED
NQF LEVEL
QUANTITY TO BE SUPPORTED BY SETA
and Management Programme
ETDP SETA
2020/21 2017-235201
Special Needs Teacher
Cognitive and Impairment Special Needs Teacher
Special Needs Teacher
227 Yes 7 227
ETDP SETA
2020/21 2017-234201
Early Childhood Development Practitioner
Early Childcare Teacher Qualification in ECD
220 Yes 5 220
ETDP SETA
2020/21 2017-234102
Senior Primary School Teacher (Grades 4-7)
Mathematics and Natural Science Teacher
Part Qualification on Subject Matter and Pedagogy
291 Yes 7 291
ETDP SETA
2020/21 2017-232130
TVET Educator
TVET Educator
Part Qualification:
Continuing
Professional and
Academic/Lecturer
Development
211 Yes 7 211