Embed Size (px)
Citation preview

1
ASYMMETRIES IN EEG SIGNAL PROPERTIES IN THOSE WITH TEMPORAL LOBE EPILEPSY AND PSYCHOGENIC NON-EPILEPTIC SEIZURES
By
HOLLY SKINNER
A THESIS PRESENTED TO THE GRADUATE SCHOOL OF THE UNIVERSITY OF FLORIDA IN PARTIAL FULFILLMENT
OF THE REQUIREMENTS FOR THE DEGREE OF MASTER OF SCIENCE
UNIVERSITY OF FLORIDA
2012

2
© 2012 Holly Skinner
3
To my family and friends

4
ACKNOWLEDGMENTS
I would like to first thank my family and friends. My dad, mom, step-mom, and
grandmother have always encouraged me to learn at every opportunity. I thank my
boyfriend, Dewayne and his family for welcoming me into their lives during these last
few years while pursuing this master’s degree.
Next, I would like to thank all of my mentors at the University of Florida (UF) and
the Malcom Randall Veterans Affairs Medical Center (MR-VAMC), especially my
primary mentor these last three years, J. Chris Sackellares, MD. He has taught me a
great deal about EEG, epilepsy, research, as well as, advised me on many aspects of
my career. Also, I thank Stephan Eisenschenk, MD, who was my clinical
neurophysiology fellowship director and epilepsy division chief. He has been
supportive of me in pursuing this master’s degree, and always willing to offer his
expertise to improve my research designs.
I am grateful to the team at Optima Neuroscience, and in particular Deng Shan
Shiau, PhD. Dr. Shiau has been instrumental to helping me collect and analyze the
data for this project.
Next, I would like to thank David FitzGerald, MD, Stephen Nadeau, MD, and Bruce
Crosson, PhD, all researchers affiliated with the Brain Rehabilitation Research Center at
the MR-VAMC. Each of these researchers helped me to apply for a VA career
development award over the last few years. I am grateful for the experience in applying
for external research funding.
Also, I would like to sincerely thank my thesis committee chair, Joyce
Stechmiller, PhD and committee member, Steven Roper, MD. I greatly appreciate the

5
time they devoted to the defense, and ideas about alterative conclusions to be drawn
from the results.
Finally, I would like to thank the administrators, program coordinator Eve
Johnson, and teaching faculty of the UF Advanced Post-graduate Program for Clinical
Investigation (APPCI) at UF. I gained and improved upon many research skills because
of the opportunity to participate in this program. I plan to use these skills for years to
come. Over the long-term, I hope to make the UF APPCI and my mentors proud of their
investment in my research future.

6
TABLE OF CONTENTS page ACKNOWLEDGMENTS .................................................................................................. 4
LIST OF TABLES ............................................................................................................ 7
LIST OF FIGURES .......................................................................................................... 8
LIST OF ABBREVIATIONS ............................................................................................. 9
ABSTRACT ................................................................................................................... 10
CHAPTER
1 AN INTRODUCTION TO ELECTROENCEPHALOGRAPHY ................................. 12
A Brief History of Electroencephalography ............................................................. 12
Indications for EEG ................................................................................................. 13 Technical Considerations in EEG Recording .......................................................... 15 Montages ................................................................................................................ 16
Neurophysiologic Basis of EEG Activity .................................................................. 17
Visual Analysis of EEG ........................................................................................... 17
Cellular Substrates of Brain Rhythms ..................................................................... 19
2 EPILEPSY AND NON-EPILEPTIC EVENTS .......................................................... 25
Introduction to Epilepsy........................................................................................... 25 Classification of Epilepsy .................................................................................. 26
Temporal Lobe Epilepsy ......................................................................................... 27
Seizure Semiology in TLE ................................................................................ 28 Electroencephalographic Characteristics of TLE .............................................. 29
Psychogenic Non-epileptic Events .......................................................................... 29 Clinical Manifestations of PNEE ....................................................................... 30
Etiologies of PNEE ........................................................................................... 31 Differentiating Epilepsy from PNEE ........................................................................ 31
3 MEASURING INTRAHEMISPHERIC EEG ASYMMETRY IN TLE AND PNEE ...... 33
4 STUDY DESIGN AND OUTCOME ......................................................................... 36 Methods .................................................................................................................. 36
Results and Conclusion .......................................................................................... 38
LIST OF REFERENCES ............................................................................................... 44
BIOGRAPHICAL SKETCH ............................................................................................ 47

7
LIST OF TABLES
Table page 1-1 Clinical indications for obtaining an EEG ............................................................ 20

8
LIST OF FIGURES
Figure page 1-1 Hans Berger’s first string Galvanometer ............................................................. 21
1-2 The International 10-20 System for Scalp Electrode Placement......................... 22
1-3 Wave discharges. ............................................................................................... 23
1-4 Rhythmic and sharply contoured, 7-8 Hertz theta activity at the onset of a focal seizure localizing to the left temporal lobe. ................................................ 24
4-1 Bi-variate analysis of diagnosis and gender ....................................................... 40
4-2 Bi-variate analysis for diagnosis and age (in years).. ......................................... 41
4-3 Distributions of the interhemispheric asymmetry. ............................................... 41
4-4 Bi-variate analysis of the interhemispheric differences in the PMRS=pattern matched regularity statistic.. ............................................................................... 42
4-5 Bi-variate analysis of the interhemispheric differences in the AV=amplitude variation. ............................................................................................................. 43

9
LIST OF ABBREVIATIONS
ADC Analog to digital converter
AED Anti-epileptic drug
ANOVA Analysis of variance
AV Amplitude variation
CPS Complex partial seizure
DC Direct current
EEG Electroencephalogram
EMU Epilepsy monitoring unit
Hz Hertz (cycles per second)
ILAE International League Against Epilepsy
IHA Interhemispheric asymmetry
IRB Institutional Review Board
MR-VAMC Malcom Randall Veterans Affairs Medical Center
MUSC Medical University of South Carolina
NTLE Neocortical temporal lobe epilepsy
PLED Periodic Lateralized epileptiform discharges
PNEE Psychogenic non-epileptic events
PMRS Pattern-match regularity statistics
REM Rapid eye movement (sleep)
TLE Temporal lobe epilepsy
UF University of Florida
VEEG Video EEG

10
Abstract of Thesis Presented to the Graduate School of the University of Florida in Partial Fulfillment of the Requirements for the Degree of Master of Science
ASYMMETRIES IN EEG SIGNAL PROPERTIES IN THOSE WITH TEMPORAL LOBE
EPILEPSY AND PSYCHOGENIC NON-EPILEPTIC SEIZURES
By
Holly Skinner
August 2012
Chair: Joyce Stechmiller Major: Medical Science — Clinical and Translational Science
Epileptic seizures can appear clinically similar to psychogenic non-epileptic
events (PNEE), which can lead to erroneous diagnosis and treatment. Differentiation of
these two conditions often requires multi-day, in-patient video electroencephalogram
(VEEG) monitoring to record seizures or seizure-like PNEE. Also, brief runs of
“epileptiform” activity may be recorded during the times when seizures are not
occurring; these periods of time are referred to as the interictal periods. However, if
seizures and/or interictal epileptiform abnormalities are not noted during the VEEG
monitoring, then a diagnosis cannot be made. Therefore, we developed a hypothesis-
driven approach to distinguish those with epileptic seizures from those with PNEE by
quantitative analysis of brief epochs of electroencephalogram (EEG) in the interictal
period, when no epileptiform activity was present on visual inspection. Our goal in this
hypothesis testing study was to investigate whether differences in measures of EEG
signal inter-hemisphere asymmetry (IHA) exist between patients with a common form of
epilepsy, temporal lobe epilepsy (TLE), and patients with PNEE.
Interictal EEG epochs (10 seconds each) were sampled from VEEG recordings
obtained from 62 patients. A total of 620 epochs in the relaxed, awake state were

11
collected from TLE and PNEE patient groups. Within each EEG sample epoch, we
calculated the signal regularity using the pattern-match regularity statistic (PMRS), and
amplitude variation (AV). These calculations were performed in the F8, T4, F7, and T3
EEG channels utilizing a non-overlapping 5.12 second computation window. IHA
values were then calculated as the absolute difference between left (F7 and T3) and
right (F8 and T4) channels, with respect to PMRS and AV values, respectively.
We found that IHA of the PMRS from the temporal electrodes is significantly larger in
patients with TLE than those with PNEE (p=0.0182). These results suggest
measureable characteristics of the interictal EEG may be useful in distinguishing
patients with TLE from those with PNEE.

12
CHAPTER 1 AN INTRODUCTION TO ELECTROENCEPHALOGRAPHY
A Brief History of Electroencephalography
EEG is a neurophysiologic tool by which temporal and spatial information about
brain activity can be recorded. EEG electrodes can record brainwaves non-invasively
by placing electrodes on the scalp or through invasive procedures brain activity can be
recorded near or within brain tissue. However, scalp EEG recordings are the focus of
the research performed in this thesis. Scalp EEG is widely used in many fields of
neuroscience including neurology, psychology, sleep medicine, and neuroscience
research.
The first electrical brain activity was recorded in animals by English physician
Richard Caton (1842-1926) during the 1870s.(1) This brain activity was recorded using
a galvanometer with a beam of light cast onto a mirror to reflect a large scale on a wall.
However, it was Austrian neuropsychiatrist Hans Berger (1873-1941) who was deemed
the father of encephalography.(1) Dr. Berger was the first to record a single channel of
electrical brain activity in humans, and published this recording in 1929. He first used a
sting Galvanometer (Figure 1-1), and later a double-coil Galvanometer.(2,3) Over the
next several decades, several technological advances improved the quality of EEG
records. Researchers began to use oscilloscopes to observe waveforms in real time.
The quality of cerebral waveforms captured was improved by the development of
amplifiers and filters. Also, over time the number of EEG electrodes used to record
brain activity increased.
Beginning in the 1970s, mechanical apparatus used to capture and record EEG
was replaced by computerized techniques.(2) Until the 1990s, centers utilizing EEG

13
relied on paper tracing and taped video recording of EEG data. However, since that
time, most centers have begun store data using digital means, which provides greater
opportunity for manipulation of the data after recording. As such, sophisticated
techniques for EEG analysis have emerged.(4)
A standard system of electrode placement is essential for communication of EEG
results between different laboratories. In 1958, Herbert Jasper proposed the 19
channel, International 10-20 system for electrode placement worldwide (Figure 1-2).
Placement of electrodes in this system begins by distinguishing the sagittal anterior-
posterior distance between the nasion and inion, placing the first two electrodes at
distances 10 percent above those bony landmarks, then placing the additional
electrodes in specified locations which are at 10 to 20 percent distances from previously
marked landmarks. The International 10-20 system is still in place today, and was the
electrode placement used for the recording of EEG data in this project.
Indications for EEG
Around the time Hans Berger was recording the first human EEGs, his
observations primarily focused on describing normal human physiology. For example,
he noted that alpha waves arising from the occipital region attenuated with eye
opening.(1,5) As multi-channel EEG emerged, alterations in wave morphology were
noted in the area of brain lesions. As such, EEG served as a non-invasive means of
localizing focal, pathologic processes in the brain. Since the arrival of neuro-imaging
techniques such a computed tomography and magnetic resonance imaging, EEG is not
nearly so relied upon for its localizing capabilities. However, EEG remains a useful
source of information that aids in diagnosis for many clinical scenarios.

14
Table 1-1 provides a full list of indications for EEG. However, EEG is most often
used to evaluate for the presence of epileptiform appearing activity. Epileptiform activity
refers to paroxysmal, sharply contoured or rhythmic activity that may be seen in the
setting of epilepsy. Furthermore, the EEG can help clinicians to classify the type of
seizure disorder and localize the “onset zone” of seizure activity. These concepts of
seizure disorder classification and localization are discussed further in Chapter 2.
Epileptiform activity may occur during the ictal or interictal period. The time during a
seizure is referred to as the ictal period, and interictal period refers to the time in
between seizures. During the interictal, brief epileptiform activity, generally lasting
approximately 0.5 seconds to 3 seconds, may or may not be present. Interictal activity
consists of sharply contoured “spikes” or “sharps,” often with an after-going slow wave,
higher amplitude activity than the background, and disruption of the background rhythm.
(1,5) Examples of interictal epileptiform activity are displayed in Figure 1-3.
Continuous ictal activity can be seen on an EEG throughout a seizure, and can last
seconds to minutes, or occasionally even hours. This observation is true except in rare
instances where seizure activity is confined to a small brain region that is not easily
recorded with scalp EEG, such as in seizure localized to the orbital frontal regions or
near the skull base. Figure 1-4 illustrates ictal activity localizing to the left temporal
lobe. However, for this research project, we specifically selected 10-second samples of
EEG data where no interictal or ictal epileptiform activity was visualized. This approach
was important because an EEG recording may fail to demonstrate ictal or interictal
epileptiform activity even if a patient has epilepsy. Increasing the time of the recording
decreases the chances of missing epileptiform activity.(6)

15
As implied above, the duration of an EEG recording can vary from 20 minutes to
several days depending on the goals of the study. Because the timing of seizure
activity is largely unpredictable, baseline EEGs lasting 20 to 60 minutes generally
capture the interictal period. As such, the baseline EEG is most useful for finding
evidence of interictal epileptiform activity rather than ictal activity.
While EEGs recordings can last from minutes to hours to days, or even weeks,
the goal of longer recordings is usually to capture seizures or ictal activity. To improve
the chances of capturing seizures during a specific time, patients may be admitted into
an epilepsy monitoring unit.(7,8) In these units, continuous EEG with video (VEEG) is
performed. Also, provocation techniques such as tapering seizure medications, sleep
deprivation, flashing lights, and hyperventilation may be used to increase the likelihood
that a patient will have a seizure. All of the EEG data for this study was obtained by
analyzing recorded VEEG data. This data was recorded in epilepsy monitoring units at
the Medical University of South Carolina in Charleston, SC.
Technical Considerations in EEG Recording
The EEG recordings used for this project were digitally recorded. EEG data
acquisition begins when electrodes placed on the on the scalp after cleaning the skin to
remove oils and applying an ionic solution at the electrode site. This preparation allows
current to flow from the neurons, through human tissue and an electrode wire, then into
to a “jack box.” This direct current (DC) signal is adjusted with filters and amplifiers.
Once EEG data has been captured, it is digitized by an analog to digital
converter (ADC). The ADC converts continuous information about EEG voltages into
samples measured many times per second. In this study, a 256 cycles per seconds or
hertz (Hz) sampling rate was used. Resolution of the EEG waveforms on a computer

16
monitor depends on the amount of data stored in bytes and the computer monitor
screen resolution. For this study, a 12-bit recording system was used.
Montages
Voltage refers to the electric tension or potential between two points, and how
voltage changes over time is the basis of EEG recordings. Since each EEG electrode is
measuring current from a single brain region, a second comparison point must be used
to measure the voltage between the two points.(1,5) The voltage between these two
points is referred to as an EEG channel, and the two points in the channel may be
adjacent electrodes, distant electrodes, or even a ground. The configuration of how
electrodes channels are viewed on paper or a computer monitor is referred to as a
montage.
Two main types of montages, the bipolar montage and the referential montage,
are used in EEG recordings. When bipolar montages are used, each electrode is
compared to an adjacent electrode in a chain-like fashion. Alternatively, referential
montages produce EEG channels that compare each scalp electrode to one or two
references. One advantage of using a referential montage is that all electrical
amplitudes are compared to a single source. Hence, when looking at several channels,
the channel with the largest amplitude waveform will be the source of that wave.(1)
Also, since homologous electrodes on contralateral hemispheres (T8 on the right versus
T7 on the left) will be equal distances from the reference, referential montages are ideal
for assessing symmetry between the hemispheres. In our study, an average, referential
montage was used. Voltage was measured by comparing the current in each electrode
to the current at the mid-way point between the Cz and Pz electrodes.

17
Neurophysiologic Basis of EEG Activity
EEG waveforms are produced by current generated by neurons in the brain.
These currents are produced by the flow of ions moving in and out of the extracellular
space.(5) Single cell EEG recordings have demonstrated that waveforms noted on
EEG are due to post-synaptic potentials which last 20-200 msec.(1) An excitatory post-
synaptic potential (EPSP) occurs when positively charged sodium and calcium ions
move into the intracellular space and the cell is depolarized. ESPS produce negative or
upward deflected waveforms. Inhibitory post-synaptic potentials (IPSP) occur when
cells become hyperpolarized from potassium moving out of the cell. IPSP produce
downward or positive deflections. Also, an EEG best detects electric potentials that
are a short distance from the scalp. As such, activity from neurons in the cerebral
cortex is detected better than activity from deeper brain tissue.
Visual Analysis of EEG
Visual interpretation of EEG is a skill is mastered with years of experience, but
the process that EEG readers, or encephalographers, follow can be broken down into
steps including the evaluation of EEG frequency, rhythmicity, amplitude, symmetry, and
synchrony. As an encephalographer scrolls through an EEG, one of the first
characteristics noted is the frequency of EEG rhythms, which are measured in Hz.
Brain wave activity falls into one of four frequency bands: beta (13-30 Hz), alpha (8.5-
12 Hz), theta (4-8 Hz), delta (<4 Hz). Often overlapping frequencies are seen in the
waveforms.
The next aspect of importance is amplitude, which is measured in microvolts
(μV), and can range from low (0-25 μV) to moderate (25-75 μV) to high (>75 μV).
Amplitude can be influenced by several factors, such as cortical injury, extra-axial fluid
18
collection (hematoma or hygroma), or increased skull thickeness, all of which can
decrease the measured amplitude. Likewise, skull defect from fracture or craniotomy
will decrease resistance and increase measured amplitudes.
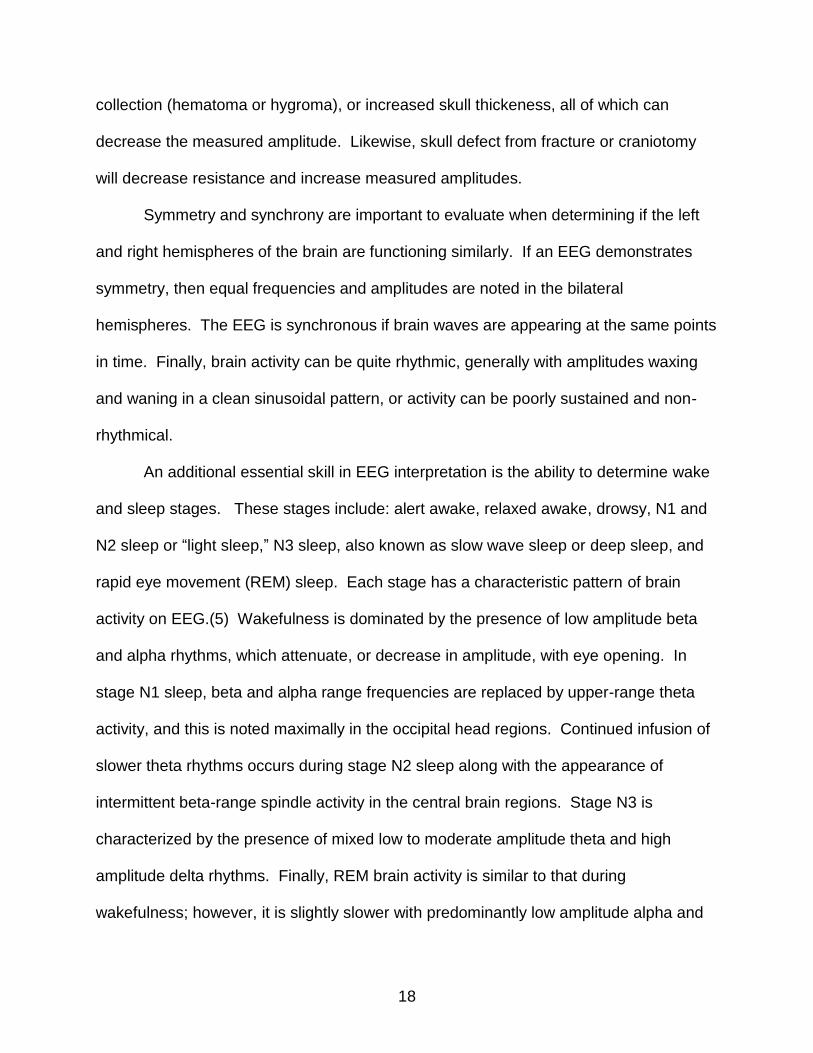
Symmetry and synchrony are important to evaluate when determining if the left
and right hemispheres of the brain are functioning similarly. If an EEG demonstrates
symmetry, then equal frequencies and amplitudes are noted in the bilateral
hemispheres. The EEG is synchronous if brain waves are appearing at the same points
in time. Finally, brain activity can be quite rhythmic, generally with amplitudes waxing
and waning in a clean sinusoidal pattern, or activity can be poorly sustained and non-
rhythmical.
An additional essential skill in EEG interpretation is the ability to determine wake
and sleep stages. These stages include: alert awake, relaxed awake, drowsy, N1 and
N2 sleep or “light sleep,” N3 sleep, also known as slow wave sleep or deep sleep, and
rapid eye movement (REM) sleep. Each stage has a characteristic pattern of brain
activity on EEG.(5) Wakefulness is dominated by the presence of low amplitude beta
and alpha rhythms, which attenuate, or decrease in amplitude, with eye opening. In
stage N1 sleep, beta and alpha range frequencies are replaced by upper-range theta
activity, and this is noted maximally in the occipital head regions. Continued infusion of
slower theta rhythms occurs during stage N2 sleep along with the appearance of
intermittent beta-range spindle activity in the central brain regions. Stage N3 is
characterized by the presence of mixed low to moderate amplitude theta and high
amplitude delta rhythms. Finally, REM brain activity is similar to that during
wakefulness; however, it is slightly slower with predominantly low amplitude alpha and
19
theta rhythms. Also, sharply contoured, theta range “saw-tooth” waves may be seen in
the central regions.
In this research project, we collected samples of EEG data in the relaxed, awake
state during eye closure when alpha activity was apparent in the posterior (occipital)
channels. This stage was selected because it is the easiest to recognize and would be
fast to capture on a short duration EEG, and our long-term goal is to reduce the
recording time and amount of EEG data needed to differentiate patients with epilepsy
and non-epileptic events.
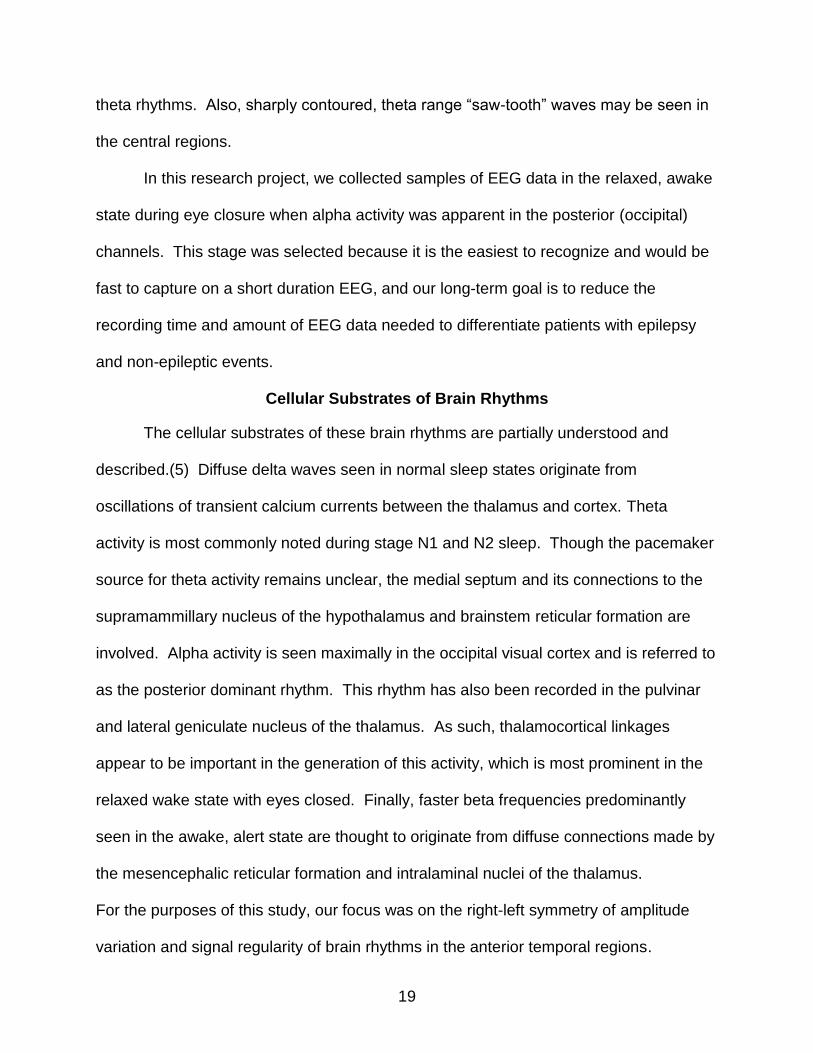
Cellular Substrates of Brain Rhythms
The cellular substrates of these brain rhythms are partially understood and
described.(5) Diffuse delta waves seen in normal sleep states originate from
oscillations of transient calcium currents between the thalamus and cortex. Theta
activity is most commonly noted during stage N1 and N2 sleep. Though the pacemaker
source for theta activity remains unclear, the medial septum and its connections to the
supramammillary nucleus of the hypothalamus and brainstem reticular formation are
involved. Alpha activity is seen maximally in the occipital visual cortex and is referred to
as the posterior dominant rhythm. This rhythm has also been recorded in the pulvinar
and lateral geniculate nucleus of the thalamus. As such, thalamocortical linkages
appear to be important in the generation of this activity, which is most prominent in the
relaxed wake state with eyes closed. Finally, faster beta frequencies predominantly
seen in the awake, alert state are thought to originate from diffuse connections made by
the mesencephalic reticular formation and intralaminal nuclei of the thalamus.
For the purposes of this study, our focus was on the right-left symmetry of amplitude
variation and signal regularity of brain rhythms in the anterior temporal regions.

20
Table 1-1. Clinical indications for obtaining an EEG Indication Example Diagnosis of seizures disorders Prevalence of spike or sharp waves, or
rhythmic delta or theta range activity Classification of seizure disorders Focal or Generalized Localization of seizure onset zones Left or right
Frontal Temporal Parietal Occipital Generalized
Identification of neurologic disorders with classic EEG patterns including:
Herpes Simplex encephalitis-PLEDS Creutzfield-Jakob disease-periodic frontal
sharp waves Subacute sclerosing panencephalitis-high
voltage bifrontal spikes Confirmation that altered mental status is not
due to seizure Encephalopathy Syncope Psychogenic episode
Confirmation of brain death Electro-cerebral silence Prognosis in coma Based on background pattern, presence or
absence of seizure activity, and reactivity to stimuli
Confirmation of diagnosis of sleep disorders EEG channels used in polysomnography, and the multiple sleep latency test

21
Figure 1-1. Hans Berger’s first string Galvanometer Electroencephalogram. Items
indicated on the figure are as follows: 1) crank, 2) marker fibers, 3) on/off switch (far right), 4) lens, 5) diaphragm, 6) paper box, 7) tuning fork. Reproduced with permission from Elsevier from the journal article: Gloor, P. Hans Berger and the discovery of the electroencephalogram. Electroencephalography and Clinical Neurophysiology.1969; S28:1–36.

22
Figure 1-2. The International 10-20 System for Scalp Electrode Placement. Reproduced from the Wikipedia Commons freely licensed media file repository.

23
A.
B.
Figure 1-3. Wave discharges. A.). Diffuse, anteriorly maximal 3 hertz polyspike-wave discharges due to primary generalized epilepsy. B.) Right temporal sharp-wave discharge followed by a run of temporal intermittent rhythmic delta activity (TIRDA). Both sharp waves and TIRDA are commonly noted in patients with Temporal lobe epilepsy.

24
Figure 1-4. Rhythmic and sharply contoured, 7-8 Hertz theta activity at the onset of a
focal seizure localizing to the left temporal lobe.

25
CHAPTER 2 EPILEPSY AND NON-EPILEPTIC EVENTS
Introduction to Epilepsy
Epileptic seizures are transient signs and symptoms due to abnormal excessive or
synchronous neural brain activity.(9,10) Likewise, epilepsy is a brain disorder
characterized by recurrent and unprovoked seizures. Epilepsy is the second most
common disorder of the central nervous system, after stroke, and affects about 0.4–1%
of the population.(11) An estimated 40 million people worldwide have epilepsy. (10)
The term seizure, going back to its origin in Greek, means “to take hold.” An epileptic
seizure is due to abnormally excessive or synchronous neuronal activity in the brain.(9)
During the onset of an epileptic seizure (i.e., the ictal period), synchronous and
rhythmic discharges may originate from one part of the brain (focal or localization-
related seizures) or begin simultaneously in both sides of the hemispheres (generalized
seizures).(10) After the onset, focal seizures may remain localized within one part of
the brain or propagate to the other side of the hemisphere and cause a wider range of
synchronous neuronal activity (secondarily generalized seizures).
This research project focuses on differentiating a specific type of type of focal
seizure disorder, temporal lobe epilepsy (TLE), from a condition called psychogenic,
non-epileptic event (PNEE). TLE was chosen because it is the most common type of
focal epilepsy seen in epilepsy monitoring units.(12,13)
Distinguishing epileptic seizure from PNEE can be difficult, as clinically they can
appear quite similar.(14,15) However, making the correct diagnosis is important
because therapies for the two diagnoses differ greatly. Epileptic seizures are treated
with oral anti-epileptic medications, epilepsy surgeries, and special diets. Conversely,

26
PNEE are treated with psychotherapy, specifically, cognitive behavioral therapy.
Psychotropic medications may be helpful as well.(16)
In this chapter, classification of epileptic seizure disorders is discussed to help the
reader understand how a diagnosis of TLE is made. Next, clinical and EEG features of
TLE will be discussed. Finally, diagnostic challenges in distinguishing epilepsy,
including TLE, from PNEE are explained.
Classification of Epilepsy
Epileptic seizures are classified by type for the purposes of formulating appropriate
treatment plans and offering prognosis. The most widely used system is that proposed
by the International League Against Epilepsy (ILAE).(9,10) Originally drafted in 1989,
this classification system was updated in 2001 and 2010. In the most recent version, a
five dimension approached is used.
Dimension 1 is focused on localization of the seizure onset zone based on all
known clinical data, including information obtained during the history, clinical exam,
EEG, and neuro-imaging. Despite large advances in neuro-imaging over the last
several decades VEEG remains the gold standard for determination of seizure onset
zones.(8,14) While Dimension 1 describes the brain localization of seizure activity, it
does not provide information on what type of seizures are experienced. This
information is covered in Dimension 2. Most commonly, the ILAE International
Classification of Epileptic Seizures is used for this purpose. This system was initially
developed in 1964 and revised in 1981. The revised version categorizes seizures
based on an electroclinical approach, meaning a combination of signs and symptoms
during seizures and EEG findings. Dimension 3 of the ILAE classification system
describes the etiology of the epileptic seizures. Dimension 4, while not particularly
27
useful for localization, helps to describe the severity of the condition by documenting the
frequency of seizures. Finally, Dimension 5 lists related medical information that may
be helpful in identifying an epileptic syndrome or seizure onset zone. This information
may include focal neurologic deficits or seizure triggers.
Temporal Lobe Epilepsy
As described in dimension 1 of the ILAE classification system, localization of
seizure onset zone is determined by using all available data from a patient’s history,
neuro-imaging, and EEG. Seizures may be focal or generalized in onset, and
approximately 50% of epilepsies are focal in onset. The ILAE Commission (1989)
classifies focal epilepsies according to their anatomical origin. Focal epilepsies may
localize to the frontal, temporal, parietal, or occipital brain regions. Localization to the
temporal region is most common, as such, the temporal lobe is considered the most
epileptogenic region of the brain.(17) The true prevalence of temporal lobe epilepsy
(TLE) is unknown. However, in the setting of medically refractory epilepsy patients
undergoing video EEG monitoring, approximately 2/3 of focal epilepsies localize to the
temporal lobes.(12,13)
Many etiologies of TLE exist. These etiologies include: current or past central
infection system infections (herpes encephalitis, bacterial meningitis,
neurocysticercosis), trauma brain injury that leads encephalomalacia and/or cortical
scarring, cortical developmental abnormalities, hamartomas in neurocutaneous
disorders, brain tumors ( meningiomas, gliomas, gangliomas), vascular malformations
(arteriovenous malformation, cavernous angioma), and paraneoplastic syndromes (anti-
Hu , or NMDA-receptor antibodies).(17) Often, the cause is said to be either
cryptogenic, meaning the cause is presumed but has not been identified, or idiopathic,

28
which may imply a genetic predisposition. Febrile seizures during infancy and
childhood can lead to TLE later in life.
Seizure Semiology in TLE
TLE seizures are usually brief, lasting 2-3 minutes. These events may be
preceded by a warning or “aura.” Olfactory, auditory, gustatory, and visual
hallucinations may occur.(10,17,18) Patients may report distortions of sound or
changes in the shape, size, and distance of objects. Things may appear shrunken
(micropsia) or larger (macropsia) than usual.(17) Also, those with TLE may experience
an aura of vertigo.
Psychic phenomena, such as a feeling of déjà vu or jamais vu, or a sense of
familiarity or unfamiliarity, are common auras in TLE. Patients may experience
depersonalization (i.e., feeling of detachment from oneself) or derealization (i.e.,
surroundings appear unreal). They may also report a sense of dissociation or
autoscopy, in which they report seeing their own body from outside. Additionally,
unexplained fear or anxiety may precede temporal lobe seizures. Often the fear is
strong, and described as a feeling of impending doom.(17) TLE aura can also be in the
form of autonomic phenomena which may include changes in heart rate, piloerection,
and sweating. Patients may experience an epigastric "rising" sensation or nausea.(10)
Following the aura, a temporal lobe complex partial seizure commonly begins
with a motionless stare, dilated pupils, and behavioral arrest. Oral alimentary
automatisms such as lip smacking, chewing, and swallowing may be noted. Ipsilateral
manual automatisms or contralateral dystonic posturing of a limb also may be observed.
(17,18) Patients may continue their ongoing motor activity or react to their surroundings
in a semi-purposeful manner (i.e., reactive automatisms).
29
A complex partial seizure may evolve to a secondarily generalized tonic-clonic
seizure. Often, the documentation of a seizure notes only the generalized tonic-clonic
component of the seizure. A careful history from the patient or an observer is needed to
elicit the partial features of either a simple seizure or a complex partial seizure before
the secondarily generalized seizure is important.
Patients usually experience a post-ictal period of confusion, which may help
distinguish TLE from PNEE, as those with PNEE sometimes have an immediate return
to baseline responsiveness. (14,19) In TLE, post-ictal aphasia suggests onset in the
language-dominant temporal lobe. (10)
Electroencephalographic Characteristics of TLE
In temporal lobe epilepsies the interictal scalp EEG may show the following:
-no abnormality.
-unilateral of bilateral slowing of cerebral activity in the temporal EEG channels.
-unilateral or bilateral epileptiform spikes, sharp waves and/or slow waves (1,10)
During a seizure, ictal EEG activity may begin at the time of aura onset or not until a
complex partial seizure begins. Ictal activity includes:
-a sudden unilateral or bilateral interruption of background activity
-temporal or multilobar low-amplitude fast activity,
-temporal or multilobar moderate-amplitude rhythmic spikes, sharps, or slow waves.
Psychogenic Non-epileptic Events
PNEE are paroxysmal changes in behavior that resemble epileptic seizures, but
have no electrophysiological correlate or clinical evidence for epilepsy.(16) Also,
positive evidence for psychogenic factors that may contribute to these events are often
present. Point prevalence of PNEE has been estimated to be low in the range of one
person per 30,000–50,000. The incidence rate is equivalent to 4% of that of

30
epilepsy.(20) None the less, approximately 25-30% of patients undergoing in-patient
video EEG monitoring for medically refractory epilepsy have PNEE.(16) A major
complication to the issue is that between 5 and 40% of the patients with PNEE have a
concomitant diagnosis of epilepsy or have a past history with epileptic seizures.(16)
Clinical Manifestations of PNEE
PNEE are more often composed of purposeful, asynchronous, apparently
consciously integrated motor activity such as thrashing movements of the entire body,
opistotonic posturing of trunk, out-of-phase limb movements, side-to-side head
movements, forward pelvic thrusting.(19,21) PNEE patients were more likely to have
forceful sustained eye closing at any stage of the seizure and jaw clenching in the tonic
phase of convulsive seizures.(22,23) PNEE is often accompanied by moaning, crying
(ictal weeping), and stuttering throughout the events. (19,24) The most common ictal
characteristic of PNEE was unresponsiveness without predominant motor
manifestations.(19)
Patients with PNEE often describe fluctuating, but more or less continuous,
levels of conscious mental activity during their events without the discrete gaps of
missing memory that are characteristic of the impaired consciousness during complex
partial epileptic seizures.(19) More often than in epilepsy, PNEE occur in the presence
of others and have a more gradual onset (slow increase of symptoms) with abrupt
recovery.(14,19) Pre-ictal pseudosleep, in which the seizure arises while the patient
seems to be asleep despite electrographic evidence of wakefulness, has been reported
to be specific for PNEE.(19) Autonomic changes can occur with epileptic seizures and
PNEE (e.g., coughing, palpitations and pupillary dilatation). In the setting of PNEE,

31
these autonomic symptoms are likely part of the heightened arousal response attached
to panic or other extreme emotional states.
Etiologies of PNEE
PNEE are almost infinitely heterogeneous and are quite different from person to
person. Even if the PNEE behaviors of very different people are morphologically similar,
clinical experience reveals that the psychogenic causes may be quite divergent.(16,19)
Psychological factors describe the underlying causation of these seizure-like
behaviors. A common factor is a history of abuse during any time in life prior to PNEE
onset. Abuse may have been sexual (most common), physical, or verbal. (16,19)
While not all patients who have suffered from abuse will develop PNEE, the risk for
developing PNEE is clearly increased. Other common examples of such psychological
etiology may be personality disorders, post-traumatic stress disorder, malingering,
depression or chronic anxiety, dissociation, somatization disorder, behaviorally oriented
concepts of secondary gain and assumption of the sick role (mainly in intellectually
impaired persons), personality disorders, and organicity.
Shaping factors are also important in the development of PNEE.(16,19) These
factors contribute to “shaping” the symptoms in the form of seizures-like events, as
opposed to other movement disorders or other somatic symptoms. A well-known
shaping factor is living with a relative who has epileptic seizures.
Differentiating Epilepsy from PNEE
The gold standard diagnostic modality for distinguishing PNEE from epilepsy is
inpatient continuous VEEG monitoring.(7,14) However, there are many limitations to
this procedure. First, in order to make a diagnosis, patients must stay in the hospital
until all of their typical seizure-like events are recorded. A typical stay is 3 to 5 days.

32
VEEG monitoring is a resource that is not universally available, especially in rural areas,
and patients with PNEE are misdiagnosed with epilepsy for an average of 7 years.(19)
Furthermore, once undergoing VEEG, if one does not have their events before
discharge, then a definitive diagnosis cannot be made. Also, VEEG can be quite
expensive depending on the patient’s insurances provider’s willingness to pay for the
procedure. In some cases, hospital bills for thousands of dollars may be charged to the
patient. As a common seizure provocation technique, patients are taken off their
seizure medications either immediately or over several days; the speed of removal
depends on baseline seizure frequency. Those with epilepsy are at risk for prolonged
seizures, status epileptic, need for intubation, transfer to an intensive care unit, and
injury. All patients can suffer side effects from rapid withdraw of seizure medication.
For all the reasons listed above, a need exists for the development of alternative
diagnostic techniques whereby PNEE can be distinguished from epilepsy. This
technique should be one that can be performed safely and in the out-patient setting.

33
CHAPTER 3 MEASURING INTRAHEMISPHERIC EEG ASYMMETRY IN TLE AND PNEE
Asymmetry of EEG activity: In the setting of focal epilepsy, single photon
emission tomography, positron emission tomography, and magnetic resonance
spectroscopy studies have revealed that, interictal hypoperfusion, glucose
hypometabolism, decreased benzodiazepine binding, and metabolic disturbances
lateralized to the side of an epileptic focus or “onset zone.”(25) These findings are even
true when conventional computed tomography or magnetic resonance imaging studies
fail to identify a lesion. Studies utilizing spectral power analysis, a technique that
measures the amplitude of physiologic frequency bands, have shown greater entropy of
the spectral power in electrodes where interictal discharges appear.(26) This findings
provides electrophysiological evidence of brain activity asymmetries in focal epilepsy.
Furthermore, previous research has demonstrated that analyzing hemispheric
asymmetries in EEG characteristics may be useful for differentiating focal epilepsy from
other controls. For example, when comparing patients with focal epilepsy with normal
controls or controls with tension headache, those with focal epilepsy had greater left-
right asymmetry of total power and alpha power than the control groups.(27) Also,
greater asymmetries in sleep spindle intensity (amplitude) have been noted in those
with focal epilepsy than those with idiopathic generalized epilepsy.(25) Furthermore,
those with focal epilepsy demonstrated decreased synchrony of brain activity in the area
of seizure onset zone than non-seizure producing brain regions. These epileptic
subjects also have decreased overall brain synchrony when compared to subjects with
chronic facial pain. (28)
34
For the purpose of this study, we used a novel approach and compared the (left-
right) interhemispheric asymmetry (IHA) of two quantitatively derived EEG variables of
1) signal regularity and 2) amplitude variation in patients with TLE and PNEE. The first
variable was the pattern-matched regularity statistic (PMRS) and the second was the
amplitude variation (AV). Both are discussed below.
Pattern-match regularity statistic (PMRS): Motivated by calculations of
approximate entropy in thermodynamic systems, the PMRS is a probabilistic statistic
quantifying signal regularity, as shown in Equation 3-1.(29,30)
Pr{difference of the next points of xi and xj <r | xi and x j and value matched} (3-1)
This variable has previously been shown to be useful in a seizure prediction
model.(31) The rationale of applying this pattern match method (instead of amplitude or
“value” match) is that pattern match is more robust compared to scalp amplitude match,
which are usually more unstable than their up-and-down trends.(6) The procedure for
calculating PMRS is described below:
Given a time series with standard deviation , a tolerance
coefficient , and a fixed integer , the two segments in
( ) are considered pattern-matched to
each other when Equation 3-2 is fulfilled.
(3-2)
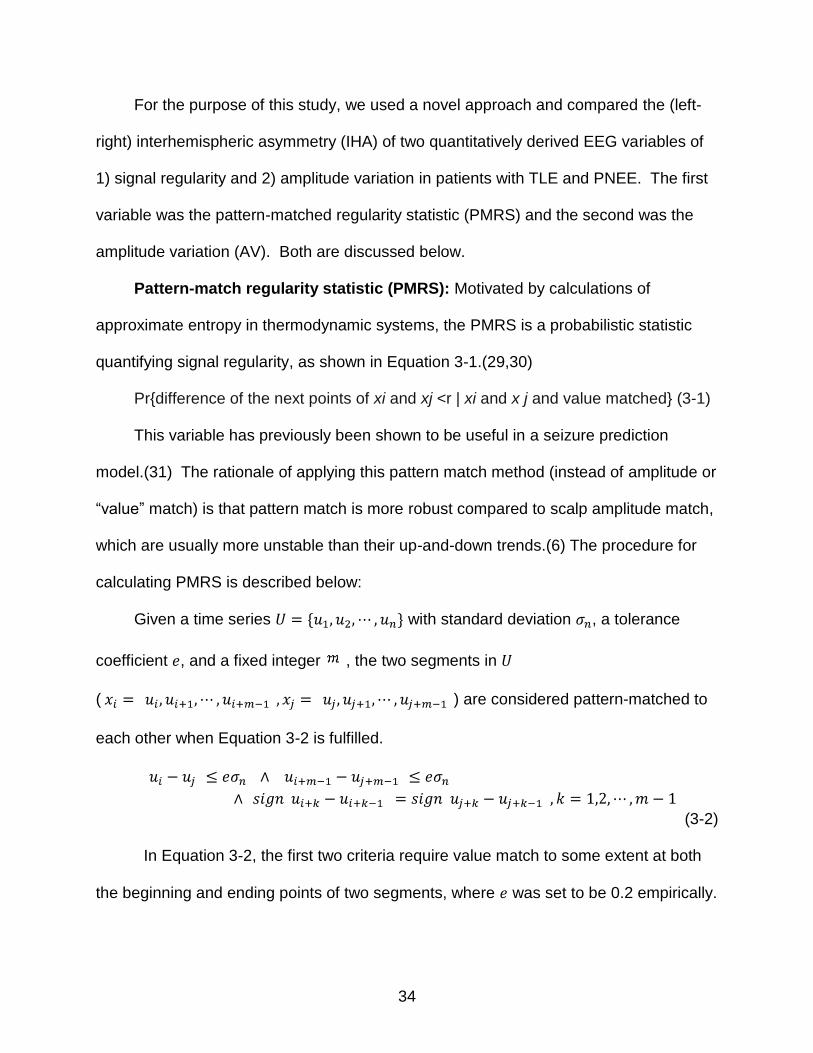
In Equation 3-2, the first two criteria require value match to some extent at both
the beginning and ending points of two segments, where was set to be 0.2 empirically.

35
The third criterion requires pattern match between xi and xj within a range of (set as 3
in this study). To calculate PMRS, we first define a conditional probability, .
(3-3)
Given , can be estimated as as in Equation 3-4.
(3-4)
In Equation 3-5, . Finally a PMRS can be estimated.
(3-5)
As the time series develops into a more regular state, s become larger and PMRS
decreases as a result.
Amplitude variation: Amplitude variation (AV) is simply the standard deviation of
the EEG amplitudes within a detection window. This variable has been used in seizure
prediction models. (29,31). However, as far as the investigators in this study are aware,
neither the PMRS nor AV have not yet been applied to interictal EEG samples for the
purpose of distinguishing those with epilepsy from controls.

36
CHAPTER 4 STUDY DESIGN AND OUTCOME
In this study, we tested our hypothesis that inter-hemispheric asymmetry (IHA) of
the interictal EEG is greater in those with temporal lobe epilepsy (TLE) than those with
PNEE. We compared IHA of signal regularity using the pattern-match regularity statistic
(PMRS) and the IHA of amplitude variation (AV). The PMRS calculates the probability
that two points will have the same change in slope at the same time, given that two
previous points were patterned matched. Further details on the PMRS can be read in
the paper by Shiau et al., Cybernetics and Systems Analysis 2010.(29)
Methods
All EEG data for the project were recorded in the adult Epilepsy Monitoring Unit at
the Medical University of South Carolina (MUSC) in Charleston, SC USA. Collection
and analysis of the EEG data were approved by the MUSC Institutional Review Board
(IRB), and participants signed informed consent prior to inclusion. EEG samples were
collected and analyzed at Optima Neuroscience in Alachua, FL, USA.
Subjects’ data were included in the study if a diagnosis of TLE or PNEE was
confirmed based on a single or multiple typical events having been recorded on VEEG.
All subjects were adults age 18 years or old. Exclusion criteria included VEEG
recordings where a diagnosis was not confirmed because the subject did not have
events during the recording. Also, subjects’ data were excluded if both epileptic and
PNEE were recorded from the same individual, or if epileptiform ictal activity localized to
other brain regions besides the temporal lobes.
EEG recordings were obtained using the XLTEK EEG monitoring systems
(Oakville, Ontario, Canada) with a 256 Hz sampling rate. A 19-electrode scalp

37
electrode configuration was used according the international 10–20 system (Fig. 1-2). A
referential montage was utilized and the referential channel was at a location between
Cz and Pz. In order to reduce the effects from muscle and movement artifacts, each of
the EEG signals were band-pass filtered with a low cut filter = 1 Hz and high cut filter =
20 Hz. Interictal EEG epochs (at least 10 seconds each) were sampled from recordings
obtained from 61 patients (29 with PNEE and 32 with TLE {Left temporal onset in 14,
right temporal onset in 10, and independent bilateral temporal onsets in 8}). A total of
610 epochs (10 epochs from each recording) in the relaxed, awake state were sampled
from TLE and PNEE patient groups. To reduce confounding effects, included interictal
EEG epochs were constrained to the following three conditions: 1) no epileptiform
discharges; 2) no eye-blinking; and 3) presence of a clear bi-posterior alpha rhythm.
Within each EEG sample epoch, we calculated the PMRS and AV in the F8, T4,
F7, and T3 EEG channels utilizing a non-overlapping 5.12 second computation window.
IHA values were calculated as the difference between right (F8 and T4) and left (F7 and
T3) channels, with respect to PMRS and AV values, respectively. Within each
recording, outlier PMRS and AV values were excluded using Grubb’s test. Both the
PMRS and AV variable were found to follow a non-normal distribution (Figure 4-3). The
Whitney-Mann-U test was used to test for significant differences (p<0.05) in the inter-
hemispheric differences between the two groups.
For a priori power analysis, we are planned a study with 30 TLE subjects and 30
PNEE subjects. The mean and standard deviation of the IHA of the PMRS and AV
were not known. The PMRS value (unilateral meansurement) was known to range from
approximately 0.01 to 0.06. The AV value (unilateral measurement) was known to

38
range from approximately 1 to 10. For the IHA of the PMRS, a power of 0.995 was
calculated based on a standard deviation 0.02, if the true difference in the TLE and
PNEE group means was 0.03. A type I error probability of 0.05 was used. A power of
0.861 was calculated for the IHA of the AV assuming a standard deviation of 2.0 and a
true differences in the group means of 2.5, with a Type I error rate of 0.05.
Results and Conclusion
Both groups included more females than males (TLE 20/29, PNEE 23/32), and
gender ratios were not significantly different (p=0.8035) (Figure 4-1). The mean age was
36.9 years in the TLE group and 43.3 years in the PNEE group, but the age differences
were not significant (p=0.6030) (Figure 4-2). Although length of EEG recording was
longer in the TLE group than the PNEE group (84.50 hours versus 70.56 hours), these
values were not significantly different.
A total of 71 outlier values were excluded (60 AV and 11 PMRS). No significant
difference was found in AV IHA values (2.9261 vs. 2.6379, p=0.5065) (Figure 4-5).
However, TLE samples had significantly higher PMRS asymmetry than PNEE (0.0399
vs. 0.0196, p=0.0182) (Figure 4-4).
We calculated the sensitivity of the PMRS for separating out TLE from PNEE
groups, based on empiric “true positive” PMRS values being greater than the mean
PMRS asymmetry value for the PNEE (control) group +2 standard deviations (0.0196 +
(2*0.01388)). Therefore, all PMRS values ≥ 0.04736 were considered positive. Based
on this calculation, 11/32 TLE patients had positive values and the sensitivity of this test
was only 34.3%.
We found that IHA of the PMRS from the temporal electrodes is significantly larger
in TLE subjects than in NES subjects. Our finding is likely due to interruptions in signal

39
regularity caused by the focal epileptic process in the temporal regions. Patients with
focal epilepsy have been shown to have greater asymmetry in spectral power analysis
and more delta activity lateralizing to the epileptic focus.(27,32). This intermixed delta
activity may be responsible for interruptions in signal regularity.
We did not find differences in the IHA of AV. Possible reasons include that AV
IHA may depend on duration of epilepsy, seizure type or severity, or etiology of TLE.
However, these variables were not collected for this study, so their role remains unclear.
A limitation of the study is that subjects were taking anti-epileptic medication.
Also, tapering seizure medication is a popular technique for provoking seizures while
patients are being monitored in an epilepsy monitoring unit. Therefore, the subjects
may have been in the process or tapering, holding, or restarting medications during the
recording of the EEG epochs which were selected for analysis. Furthermore, recording
of PNEE patients were compared only recordings of TLE patients. Whether or not AV
or PMRS are useful in distinguishing PNEE from other types of focal epilepsy or even
idiopathic generalized epilepsy remains unclear. Finally, we analyzed IHA only in the
relaxed, awake state. Different stages of wakefulness and sleep have well-described
natural fluctuations in frequency, amplitude, and rhythmicity would require separate
measurements and analysis for each stage. However, this is an area that may deserve
future investigation.
In conclusion, our findings suggest that characteristics of the interictal EEG may
be useful in distinguishing patients with TLE from those with PNEE. Future studies
should focus on more diverse groups of epilepsy patients, additional measures of IHA,
40
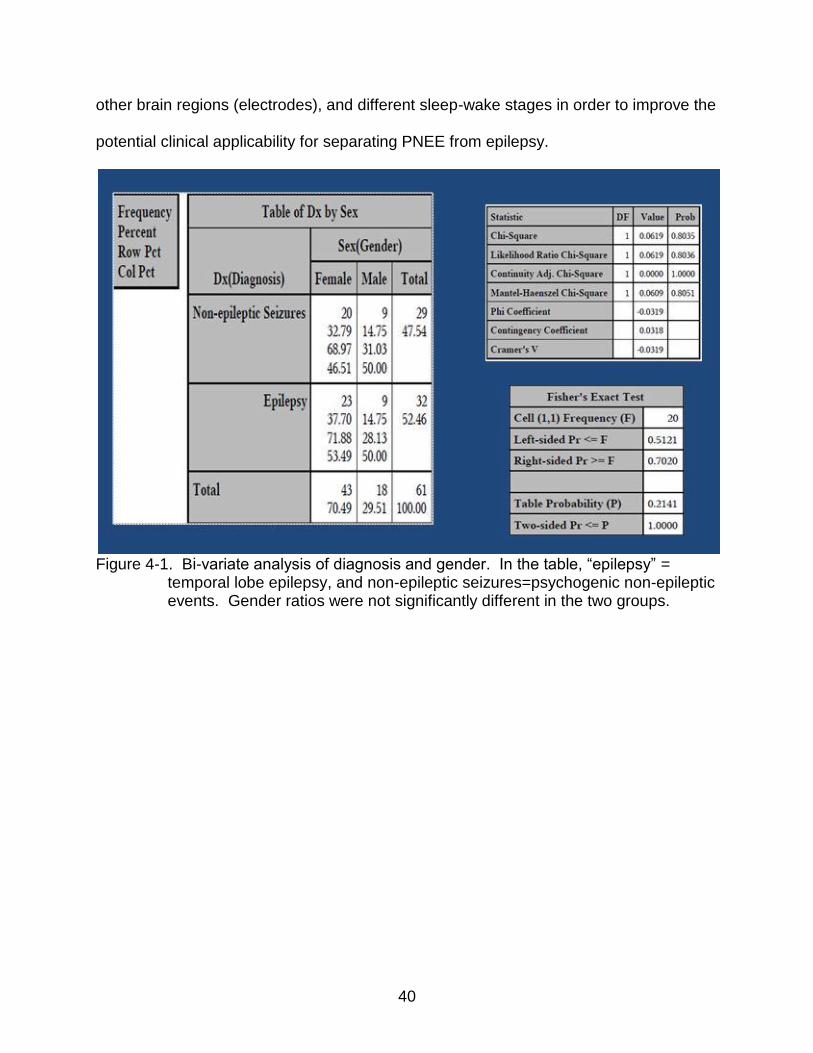
other brain regions (electrodes), and different sleep-wake stages in order to improve the
potential clinical applicability for separating PNEE from epilepsy.
Figure 4-1. Bi-variate analysis of diagnosis and gender. In the table, “epilepsy” =
temporal lobe epilepsy, and non-epileptic seizures=psychogenic non-epileptic events. Gender ratios were not significantly different in the two groups.

41
Figure 4-2. Bi-variate analysis for diagnosis and age (in years). In the tables above
“epilepsy” = temporal lobe epilepsy, and non-epileptic seizures=psychogenic non-epileptic events. Age was not significantly different in the two groups.
Figure 4-3. Distributions of the interhemispheric asymmetry. (Non-normal) distributions
of the interhemispheric asymmetry of the PMRS=pattern matched regularity statistic (left) and the AV=amplitude variation (right).

42
Figure 4-4. Bi-variate analysis of the interhemispheric differences in the PMRS=pattern
matched regularity statistic. The interhemispheric PMRS asymmetry was greater in the “epilepsy”=temporal lobe epilepsy group.

43
Figure 4-5. Bi-variate analysis of the interhemispheric differences in the AV=amplitude
variation. The interhemispheric AV asymmetry was not significantly different between groups.
44
LIST OF REFERENCES
1. Greenfield LJ, Geyer JD, Carney PR. Reading EEGs: A practical Approach. Philadelpha: Lippincott Williams & Wilkins; 2010
2. Collura TF. History and Evolution of Electroencephalographic Techniques. Journal of Clinical Neurophysiology 1993; 10: 476-504.
3. Gloor, P.Hans Berger and the discovery of the electroencephalogram. Electroencephalography and Clinical Neurophysiology 1969; S28: 1–36.
4. Chien J. EEG Analysis of brain dynamical behavior with applications in Epilepsy. 2011. Retrieved from: proquest.umi.com/pqdweb?index=0&did=2425198451& SrchMode=2&sid=1&Fmt=2&VInst=PROD&VType=PQD&RQT=309&VName=PQD&TS=1341245184&clientId=20179 Feb 1, 2012.
5. Schomer DL, Lopes da Silva FH. Neidermeyer’s Electroencephalography. 6th ed. Philadelphia: Lippincott, Williams, and Wilkins; 2011.
6. Friedman D, Claassen J, Hirsch LJ. Continuous Electroencephalogram Monitoring in the Intensive Care Unit. Anesthesia & Analgesia 2009; 109: 506-23.
7. Cascino GD. Video-EEG Monitoring in Adults. Epilepsia. 2002; 43(S3):80–93.
8. Rosenow F, Lüders H. Presurgical evaluation of epilepsy. Brain 2001; 124: 1683-1700.
9. Fisher RS, Boas WE, Blume W, Elger C, Genton P, Lee P, et al. Epileptic seizures and epilepsy: Definitions proposed by the international league against epilepsy (ILAE) and the international bureau for epilepsy (IBE). Epilepsia 2005; 46: 470-72.
10. Wyllie E, Cascino GD, Gidal BE, Goodkin HP. Wyllie’s Treatment of Epilepsy Principles and Practice. 5th ed. Philadelphia: Lippincott Williams & Wilkins; 2011.
11. Sander JW. The epidemiology of epilepsy revisited. Current Opinion in Neurology 2003; 16: 165-70.
12. Benbadis SR, O’Neill E, Tatum WO, Heriaud L. Outcome of Prolonged Video-EEG Monitoring at a Typical Referral Epilepsy Center. Epilepsia 2004: 45:1150–1153.
13. Diaz-Arrastia R, Agostini MA, Madden CJ, and Van Ness PC. Posttraumatic epilepsy: The endophenotypes of a human model of epileptogenesis. Epilepsia 2009; 50(S2): 14-20.
14. Devinsky O, Gazzola D, La France WC. Differentiating between nonepileptic and epileptic seizures. Nature Reviews Neurology 2011; 7: 210-20.

45
15. Burneo JG, Martin R, Powell T, et al. Teddy bears: an observational finding in patients with non-epileptic events. Neurology 2003; 61: 714–15.
16. Bodde NM, Brooks JL, Baker GA, Boon PA, Hendriksen JG, Mulder OG, Aldenkamp AP. Psychogenic non-epileptic seizures--definition, etiology, treatment and prognostic issues: a critical review. Seizure 2009; 18:543-53.
17. Ko DY, Sahai-Srivastava S. Temporal Lobe Epilepsy. Retrived from: emedicine.medscape.com/article/1184509-overview. Mar 12, 2012
18. Panayiotopoulos CP. The Epilepsies: Seizures, Syndromes and Management. Oxfordshire (UK): Bladon Medical Publishing; 2005.
19. Bodde NM, Brooks JL, Baker GA, Boon PA, Hendriksen JG, Aldenkamp AP. Psychogenic non-epileptic seizures--diagnostic issues: a critical review. Clinical Neurology and Neurosurgery 2009; 111:1-9.
20. Krumholz A, Hopp J. Psychogenic (nonepileptic) seizures. Seminars in Neurology
2006; 26: 341–50.
21. Geyer JD, Payne TA, Drury I. The value of pelvic thrusting in the diagnosis of seizures and pseudoseizures. Neurology 2000; 54: 227–29.
22. Chung SS, Gerber P, Kirlin KA. Ictal eye closure is a reliable indicator for psychogenic nonepileptic seizures. Neurology 2006; 66:1730-31.
23. Syed TU, Arozullah AM, Suciu GP, et al. Do observer and self-reports of ictal eye closure predict psychogenic nonepileptic seizures? Epilepsia 2008; 49: 898-904.
24. Vossler DG, Haltiner AM, Schepp SK, et al. Ictal stuttering: a sign suggestive of psychogenic nonepileptic seizures. Neurology 2004; 63: 516–19.
25. Clemens B. Ménes A. Sleep spindle asymmetry in epileptic patients. Clinical Neurophysiology 2000; 111: 2155-59.
26. Inouye T, Shinosaki K, Sakamoto H, Toi S, Ukai S, Iyama A, Katsuda Y, Hirano M. Abnormality of background EEG determined by the entropy of power spectra in epileptic patients Electroencephalography and Clinical Neurophysiology 1992; 82: 203-07.
27. Drake ME, Padamandan H, Newell SA. lnterictal quantitative EEG in epilepsy. Seizure 1998; 7: 39-42.
28. Warren CP, Hu S, Stead M, Brinkmann BH, Bower MR, Worrell GA. Synchrony in normal and focal epileptic brain: the seizure onset zone is functionally disconnected. Journal of Neurophysiology 2010; 104: 3530–39.

46
29. Shiau DS, et al. Signal Regularity-based Automated Seizure Detection System for
Scalp EEG Monitoring. Cybernetics and Systems Analysis 2010; 46: 922-35.
30. Halford JJ, et al. Interictal EEG Dynamics in Patients with Non-epileptic Seizures versus those with Temporal Lobe Epilepsy. Abstract. American Epilepsy Society Annual Meeting; San Antonio, TX: 2010.
31. Kuhlmann L, Burkitt AN, Cook MJ, Fuller K, Grayden DB, Seiderer L, Mareels IM. Seizure detection using seizure probability estimation: comparison of features used to detect seizures. Annals of Biomedical Engineering 2009; 37: 2129-45.
32. Nuwer MR. Frequency analysis and topographic mapping of EEG and evoked potentials in epilepsy. Current Opinion in Neurology 2003; 16:165–70.

47
BIOGRAPHICAL SKETCH
Holly Skinner was born in Orlando, FL, USA. In 1983 she moved with her family
to Tallahassee, FL where she lived until 2001. While in Tallahassee, she graduated
from Lincoln High School in 1997, and earned her Bachelor of Science degree in
Exercise Physiology from Florida State University in 2001. She then moved to Fort
Lauderdale, FL for medical school at Nova Southeastern College of Osteopathic
Medicine.
Upon completion of medical school in 2005, she moved to Charleston, SC for a
one-year medicine Internship, then a four-year residency in adult neurology. After
residency, she moved to Gainesville, FL in 2009. While in Gainesville, she completed a
one-year fellowship in clinical neurophysiology at the University of Florida (UF). Then,
she worked for the UF Department of Neurology as a clinical lecturer (neurologist) and
participated in the UF Advanced Post-graduate Program for Clinical Investigation.
Through the program, she was afforded the opportunity to complete a master’s degree
with a concentration in clinical and translational science, for which this thesis is written.
Under the supervision of her primary mentor, J. Chris Sackellares, she was
introduced to Optima Neuroscience Inc., a neurodiagnostic research company.
Through mentorship and collaboration with the researchers at Optima, she was able to
complete this project. She intends to pursue her research interests in distinguishing
PNEE from epilepsy by way of analysis of brief EEG epochs.