Embed Size (px)
Citation preview

Asylum Trends 2013Levels and Trends in Industrialized Countries

Trends at a Glance
An estimated 612,700 asylum applications were registered in 2013 in the 44 industrialized countries covered by this report, some 133,000 claims more than the year before (+28%). This is the third consecutive annual increase and the second highest annual level of the past 20 years.
Europe received 484,600 claims, an increase of 32 per cent compared to 2012 (368,400 claims).
Among regions in Europe, an overall increase of 22 per cent in annual asylum levels was reported by the five Nordic countries which received 76,400 asylum requests during 2013. The increase was uniform among all countries in this region. Reporting the second highest level on record with 54,300 asylum applications, Sweden was the main destination country accounting for 70 per cent of all new claims registered in this region.
The 28 Member States of the European Union (EU) registered 398,200 asylum claims in 2013, a 32 per cent increase compared to 2012 (301,000). EU States together accounted for 82 per cent of all new asylum claims submitted in Europe.
In Southern Europe, the number of newly registered asylum-seekers increased by 49 per cent to 89,600, the highest on record. Turkey was the main recipient of asylum applications in the region (44,800), followed by Italy (27,800) and Greece (8,200).
2013 in review
28%
484,600
22%
49%
+32%
32%
2 UNHCR Asylum Trends 2013

With 109,600 new asylum applications registered during 2013, Germany was for the first time since 1999 the largest single recipient of new asylum claims among the group of industrialized countries.
The Syrian Arab Republic became for the first time the main country of origin of asylum-seekers in the 44 industrialized countries. Provisional data indicate that some 56,400 Syrians requested refugee status in 2013, more than double the number of 2012 (25,200 claims) and six times more than in 2011 (8,500 claims). The 2013 level is the highest number recorded by a single group among the industrialized countries since 1999.
The Syrian Arab Republic, the Russian Federation, Afghanistan, Iraq, and Serbia (and Kosovo: Security Council resolution 1244 (1999)) (1) were the five top source countries of asylum-seekers in the 44 industrialized countries in 2013.
The United States of America was second with an estimated 88,400 asylum applications, followed by France (60,100), Sweden (54,300), and Turkey (44,800). The top five receiving countries together accounted for nearly six out of ten new asylum claims submitted in the 44 industrialized countries.
In North America, an estimated 98,700 new asylum applications were submitted in 2013, an increase of 8 per cent compared to 2012 (91,300 claims). Canada registered 10,400 new applications, half the level than in 2012 (20,500), while the United States of America recorded approximately 88,400 claims, 17,600 claims more than in 2012 (+25%).
Japan registered close to 3,300 new asylum applications in 2013 while the Republic of Korea recorded 1,600 claims. Although it is the highest level on record in both countries, numbers continue to be modest in comparison with other industrialized countries.
The reported number of new asylum-seekers in Australia increased by 54 per cent during 2013 (24,300 claims) compared to the previous year (15,800). In New Zealand, 290 asylum applications were registered in 2013.
15,800
24,300
Top5
1. SYRIAN ARAB REPUBLIC2. RUSSIAN FEDERATION3. AFGHANISTAN4. IRAQ5. SERBIA (AND KOSOVO: S/RES/1244 (1999))
5 8 %
1. GER2. USA 3. FRA
others
4. SWE5. TUR
42 % 56,400
8% 3,300
109,600
3UNHCR Asylum Trends 2013
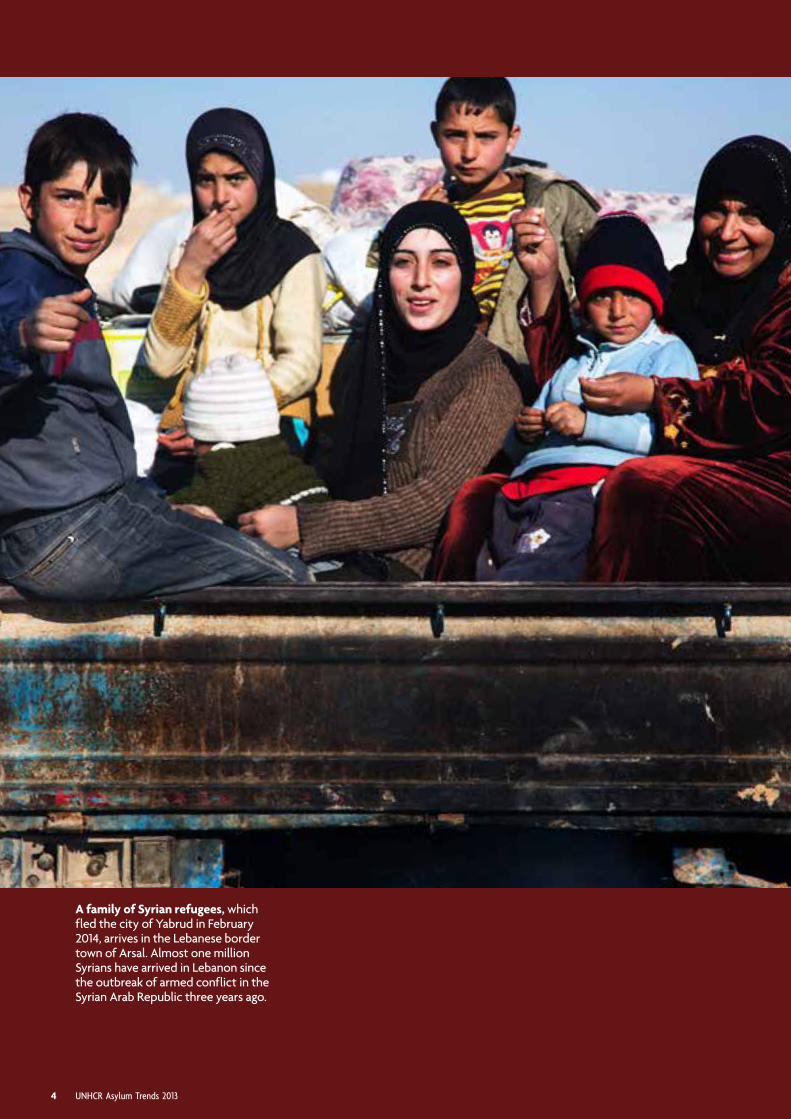
A family of Syrian refugees, which fled the city of Yabrud in February 2014, arrives in the Lebanese border town of Arsal. Almost one million Syrians have arrived in Lebanon since the outbreak of armed conflict in the Syrian Arab Republic three years ago.
4 UNHCR Asylum Trends 2013

UN
HC
R /
A.
MC
CO
NN
EL
L
I
The United States Department of Justice, Executive Office for Immigration Review (EOIR) has temporarily suspended the dissemination of asylum statistics. As a consequence, the information available is limited to the number of asylum applications lodged between January and August 2013 (17,892). Data from September to December have been estimated by UNHCR using a statistical model (seasonal ARIMA). Because no information is available on the country of origin of asylum-seekers during this period, its analysis should be considered as indicative only. •
Introduction
This report summarizes patterns and trends in the number of individual asylum claims (2) submitted in Europe and selected non-European countries during 2013. The data presented are based on information available as of 12 March 2014, unless otherwise indicated. The report covers the 38 European and six non-European States that currently provide monthly asylum statistics to UNHCR. Figures are mostly based on official asylum statistics, reflecting national laws and procedures. In addition, UNHCR conducted refugee status determination under its mandate in a number of countries included in this report. (3) Annex Table 2 provides trends in selected Eastern European countries, based on annual data.
THE GROUP of countries analysed is referred to col-lectively as “the 44 industrial-ized countries” and is defined as such for the purposes of
this report only. The 44 countries are: the 28 Member States of the European Union (4), Albania, Bosnia and Herzegovina, Iceland, Liech-tenstein, Montenegro, Norway, Serbia (and Kosovo: S/RES/1244 (1999)), Switzerland, the former Yu-goslav Republic of Macedonia, and Turkey, as well as Australia, Canada, Japan, New Zealand, the Republic of Korea, and the United States of America. This group of 44 countries received an estimated 612,700 new asylum applications in 2013.
The numbers in this report re-flect asylum claims made at the first instance of asylum procedures. Neither applications on appeal or review nor information on the out-come of asylum procedures or on the admission of refugees through reset-tlement programmes are included, as such details are available in other UNHCR reports. (5)
To the extent possible, the statis-tics presented reflect the number of individuals lodging an asylum ap-plication for the first time. However, some of the figures quoted in this report are likely to include repeat ap-plications submitted in the same or another country, and therefore may
not reflect the actual number of new asylum-seekers. (6)
All data refer to the number of in-dividuals with the exception of asy-lum-seekers in the United States of America, where figures are available only for the number of cases (which may include several individuals) sub-mitted to the United States Depart-ment of Homeland Security (DHS). However, applications submitted to the Executive Office of Immigration Review (EOIR) of the United States Department of Justice are recorded as individuals. To allow compara-bility across countries of asylum, UNHCR uses an average figure of 1.356 individuals per case to estimate the number of people reported by DHS for 2013, because data suggest that, on average, one asylum case involves 1.356 individuals. (7) In the country of origin tables, figures for the United States of America are a combination of the number of cases (DHS) and the number of individu-als (EOIR), owing to the large varia-tion in family size by nationality.
All figures in this report should be considered as provisional and subject to change. Due to retroactive changes and adjustments, some of the data included in this publication may differ slightly from that reported in previous UNHCR documents or from the official figures published by States. n
(2) An asylum-seeker is an individual who has sought international protection and whose claim for refugee status has not yet been determined. As part of internationally recognized obligations to protect refugees on their territories, countries are responsible for determining whether an asylum-seeker is a refugee or not. This responsibility is derived from the 1951 Convention relating to the Status of Refugees and relevant regional instruments, and is often incorporated into national legislation.(3) During the period 2009-2013, UNHCR conducted refugee status determination under its mandate in Cyprus (northern part of Cyprus only), Serbia (and Kosovo: S/RES/1244 (1999)), and Turkey (see notes in Annex Table 1 for more details).(4) See Annex Table 1 for a list of countries.(5) See UNHCR’s 2012 Statistical Yearbook at http://www.unhcr.org/52a7213b9.html.(6) According to EURODAC (an EU-wide fingerprint database), 27.5 per cent of all asylum claims registered in the system in 2012 were multiple claims, i.e. the applicant had submitted at least one previous application in the same or another Member State of the European Union. This compares to 22.4 per cent in 2011. (Source: http://eur-lex.europa.eu/LexUriServ/LexUriServ.do?uri=COM:2013:0485:FIN:EN:PDF)(7) This factor was revised recently to account for newly available information provided by DHS. For the purpose of this report, a factor of 1.1 has been applied for DHS data from 2009 to 2012. Previously, a factor of 1.4 was applied. As a result, the DHS figures quoted in this report differ from the ones quoted in previous editions of the Asylum Trends report.
5UNHCR Asylum Trends 2013
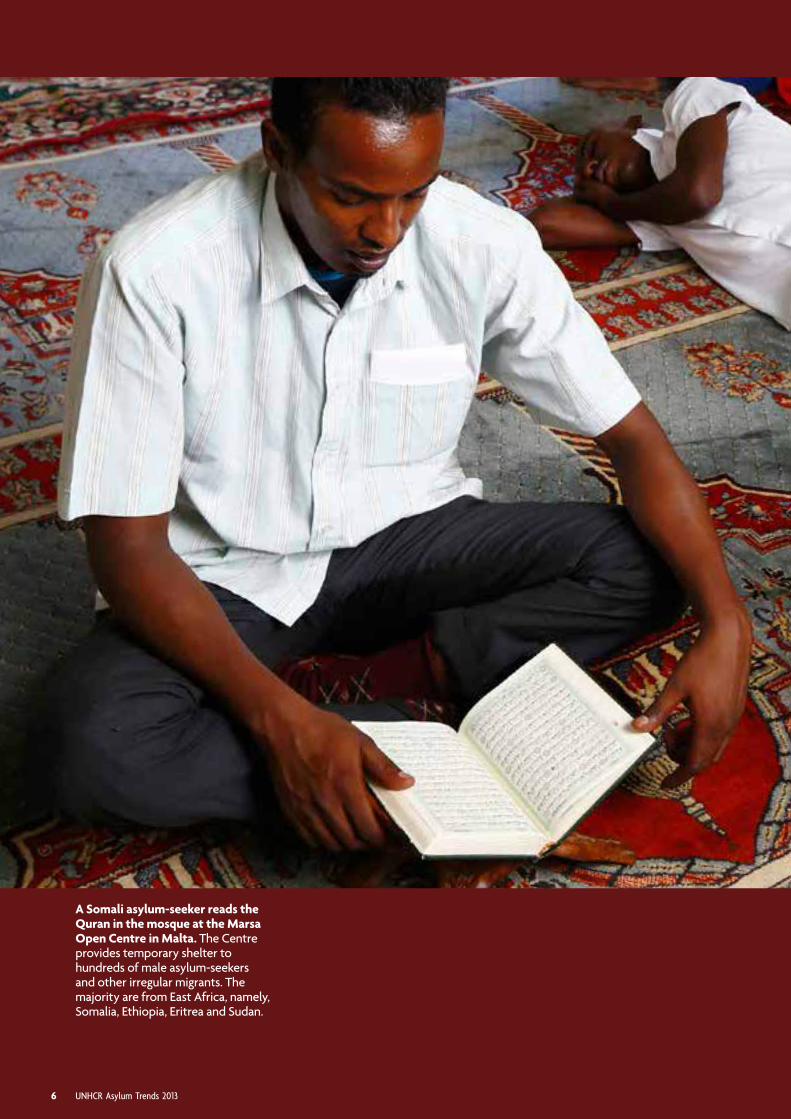
A Somali asylum-seeker reads the Quran in the mosque at the Marsa Open Centre in Malta. The Centre provides temporary shelter to hundreds of male asylum-seekers and other irregular migrants. The majority are from East Africa, namely, Somalia, Ethiopia, Eritrea and Sudan.
6 UNHCR Asylum Trends 2013
Global and Regional Trends (8)
UN
HC
R /
D.
ZA
MM
IT L
UP
I
II
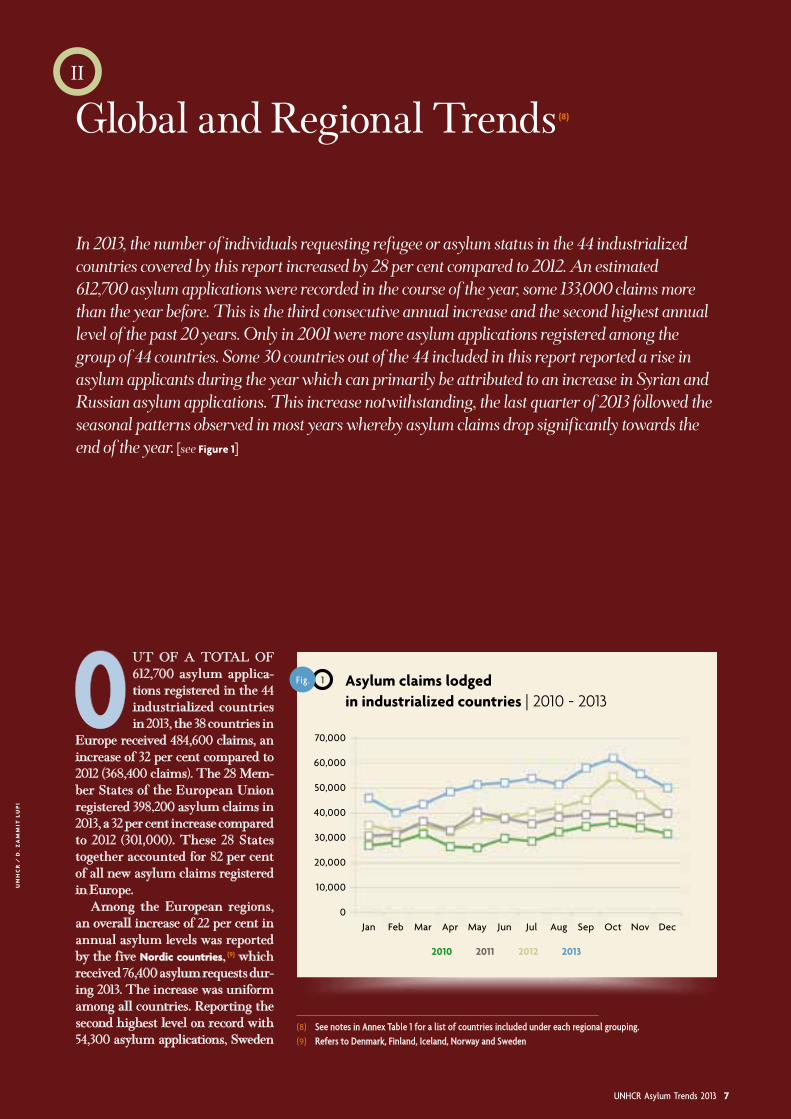
In 2013, the number of individuals requesting refugee or asylum status in the 44 industrialized countries covered by this report increased by 28 per cent compared to 2012. An estimated 612,700 asylum applications were recorded in the course of the year, some 133,000 claims more than the year before. This is the third consecutive annual increase and the second highest annual level of the past 20 years. Only in 2001 were more asylum applications registered among the group of 44 countries. Some 30 countries out of the 44 included in this report reported a rise in asylum applicants during the year which can primarily be attributed to an increase in Syrian and Russian asylum applications. This increase notwithstanding, the last quarter of 2013 followed the seasonal patterns observed in most years whereby asylum claims drop significantly towards the end of the year. [see Figure 1]
OUT OF A TOTAL OF 612,700 asylum applica-tions registered in the 44 industrialized countries in 2013, the 38 countries in
Europe received 484,600 claims, an increase of 32 per cent compared to 2012 (368,400 claims). The 28 Mem-ber States of the European Union registered 398,200 asylum claims in 2013, a 32 per cent increase compared to 2012 (301,000). These 28 States together accounted for 82 per cent of all new asylum claims registered in Europe.
Among the European regions, an overall increase of 22 per cent in annual asylum levels was reported by the five Nordic countries, (9) which received 76,400 asylum requests dur-ing 2013. The increase was uniform among all countries. Reporting the second highest level on record with 54,300 asylum applications, Sweden
Jun Jul Aug Sep Oct Nov Dec
20112010
70,000
60,000
50,000
40,000
30,000
20,000
10,000
0
Fig. 1 Asylum claims lodged in industrialized countries | 2010 - 2013
Jan Feb Mar Apr May
20132012
7UNHCR Asylum Trends 2013

(10) Refers to Albania, Cyprus, Greece, Italy, Malta, Portugal, Spain and Turkey.(11) The 2013 figure for Turkey includes asylum-seekers registered with UNHCR as well as asylum-seekers who have been pre-registered but who are pending official registration with UNHCR.(12) These figures, provided by the Department of Immigration and Border Protection in Australia, are based on the number of applications lodged for protection visas. They do not include asylum-seekers who arrived in Australia by boat in 2012 or 2013 and have not been able to lodge protection visa applications or who have been transferred to third countries for refugee status determination.(13) Monthly asylum data for Japan is available from 2002. Figures for Japan are UNHCR estimates.(14) Estimated number of individuals based on the number of new cases (45,370) and multiplied by 1.356 to reflect the average number of individuals per case (Source: US Department of Homeland Security); and the number of new defensive asylum requests lodged with the Executive Office of Immigration Review (26,830 individuals). The EOIR figure has been estimated by UNHCR based on a statistical model.
was the main destination country ac-counting for 70 per cent of all new claims registered in this region. Nor-way (11,500 claims) and Denmark (7,500 claims) were other important receiving countries.
In Southern Europe (10), the number of newly registered asylum-seekers increased by 49 per cent to 89,600, the highest on record. Turkey was the main recipient of asylum applications in the region (44,800), (11) followed by Italy (27,800) and Greece (8,200). The increase in Italy is mainly due to boat arrivals.
In Australia, a total of 24,300 claims were registered, up 54 per cent from 2012 (15,800 claims). (12) One third of asylum-seekers in Australia originate from the Islamic Republic of Iran or Sri Lanka. In New Zealand, levels have re-mained low and fairly stable in the past decade (on average 300 new claims per year). In 2013, 290 asylum applications were registered in New Zealand.
Japan registered close to 3,300 (13) new asylum applications in 2013, a 27 per cent increase compared to 2012
(2,500 claims). The Republic of Korea registered 1,600 claims in 2013 which constituted a 38 per cent increase com-pared to 2012 (1,100 claims). These are the highest levels on record in both countries. People seeking international protection in Japan were predomi-nantly from Turkey and Nepal while the Syrian Arab Republic, Pakistan and Nigeria were the main countries of ori-gin of asylum-seekers in the Republic of Korea.
In North America, an estimated 98,700 new asylum applications were
submitted in 2013, an increase of 8 per cent compared to 2012 (91,300 claims). The figures show a highly divergent trend for Canada and the United States of America. The former registered 10,400 new applications, half the level than in 2012 (20,500), while the latter recorded approxi-mately 88,400 (14) claims, an estimated 17,600 claims more than in 2012 (+25%). China remained the main country of origin of asylum-seekers registered in both countries. n
In Southern Europe, the number of newly registered asylum-seekers
increased by 49 per cent to 89,600, the highest on record. Turkey was the main recipient
of asylum applications in the region.
TABLE 1 Asylum claims lodged in selected regions | 2011 - 2013
Regions 2011 2012 2013Change ‘13-’12
Europe 327,640 368,400 484,560 32%
- EU (28) 278,610 301,000 398,250 32%
USA/Canada 88,460 91,270 98,740 8%
Australia/New Zealand 11,820 16,110 24,610 53%
Japan/Rep. of Korea 2,880 3,690 4,820 31%
Total 430,800 479,470 612,730 28%
See notes in Annex Table 1 for list of countries included.
8 UNHCR Asylum Trends 2013

WITH A COMBINED NUMBER of 357,100 registered asylum claims in 2013, Ger-many, the United States
of America, France, Sweden and Turkey were the top five receiving countries, together accounting for nearly six out of ten asylum claims submitted in the 44 industrialized countries cov-
ered by this report. By comparison, in 2012, some 260,700 claims were registered in these five countries.
With 109,600 new asylum applica-tions registered during 2013, Germany was for the first time since 1999 the largest single recipient of new asy-lum claims among the group of in-dustrialized countries. This figure is 70 per cent higher than the one reg-
istered a year earlier (64,500) and the sixth consecutive annual increase. The 2013 level is partly attributable to a higher number of people from the Russian Federation, Serbia (and Kosovo: S/RES/1244 (1999)) and the Syrian Arab Republic requesting in-ternational protection in Germany. In the case of the Russian Federa-tion, figures more than quadrupled from 3,200 new asylum claims in 2012 to 14,900 a year later. Syrian asylum claims almost doubled to 11,900 while applications lodged by people from Serbia (and Kosovo: S/RES/1244 (1999)) stood at 14,900, up from 10,400 a year earlier. Eri-trean asylum claims increased from 650 to 3,600 during the same period. Overall, the Russian Federation was the top country of origin of asylum-seekers in Germany, followed by Ser-bia (and Kosovo: S/RES/1244 (1999)) and the Syrian Arab Republic. On average, every fifth application in the 44 industrialized countries was re-ceived by Germany. [see Figure 3]
For the first time in eight years, the United States of America was not the largest single recipient of
III
From 2012 to 2013, 30 of the 44 asylum countries included in this report registered an increase in asylum requests. This compares to 2012 when 29 countries reported increases. This is the highest number of countries with an increase in asylum applications in the last five years and is consistent with the increase observed in the overall number of asylum claims lodged in industrialized countries. This suggests that not only has the total number of asylum-seekers increased, but also that there has been an increased diversity in the countries where people seek international protection. [see Figure 2]
Levels and Patterns in Countries of Asylum
2013
2012
2011
2010
2009
Fig. 2 Number of countries reporting an increase from one year to another | 2009 - 2013
30
29
28
22
20
9UNHCR Asylum Trends 2013

An Iraqi family in a transit centre in Pastrogor, Bulgaria, where most asylum-seekers entering the country spend time while the Bulgarian authorities conduct an initial assessment of their application for asylum.
10 UNHCR Asylum Trends 2013

asylum-seekers among the group of 44 industrialized countries. It dropped to second position with an estimated 88,400 asylum claims registered in 2013, despite a 25 per cent increase (+17,600 claims) from the year before. Asylum-seekers from the Syrian Arab Republic (+120%), Honduras (+25%), and Egypt (+25%) accounted, among others, for this increase. About 30 per cent of all asylum claims in the country were lodged by asylum-seekers from Mexico and Central America. Violence gener-ated by transnational organized crime, gang-related violence and drug cartels in some parts of Central America may be among the contributing factors lead-ing to the consistent high number of individuals from this region request-ing refugee status in the United States of America. China remained the main country of origin of asylum-seekers with 12,300 claims, followed by Mexico (9,300 claims). The annual share of the United States of America in the num-ber of asylum claims received among the group of industrialized countries stood at 14 per cent in 2013.
France was the third largest recipi-ent of applications among the 44 coun-tries, with 60,100 new asylum re-quests registered during 2013. This is a 9 per cent increase compared to 2012 (55,100 claims) and the high-est value since 1989 (61,400 claims). The increase in 2013 is partly attrib-
uted to a higher number of asylum-seekers from Serbia (and Kosovo: S/RES/1244 (1999)) (+48%), Albania (+47%), and Bangladesh (+64%). Over-all, Serbia (and Kosovo: S/RES/1244 (1999)) was the top country of origin of asylum-seekers in France, with more than 5,800 applications, fol-
lowed by the Democratic Republic of the Congo (5,200 claims), Albania (5,000 claims), and the Russian Fed-eration (4,600 claims).
Sweden ranked fourth among the 44 industrialized countries, with 54,300 applications received during the year, a 24 per cent increase compared to 2012 (43,900 claims). The year 2013 was the second highest level on record, secondly only to 1992 when more than 84,000 people, many of them flee-ing the former Yugoslavia, requested
asylum in Sweden. The increase is a result of the more than doubling in ap-plications of asylum-seekers from the Syrian Arab Republic, from 7,800 in 2012 to 16,300 in 2013. Since outbreak of violence in the Syrian Arab Repub-lic in early 2011, close to 24,700 Syr-ians have sought international protec-tion in Sweden, making it the main recipient of Syrian asylum-seekers in Europe.
The number of asylum applicants reported as being stateless by the Swed-ish Migration Board tripled from 2,300 to 6,900 applications during the same period. Eritrean asylum claims doubled to 4,800 compared to 2,400 a year ear-lier. These three origins were the top three source countries of new asylum applications in Sweden, accounting to-gether for more than half (52%) of all claims registered. In contrast, the num-ber of Somali and Afghan asylum-seek-ers in the country dropped significantly (-31% and -37% respectively).
Turkey was the fifth largest recipient of applications among the 44 industri-alized countries, with 44,800 new asy-lum requests registered during 2013. (15) This is a 69 per cent increase compared
to 2012 (26,500 claims) (16) and the high-est value on record. It is mainly Iraqi asylum-seekers who accounted for this increase. Their number almost quadru-pled from 6,900 in 2012 to 25,300 a year later. As a consequence, more than half (56%) of all asylum claims registered by UNHCR in Turkey were lodged by Iraqis. Other important source countries of asylum applicants were Afghanistan (8,700 claims), the Islamic Republic of Iran (5,900 claims) and So-malia (1,300 claims).
(15) The 2013 figure includes asylum-seekers registered with UNHCR as well as asylum-seekers who have been pre-registered but who are pending official registration with UNHCR.(16) The 2012 figure for Turkey has been revised to include all asylum-seekers, both those pre-registered and those registered on a monthly basis with UNHCR.
The number of asylum applicants reported as being stateless by the Swedish
Migration Board tripled from 2,300 to 6,900 applications during the same period.
UN
HC
R /
G.
KO
TS
CH
Y
2012
120,000
100,000
80,000
60,000
40,000
20,000
0
Fig. 3 Asylum claims submitted in 10 major receiving countries | 2013
German
y
2013
USA
France
Sweden
Turke
y
United Kingd
omIta
ly
Australi
a
Switz
lerand
Hungary
11UNHCR Asylum Trends 2013

Trends in asylum claims lodged in 44 industrialized countriesAbsolute and relative increase or decrease in 2013 compared to 2012
Increase and decrease of asylum claims
Increase over 100%
Increase 50% to 100%
Decrease 50% to 100%
Increase 1% to 50%
Decrease 1% to 50%
Map
Note: This map is limited to the 44 countries which provide monthly asylum statistics to UNHCR.All figures are rounded off to the closest ten.Figures for the United States of America are UNHCR estimates. 2013 data for Iceland is limited to January-October.Colour shadings show relative increase /decrease whereas values show absolute increase/decrease.
-10,120
+17,590
+40
-1,010
-6,510
+10,480
+140-380
+90
-10
+4,820
-250
0
+20
-270
+16,420
-100
+50
+2,200
+210+710
-1,350
+5,750
-1,010
+18,340
+2,360
-20
20
- 6,020
+4,740
+1,350
+1,680
+10,380+100
+45,040
+5,030
+1,920+210
0+1,210
+710+430
+8,540
-30
1
The United Kingdom ranked sixth among the 44 industrialized countries, with 29,200 applications received dur-ing the year. The United Kingdom experienced a slight increase in 2013; levels were up by 4 per cent compared to 2012 (28,000 claims). This is mainly
as a result of the increase in numbers of Syrian, Albanian and Eritrean asylum-seekers. In the case of Syrians, figures went up from 1,300 applications to more than 2,000 a year later (+58%). Eritrean asylum claims almost doubled from 760 to 1,400 while Albanian claims rose from 1,000 to 1,600 during the same period. Pakistan remained the leading country of origin of asylum-seekers in the United Kingdom with 4,500 ap-plications registered, followed by the Islamic Republic of Iran (2,900) and Sri Lanka (2,200).
With the number of boat arrivals remaining relatively high during the year, the number of new asylum ap-plications (27,800) registered in Italy in 2013 was at its third highest in a decade. The number increased by almost two-thirds (+60%) compared to 2012, making Italy the seventh largest receiving coun-try during the reporting period. Nev-ertheless, figures remained well below the all-time high reported in 2011 when
12 UNHCR Asylum Trends 2013

more than 34,000 people had requested refugee status in Italy, mostly as a result of the ‘Arab Spring’ in North Africa. It is mainly Nigerian, Somali and Eritrean asylum-seekers who accounted for this rise due to a doubling (Nigeria), tripling (Eritrea) or almost quadrupling (Soma-lia) of asylum claims. Nigeria was the leading country of origin of asylum-seekers in Italy (3,500 claims), followed by Pakistan (3,300 claims), Somalia (2,900), and Eritrea (2,200).
Australia was the eighth largest recipient of new asylum-seekers in 2013, with 24,300 claims, an increase of 54 per cent compared to 2012, and the highest level on record. (17) Aus-tralia was followed by Switzerland (19,400 claims), Hungary (18,600 claims), and Austria (17,500 claims). While Swit-zerland witnessed a decrease of 25 per cent during the year, Hungary saw a nine-fold increase. Asylum-seekers originating from Serbia (and Kosovo: S/RES/1244 (1999)) accounted for one third of all asylum claims in Hungary (6,200 claims), while asylum levels in Austria remained virtually unchanged.
RANKING OF COUNTRIES
The numbers of people requesting in-ternational protection have fluctuated significantly between countries and years, largely depending on political developments in countries of origin or changes in asylum policies and prac-tices in receiving countries. Other fac-
seekers remained at around 20 claims per year until 2010. This number in-creased sharply to almost 3,600 claims in 2013, lifting Montenegro from 42nd position in 2006 to 22nd in 2013.
An opposite trend has been observed for Canada where the country was the second and third highest destination country for asylum-seekers among the group of 44 industrialized countries in 2008 and 2009. The number of newly registered asylum-seekers dropped by two-thirds in subsequent years, poten-tially the result of recent reforms of asylum policies and the introduction of visa requirements for some nationali-ties featuring among the major groups of asylum-seekers in Canada, notably the Czech Republic and Mexico. As a result, Canada’s ranking dropped to 16th place in 2013.
TRENDS OVER THE PAST FIVE YEARS
Between 2009 and 2013, the United States of America received the larg-est number of new asylum-seekers (311,700 claims), followed by Germany (288,800 claims), France (257,500 claims), Sweden (183,800 claims), and the United Kingdom (136,400 claims). To-gether, the three leading asylum coun-tries received more than one-third (38%) of all asylum requests submitted in the 44 industrialized countries listed in Annex Table 1.
tors may also be of relevance, includ-ing the existence of social networks of certain communities in destination countries, improved capacity to reg-ister asylum-seekers, and the fact that some countries are perceived as being more likely to grant refugee status than others.
These factors are reflected in the current and past rankings of some of the countries included in this report. Hungary, for instance, never before appeared among the top-15 receiv-ing countries of asylum-seekers. The situation changed in 2013 when levels went up six-fold to reach an all-time high of 18,600 asylum claims. Hungary thus became the 10th largest recipient of asylum applications in 2013, up from 23rd place a year earlier.
Italy saw a sharp increase in new asylum applicants in 2011, many of them arriving by boat. This was the re-sult of the ‘Arab Spring’ in North Africa in early 2011 which led to a tripling of the number of asylum applications in 2011 (34,100 claims). The all-time-high in 2011 made Italy the fourth largest recipient of asylum-seekers among the group of 44 industrialized countries. In 2012, however, the number of boat arrivals dropped significantly as a re-sult of which the country’s ranking dropped to 11th place. This trend re-versed in 2013 with the number of boat arrivals picking up again in the course of the year leading to Italy moving up to 7th place.
While not necessarily reflected in Table 2, some of the countries of the former Yugoslavia have emerged as im-portant recipient countries of asylum-seekers, notably Serbia (and Kosovo: S/RES/1244 (1999)) and Montenegro. The number of newly registered asy-lum claims in Serbia (and Kosovo: S/RES/1244 (1999)) remained around 100 applications per year until 2008, then increased over the following years, reaching an all-time high in 2013 with some 5,100 asylum claims. As a result, Serbia (and Kosovo: S/RES/1244 (1999)) moved from 40th place in 2004 to 20th in 2013. Montenegro has witnessed a simi-lar development since its independence in 2006 where the number of asylum-
(17) Asylum data for Australia is available from 1989.
TABLE 2
Changes in the ranking of the top-15 receiving countries | 2009 - 2013
2009 2010 2011 2012 2013
Germany 5 3 3 2 1United States 1 2 1 1 2France 2 1 2 3 3Sweden 6 4 5 4 4Turkey 15 15 10 6 5United Kingdom 4 6 7 5 6Italy 7 14 4 11 7Australia 16 10 13 12 8Switzerland 13 8 9 7 9Hungary 18 21 26 23 10Austria 11 11 11 10 11Netherlands 12 9 12 14 12Poland 14 16 16 16 13Belgium 9 7 6 9 14Norway 8 13 15 13 15
TABLE 3
Share of main receiving countries of asylum- seekers in total number of applications | 2009 - 2013
2009 2010 2011 2012 2013
Germany 7% 11% 11% 13% 18%
United States 11% 13% 15% 15% 14%
France 11% 13% 12% 11% 10%
Sweden 6% 9% 7% 9% 9%
Turkey 2% 3% 4% 6% 7%
United Kingdom 8% 6% 6% 6% 5%
Italy 5% 3% 8% 4% 5%
Australia 2% 4% 3% 3% 4%
Switzerland 4% 4% 5% 5% 3%
Hungary 1% 1% 0% 0% 3%
Austria 4% 3% 3% 4% 3%
Netherlands 4% 4% 3% 2% 2%
Poland 3% 2% 1% 2% 2%
Belgium 5% 6% 6% 4% 2%
Norway 5% 3% 2% 2% 2%
13UNHCR Asylum Trends 2013

The countries’ individual share in the total number of new applications re-ceived in the 44 industrialized countries reveals a changing pattern over time, particularly in 2013. As a result of sig-nificantly more people seeking asylum in Germany, the country’s relative share has tripled from 6 per cent in 2008 to 18 per cent in 2013. As a result of the abso-lute number of new asylum requests lodged in Germany in 2013 being signif-icantly higher than in other industrial-ized countries, the share of other coun-tries decreased in relative terms. This is for instance the case for the United States of America as the main recipient over the five-year period from 2009 to 2013
where its share has dropped from a sta-ble 15 per cent between 2010 and 2012 to 14 per cent in 2013.
A different trend has been observed for Sweden where the country’s share fluctuated over the years standing at 9 per cent in 2013, compared to 6 per cent in 2009. It nevertheless remained below the 11 per cent mark witnessed in 2007 when Sweden was the main recipient of asylum applications in Europe.
Hungary’s share never exceeded the 1 per cent mark during the previous decade. However, in 2013, Hungary reg-istered a record-high of 18,600 asylum claims, receiving over 3 per cent of all
applications registered among the 44 in-dustrialized countries. Canada’s share had increased to 10 per cent in 2008, but in subsequent years, the country’s share has dropped gradually to below 2 per cent by 2013.
The analysis changes when com-paring the number of asylum-seekers to the size of the national population or the Gross Domestic Product (GDP) (PPP). (18) These measures may allow for a better comparison among countries as these indicators tend to more accurately reflect the contributions of a country to host asylum-seekers. (19)
Based on the first indicator (national population), between 2009 and 2013
(18) In order to compare countries, the Purchasing Power Parity (PPP) GDP is considered (Source: International Monetary Fund, World Economic Outlook Database, October 2013; accessed 6 October 2013). Source for national populations: United Nations Population Division, World Population Prospects: The 2012 Revision, New York, 2013.(19) For the purposes of this type of analysis, the number of asylum applications registered over a five-year period may account for some extreme fluctuations in the values.
Syrian asylum-seekers waiting to be registered at the Regional Directorate of Border Police in Elhovo, Bulgaria, near the Turkish border. Bulgaria received more than 4,400 Syrian asylum applications in 2013.
14 UNHCR Asylum Trends 2013

2.6 respectively. Despite reporting an all-time high of new asylum-seekers in 2013, Japan and the Republic of Korea received 0.08 asylum-seekers per 1,000 inhabitants given the high national populations (about 176 million togeth-er) and comparatively low numbers of asylum-seekers.
Comparing the number of asylum-seekers to the Gross Domestic Product (PPP) of a country reveals a slightly dif-
ferent picture. Germany and France are the countries with the highest number of asylum-seekers (7.5 and 7.3 applicants per capita each) compared to the nation-al economy, followed by Turkey (7.0 ap-plicants per capita), the United States of America (6.4 applicants per capita), and Sweden (4.5 applicants per capita). [see Figure 5]
It is interesting to note that out of the five main destination countries of asylum-seekers in 2013 included in this report (Germany, the United States of America, France, Sweden, and Tur-key), only Sweden features among the top ten when compared against population size. But all five feature when compared against GDP (PPP) per capita. This may be explained by the relatively large variation in national population size among the 44 indus-trialized countries. The top five desti-nation countries have a significantly larger population size compared to Malta, Liechtenstein, or Luxembourg. In the case of the GDP (PPP) per capita ratio, the countries included can be con-sidered as all having highly developed economies and the variation in GDP figures between them is not that sig-nificant. With this important difference in mind, the GDP indicator might be more meaningful when making com-parisons among the group of 44 indus-trialized countries. n
Malta received, on average, the highest number of asylum-seekers compared to its national population: 20.2 applicants per 1,000 inhabitants. Sweden ranked second (19.2 applicants per 1,000 in-habitants), followed by Liechtenstein (17.3 applicants per 1,000 inhabitants), Luxembourg (11.9 applicants per 1,000 inhabitants), and Switzerland (11.5 ap-plicants per 1,000 inhabitants) [see Fig-ure 4]. The United States of America and Germany, the two main recipients of new asylum-seekers during this period, ranked respectively 29th and 16th, with an average of one and 3.5 asylum-seekers per 1,000 inhabitants.
At the regional level, the 28 Mem-ber States of the European Union re-ceived on average 2.9 asylum-seekers per 1,000 inhabitants during 2009-2013. Fifteen countries ranked below the average of the 28 countries, includ-ing 10 of the 13 Member States which joined the European Union after 2004. Among the latter, only Cyprus, Hun-gary and Malta received on average more asylum-seekers per 1,000 inhab-itants than the EU Member States as a whole. The 38 European countries included in Annex Table 1 received on average 2.8 asylum-seekers per 1,000 inhabitants, whereas the correspond-ing figure for North America and Australia/New Zealand was 1.2 and
UN
HC
R /
D.
KA
SH
AV
ELO
V
Malta
Sweden
Liechtenstein
Luxembourg
Switzerland
Norway
Cyprus
Austria
Belgium
Montenegro
Fig. 4 Number of asylum-seekers per 1,000 inhabitants | 2009 - 2013
8.6
8.6
9.0
9.6
11.4
11.5
11.9
17.3
19.2
20.2
Fig. 5 Number of asylum-seekers per 1 USD GDP (PPP) per capita | 2009 - 2013
Germany
France
Turkey
United States
Sweden
United Kingdom
Italy
Canada
Belgium
Poland 2.2
2.5
2.7
3.6
3.7
4.5
6.4
7.0
7.3
7.5
15UNHCR Asylum Trends 2013
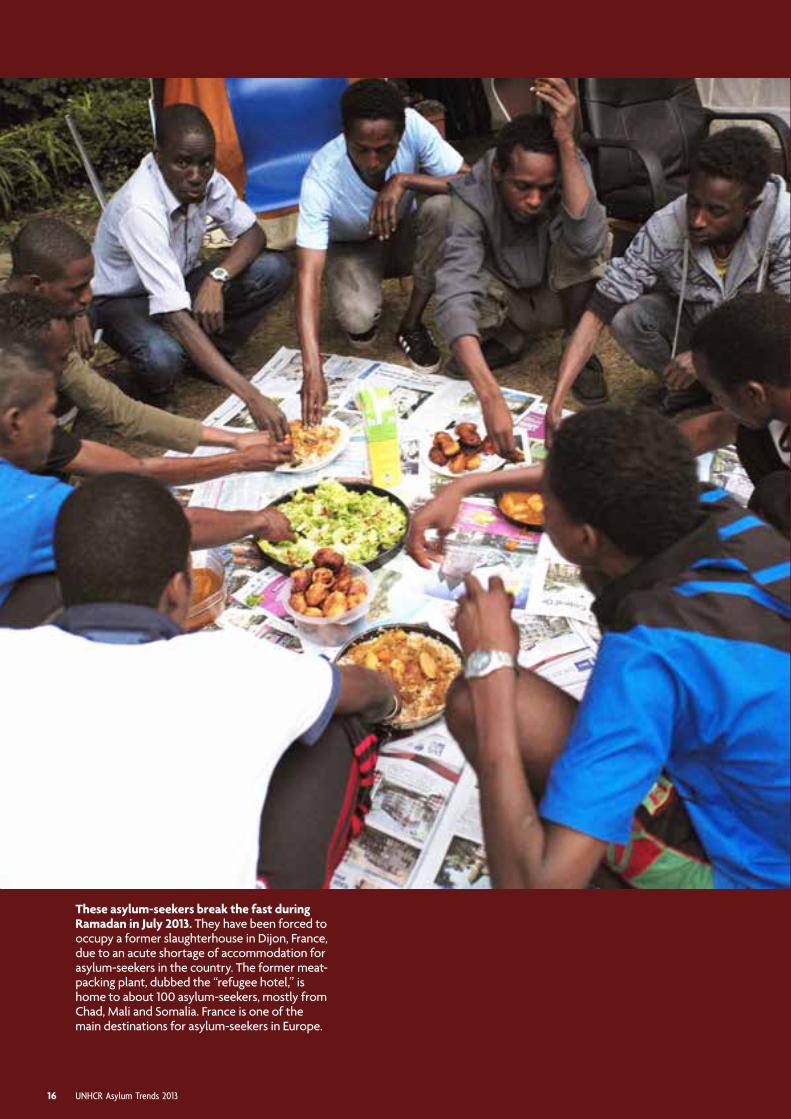
These asylum-seekers break the fast during Ramadan in July 2013. They have been forced to occupy a former slaughterhouse in Dijon, France, due to an acute shortage of accommodation for asylum-seekers in the country. The former meat-packing plant, dubbed the “refugee hotel,” is home to about 100 asylum-seekers, mostly from Chad, Mali and Somalia. France is one of the main destinations for asylum-seekers in Europe.
16 UNHCR Asylum Trends 2013

UN
HC
R /
P.
FIN
EL
LE
IV
more than in 2011 (8,500 claims), the year when armed conflict in the Syr-ian Arab Republic began. The 2013 level is the highest number recorded by a single group among the indus-
trialized countries since 1999 when 123,000 people originating from Ser-bia and Montenegro lodged asylum claims in the 44 countries included in this report. I
N 2013, PEOPLE from 200 dif-ferent countries or territories submitted at least one asylum claim in one of the 44 coun-tries discussed in this report.
The Syrian Arab Republic, the Russian Federation, Afghanistan, Iraq, and Ser-bia (and Kosovo: S/RES/1244 (1999)), were the five top source countries of asylum-seekers in the 44 indus-trialized countries in 2013. With the exception of the Russian Federa-tion and Iraq, this is comparable to 2012, when Afghanistan, the Syr-ian Arab Republic, Serbia (and Ko-sovo: S/RES/1244 (1999)), China, and Pakistan were the top-ranking source countries.
With the armed conflict and the humanitarian situation dete-riorating in the course of 2013, the Syrian Arab Republic became for the first time the main country of ori-gin of asylum-seekers in industri-alized countries. Provisional data indicate that some 56,400 Syrians requested refugee status in 2013, more than double the number of 2012 (25,200 claims) and six times
Origin of asylum-seekers
The statistics by country of origin are generally based on the nationality or country of citizenship as recorded by the competent authorities of the host country. This section analyses the origin of asylum-seekers in the 44 industrialized countries which provided monthly asylum data to UNHCR. The breakdown by country of origin of asylum applications registered with the United States Department of Justice, Executive Office of Immigration Review (EOIR) between September and December 2013 is not available. The analysis in this section should therefore be considered as indicative only, pending the release of complete 2013 asylum statistics by the US authorities.
Fig. 6 Main nationalities of asylum-seekers | 2013
9.4%
4.0%
6.5%
52.9%
6.7%
6.4%
5.8%
4.4%
Syrian Arab Republic
Russian Federation
Islamic Republic of Iran
Afghanistan
Iraq
Serbia *
Pakistan
Other
Somalia
3.9%
* Serbia (and Kosovo: S/RES/1244 (1999))
17UNHCR Asylum Trends 2013

tries together accounted for two-thirds of all asylum requests from the Russian Federation. In both cases, the num-bers went up significantly compared to 2012 (+365% and 142% respectively). France, the third largest recipient of Russian asylum claims in 2013 with 4,600 applications, however, recorded a decrease of 13 per cent compared to 2012 (5,400 claims). Other important destination countries were Austria (2,800 claims), Sweden (1,000 claims), and Denmark (980 claims). Overall, asylum claims from the Russian Fed-eration accounted for 7 per cent of all applications recorded among the 44 in-dustrialized countries.
Afghanistan dropped from being the main country of origin of asylum-seekers in industrialized countries in 2012 to third place a year later. Provi-sional data indicate that 38,700 Af-ghans requested refugee status in 2013, a drop of 8,900 applications or 19 per cent. The share of asylum-seekers from Afghanistan in the total num-ber of asylum claims dropped from 10 to 6.5 per cent as a result of the lower number of applications in 2013. Turkey remained the prime destina-tion for Afghan asylum-seekers with 8,700 claims registered in 2013, despite a 38 per cent drop compared to 2012
That Syrians sought international protection in all of the 44 industrialized countries speaks of the tragic situation in the Syrian Arab Republic. Overall, Syrians accounted on average for one out of every tenth new asylum claim in the industrialized world in 2013. Levels were highest in Sweden (16,300 claims) and Germany (11,900 claims). In both countries, the number of Syrian asy-lum claims either more than doubled (Sweden) or almost doubled (Germany). Other important destination countries were Bulgaria (4,400 claims), the Neth-erlands (2,700 claims), and the United Kingdom and Austria (2,000 claims each). With the exception of five coun-tries (Cyprus, Finland, Japan, Latvia, and New Zealand), Syrian asylum claims went up in all countries.
The increase in Syrian asylum ap-plications was particularly strong dur-ing the second half of the year as the armed conflict in the country intensi-fied. During the first half of 2013, some 19,000 Syrian claims were registered in the 44 industrialized countries, dou-bling in the second half to 37,400.
The number of asylum-seekers recorded as originating from the Rus-sian Federation reached unprecedented levels among the group of 44 coun-tries. The figure was at its highest
with 39,800 asylum applications regis-tered during 2013, three quarters more (+76%) than in 2012 (22,600 claims) and the highest since 2003 when some 35,100 claims were lodged. Germany and Poland were the prime destinations registering 14,900 and 11,900 asylum claims, respectively. These two coun-
8,000
7,000
6,000
5,000
4,000
3,000
2,000
1,000
0
Fig. 7 Syrian asylum applications submitted in 44 industrialized countries | April 2011 - December 2013
15%
10%
5%
0
Dec. 20
11
Syrian asylum applications lodged per month% of Syrian claims in total number of claims
Apr. 2011
Dec. 20
12
Jun. 2012
Dec. 20
13
Jun. 2013
‘06 ‘07 ‘08 ‘09 ‘10 ‘11 ‘12
Russian Fed.Syrian Arab Rep.
60,000
50,000
40,000
30,000
20,000
10,000
0
Fig. 8 Asylum requests from Afghanistan, Syrian Arab Republic, Serbia * and Russian Federation | 2001 - 2013
‘01 ‘02 ‘03 ‘04 ‘05
AfghanistanSerbia *
‘13
* Serbia (and Kosovo: S/RES/1244 (1999))
18 UNHCR Asylum Trends 2013

Syrian asylum applications
25,000
2,500
12,500
(14,100 claims). (20) Turkey was followed by Germany (7,700 claims), Sweden (3,000), Australia (2,800), and Austria (2,600).
The number of requests for asylum or refugee status from Iraqis has fluc-tuated over the past years. Iraqis were the main group of asylum-seekers in industrialized countries in 2008 (40,400 claims), after which the num-bers steadily decreased until end 2010 when the number was nearly half of the 2008 figure (20,600 claims). This trend reversed in 2011 when 23,700 Ira-qis requested international protection. However, in 2012, the figure again dropped, falling to 21,000. A rather dra-matic upward trend occurred in 2013 with 38,200 Iraqi asylum applications registered during the year (+82%). Iraq thus shifted from the seventh to the
(20) The 2012 figure has been revised to include all asylum-seekers, both those pre-registered and those registered on a monthly basis. The 2013 figure includes asylum-seekers registered with UNHCR as well as asylum-seekers who have been pre-registered but who are pending official registration with UNHCR.
Syrian asylum applications lodged in 44 industrialized countries | April 2011 - December 2013Map 2
fourth highest country of origin of asy-lum-seekers among the group of indus-trialized countries. The increase in 2013 was particularly significant in Turkey, the main destination country for Iraqi asylum-seekers, where figures more than tripled from 6,900 claims in 2012 to 25,300 a year later. Other important destination countries were Germany (4,000 claims), Sweden (1,500 claims), and Australia (1,200 claims).
After having constituted the main group of asylum-seekers in the 44 industrialized countries in 2010 (30,600 claims), the number of asylum-seekers originating from Serbia (and
19UNHCR Asylum Trends 2013

6,200 a year later. As a result, Hungary became the second most important destination country for people from that country. Hungary was followed by France with 5,800 asylum claims from Serbia (and Kosovo: S/RES/1244 (1999)), almost 2,000 more than 2012. Other important destination countries
were Sweden (2,900 claims) and Austria (1,100 claims).
Most of the countries reporting monthly asylum statistics to UNHCR distinguish applicants originating from Kosovo (S/RES/1244 (1999)) in their data. The available evidence shows that the proportion of asylum-seekers from Ko-sovo (S/RES/1244 (1999)) in these coun-tries has fluctuated over the past five years. In 2009, on average, 74 per cent of applicants from Serbia came from Ko-sovo. This figure dropped to 45 per cent in 2010 and to a further 41 per cent in 2011. In 2012, it stood at 35 per cent. This trend was reversed in 2013 where the proportion of people originating from Kosovo stood at 54 per cent. Among the main receiving countries recording this type of information, the proportion of people originating from Kosovo (S/RES/1244 (1999)) is above the 80 per cent mark in Hungary (99%), France (89%), and Austria (82%). It is relatively low in the Netherlands (15%), Denmark (19%), Germany (23%), and Sweden (31%).
With 26,300 applications submitted by asylum-seekers from Pakistan in 2013, this figure is the highest on record. The number increased by one-tenth (+11%) compared to 2012 (23,600 claims). This is the third consecutive annual in-crease and follows an annual average of
about 11,000 claims in 2009 and 2010. This made Pakistan the sixth highest source country of asylum-seekers in the industrialized world in 2013. The increase was particularly significant in Hungary where asylum levels in-creased ten-fold from 330 in 2012 to almost 3,100 a year later. The United
Kingdom and Germany remained the two main destination countries. In the former, some 4,500 asylum applications were registered (-6%) while in the latter, some 4,100 claims (+ 20%).
Other significant source countries of asylum-seekers in the 44 industrial-ized countries in 2013 were the Islamic Republic of Iran (23,900 claims), Soma-lia (23,100), Eritrea (21,800), and China (20,200). The increase in Eritrean asy-lum claims was particularly significant where levels went up from 12,300 a year earlier (+77%).
Over the last five years, some chang-es have occurred in the ranking of the main countries of origin of asylum ap-plicants. In 2010, the Syrian Arab Re-public ranked as the 20th highest source country. Since the outbreak of violence and armed conflict in early 2011, it has gradually moved up the list and now oc-cupies the top place. A similar upward trend has been observed of Egyptian asylum-seekers since the ‘Arab Spring’ who now occupy 15th place, up from 31st two years earlier. Serbia (and Kosovo: S/RES/1244 (1999)), on the other hand, saw a significant change, dropping from 1st in 2010 to 5th place in 2013. It is simi-lar for Chinese asylum-seekers whose ranking dropped from 2nd place in 2011 to 10th in 2013. n
Kosovo: S/RES/1244 (1999)) had dropped by one third in 2011 (21,300 claims). This trend was reversed in 2012 with 24,500 people from the country re-questing international protection. It continued into 2013 with 34,700 asy-lum applications registered (+41%), the highest since 2002 when some 35,000 people sought asylum. Nevertheless, Serbia (and Kosovo: S/RES/1244 (1999)) dropped to fifth highest country of origin of asylum-seekers among the group of industrialized countries. Its
number was particularly significant in Germany, the main destination country, with 14,900 applications lodged during 2013 (+43%). In Hungary, the number of asylum claims lodged by people from Serbia (and Kosovo: S/RES/1244 (1999)) skyrocketed from 250 in 2012 to almost
In 2010, the Syrian Arab Republic ranked as the 20th highest source country. Since the outbreak of violence
and armed conflict in early 2011, it has gradually moved up the list and now occupies the top place.
TABLE 4
Changes in the ranking of the top-15 countries of origin (1) | 2009 - 2013
2009 2010 2011 2012 2013
Syrian Arab Rep. 19 20 15 2 1Russian Federation 4 5 7 6 2Afghanistan 1 2 1 1 3Iraq 2 4 3 7 4
Serbia (2) 6 1 4 3 5
Pakistan 8 8 5 5 6Islamic Rep. of Iran 9 7 6 8 7Somalia 3 6 8 9 8Eritrea 12 11 10 10 9China 5 3 2 4 10Nigeria 7 9 9 12 11Stateless 26 24 35 28 12Albania 31 34 36 17 13Sri Lanka 11 10 13 14 14Egypt 43 35 31 23 15
(1) With country of origin data for the United States in 2013 partially not available, the ranking in 2013 should be considered as indicative only.(2) Serbia (and Kosovo: S/RES/1244 (1999)).
Despite the fact that Syrians constituted the largest group of asylum-seekers among industrialized countries in 2013, their number remains modest compared to the number of Syrian refugees hosted by countries in the Middle East. The total number registered or awaiting registration in Egypt, Iraq, Jordan, Lebanon, and Turkey had surpassed the 2.5 million mark at the time of writing this report. •
20 UNHCR Asylum Trends 2013
V
21UNHCR Asylum Trends 2013

Country/ region of asylum 2009 2010 2011 2012 2013 Total
Annualchange Share Rank
Per 1,000 inhabitants Per 1 USD/GDP per capita (1)
Total Rank Total Rank
‘13-’12 2013 ‘09-’13 2013 ‘09-’13 2013 ‘09-’13 2013 ‘09-’13 2013 ‘09-’13 2013 ‘09-’13
Albania - 10 20 20 230 280 1050% 0% 0% 39 45 0.0 0.1 44 42 0.0 0.0 31 41Australia 7,420 12,640 11,510 15,790 24,320 71,680 54% 4% 3% 8 12 0.7 3.1 15 18 0.6 1.7 11 14Austria 15,820 11,010 14,420 17,410 17,500 76,160 1% 3% 3% 11 11 2.0 9.0 6 8 0.4 1.8 14 13Belgium 17,190 21,760 26,000 18,530 12,500 95,980 -33% 2% 4% 14 9 1.7 8.6 9 9 0.3 2.5 17 9Bosnia and Herzegovina 50 50 40 50 100 290 100% 0% 0% 42 44 0.0 0.1 43 44 0.0 0.0 37 40Bulgaria 850 1,030 890 1,230 6,980 10,980 467% 1% 0% 19 23 0.2 1.5 31 23 0.5 0.8 12 19Canada 33,250 23,160 25,350 20,500 10,380 112,640 -49% 2% 5% 16 6 0.6 3.2 16 17 0.2 2.7 19 8Croatia 150 290 810 1,190 1,090 3,530 -8% 0% 0% 30 31 0.3 0.8 25 30 0.1 0.2 29 29Cyprus 3,200 3,160 1,770 1,630 1,250 11,010 -23% 0% 0% 29 22 1.4 9.6 10 7 0.1 0.5 28 23Czech Rep. 1,360 490 490 510 500 3,350 -2% 0% 0% 34 32 0.0 0.3 39 38 0.0 0.1 34 32Denmark 3,820 4,970 3,810 6,190 7,540 26,330 22% 1% 1% 18 18 1.1 4.7 11 12 0.2 0.7 21 20Estonia 40 30 70 80 100 320 25% 0% 0% 42 43 0.1 0.2 37 39 0.0 0.0 42 42Finland 5,910 4,020 3,090 2,920 3,020 18,960 3% 0% 1% 24 19 0.5 3.5 18 15 0.1 0.5 27 24France 42,120 48,070 52,150 55,070 60,100 257,510 9% 10% 11% 3 3 0.9 4.0 13 13 1.7 7.3 4 2Germany 27,650 41,330 45,740 64,540 109,580 288,840 70% 18% 13% 1 2 0.8 3.5 14 16 2.8 7.5 2 1Greece 15,930 10,270 9,310 9,580 8,230 53,320 -14% 1% 2% 17 15 0.9 4.8 12 11 0.3 2.1 16 11Hungary 4,670 2,100 1,690 2,160 18,570 29,190 760% 3% 1% 10 17 0.2 2.9 28 19 0.9 1.5 6 17Iceland 40 50 80 110 150 430 36% 0% 0% 41 42 0.3 1.3 21 26 0.0 0.0 43 43Ireland 2,690 1,940 1,290 940 940 7,800 0% 0% 0% 32 26 0.2 1.7 29 22 0.0 0.2 32 30Italy 17,600 10,050 34,120 17,350 27,830 106,950 60% 5% 5% 7 7 0.3 1.8 24 21 0.9 3.6 7 7Japan 1,390 1,200 1,870 2,550 3,250 10,260 27% 1% 0% 23 24 0.0 0.1 42 43 0.1 0.3 25 28Latvia 50 60 340 190 190 830 0% 0% 0% 40 39 0.1 0.4 35 34 0.0 0.0 39 38Liechtenstein 290 110 80 70 90 640 29% 0% 0% 44 40 1.9 17.3 8 3 .. .. .. ..Lithuania 210 370 410 530 280 1,800 -47% 0% 0% 36 35 0.2 0.6 30 32 0.0 0.1 35 34Luxembourg 480 740 2,080 2,000 990 6,290 -51% 0% 0% 31 28 3.8 11.9 3 4 0.0 0.1 36 35Malta 2,390 140 1,860 2,060 2,200 8,650 7% 0% 0% 25 25 4.8 20.2 1 1 0.1 0.3 26 26Montenegro 20 10 240 1,530 3,550 5,350 132% 1% 0% 22 29 2.5 8.6 5 10 0.3 0.5 18 25Netherlands 14,910 13,330 11,590 9,660 14,400 63,890 49% 2% 3% 12 13 0.6 3.8 17 14 0.3 1.5 15 15New Zealand 340 340 310 320 290 1,600 -9% 0% 0% 35 36 0.1 0.4 36 35 0.0 0.1 40 37Norway 17,230 10,060 9,050 9,790 11,470 57,600 17% 2% 3% 15 14 1.9 11.4 7 6 0.2 1.0 20 18Poland 10,590 6,530 5,090 9,170 13,980 45,360 52% 2% 2% 13 16 0.2 1.2 26 28 0.7 2.2 9 10Portugal 140 160 280 300 510 1,390 70% 0% 0% 33 37 0.0 0.1 40 40 0.0 0.1 33 36Rep. of Korea 320 430 1,010 1,140 1,570 4,470 38% 0% 0% 26 30 0.0 0.1 41 41 0.0 0.1 30 31Romania 840 860 1,720 2,510 1,500 7,430 -40% 0% 0% 27 27 0.1 0.3 33 37 0.1 0.6 24 21Serbia (and Kosovo: S/RES/1244 (1999)) 310 790 3,320 2,770 5,130 12,320 85% 1% 1% 20 21 0.3 1.3 23 27 0.6 1.5 10 16
- of which Kosovo 30 270 190 50 60 600 20% 0% 0% .. .. .. .. .. .. .. .. .. ..Slovakia 820 540 320 550 280 2,510 -49% 0% 0% 36 34 0.1 0.5 34 33 0.0 0.1 38 33Slovenia 180 250 310 260 240 1,240 -8% 0% 0% 38 38 0.1 0.6 32 31 0.0 0.0 41 39Spain 3,010 2,740 3,410 2,580 4,500 16,240 74% 1% 1% 21 20 0.1 0.3 38 36 0.1 0.5 22 22Sweden 24,190 31,820 29,650 43,880 54,260 183,800 24% 9% 8% 4 4 4.6 19.2 2 2 1.3 4.5 5 5Switzerland 14,490 13,520 19,440 25,950 19,440 92,840 -25% 3% 4% 9 10 3.2 11.5 4 5 0.4 2.1 13 12The former Yugoslav Republic of Macedonia 90 180 740 640 1,340 2,990 109% 0% 0% 28 33 0.3 1.4 22 24 0.1 0.3 23 27
Turkey 7,830 9,230 16,020 26,470 44,810 104,360 69% 7% 5% 5 8 0.4 1.4 20 25 3.0 7.0 1 3United Kingdom 30,670 22,640 25,900 27,980 29,190 136,380 4% 5% 6% 6 5 0.4 2.2 19 20 0.8 3.7 8 6United States 42,530 46,920 63,110 70,770 88,360 311,690 25% 14% 14% 2 1 0.2 1.0 27 29 1.8 6.4 3 4
EU-Total (28) 247,480 240,700 278,610 301,000 398,250 1,466,040 32% 65% 65% 0.8 2.9Nordic countries (5) 51,190 50,920 45,680 62,890 76,440 287,120 22% 12% 13% 2.9 11.0Southern Europe (8) 50,100 35,760 66,790 59,990 89,560 302,200 49% 15% 13% 0.4 1.4Former Yugoslavia (6) 770 1,300 5,270 6,390 11,390 25,120 78% 2% 1% 0.5 1.1Total Europe (38) 287,830 274,710 327,640 368,400 484,560 1,743,140 32% 79% 77% 0.8 2.8
Canada/USA 75,780 70,080 88,460 91,270 98,740 424,330 8% 16% 19% 0.3 1.2Australia/New Zealand 7,760 12,980 11,820 16,110 24,610 73,280 53% 4% 3% 0.9 2.6Japan/Rep. of Korea 1,710 1,630 2,880 3,690 4,820 14,730 31% 1% 1% 0.0 0.1
Total (44) 373,080 359,400 430,800 479,470 612,730 2,255,480 28% 0.5 1.9
NotesSource: Governments, UNHCR. See Notes on next page for information on applications registered with UNHCR.This table includes final data for 2009 to 2012. In the following tables, the 2012 figures are based on the monthly database. This results in some discrepancies.All figures in this table have been rounded to the closest ten.A dash (“-”) indicates that the value is zero or not available. Two dots (“..”) indicate that the value is not available.(1) This refers to Gross Domestic Product (GDP), Purchasing Power Parity (PPP), per capita.
TABLE 1 Asylum applications submitted in Europe and selected non-European countries | 2009 - 2013
For country notes and regional classification, see next page.
22 UNHCR Asylum Trends 201322

Notes
a. Country notes
Australia. Figures are based on the number of applications lodged for protection visas. They do not include asylum-seekers who arrived in Australia by boat in 2012 or 2013 and have not been able to lodge protection visa applications or who have been transferred to third countries for refugee status determination.Belgium. Figures include accompanying children since 2009. Data include repeat applications in 2009 (4,260) and 2010 (3,410).Canada. Source: Citizenship and Immigration Canada.Cyprus. In addition, UNHCR registered asylum applications in the northern part of Cyprus in 2008 (19), 2011 (31), 2012 (96) and 2013 (113).France. Includes asylum applications of minors. Iceland. 2013 data refers to January-October only. No information for November and December 2013. Source for October data (2013): Eurostat.Ireland. Data for 2009-2010 include repeat applications.Japan. Figures are UNHCR estimates.Poland. Data excludes a significant number of repeat applications with the exception of monthly data for December 2013.Serbia (and Kosovo: S/RES/1244 (1999)). Source: UNHCR (2009-2010).Slovakia. Data for 2009-2010 includes repeat applications.Spain. Includes applications lodged at Spanish embassies.Switzerland. Figures exclude repeat applications.Turkey. UNHCR is the source of the data. The 2012 figure has been revised to include all asylum-seekers, both those pre-registered and those registered on a monthly basis. The 2013 figure includes asylum-seekers registered with UNHCR as well as asylum-seekers who have been pre-registered but who are pending official registration with UNHCR. As of 31 December 2013, there were 585,480 registered Syrian refugees in Turkey covered by the Government’s Temporary Protection Regime. The number of Syrian asylum-seekers included in the annex tables covers only those who for specific reasons have been referred to UNHCR for further evaluation of their international protection needs.
United States. Figures include (1) statistics from the US Department of Homeland Security (DHS), based on the number of cases and multiplied by 1.106 to reflect the estimated number of individuals; and (2) the number of new (“defensive”) requests lodged with the Department of Justice, Executive Office for Immigration Review (EOIR), based on the number of individuals. DHS data for 2013 is based on the number of cases and multiplied by 1.356 to reflect the estimated number of individuals during this year. EOIR data is available up to August 2013. The total number of applications lodged with the EOIR between September and December 2013 has been estimated by UNHCR using a statistical model (seasonal ARIMA). No information is available on the country of origin during this period, however.
b. Regional classification
EU-Total (28). All Member States of the European Union as at 1 July 2013.Nordic countries (5). Denmark, Finland, Iceland, Norway and Sweden.Southern Europe (8). Albania, Cyprus, Greece, Italy, Malta, Portugal, Spain and Turkey.Former Yugoslavia (6). Bosnia and Herzegovina, Croatia, Montenegro, Serbia (and Kosovo: S/RES/1244 (1999)), Slovenia, and the former Yugoslav Republic of Macedonia.Total Europe (38). All European countries listed.Source for national population: United Nations, Population Division, “World Population Prospects: The 2012 Revision”, New York, 2013.Source for Gross Domestic Product (PPP): International Monetary Fund, World Economic Outlook Database, April 2013 (accessed 6 October 2013).
23UNHCR Asylum Trends 2013 23

Country of asylum
Annualchange‘13-’12
Share Rank
Per 1,000 inhabitants Per 1 USD/GDP per capita
Total Rank Total Rank
2009 2010 2011 2012 2013 Total 2013 ‘09-’13 2013 ‘09-’13 2013 ‘09-’13 2013 ‘09-’13 2013 ‘09-’13 2013 ‘09-’13
Armenia 70 50 70 580 320 1,090 -45% 7% 5% 5 5 0.1 0.4 2 1 0.0 0.2 4 5Azerbaijan 250 270 150 280 460 1,410 64% 10% 7% 4 4 0.0 0.1 3 4 0.0 0.1 6 6Belarus 160 150 90 110 210 720 91% 4% 3% 6 6 0.0 0.1 5 6 0.0 0.0 7 7Georgia 40 70 80 600 720 1,510 20% 15% 7% 3 3 0.2 0.3 1 2 0.1 0.2 2 3Rep. of Moldova 90 130 70 180 160 630 -11% 3% 3% 7 7 0.0 0.2 4 3 0.0 0.2 5 4Russian Federation 2,710 2,180 1,270 1,240 1,960 9,360 58% 41% 44% 1 1 0.0 0.1 7 7 0.1 0.5 3 2Ukraine 1,360 1,500 890 1,860 990 6,600 -47% 21% 31% 2 2 0.0 0.1 6 5 0.1 0.9 1 1
Total 4,680 4,350 2,620 4,850 4,820 21,320 -1% 0.0 0.1
NotesSource: Governments, UNHCRAll figures in this table have been rounded to the closest ten.Azerbaijan. Source: Government and UNHCR.Russian Federation. In addition, 2,990 persons applied for temporary asylum in 2009; 1,710 in 2010; 1,030 in 2011; 1,080 in 2012; and 2,740 in 2013.Ukraine. Data for 2013 refers to number of cases rather than the number of persons.Source for national population: United Nations, Population Division, “World Population Prospects: The 2012 Revision”, New York, 2013.Source for Gross Domestic Product (PPP): International Monetary Fund, World Economic Outlook Database, April 2013 (accessed 6 October 2013).
TABLE 2 Asylum applications submitted in selected countries in Eastern Europe | 2009 - 2013
All figures are based on annual data.
24 UNHCR Asylum Trends 201324
OriginAnnualchange
Share Rank
2012 2013 Total 2012 2013 Total 2012 2013
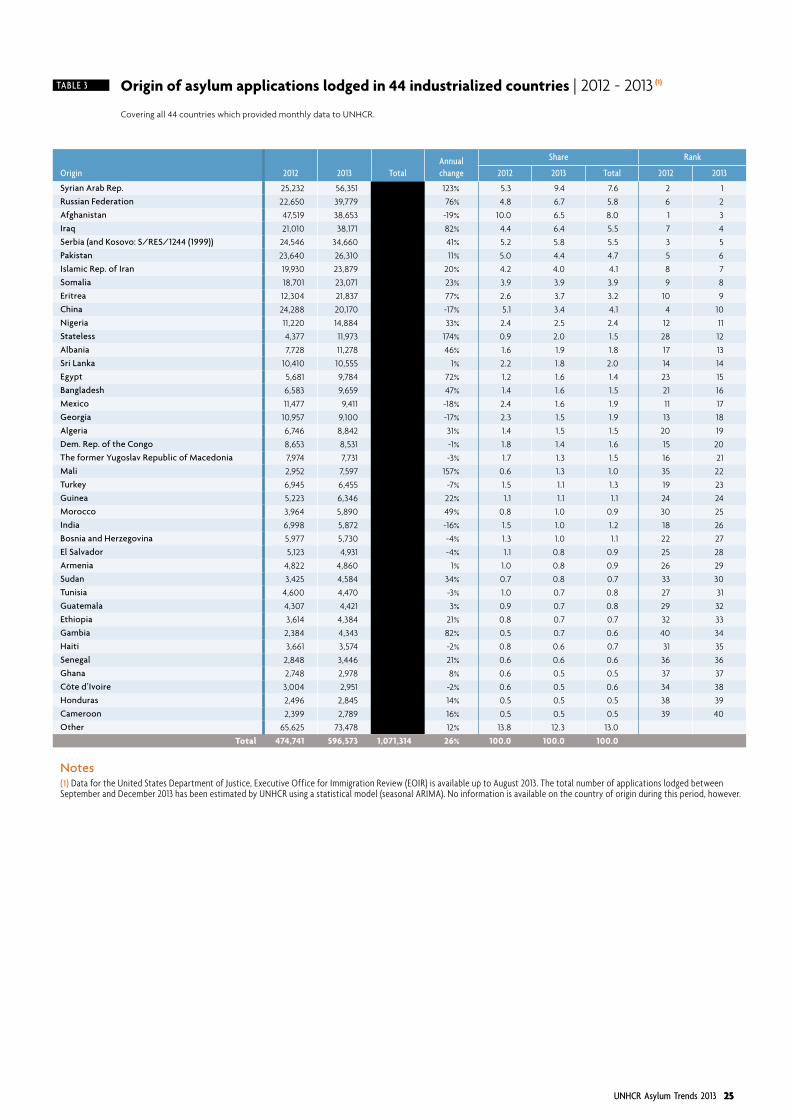
Syrian Arab Rep. 25,232 56,351 81,583 123% 5.3 9.4 7.6 2 1Russian Federation 22,650 39,779 62,429 76% 4.8 6.7 5.8 6 2Afghanistan 47,519 38,653 86,172 -19% 10.0 6.5 8.0 1 3Iraq 21,010 38,171 59,181 82% 4.4 6.4 5.5 7 4Serbia (and Kosovo: S/RES/1244 (1999)) 24,546 34,660 59,206 41% 5.2 5.8 5.5 3 5Pakistan 23,640 26,310 49,950 11% 5.0 4.4 4.7 5 6Islamic Rep. of Iran 19,930 23,879 43,809 20% 4.2 4.0 4.1 8 7Somalia 18,701 23,071 41,772 23% 3.9 3.9 3.9 9 8Eritrea 12,304 21,837 34,141 77% 2.6 3.7 3.2 10 9China 24,288 20,170 44,458 -17% 5.1 3.4 4.1 4 10Nigeria 11,220 14,884 26,104 33% 2.4 2.5 2.4 12 11Stateless 4,377 11,973 16,350 174% 0.9 2.0 1.5 28 12Albania 7,728 11,278 19,006 46% 1.6 1.9 1.8 17 13Sri Lanka 10,410 10,555 20,965 1% 2.2 1.8 2.0 14 14Egypt 5,681 9,784 15,465 72% 1.2 1.6 1.4 23 15Bangladesh 6,583 9,659 16,242 47% 1.4 1.6 1.5 21 16Mexico 11,477 9,411 20,888 -18% 2.4 1.6 1.9 11 17Georgia 10,957 9,100 20,057 -17% 2.3 1.5 1.9 13 18Algeria 6,746 8,842 15,588 31% 1.4 1.5 1.5 20 19Dem. Rep. of the Congo 8,653 8,531 17,184 -1% 1.8 1.4 1.6 15 20The former Yugoslav Republic of Macedonia 7,974 7,731 15,705 -3% 1.7 1.3 1.5 16 21Mali 2,952 7,597 10,549 157% 0.6 1.3 1.0 35 22Turkey 6,945 6,455 13,400 -7% 1.5 1.1 1.3 19 23Guinea 5,223 6,346 11,569 22% 1.1 1.1 1.1 24 24Morocco 3,964 5,890 9,854 49% 0.8 1.0 0.9 30 25India 6,998 5,872 12,870 -16% 1.5 1.0 1.2 18 26Bosnia and Herzegovina 5,977 5,730 11,707 -4% 1.3 1.0 1.1 22 27El Salvador 5,123 4,931 10,054 -4% 1.1 0.8 0.9 25 28Armenia 4,822 4,860 9,682 1% 1.0 0.8 0.9 26 29Sudan 3,425 4,584 8,009 34% 0.7 0.8 0.7 33 30Tunisia 4,600 4,470 9,070 -3% 1.0 0.7 0.8 27 31Guatemala 4,307 4,421 8,728 3% 0.9 0.7 0.8 29 32Ethiopia 3,614 4,384 7,998 21% 0.8 0.7 0.7 32 33Gambia 2,384 4,343 6,727 82% 0.5 0.7 0.6 40 34Haiti 3,661 3,574 7,235 -2% 0.8 0.6 0.7 31 35Senegal 2,848 3,446 6,294 21% 0.6 0.6 0.6 36 36Ghana 2,748 2,978 5,726 8% 0.6 0.5 0.5 37 37Côte d’Ivoire 3,004 2,951 5,955 -2% 0.6 0.5 0.6 34 38Honduras 2,496 2,845 5,341 14% 0.5 0.5 0.5 38 39Cameroon 2,399 2,789 5,188 16% 0.5 0.5 0.5 39 40Other 65,625 73,478 139,103 12% 13.8 12.3 13.0
Total 474,741 596,573 1,071,314 26% 100.0 100.0 100.0
Notes(1) Data for the United States Department of Justice, Executive Office for Immigration Review (EOIR) is available up to August 2013. The total number of applications lodged between September and December 2013 has been estimated by UNHCR using a statistical model (seasonal ARIMA). No information is available on the country of origin during this period, however.
TABLE 3 Origin of asylum applications lodged in 44 industrialized countries | 2012 - 2013 (1)
Covering all 44 countries which provided monthly data to UNHCR.
25UNHCR Asylum Trends 2013 25

OriginAnnualchange
Share Rank
2012 2013 Total 2012 2013 Total 2012 2013
Syrian Arab Rep. 23,864 53,824 77,688 126% 6.5 11.1 9.1 3 1Russian Federation 21,316 38,699 60,015 82% 5.8 8.0 7.0 4 2Iraq 19,455 35,755 55,210 84% 5.3 7.4 6.5 6 3Afghanistan 43,872 35,189 79,061 -20% 11.9 7.3 9.3 1 4Serbia (and Kosovo: S/RES/1244 (1999)) 24,108 34,347 58,455 42% 6.6 7.1 6.9 2 5Pakistan 20,142 22,480 42,622 12% 5.5 4.6 5.0 5 6Somalia 17,998 22,446 40,444 25% 4.9 4.6 4.7 7 7Eritrea 11,892 21,293 33,185 79% 3.2 4.4 3.9 9 8Islamic Rep. of Iran 16,959 18,222 35,181 7% 4.6 3.8 4.1 8 9Nigeria 9,901 13,784 23,685 39% 2.7 2.8 2.8 11 10Albania 7,137 10,891 18,028 53% 1.9 2.2 2.1 14 11Stateless 3,716 10,125 13,841 172% 1.0 2.1 1.6 25 12Georgia 10,843 8,980 19,823 -17% 2.9 1.9 2.3 10 13Algeria 6,553 8,702 15,255 33% 1.8 1.8 1.8 16 14Bangladesh 5,789 8,249 14,038 42% 1.6 1.7 1.6 19 15Dem. Rep. of the Congo 8,090 7,941 16,031 -2% 2.2 1.6 1.9 12 16The former Yugoslav Republic of Macedonia 7,934 7,707 15,641 -3% 2.2 1.6 1.8 13 17Mali 2,647 7,319 9,966 177% 0.7 1.5 1.2 31 18Sri Lanka 6,703 6,112 12,815 -9% 1.8 1.3 1.5 15 19Guinea 4,930 6,095 11,025 24% 1.3 1.3 1.3 21 20Morocco 3,875 5,832 9,707 51% 1.1 1.2 1.1 24 21Egypt 2,818 5,716 8,534 103% 0.8 1.2 1.0 28 22Bosnia and Herzegovina 5,889 5,688 11,577 -3% 1.6 1.2 1.4 18 23China 5,440 5,500 10,940 1% 1.5 1.1 1.3 20 24Turkey 5,930 5,437 11,367 -8% 1.6 1.1 1.3 17 25Armenia 4,650 4,648 9,298 -0% 1.3 1.0 1.1 22 26Tunisia 4,503 4,378 8,881 -3% 1.2 0.9 1.0 23 27Sudan 3,128 4,283 7,411 37% 0.8 0.9 0.9 27 28Gambia 2,042 4,077 6,119 100% 0.6 0.8 0.7 35 29Senegal 2,656 3,314 5,970 25% 0.7 0.7 0.7 30 30India 3,145 3,152 6,297 0% 0.9 0.7 0.7 26 31Côte d’Ivoire 2,683 2,727 5,410 2% 0.7 0.6 0.6 29 32Ghana 2,396 2,653 5,049 11% 0.7 0.5 0.6 32 33Ethiopia 2,142 2,632 4,774 23% 0.6 0.5 0.6 33 34Azerbaijan 2,088 2,425 4,513 16% 0.6 0.5 0.5 34 35Libya 1,726 2,118 3,844 23% 0.5 0.4 0.5 37 36Cameroon 1,613 2,015 3,628 25% 0.4 0.4 0.4 39 37Palestinian 1,018 1,740 2,758 71% 0.3 0.4 0.3 40 38Mauritania 1,752 1,680 3,432 -4% 0.5 0.3 0.4 36 39Haiti 1,630 1,497 3,127 -8% 0.4 0.3 0.4 38 40Other 33,057 34,873 67,930 5% 9.0 7.2 8.0
Total 368,030 484,545 852,575 32% 100.0 100.0 100.0
Notes(1) October data for 2013 for Iceland is based on Eurostat. No data for November and December.
TABLE 4 Origin of asylum applications lodged in Europe | 2012 - 2013 (1)
Covering 38 European countries which provided monthly data to UNHCR.
26 UNHCR Asylum Trends 201326

OriginAnnualchange
Share Rank
2012 2013 Total 2012 2013 Total 2012 2013
Syrian Arab Rep. 21,988 48,926 70,914 123% 7.3 12.3 10.1 2 1Russian Federation 20,629 37,987 58,616 84% 6.9 9.5 8.4 4 2Serbia (and Kosovo: S/RES/1244 (1999)) 21,754 33,192 54,946 53% 7.2 8.3 7.9 3 3Afghanistan 26,201 23,965 50,166 -9% 8.7 6.0 7.2 1 4Pakistan 19,279 20,326 39,605 5% 6.4 5.1 5.7 5 5Somalia 13,680 18,200 31,880 33% 4.6 4.6 4.6 6 6Eritrea 6,248 14,507 20,755 132% 2.1 3.6 3.0 14 7Islamic Rep. of Iran 12,560 11,656 24,216 -7% 4.2 2.9 3.5 7 8Nigeria 7,130 11,323 18,453 59% 2.4 2.8 2.6 11 9Albania 6,883 10,599 17,482 54% 2.3 2.7 2.5 12 10Iraq 11,887 9,878 21,765 -17% 4.0 2.5 3.1 8 11Stateless 3,423 9,569 12,992 180% 1.1 2.4 1.9 23 12Georgia 10,110 8,346 18,456 -17% 3.4 2.1 2.6 9 13Bangladesh 5,354 7,758 13,112 45% 1.8 1.9 1.9 18 14Dem. Rep. of the Congo 7,744 7,613 15,357 -2% 2.6 1.9 2.2 10 15The former Yugoslav Republic of Macedonia 6,870 7,594 14,464 11% 2.3 1.9 2.1 13 16Algeria 4,640 6,807 11,447 47% 1.5 1.7 1.6 19 17Mali 2,375 6,628 9,003 179% 0.8 1.7 1.3 29 18Guinea 4,537 5,655 10,192 25% 1.5 1.4 1.5 21 19Sri Lanka 6,225 5,632 11,857 -10% 2.1 1.4 1.7 15 20Bosnia and Herzegovina 5,406 5,464 10,870 1% 1.8 1.4 1.6 16 21Egypt 2,578 5,343 7,921 107% 0.9 1.3 1.1 26 22Turkey 5,368 4,997 10,365 -7% 1.8 1.3 1.5 17 23China 4,550 4,734 9,284 4% 1.5 1.2 1.3 20 24Armenia 4,520 4,492 9,012 -1% 1.5 1.1 1.3 22 25Morocco 2,603 4,272 6,875 64% 0.9 1.1 1.0 25 26Gambia 1,452 3,549 5,001 144% 0.5 0.9 0.7 39 27Sudan 2,404 3,097 5,501 29% 0.8 0.8 0.8 28 28India 3,072 3,087 6,159 0% 1.0 0.8 0.9 24 29Senegal 2,291 2,902 5,193 27% 0.8 0.7 0.7 30 30Tunisia 2,220 2,523 4,743 14% 0.7 0.6 0.7 31 31Côte d’Ivoire 2,509 2,411 4,920 -4% 0.8 0.6 0.7 27 32Azerbaijan 2,030 2,360 4,390 16% 0.7 0.6 0.6 32 33Ghana 2,020 2,300 4,320 14% 0.7 0.6 0.6 33 34Ethiopia 1,613 2,021 3,634 25% 0.5 0.5 0.5 36 35Libya 1,414 1,867 3,281 32% 0.5 0.5 0.5 40 36Cameroon 1,506 1,744 3,250 16% 0.5 0.4 0.5 38 37Mauritania 1,658 1,572 3,230 -5% 0.6 0.4 0.5 34 38Haiti 1,622 1,496 3,118 -8% 0.5 0.4 0.4 35 39Viet Nam 1,537 1,451 2,988 -6% 0.5 0.4 0.4 37 40Other 28,742 30,391 59,133 6% 9.6 7.6 8.5
Total 300,632 398,234 698,866 32% 100.0 100.0 100.0
TABLE 5 Origin of asylum applications lodged in the European Union (28) | 2012 - 2013
Covering 28 European Union countries which provided monthly data to UNHCR.
27UNHCR Asylum Trends 2013 27

…/…
TABLE 6 Applications submitted by country of asylum and origin | 2013
Covering all 44 asylum countries which provided monthly data to UNHCR. See notes in Annex Table 1.
Top-20 ranking of countries based on applications lodged in all countries. An asterisk (*) denotes between 1 and 4 applications.
…/…
Origin Albania Australia Austria BelgiumBosnia and H. Bulgaria Canada Croatia Cyprus
Czech Rep. Denmark Estonia Finland France Germany
Syrian Arab Rep. 24 159 1,991 944 59 4,447 493 194 562 69 1,702 17 148 1,291 11,851Russian Federation - 26 2,841 791 - * 99 15 8 40 983 15 219 4,648 14,887Afghanistan - 2,840 2,589 892 6 304 386 185 6 8 425 * 172 523 7,735Iraq - 1,207 468 295 * 207 237 5 5 11 115 - 764 92 3,958Serbia (and Kosovo: S/RES/1244 (1999)) - * 1,146 747 8 - 65 9 - 16 551 * 119 5,844 14,853
Pakistan - 2,069 1,037 256 * 22 630 50 54 * 75 8 32 1,733 4,101Islamic Rep. of Iran 197 4,370 595 210 * 59 201 7 22 6 374 * 147 158 4,424Somalia - 47 433 156 * 87 291 138 43 - 964 - 196 478 3,786Eritrea - 17 59 57 - 28 230 20 * * 98 - * 405 3,616China * 1,521 237 368 - - 762 - 5 5 27 - 5 2,293 374Nigeria - 87 691 158 * 6 468 30 * 11 142 * 202 1,301 1,923Stateless - 1,630 253 * - 541 129 - - 21 418 - 24 223 541Albania - 38 69 472 - * 111 - - * 66 * 51 5,008 1,247Sri Lanka - 3,630 27 70 * - 190 - 50 * 25 - 14 2,274 596Egypt - 853 184 84 - 14 255 11 143 * 56 - 18 413 2,133Bangladesh - 710 278 154 6 5 156 10 106 - 48 - 22 3,053 669Mexico - * - 8 - - 84 - - - * - - 5 -Georgia - 21 257 229 - 5 32 - * 12 69 9 14 2,456 2,336Algeria - 8 949 95 8 433 98 136 * * 111 - 81 1,477 1,056Dem. Rep. of the Congo - 10 54 1,166 - 29 308 * 6 * 40 - 29 5,203 253
Origin Greece Hungary Iceland (1) Ireland Italy Japan (2) Latvia Liechtenstein Lithuania Luxembourg Malta Montenegro NetherlandsNew
Zealand Norway
Syrian Arab Rep. 485 960 5 37 695 24 15 * 11 24 250 285 2,673 10 841Russian Federation 13 11 5 5 38 * 5 9 29 12 - * 263 - 324Afghanistan 1,223 2,279 * 32 2,175 * - * 45 17 - 186 673 7 684Iraq 145 56 6 27 568 * * * * 27 * 8 1,094 15 166Serbia (and Kosovo: S/RES/1244 (1999)) 6 6,155 - 7 266 - - 6 - 184 * 6 316 - 303
Pakistan 1,358 3,052 - 91 3,305 241 - - * * * 989 150 18 141Islamic Rep. of Iran 188 59 * 8 417 51 * - - 22 * 6 728 22 250Somalia 122 185 * 10 2,881 * * * - 7 1,008 197 3,078 * 1,617Eritrea 157 92 5 * 2,216 * * - * 5 471 352 978 - 3,215China 174 5 - 22 34 35 - * - * * - 147 21 74Nigeria 256 441 * 129 3,545 68 * - * 53 85 122 136 * 481Stateless 28 * - - 7 * * * * - - - 216 - 532Albania 579 37 17 48 135 - - * - 70 - - 42 - 179Sri Lanka 46 9 - - 74 346 * - - - - - 142 41 14Egypt 308 102 - 14 975 6 5 - * 6 9 37 177 7 39Bangladesh 727 678 - 29 486 190 - * - - 6 13 29 6 124Mexico - - - - * - - - - - - - * - *Georgia 532 40 * 15 108 - 144 - 115 16 - - 209 - 66Algeria 144 1,105 5 51 138 - - * - 38 - 701 29 - 103Dem. Rep. of the Congo 153 102 - 72 72 15 - - - * - 12 38 - 22
28 UNHCR Asylum Trends 201328
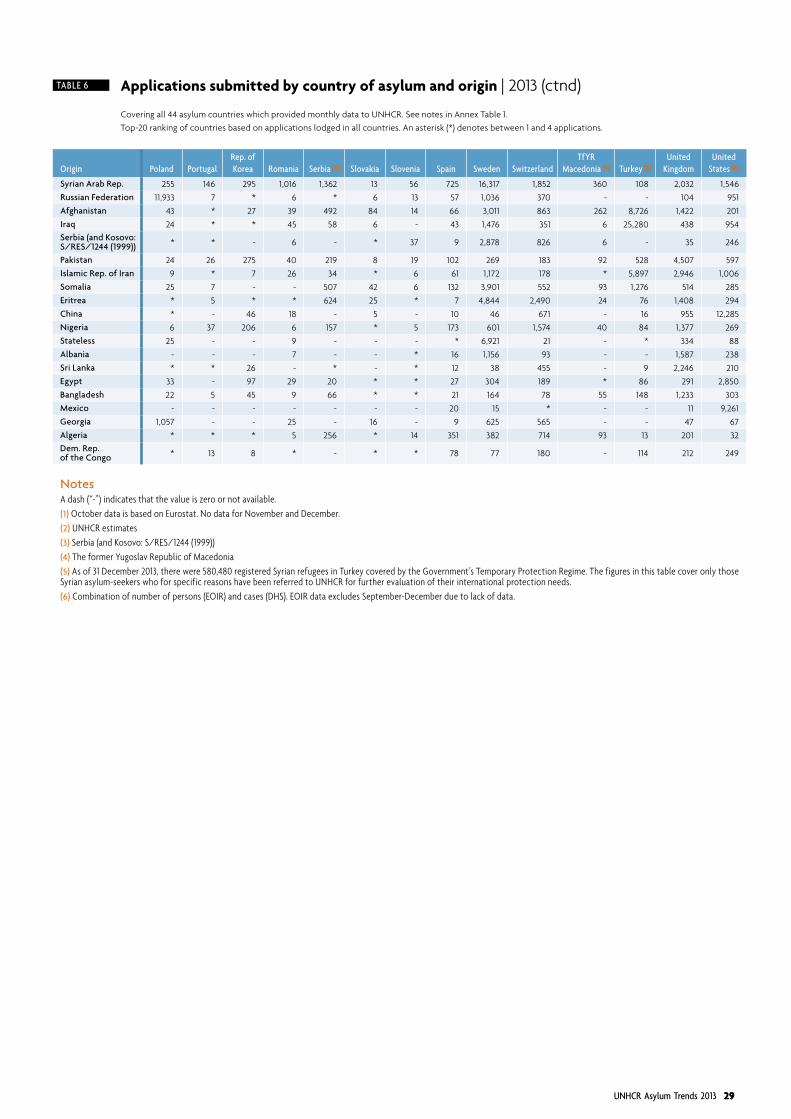
TABLE 6 Applications submitted by country of asylum and origin | 2013 (ctnd)
Covering all 44 asylum countries which provided monthly data to UNHCR. See notes in Annex Table 1.
Top-20 ranking of countries based on applications lodged in all countries. An asterisk (*) denotes between 1 and 4 applications.
Origin Poland PortugalRep. of Korea Romania Serbia (3) Slovakia Slovenia Spain Sweden Switzerland
TfYR Macedonia (4) Turkey (5)
United Kingdom
United States (6)
Syrian Arab Rep. 255 146 295 1,016 1,362 13 56 725 16,317 1,852 360 108 2,032 1,546Russian Federation 11,933 7 * 6 * 6 13 57 1,036 370 - - 104 951Afghanistan 43 * 27 39 492 84 14 66 3,011 863 262 8,726 1,422 201Iraq 24 * * 45 58 6 - 43 1,476 351 6 25,280 438 954Serbia (and Kosovo: S/RES/1244 (1999)) * * - 6 - * 37 9 2,878 826 6 - 35 246
Pakistan 24 26 275 40 219 8 19 102 269 183 92 528 4,507 597Islamic Rep. of Iran 9 * 7 26 34 * 6 61 1,172 178 * 5,897 2,946 1,006Somalia 25 7 - - 507 42 6 132 3,901 552 93 1,276 514 285Eritrea * 5 * * 624 25 * 7 4,844 2,490 24 76 1,408 294China * - 46 18 - 5 - 10 46 671 - 16 955 12,285Nigeria 6 37 206 6 157 * 5 173 601 1,574 40 84 1,377 269Stateless 25 - - 9 - - - * 6,921 21 - * 334 88Albania - - - 7 - - * 16 1,156 93 - - 1,587 238Sri Lanka * * 26 - * - * 12 38 455 - 9 2,246 210Egypt 33 - 97 29 20 * * 27 304 189 * 86 291 2,850Bangladesh 22 5 45 9 66 * * 21 164 78 55 148 1,233 303Mexico - - - - - - - 20 15 * - - 11 9,261Georgia 1,057 - - 25 - 16 - 9 625 565 - - 47 67Algeria * * * 5 256 * 14 351 382 714 93 13 201 32Dem. Rep. of the Congo * 13 8 * - * * 78 77 180 - 114 212 249
NotesA dash (“-”) indicates that the value is zero or not available.(1) October data is based on Eurostat. No data for November and December.(2) UNHCR estimates(3) Serbia (and Kosovo: S/RES/1244 (1999))(4) The former Yugoslav Republic of Macedonia(5) As of 31 December 2013, there were 580,480 registered Syrian refugees in Turkey covered by the Government’s Temporary Protection Regime. The figures in this table cover only those Syrian asylum-seekers who for specific reasons have been referred to UNHCR for further evaluation of their international protection needs.(6) Combination of number of persons (EOIR) and cases (DHS). EOIR data excludes September-December due to lack of data.
29UNHCR Asylum Trends 2013 29

Country of asylum
2012 2013 Quarterly change 2013
Q1 Q2 Q3 Q4 Q1 Q2 Q3 Q4 Q2-Q1 Q3-Q2 Q4-Q3
Albania - 5 5 6 12 71 122 21 492% 72% -83%
Australia 3,346 4,552 4,418 3,680 9,529 8,800 3,478 2,517 -8% -60% -28%
Austria 3,527 3,813 5,184 4,891 3,591 4,649 4,499 4,764 29% -3% 6%
Belgium 5,092 4,299 4,689 4,444 3,338 2,940 3,303 2,922 -12% 12% -12%
Bosnia and Herzegovina 5 - 13 35 12 44 15 29 267% -66% 93%
Bulgaria 166 155 267 641 868 936 2,066 3,109 8% 121% 50%
Canada 5,527 5,091 4,560 5,323 2,143 2,337 2,853 3,049 9% 22% 7%
Croatia 122 291 360 421 483 238 175 193 -51% -26% 10%
Cyprus 373 403 470 384 317 238 292 399 -25% 23% 37%
Czech Republic 138 127 110 142 129 116 138 120 -10% 19% -13%
Denmark 1,173 1,492 1,586 1,890 1,951 1,623 2,033 1,933 -17% 25% -5%
Estonia 16 42 10 9 24 30 20 23 25% -33% 15%
Finland 578 613 888 843 686 656 905 775 -4% 38% -14%
France 13,715 12,235 13,613 15,692 15,066 15,112 14,575 15,342 0% -4% 5%
Germany 12,300 11,000 17,163 24,076 19,315 23,996 31,365 34,904 24% 31% 11%Greece 1,948 2,411 2,084 3,134 2,069 1,874 2,060 2,222 -9% 10% 8%
Hungary 457 363 537 799 2,269 9,338 4,312 2,654 312% -54% -38%
Iceland (1) 13 23 47 32 73 32 32 15 -56% 0% -53%
Ireland 239 210 242 248 227 242 215 258 7% -11% 20%
Italy 3,748 3,605 4,530 5,469 4,908 5,996 7,876 9,052 22% 31% 15%
Japan (2) 514 567 648 814 848 776 738 890 -8% -5% 21%
Latvia 64 61 36 28 24 35 91 35 46% 160% -62%
Liechtenstein 14 12 24 24 17 33 30 13 94% -9% -57%
Lithuania 86 151 153 139 59 50 84 84 -15% 68% 0%
Luxembourg 559 640 497 356 213 239 279 257 12% 17% -8%
Malta 123 809 693 431 104 343 1,459 294 230% 325% -80%
Montenegro 98 356 499 578 355 712 1,644 843 101% 131% -49%
Netherlands 2,656 1,914 2,217 2,877 3,237 2,984 3,766 4,412 -8% 26% 17%
New Zealand 85 78 82 79 77 68 74 73 -12% 9% -1%Norway 2,086 2,176 2,776 2,747 2,392 2,381 4,111 2,584 -0% 73% -37%
Poland 1,429 1,696 2,935 3,122 2,598 7,068 3,077 1,240 172% -56% -60%
Portugal 68 84 95 48 71 131 123 181 85% -6% 47%
Republic of Korea 419 248 242 234 224 287 412 651 28% 44% 58%
Romania 682 775 740 313 340 371 462 326 9% 25% -29%
Serbia (and Kosovo: S/RES/1244 (1999)) 392 604 841 931 749 1,155 1,352 1,872 54% 17% 38%
- of which Kosovo 14 8 9 14 18 23 21 - 28% -9% -100%
Slovakia 40 129 220 159 41 92 62 86 124% -33% 39%
Slovenia 42 48 67 107 94 73 43 32 -22% -41% -26%
Spain 643 652 600 684 1,171 1,305 1,086 939 11% -17% -14%
Sweden 7,553 8,785 13,380 14,169 9,736 9,123 16,626 18,774 -6% 82% 13%
Switzerland 6,157 6,608 7,312 5,871 5,247 4,806 4,400 4,987 -8% -8% 13%
The former Yugoslav Republic of Macedonia 52 249 152 185 112 411 594 226 267% 45% -62%
Turkey (3) 3,152 4,724 8,234 10,360 7,472 9,954 12,732 14,649 33% 28% 15%
United Kingdom 6,192 6,224 7,248 7,746 6,976 7,189 7,561 7,459 3% 5% -1%
United States (4) 17,497 19,076 17,183 17,011 20,444 23,210 22,180 22,523 14% -4% 2%
EU-Total (28) 63,729 63,027 80,614 93,262 79,905 96,987 108,553 112,789 21% 12% 4%
Nordic countries (5) 11,403 13,089 18,677 19,681 14,838 13,815 23,707 24,081 -7% 72% 2%
Southern Europe (8) 6,903 7,969 8,477 10,156 8,652 9,958 13,018 13,108 15% 31% 1%Total Europe (38) 75,698 77,784 100,517 114,031 96,346 116,586 133,585 138,028 21% 15% 3%
Canada/USA 23,024 24,167 21,743 22,334 22,587 25,547 25,033 25,572 13% -2% 2%
Australia/New Zealand 3,431 4,630 4,500 3,759 9,606 8,868 3,552 2,590 -8% -60% -27%
Japan/Rep. of Korea 933 815 890 1,048 1,072 1,063 1,150 1,541 -1% 8% 34%
Total non-Europe (6) 27,388 29,612 27,133 27,141 33,265 35,478 29,735 29,703 7% -16% -0%
Total (44) 103,086 107,396 127,650 141,172 129,611 152,064 163,320 167,731 17% 7% 3%
NotesSee also notes in Annex Table 1.A dash (“-”) indicates that the value is zero or not available.(1) Iceland: 2013 excludes data for November and December. October data is based on Eurostat.(2) Japan: UNHCR estimate.(3) Turkey: UNHCR is the source of the data. The 2012 figure has been revised to include all asylum-seekers, both those pre-registered and those registered on a monthly basis. The 2013 figure includes asylum-seekers registered with UNHCR as well as asylum-seekers who have been pre-registered but who are pending official registration with UNHCR. As of 31 December 2013, there were 585,480 registered Syrian refugees in Turkey covered by the Government’s Temporary Protection Regime. The number of Syrian asylum-seekers included in the annex tables covers only those who for specific reasons have been referred to UNHCR for further evaluation of their international protection needs.(4) United States: Data for the Executive Office for Immigration Review (EOIR) is available up to August 2013. The total number of applications lodged between September and December 2013 has been estimated by UNHCR using a statistical model (seasonal ARIMA). No information is available on the country of origin during this period, however.
TABLE 7 Quarterly asylum applications lodged in 44 industrialized countries | 2012 - 2013
Covering 44 countries which provided monthly data to UNHCR.
30 UNHCR Asylum Trends 201330

Origin
No. of applications Change (%) Share (%)
Q1 Q2 Q3 Q4 Total Q2-Q1 Q3-Q2 Q4-Q3 Q1 Q2 Q3 Q4
Syrian Arab Rep. 9,473 9,497 15,685 21,696 56,351 0% 65% 38% 7.5 6.4 9.8 13.3Russian Federation 8,126 16,551 9,819 5,283 39,779 104% -41% -46% 6.5 11.2 6.2 3.2Afghanistan 9,758 9,687 9,367 9,841 38,653 -1% -3% 5% 7.8 6.6 5.9 6.0Iraq 6,911 7,568 10,535 13,157 38,171 10% 39% 25% 5.5 5.1 6.6 8.0Serbia (and Kosovo: S/RES/1244 (1999)) 5,522 10,311 9,540 9,287 34,660 87% -7% -3% 4.4 7.0 6.0 5.7
Pakistan 5,589 7,516 7,381 5,824 26,310 34% -2% -21% 4.4 5.1 4.6 3.6Islamic Rep. of Iran 6,524 7,054 5,278 5,023 23,879 8% -25% -5% 5.2 4.8 3.3 3.1Somalia 4,485 5,583 6,966 6,037 23,071 24% 25% -13% 3.6 3.8 4.4 3.7Eritrea 2,976 2,830 7,896 8,135 21,837 -5% 179% 3% 2.4 1.9 5.0 5.0China 4,686 5,376 5,240 4,868 20,170 15% -3% -7% 3.7 3.6 3.3 3.0Nigeria 3,322 3,413 3,995 4,154 14,884 3% 17% 4% 2.6 2.3 2.5 2.5Stateless 1,902 1,880 4,175 4,016 11,973 -1% 122% -4% 1.5 1.3 2.6 2.5Albania 2,276 2,642 2,640 3,720 11,278 16% -0% 41% 1.8 1.8 1.7 2.3Sri Lanka 3,429 3,568 1,796 1,762 10,555 4% -50% -2% 2.7 2.4 1.1 1.1Egypt 1,795 1,992 3,090 2,907 9,784 11% 55% -6% 1.4 1.3 1.9 1.8Bangladesh 1,707 2,978 2,725 2,249 9,659 74% -8% -17% 1.4 2.0 1.7 1.4Mexico 2,830 2,964 2,171 1,446 9,411 5% -27% -33% 2.2 2.0 1.4 0.9Georgia 2,341 2,045 2,334 2,380 9,100 -13% 14% 2% 1.9 1.4 1.5 1.5Algeria 2,126 2,744 2,228 1,744 8,842 29% -19% -22% 1.7 1.9 1.4 1.1Dem. Rep. of the Congo 2,078 2,072 2,062 2,319 8,531 -0% -0% 12% 1.7 1.4 1.3 1.4The former Yugoslav Republic of Macedonia 898 1,339 2,615 2,879 7,731 49% 95% 10% 0.7 0.9 1.6 1.8
Mali 2,174 2,041 1,932 1,450 7,597 -6% -5% -25% 1.7 1.4 1.2 0.9Turkey 1,956 1,624 1,361 1,514 6,455 -17% -16% 11% 1.6 1.1 0.9 0.9Guinea 1,519 1,483 1,673 1,671 6,346 -2% 13% -0% 1.2 1.0 1.1 1.0Morocco 1,333 1,711 1,533 1,313 5,890 28% -10% -14% 1.1 1.2 1.0 0.8India 1,370 1,562 1,617 1,323 5,872 14% 4% -18% 1.1 1.1 1.0 0.8Bosnia and Herzegovina 909 835 1,739 2,247 5,730 -8% 108% 29% 0.7 0.6 1.1 1.4El Salvador 1,352 1,756 1,363 460 4,931 30% -22% -66% 1.1 1.2 0.9 0.3Armenia 1,319 1,189 1,039 1,313 4,860 -10% -13% 26% 1.0 0.8 0.7 0.8Sudan 984 1,050 1,150 1,400 4,584 7% 10% 22% 0.8 0.7 0.7 0.9Tunisia 1,310 1,263 907 990 4,470 -4% -28% 9% 1.0 0.9 0.6 0.6Guatemala 1,201 1,398 1,145 677 4,421 16% -18% -41% 1.0 0.9 0.7 0.4Ethiopia 889 959 1,355 1,181 4,384 8% 41% -13% 0.7 0.6 0.9 0.7Gambia 815 944 1,148 1,436 4,343 16% 22% 25% 0.6 0.6 0.7 0.9Haiti 939 987 820 828 3,574 5% -17% 1% 0.7 0.7 0.5 0.5Senegal 643 644 936 1,223 3,446 0% 45% 31% 0.5 0.4 0.6 0.7Ghana 612 745 806 815 2,978 22% 8% 1% 0.5 0.5 0.5 0.5Côte d’Ivoire 766 800 749 636 2,951 4% -6% -15% 0.6 0.5 0.5 0.4Honduras 755 987 823 280 2,845 31% -17% -66% 0.6 0.7 0.5 0.2Cameroon 678 732 686 693 2,789 8% -6% 1% 0.5 0.5 0.4 0.4Other 15,588 15,557 18,933 23,400 73,478 -0% 22% 24% 12.4 10.5 11.9 14.3
Total 125,866 147,877 159,253 163,577 596,573 17% 8% 3% 100.0 100.0 100.0 100.0
Notes(1) Iceland: Excludes data for November and December. October data is based on Eurostat. United States: Data for the Executive Office for Immigration Review (EOIR) is available up to August 2013. The total number of applications lodged between September and December 2013 has been estimated by UNHCR using a statistical model (seasonal ARIMA). No information is available on the country of origin during this period, however.
TABLE 8 Origin of asylum applicants in 44 industrialized countries by quarter | 2013 (1)
Covering all 44 countries which provided monthly data to UNHCR. See notes in Annex Table 1.
31UNHCR Asylum Trends 2013 31

Origin
No. of applications Change (%) Share (%)
Q1 Q2 Q3 Q4 Total Q2-Q1 Q3-Q2 Q4-Q3 Q1 Q2 Q3 Q4
Syrian Arab Rep. 8,883 8,847 15,090 21,004 53,824 -0% 71% 39% 9.2 7.6 11.3 15.2Russian Federation 7,870 16,235 9,571 5,023 38,699 106% -41% -48% 8.2 13.9 7.2 3.6Iraq 6,076 6,822 10,110 12,747 35,755 12% 48% 26% 6.3 5.9 7.6 9.2Afghanistan 7,962 8,471 9,116 9,640 35,189 6% 8% 6% 8.3 7.3 6.8 7.0Serbia (and Kosovo: S/RES/1244 (1999)) 5,435 10,220 9,483 9,209 34,347 88% -7% -3% 5.6 8.8 7.1 6.7Pakistan 4,435 6,355 6,634 5,056 22,480 43% 4% -24% 4.6 5.5 5.0 3.7Somalia 4,330 5,391 6,784 5,941 22,446 25% 26% -12% 4.5 4.6 5.1 4.3Eritrea 2,859 2,674 7,745 8,015 21,293 -6% 190% 3% 3.0 2.3 5.8 5.8Islamic Rep. of Iran 4,151 4,911 4,525 4,635 18,222 18% -8% 2% 4.3 4.2 3.4 3.4Nigeria 3,108 3,161 3,701 3,814 13,784 2% 17% 3% 3.2 2.7 2.8 2.8Albania 2,167 2,524 2,541 3,659 10,891 16% 1% 44% 2.2 2.2 1.9 2.7Stateless 1,085 1,190 3,923 3,927 10,125 10% 230% 0% 1.1 1.0 2.9 2.8Georgia 2,314 2,010 2,313 2,343 8,980 -13% 15% 1% 2.4 1.7 1.7 1.7Algeria 2,091 2,718 2,182 1,711 8,702 30% -20% -22% 2.2 2.3 1.6 1.2Bangladesh 1,425 2,458 2,383 1,983 8,249 72% -3% -17% 1.5 2.1 1.8 1.4Dem. Rep. of the Congo 1,935 1,906 1,899 2,201 7,941 -1% -0% 16% 2.0 1.6 1.4 1.6The former Yugoslav Republic of Macedonia 886 1,338 2,609 2,874 7,707 51% 95% 10% 0.9 1.1 2.0 2.1Mali 2,077 1,959 1,863 1,420 7,319 -6% -5% -24% 2.2 1.7 1.4 1.0Sri Lanka 1,584 1,588 1,475 1,465 6,112 0% -7% -1% 1.6 1.4 1.1 1.1Guinea 1,449 1,434 1,610 1,602 6,095 -1% 12% -0% 1.5 1.2 1.2 1.2Morocco 1,317 1,694 1,526 1,295 5,832 29% -10% -15% 1.4 1.5 1.1 0.9Egypt 708 985 2,040 1,983 5,716 39% 107% -3% 0.7 0.8 1.5 1.4Bosnia and Herzegovina 892 827 1,725 2,244 5,688 -7% 109% 30% 0.9 0.7 1.3 1.6China 1,286 1,377 1,519 1,318 5,500 7% 10% -13% 1.3 1.2 1.1 1.0Turkey 1,670 1,402 1,141 1,224 5,437 -16% -19% 7% 1.7 1.2 0.9 0.9Armenia 1,263 1,135 988 1,262 4,648 -10% -13% 28% 1.3 1.0 0.7 0.9Tunisia 1,292 1,243 888 955 4,378 -4% -29% 8% 1.3 1.1 0.7 0.7Sudan 908 971 1,078 1,326 4,283 7% 11% 23% 0.9 0.8 0.8 1.0Gambia 743 860 1,091 1,383 4,077 16% 27% 27% 0.8 0.7 0.8 1.0Senegal 600 615 913 1,186 3,314 3% 48% 30% 0.6 0.5 0.7 0.9India 707 841 867 737 3,152 19% 3% -15% 0.7 0.7 0.6 0.5Côte d’Ivoire 705 741 692 589 2,727 5% -7% -15% 0.7 0.6 0.5 0.4Ghana 524 666 724 739 2,653 27% 9% 2% 0.5 0.6 0.5 0.5Ethiopia 532 546 804 750 2,632 3% 47% -7% 0.6 0.5 0.6 0.5Azerbaijan 582 470 610 763 2,425 -19% 30% 25% 0.6 0.4 0.5 0.6Libya 512 427 498 681 2,118 -17% 17% 37% 0.5 0.4 0.4 0.5Cameroon 483 471 506 555 2,015 -2% 7% 10% 0.5 0.4 0.4 0.4Palestinian 393 421 515 411 1,740 7% 22% -20% 0.4 0.4 0.4 0.3Mauritania 409 479 406 386 1,680 17% -15% -5% 0.4 0.4 0.3 0.3Haiti 382 426 307 382 1,497 12% -28% 24% 0.4 0.4 0.2 0.3Other 8,316 7,777 9,190 9,590 34,873 -6% 18% 4% 8.6 6.7 6.9 6.9
Total 96,346 116,586 133,585 138,028 484,545 21% 15% 3% 100.0 100.0 100.0 100.0
Notes(1) Iceland: Excludes data for November and December. October data is based on Eurostat.
TABLE 9 Origin of asylum applicants in Europe by quarter | 2013 (1)
Covering 38 European countries which provided monthly data to UNHCR.
32 UNHCR Asylum Trends 201332

Origin
No. of applications Change (%) Share (%)
Q1 Q2 Q3 Q4 Total Q2-Q1 Q3-Q2 Q4-Q3 Q1 Q2 Q3 Q4
Syrian Arab Rep. 8,310 8,089 13,714 18,813 48,926 -3% 70% 37% 10.4 8.3 12.6 16.7Russian Federation 7,679 16,075 9,354 4,879 37,987 109% -42% -48% 9.6 16.6 8.6 4.3Serbia (and Kosovo: S/RES/1244 (1999)) 5,181 9,918 9,095 8,998 33,192 91% -8% -1% 6.5 10.2 8.4 8.0Afghanistan 5,442 5,562 5,782 7,179 23,965 2% 4% 24% 6.8 5.7 5.3 6.4Pakistan 4,230 5,838 5,676 4,582 20,326 38% -3% -19% 5.3 6.0 5.2 4.1Somalia 3,424 4,279 5,535 4,962 18,200 25% 29% -10% 4.3 4.4 5.1 4.4Eritrea 1,846 1,522 5,138 6,001 14,507 -18% 238% 17% 2.3 1.6 4.7 5.3Islamic Rep. of Iran 2,985 2,962 2,779 2,930 11,656 -1% -6% 5% 3.7 3.1 2.6 2.6Nigeria 2,268 2,488 3,169 3,398 11,323 10% 27% 7% 2.8 2.6 2.9 3.0Albania 2,097 2,460 2,477 3,565 10,599 17% 1% 44% 2.6 2.5 2.3 3.2Iraq 2,509 2,068 2,646 2,655 9,878 -18% 28% 0% 3.1 2.1 2.4 2.4Stateless 991 1,110 3,696 3,772 9,569 12% 233% 2% 1.2 1.1 3.4 3.3Georgia 2,119 1,871 2,162 2,194 8,346 -12% 16% 1% 2.7 1.9 2.0 1.9Bangladesh 1,367 2,266 2,251 1,874 7,758 66% -1% -17% 1.7 2.3 2.1 1.7Dem. Rep. of the Congo 1,846 1,825 1,824 2,118 7,613 -1% -0% 16% 2.3 1.9 1.7 1.9The former Yugoslav Republic of Macedonia 856 1,322 2,573 2,843 7,594 54% 95% 10% 1.1 1.4 2.4 2.5Algeria 1,641 2,083 1,669 1,414 6,807 27% -20% -15% 2.1 2.1 1.5 1.3Mali 1,848 1,748 1,722 1,310 6,628 -5% -1% -24% 2.3 1.8 1.6 1.2Guinea 1,340 1,326 1,487 1,502 5,655 -1% 12% 1% 1.7 1.4 1.4 1.3Sri Lanka 1,493 1,489 1,373 1,277 5,632 -0% -8% -7% 1.9 1.5 1.3 1.1Bosnia and Herzegovina 816 784 1,683 2,181 5,464 -4% 115% 30% 1.0 0.8 1.6 1.9Egypt 645 879 1,922 1,897 5,343 36% 119% -1% 0.8 0.9 1.8 1.7Turkey 1,519 1,286 1,057 1,135 4,997 -15% -18% 7% 1.9 1.3 1.0 1.0China 1,087 1,202 1,273 1,172 4,734 11% 6% -8% 1.4 1.2 1.2 1.0Armenia 1,216 1,089 953 1,234 4,492 -10% -12% 29% 1.5 1.1 0.9 1.1Morocco 940 1,212 1,130 990 4,272 29% -7% -12% 1.2 1.2 1.0 0.9Gambia 538 717 992 1,302 3,549 33% 38% 31% 0.7 0.7 0.9 1.2Sudan 665 709 741 982 3,097 7% 5% 33% 0.8 0.7 0.7 0.9India 694 824 851 718 3,087 19% 3% -16% 0.9 0.8 0.8 0.6Senegal 431 516 847 1,108 2,902 20% 64% 31% 0.5 0.5 0.8 1.0Tunisia 605 669 572 677 2,523 11% -14% 18% 0.8 0.7 0.5 0.6Côte d’Ivoire 636 658 593 524 2,411 3% -10% -12% 0.8 0.7 0.5 0.5Azerbaijan 571 442 592 755 2,360 -23% 34% 28% 0.7 0.5 0.5 0.7Ghana 435 590 627 648 2,300 36% 6% 3% 0.5 0.6 0.6 0.6Ethiopia 391 406 609 615 2,021 4% 50% 1% 0.5 0.4 0.6 0.5Libya 447 365 433 622 1,867 -18% 19% 44% 0.6 0.4 0.4 0.6Cameroon 427 424 439 454 1,744 -1% 4% 3% 0.5 0.4 0.4 0.4Mauritania 378 442 385 367 1,572 17% -13% -5% 0.5 0.5 0.4 0.3Haiti 382 426 306 382 1,496 12% -28% 25% 0.5 0.4 0.3 0.3Viet Nam 392 386 382 291 1,451 -2% -1% -24% 0.5 0.4 0.4 0.3Other 7,218 6,660 8,044 8,469 30,391 -8% 21% 5% 9.0 6.9 7.4 7.5
Total 79,905 96,987 108,553 112,789 398,234 21% 12% 4% 100.0 100.0 100.0 100.0
TABLE 10 Origin of asylum applicants in the European Union (28) by quarter | 2013
Covering 28 European Union countries which provided monthly data to UNHCR.
33UNHCR Asylum Trends 2013 33

Origin
No. of applications Change (%) Share (%)
Q1 Q2 Q3 Q4 Total Q2-Q1 Q3-Q2 Q4-Q3 Q1 Q2 Q3 Q4
China 3,129 3,674 3,261 2,983 13,047 17% -11% -9% 16.6 17.2 15.6 13.9Mexico 2,811 2,951 2,150 1,433 9,345 5% -27% -33% 14.9 13.8 10.3 6.7
Various/unknown (1) 14 11 2,249 6,718 8,992 -21% .. 199% 0.1 0.1 10.7 31.4
El Salvador 1,304 1,717 1,306 422 4,749 32% -24% -68% 6.9 8.0 6.2 2.0Guatemala 1,185 1,393 1,136 668 4,382 18% -18% -41% 6.3 6.5 5.4 3.1Egypt 813 763 843 686 3,105 -6% 10% -19% 4.3 3.6 4.0 3.2Honduras 746 971 808 258 2,783 30% -17% -68% 4.0 4.5 3.9 1.2Haiti 557 561 513 446 2,077 1% -9% -13% 3.0 2.6 2.4 2.1Syrian Arab Rep. 463 538 472 566 2,039 16% -12% 20% 2.5 2.5 2.3 2.6Ecuador 433 520 388 388 1,729 20% -25% 0% 2.3 2.4 1.9 1.8Ethiopia 341 376 473 395 1,585 10% 26% -16% 1.8 1.8 2.3 1.8Nepal 396 382 405 283 1,466 -4% 6% -30% 2.1 1.8 1.9 1.3India 363 391 383 256 1,393 8% -2% -33% 1.9 1.8 1.8 1.2Pakistan 256 300 302 369 1,227 17% 1% 22% 1.4 1.4 1.4 1.7Islamic Rep. of Iran 277 298 375 257 1,207 8% 26% -31% 1.5 1.4 1.8 1.2Colombia 266 280 337 313 1,196 5% 20% -7% 1.4 1.3 1.6 1.5Iraq 222 282 352 335 1,191 27% 25% -5% 1.2 1.3 1.7 1.6Russian Federation 254 306 239 251 1,050 20% -22% 5% 1.3 1.4 1.1 1.2Venezuela (Bolivarian Republic of) 178 233 241 260 912 31% 3% 8% 0.9 1.1 1.1 1.2Nigeria 154 181 213 189 737 18% 18% -11% 0.8 0.8 1.0 0.9Cameroon 168 169 141 114 592 1% -17% -19% 0.9 0.8 0.7 0.5Afghanistan 136 120 170 161 587 -12% 42% -5% 0.7 0.6 0.8 0.8Somalia 141 168 174 93 576 19% 4% -47% 0.7 0.8 0.8 0.4Dem. Rep. of the Congo 131 150 160 116 557 15% 7% -28% 0.7 0.7 0.8 0.5Eritrea 114 150 145 115 524 32% -3% -21% 0.6 0.7 0.7 0.5Ukraine 110 163 97 102 472 48% -40% 5% 0.6 0.8 0.5 0.5Bangladesh 66 130 128 135 459 97% -2% 5% 0.4 0.6 0.6 0.6Kyrgyzstan 87 153 84 94 418 76% -45% 12% 0.5 0.7 0.4 0.4Rep. of Moldova 92 209 66 42 409 127% -68% -36% 0.5 1.0 0.3 0.2Sri Lanka 110 116 93 81 400 5% -20% -13% 0.6 0.5 0.4 0.4Romania 138 181 59 13 391 31% -67% -78% 0.7 0.8 0.3 0.1Kenya 91 99 98 93 381 9% -1% -5% 0.5 0.5 0.5 0.4Burundi 72 93 141 62 368 29% 52% -56% 0.4 0.4 0.7 0.3Cuba 95 94 107 72 368 -1% 14% -33% 0.5 0.4 0.5 0.3Jamaica 84 101 99 77 361 20% -2% -22% 0.4 0.5 0.5 0.4Albania 98 112 82 57 349 14% -27% -30% 0.5 0.5 0.4 0.3Uzbekistan 77 93 73 92 335 21% -22% 26% 0.4 0.4 0.3 0.4Burkina Faso 72 90 80 77 319 25% -11% -4% 0.4 0.4 0.4 0.4Brazil 92 77 74 70 313 -16% -4% -5% 0.5 0.4 0.4 0.3Congo 85 71 83 72 311 -16% 17% -13% 0.5 0.3 0.4 0.3Other 5,750 6,367 5,627 5,187 22,931 11% -12% -8% 30.5 29.8 26.8 24.2
Total 18,842 21,360 20,966 21,418 82,586 13% -2% 2% 100.0 100.0 100.0 100.0
Notes(1) United States: Data for the Executive Office for Immigration Review (EOIR) is available up to August 2013. The total number of applications lodged between September and December 2013 has been estimated by UNHCR using a statistical model (seasonal ARIMA). No information is available on the country of origin during this period, however.
TABLE 11 Origin of asylum applicants in Canada and the United States of America | 2013 (1)
34 UNHCR Asylum Trends 201334

Origin
No. of applications Change (%) Share (%)
Q1 Q2 Q3 Q4 Total Q2-Q1 Q3-Q2 Q4-Q3 Q1 Q2 Q3 Q4
Islamic Rep. of Iran 2,076 1,832 364 120 4,392 -12% -80% -67% 21.6 20.7 10.2 4.6Sri Lanka 1,668 1,774 129 100 3,671 6% -93% -22% 17.4 20.0 3.6 3.9Afghanistan 1,656 1,093 74 24 2,847 -34% -93% -68% 17.2 12.3 2.1 0.9Pakistan 791 749 316 231 2,087 -5% -58% -27% 8.2 8.4 8.9 8.9Stateless 783 640 180 27 1,630 -18% -72% -85% 8.2 7.2 5.1 1.0China 262 316 422 542 1,542 21% 34% 28% 2.7 3.6 11.9 20.9Iraq 613 464 71 74 1,222 -24% -85% 4% 6.4 5.2 2.0 2.9India 249 285 330 298 1,162 14% 16% -10% 2.6 3.2 9.3 11.5Egypt 273 242 200 145 860 -11% -17% -28% 2.8 2.7 5.6 5.6Bangladesh 176 315 167 58 716 79% -47% -65% 1.8 3.6 4.7 2.2Fiji 71 63 203 106 443 -11% 222% -48% 0.7 0.7 5.7 4.1Lebanon 95 103 88 78 364 8% -15% -11% 1.0 1.2 2.5 3.0Libya 83 48 135 52 318 -42% 181% -61% 0.9 0.5 3.8 2.0Nepal 41 68 98 88 295 66% 44% -10% 0.4 0.8 2.8 3.4Myanmar 131 72 16 18 237 -45% -78% 13% 1.4 0.8 0.5 0.7Viet Nam 37 107 55 31 230 189% -49% -44% 0.4 1.2 1.5 1.2Indonesia 60 55 48 49 212 -8% -13% 2% 0.6 0.6 1.4 1.9Malaysia 45 43 65 54 207 -4% 51% -17% 0.5 0.5 1.8 2.1Syrian Arab Rep. 43 42 52 32 169 -2% 24% -38% 0.4 0.5 1.5 1.2Palestinian 43 93 11 14 161 116% -88% 27% 0.4 1.0 0.3 0.5Other 410 464 528 449 1,851 13% 14% -15% 4.3 5.2 14.9 17.3
Total 9,606 8,868 3,552 2,590 24,616 -8% -60% -27% 100.0 100.0 100.0 100.0
Notes(1) Figures for Australia are based on the number of applications lodged for protection visas. They do not include asylum-seekers who arrived in Australia by boat in 2012 or 2013 and have not been able to lodge protection visa applications or who have been transferred to third countries for refugee status determination.
TABLE 12 Origin of asylum applicants in Australia and New Zealand | 2013 (1)
35UNHCR Asylum Trends 2013 35

Origin
No. of applications Change (%) Share (%)
Q1 Q2 Q3 Q4 Total Q2-Q1 Q3-Q2 Q4-Q3 Q1 Q2 Q3 Q4
Turkey 203 132 137 186 658 -35% 4% 36% 18.9 12.4 11.9 12.1Nepal 127 130 171 206 634 2% 32% 20% 11.8 12.2 14.9 13.4Pakistan 107 112 129 168 516 5% 15% 30% 10.0 10.5 11.2 10.9Myanmar 151 89 64 87 391 -41% -28% 36% 14.1 8.4 5.6 5.6Sri Lanka 67 90 99 116 372 34% 10% 17% 6.3 8.5 8.6 7.5Syrian Arab Rep. 84 70 71 94 319 -17% 1% 32% 7.8 6.6 6.2 6.1Nigeria 34 54 56 130 274 59% 4% 132% 3.2 5.1 4.9 8.4Bangladesh 40 75 47 73 235 88% -37% 55% 3.7 7.1 4.1 4.7Cameroon 26 91 35 24 176 250% -62% -31% 2.4 8.6 3.0 1.6India 51 45 37 32 165 -12% -18% -14% 4.8 4.2 3.2 2.1Ghana 41 14 36 42 133 -66% 157% 17% 3.8 1.3 3.1 2.7Egypt * * 7 93 103 100% 250% 1229% 0.1 0.2 0.6 6.0Ethiopia * 19 48 18 88 533% 153% -63% 0.3 1.8 4.2 1.2China 9 9 38 25 81 0% 322% -34% 0.8 0.8 3.3 1.6South Africa 9 16 20 32 77 78% 25% 60% 0.8 1.5 1.7 2.1Philippines 19 8 17 15 59 -58% 113% -12% 1.8 0.8 1.5 1.0Uganda 9 14 21 15 59 56% 50% -29% 0.8 1.3 1.8 1.0Islamic Rep. of Iran 20 13 14 11 58 -35% 8% -21% 1.9 1.2 1.2 0.7Liberia 7 10 6 26 49 43% -40% 333% 0.7 0.9 0.5 1.7Yemen * * 12 17 34 300% 200% 42% 0.1 0.4 1.0 1.1Other 63 66 85 131 345 5% 29% 54% 5.9 6.2 7.4 8.5
Total 1,072 1,063 1,150 1,541 4,826 -1% 8% 34% 100.0 100.0 100.0 100.0
TABLE 13 Origin of asylum applicants in Japan and the Republic of Korea | 2013
An asterisk (*) denotes between 1 and 4 applications.
36 UNHCR Asylum Trends 201336

TABLE 14 Asylum applications lodged in 44 industrialized countries by origin, fourth quarter | 2013
Covering all 44 asylum countries which provided monthly data to UNHCR. See notes in Annex Table 1.
Top-20 ranking of countries based on applications lodged in all countries. An asterisk (*) denotes between 1 and 4 applications.
…/…
…/…
Origin Albania Australia Austria BelgiumBosnia and H. Bulgaria Canada Croatia Cyprus
Czech Rep. Denmark Estonia Finland France Germany
Syrian Arab Rep. 8 25 982 266 12 2,439 169 44 186 22 609 10 54 435 4,097Iraq - 69 162 79 * 46 74 * * * 22 - 216 21 979Afghanistan - 22 749 153 * 230 116 * * 5 103 - 42 140 2,140Serbia (and Kosovo: S/RES/1244 (1999)) - * 283 124 * - 22 * - - 50 - 27 1,169 6,046
Eritrea - * 31 10 - 7 65 * * * 29 - - 117 2,282Somalia - * 132 37 - 30 66 * 29 - 167 - 47 139 1,538Pakistan - 226 140 31 * * 236 16 38 - 16 * 14 429 1,058Russian Federation - 6 682 175 - - 35 * * 16 282 * 39 1,083 1,365Islamic Rep. of Iran 13 120 144 55 * 18 42 - * * 73 * 45 44 1,125China - 536 63 74 - - 268 - * * * - * 563 110Nigeria - 21 134 31 - - 142 17 - - 34 * 48 331 554Stateless - 27 98 - - 229 42 - - 7 127 - * 43 269Albania - * 24 148 - - 20 - - - 11 - 11 1,555 697Egypt - 141 30 28 - * 74 * 30 * 8 - 11 108 973The former Yugoslav Republic of Macedonia
- - 62 33 - - - - - * * - * 61 2,516
Georgia - 6 73 57 - - 15 - - * 16 * 5 611 664Dem. Rep. of the Congo - - 15 321 - * 50 - * - 5 - 5 1,480 54
Bangladesh - 58 56 41 * - 54 * 34 - 7 - 5 837 207Bosnia and Herzegovina - - 45 15 - - - 5 - - 13 - - 384 1,421
Sri Lanka - 84 8 17 * - 41 - 12 * 8 - 7 475 124
Origin Greece Hungary Iceland (1) Ireland Italy Japan (2) Latvia Liechtenstein Lithuania Luxembourg Malta Montenegro NetherlandsNew
Zealand Norway
Syrian Arab Rep. 121 309 - * 165 9 * - * * 67 139 1,183 7 298Iraq 34 13 5 11 190 * - - - * - * 226 5 28Afghanistan 383 1,100 - 6 691 - - - 11 - - 35 138 * 163Serbia (and Kosovo: S/RES/1244 (1999)) * 166 - * 103 - - - - 45 - - 62 - 46
Eritrea 73 46 5 - 585 * - - - * * 266 399 - 814Somalia 40 81 - * 616 - - - - * 31 122 872 - 177Pakistan 313 50 - 21 1,125 61 - - * * - 38 47 5 38Russian Federation * * - - 17 * * * 13 - - - 77 - 49Islamic Rep. of Iran 69 28 - - 141 11 - - - 7 * * 150 - 49China 55 * - * 7 15 - - - - - - 28 6 8Nigeria 113 68 - 38 1,517 16 * - - 17 * 25 34 - 71Stateless 6 * - - * - - - - - - - 145 - 152Albania 153 * - 17 36 - - - - 19 - - 17 - 71Egypt 157 24 - 6 281 * * - * * - * 42 * 8The former Yugoslav Republic of Macedonia
* - - - * - - - - 18 - - 34 - 12
Georgia 136 10 - * 26 - 30 - 29 * - - 68 - 10Dem. Rep. of the Congo 71 23 - 22 17 * - - - - - 12 6 - *
Bangladesh 94 118 - 10 151 59 - * - - * * * - 34Bosnia and Herzegovina - - - - 46 - - - - 51 - - 38 - 14
Sri Lanka 5 * - - 15 112 - - - - - - 54 16 *
37UNHCR Asylum Trends 2013 37

TABLE 14 Asylum applications lodged in 44 industrialized countries by origin, fourth quarter | 2013 (ctnd)
Covering all 44 asylum countries which provided monthly data to UNHCR. See notes in Annex Table 1.
Top-20 ranking of countries based on applications lodged in all countries. An asterisk (*) denotes between 1 and 4 applications.
Origin Poland PortugalRep. of Korea Romania Serbia (3) Slovakia Slovenia Spain Sweden Switzeland
TfYR Macedonia (4) Turkey (5)
United Kingdom
United States (6)
Syrian Arab Rep. 45 77 85 215 585 9 * 181 6,759 1,062 30 57 524 397Iraq 8 * - 11 28 - - 21 457 87 - 9,941 152 261Afghanistan * - 16 21 247 37 - 11 804 189 109 1,714 410 45Serbia (and Kosovo: S/RES/1244 (1999)) * - - - - - 6 * 898 162 - - 9 55
Eritrea - * * - 221 * - * 1,822 687 * 18 582 50Somalia * 0 - - 184 6 * 21 1,053 169 12 315 112 27Pakistan 5 6 107 10 80 - * 30 71 51 7 258 1,153 133Russian Federation 760 * * * - - * 12 302 94 - - 34 216Islamic Rep. of Iran * * - * 13 * * 15 269 34 - 1,593 733 215China - - 10 * - * - * 16 135 - * 231 2,715Nigeria - 8 114 - 100 - * 44 133 201 5 14 270 47Stateless 8 - - - - - - - 2,766 * - - 67 20Albania - - - * - - - 9 390 23 - - 472 37Egypt * - 91 7 5 * * * 107 28 * 40 68 612The former Yugoslav Republic of Macedonia
- - - - * - - - 107 18 - - * 5
Georgia 231 - - * - - - * 208 139 - - 15 16Dem. Rep. of the Congo - 6 * - - * * 10 12 51 - 16 64 66
Bangladesh 6 - 14 - 24 - - * 47 21 18 9 249 81Bosnia and Herzegovina - - - - * - - - 163 48 - - - *
Sri Lanka - * * - - - * 5 8 186 - - 529 40
NotesA dash (“-”) indicates that the value is zero or not available.(1) October data is based on Eurostat. No data for November and December.(2) UNHCR estimates.(3) Serbia (and Kosovo: S/RES/1244 (1999)).(4) The former Yugoslav Republic of Macedonia.(5) Figure includes asylum-seekers registered with UNHCR as well as asylum-seekers who have been pre-registered but who are pending official registration with UNHCR. As of 31 December 2013, there were 580,480 registered Syrian refugees in Turkey covered by the Government’s Temporary Protection Regime. The figures in this table cover only those Syrian asylum-seekers who for specific reasons have been referred to UNHCR for further evaluation of their international protection needs.(6) Combination of number of persons (EOIR) and cases (DHS). EOIR data excludes September-December due to lack of data.
38 UNHCR Asylum Trends 201338
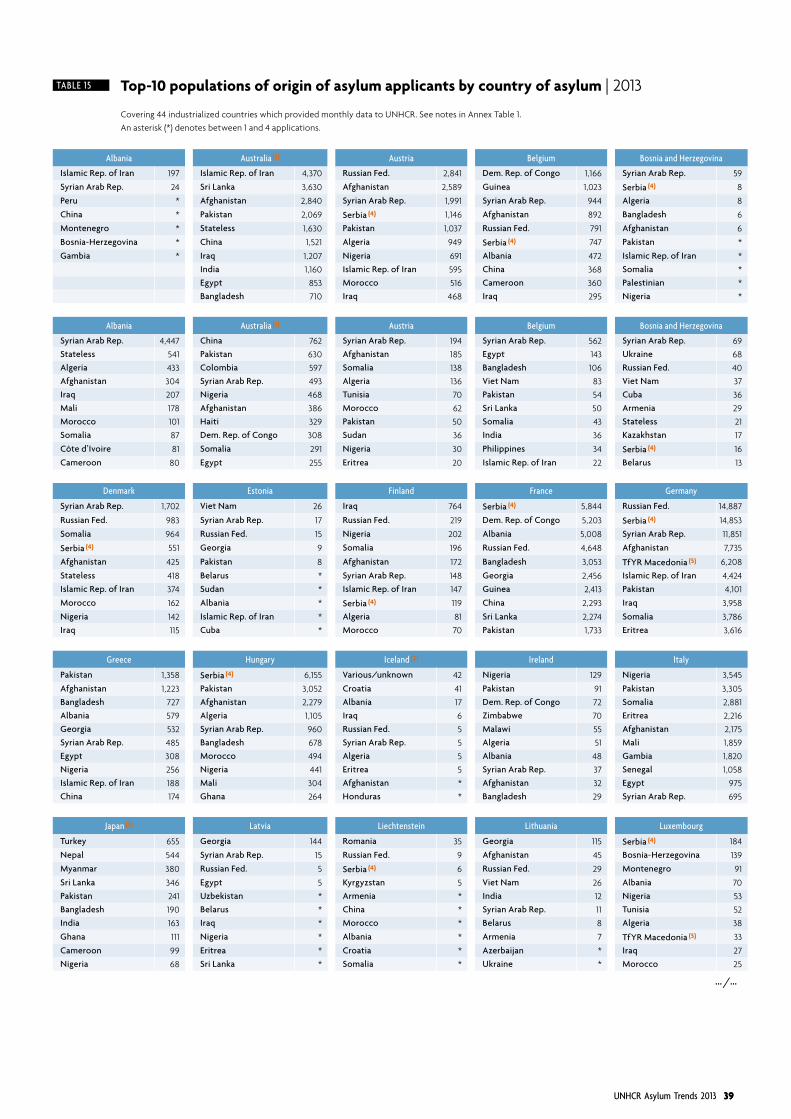
TABLE 15 Top-10 populations of origin of asylum applicants by country of asylum | 2013
Covering 44 industrialized countries which provided monthly data to UNHCR. See notes in Annex Table 1.
An asterisk (*) denotes between 1 and 4 applications.
Albania Australia (1) Austria Belgium Bosnia and Herzegovina
Islamic Rep. of Iran 197 Islamic Rep. of Iran 4,370 Russian Fed. 2,841 Dem. Rep. of Congo 1,166 Syrian Arab Rep. 59
Syrian Arab Rep. 24 Sri Lanka 3,630 Afghanistan 2,589 Guinea 1,023 Serbia (4) 8
Peru * Afghanistan 2,840 Syrian Arab Rep. 1,991 Syrian Arab Rep. 944 Algeria 8
China * Pakistan 2,069 Serbia (4) 1,146 Afghanistan 892 Bangladesh 6
Montenegro * Stateless 1,630 Pakistan 1,037 Russian Fed. 791 Afghanistan 6
Bosnia-Herzegovina * China 1,521 Algeria 949 Serbia (4) 747 Pakistan *
Gambia * Iraq 1,207 Nigeria 691 Albania 472 Islamic Rep. of Iran *India 1,160 Islamic Rep. of Iran 595 China 368 Somalia *Egypt 853 Morocco 516 Cameroon 360 Palestinian *Bangladesh 710 Iraq 468 Iraq 295 Nigeria *
Albania Australia (1) Austria Belgium Bosnia and Herzegovina
Syrian Arab Rep. 4,447 China 762 Syrian Arab Rep. 194 Syrian Arab Rep. 562 Syrian Arab Rep. 69Stateless 541 Pakistan 630 Afghanistan 185 Egypt 143 Ukraine 68Algeria 433 Colombia 597 Somalia 138 Bangladesh 106 Russian Fed. 40Afghanistan 304 Syrian Arab Rep. 493 Algeria 136 Viet Nam 83 Viet Nam 37Iraq 207 Nigeria 468 Tunisia 70 Pakistan 54 Cuba 36Mali 178 Afghanistan 386 Morocco 62 Sri Lanka 50 Armenia 29Morocco 101 Haiti 329 Pakistan 50 Somalia 43 Stateless 21Somalia 87 Dem. Rep. of Congo 308 Sudan 36 India 36 Kazakhstan 17
Côte d’Ivoire 81 Somalia 291 Nigeria 30 Philippines 34 Serbia (4) 16
Cameroon 80 Egypt 255 Eritrea 20 Islamic Rep. of Iran 22 Belarus 13
Denmark Estonia Finland France Germany
Syrian Arab Rep. 1,702 Viet Nam 26 Iraq 764 Serbia (4) 5,844 Russian Fed. 14,887
Russian Fed. 983 Syrian Arab Rep. 17 Russian Fed. 219 Dem. Rep. of Congo 5,203 Serbia (4) 14,853
Somalia 964 Russian Fed. 15 Nigeria 202 Albania 5,008 Syrian Arab Rep. 11,851
Serbia (4) 551 Georgia 9 Somalia 196 Russian Fed. 4,648 Afghanistan 7,735
Afghanistan 425 Pakistan 8 Afghanistan 172 Bangladesh 3,053 TfYR Macedonia (5) 6,208
Stateless 418 Belarus * Syrian Arab Rep. 148 Georgia 2,456 Islamic Rep. of Iran 4,424Islamic Rep. of Iran 374 Sudan * Islamic Rep. of Iran 147 Guinea 2,413 Pakistan 4,101
Morocco 162 Albania * Serbia (4) 119 China 2,293 Iraq 3,958
Nigeria 142 Islamic Rep. of Iran * Algeria 81 Sri Lanka 2,274 Somalia 3,786Iraq 115 Cuba * Morocco 70 Pakistan 1,733 Eritrea 3,616
Greece Hungary Iceland (2) Ireland Italy
Pakistan 1,358 Serbia (4) 6,155 Various/unknown 42 Nigeria 129 Nigeria 3,545
Afghanistan 1,223 Pakistan 3,052 Croatia 41 Pakistan 91 Pakistan 3,305Bangladesh 727 Afghanistan 2,279 Albania 17 Dem. Rep. of Congo 72 Somalia 2,881Albania 579 Algeria 1,105 Iraq 6 Zimbabwe 70 Eritrea 2,216Georgia 532 Syrian Arab Rep. 960 Russian Fed. 5 Malawi 55 Afghanistan 2,175Syrian Arab Rep. 485 Bangladesh 678 Syrian Arab Rep. 5 Algeria 51 Mali 1,859Egypt 308 Morocco 494 Algeria 5 Albania 48 Gambia 1,820Nigeria 256 Nigeria 441 Eritrea 5 Syrian Arab Rep. 37 Senegal 1,058Islamic Rep. of Iran 188 Mali 304 Afghanistan * Afghanistan 32 Egypt 975China 174 Ghana 264 Honduras * Bangladesh 29 Syrian Arab Rep. 695
Japan (3) Latvia Liechtenstein Lithuania Luxembourg
Turkey 655 Georgia 144 Romania 35 Georgia 115 Serbia (4) 184
Nepal 544 Syrian Arab Rep. 15 Russian Fed. 9 Afghanistan 45 Bosnia-Herzegovina 139
Myanmar 380 Russian Fed. 5 Serbia (4) 6 Russian Fed. 29 Montenegro 91
Sri Lanka 346 Egypt 5 Kyrgyzstan 5 Viet Nam 26 Albania 70Pakistan 241 Uzbekistan * Armenia * India 12 Nigeria 53Bangladesh 190 Belarus * China * Syrian Arab Rep. 11 Tunisia 52India 163 Iraq * Morocco * Belarus 8 Algeria 38
Ghana 111 Nigeria * Albania * Armenia 7 TfYR Macedonia (5) 33
Cameroon 99 Eritrea * Croatia * Azerbaijan * Iraq 27Nigeria 68 Sri Lanka * Somalia * Ukraine * Morocco 25
…/…
39UNHCR Asylum Trends 2013 39

TABLE 15 Top-10 populations of origin of asylum applicants by country of asylum | 2013 (ctnd)
Covering 44 industrialized countries which provided monthly data to UNHCR. See notes in Annex Table 1.
An asterisk (*) denotes between 1 and 4 applications.
Malta Montenegro Netherlands New Zealand Norway
Somalia 1,008 Pakistan 989 Somalia 3,078 Sri Lanka 41 Eritrea 3,215Eritrea 471 Algeria 701 Syrian Arab Rep. 2,673 Fiji 37 Somalia 1,617Syrian Arab Rep. 250 Eritrea 352 Iraq 1,094 Islamic Rep. of Iran 22 Syrian Arab Rep. 841Libya 108 Morocco 287 Eritrea 978 China 21 Afghanistan 684Nigeria 85 Syrian Arab Rep. 285 Islamic Rep. of Iran 728 Pakistan 18 Sudan 586Gambia 70 Somalia 197 Afghanistan 673 Iraq 15 Stateless 532
Mali 40 Afghanistan 186 Serbia (4) 316 Turkey 12 Nigeria 481
Senegal 35 Sudan 142 Russian Fed. 263 Syrian Arab Rep. 10 Russian Fed. 324
Ghana 30 Tunisia 126 Stateless 216 South Africa 9 Serbia (4) 303
Ethiopia 15 Nigeria 122 Georgia 209 Indonesia 8 Ethiopia 282
Poland Portugal Rep. of Korea Romania Serbia (4)
Russian Fed. 11,933 Syrian Arab Rep. 146 Syrian Arab Rep. 295 Syrian Arab Rep. 1,016 Syrian Arab Rep. 1,362Georgia 1,057 Guinea 81 Pakistan 275 Iraq 45 Eritrea 624Syrian Arab Rep. 255 Nigeria 37 Nigeria 206 Pakistan 40 Somalia 507Armenia 150 Senegal 36 Egypt 97 Afghanistan 39 Afghanistan 492Kazakhstan 76 Pakistan 26 Nepal 90 Egypt 29 Algeria 256Kyrgyzstan 53 Mali 26 Cameroon 77 Palestinian 28 Mali 228Afghanistan 43 Guinea-Bissau 17 South Africa 74 Islamic Rep. of Iran 26 Pakistan 219Egypt 33 Morocco 15 Ethiopia 68 Georgia 25 Sudan 169Ukraine 32 Côte d’Ivoire 14 China 46 Turkey 25 Nigeria 157Viet Nam 32 Dem. Rep. of Congo 13 Bangladesh 45 China 18 Côte d’Ivoire 116
Slovakia Slovenia Spain Sweden Switzerland
Afghanistan 84 Syrian Arab Rep. 56 Mali 1,478 Syrian Arab Rep. 16,317 Eritrea 2,490
Somalia 42 Serbia (4) 37 Syrian Arab Rep. 725 Stateless 6,921 Syrian Arab Rep. 1,852
Eritrea 25 Pakistan 19 Algeria 351 Eritrea 4,844 Nigeria 1,574Armenia 21 Algeria 14 Nigeria 173 Somalia 3,901 Tunisia 1,565Georgia 16 Afghanistan 14 Somalia 132 Afghanistan 3,011 Morocco 974
Syrian Arab Rep. 13 Russian Fed. 13 Palestinian 130 Serbia (4) 2,878 Afghanistan 863
Sudan 8 Turkey 11 Pakistan 102 Iraq 1,476 Serbia (4) 826
Pakistan 8 Morocco 9 Guinea 89 Islamic Rep. of Iran 1,172 Algeria 714Russian Fed. 6 Cuba 7 Cameroon 86 Albania 1,156 China 671Iraq 6 Somalia 6 Dem. Rep. of Congo 78 Russian Fed. 1,036 Georgia 565
TfYR Macedonia (5) Turkey (6) United Kingdom United States (7)
Syrian Arab Rep. 360 Iraq 25,280 Pakistan 4,507 China 12,285Afghanistan 262 Afghanistan 8,726 Islamic Rep. of Iran 2,946 Mexico 9,261Somalia 93 Islamic Rep. of Iran 5,897 Sri Lanka 2,246 Various/unknown 8,945Algeria 93 Somalia 1,276 Syrian Arab Rep. 2,032 El Salvador 4,649Pakistan 92 Palestinian 686 Albania 1,587 Guatemala 4,314Bangladesh 55 Pakistan 528 Afghanistan 1,422 Egypt 2,850Comoros 46 Uganda 218 Eritrea 1,408 Honduras 2,635Morocco 45 Sudan 205 Nigeria 1,377 Haiti 1,748Nigeria 40 Yemen 192 Bangladesh 1,233 Ecuador 1,721Palestinian 32 Uzbekistan 181 India 1,085 Syrian Arab Rep. 1,546
Notes(1) Figures are based on the number of applications lodged for protection visas. They do not include asylum-seekers who arrived in Australia by boat in 2012 or 2013 and have not been able to lodge protection visa applications or who have been transferred to third countries for refugee status determination.(2) 2013 excludes data for November and December. October data is based on Eurostat.(3) UNHCR estimate(4) Serbia (and Kosovo: S/RES/1244 (1999))(5) The former Yugoslav Republic of Macedonia(6) Figure includes asylum-seekers registered with UNHCR as well as asylum-seekers who have been pre-registered but who are pending official registration with UNHCR.(7) Combination of cases (DHS) and persons (EOIR). Data for the Executive Office for Immigration Review (EOIR) is available up to August 2013. The total number of applications lodged between September and December 2013 has been estimated by UNHCR using a statistical model (seasonal ARIMA). No information is available on the country of origin during this period, however.
40 UNHCR Asylum Trends 201340

Country of asylum Jan. Feb. Mar. Apr. May Jun. Jul. Aug. Sep. Oct. Nov. Dec. Total
Albania 3 1 8 - 44 27 45 46 31 12 1 8 226
Australia (1) 4,513 2,392 2,624 2,869 3,671 2,260 1,085 1,186 1,207 967 795 755 24,324
Austria 1,208 1,185 1,198 1,405 1,445 1,799 1,802 1,352 1,345 1,693 1,553 1,518 17,503Belgium 1,251 987 1,100 1,012 949 979 1,114 996 1,193 1,110 955 857 12,503Bosnia and Herzegovina 9 2 1 5 20 19 5 1 9 3 15 11 100Bulgaria 243 213 412 249 275 412 434 693 939 1,230 1,247 632 6,979Canada 790 661 692 830 777 730 831 912 1,110 1,140 968 941 10,382Croatia 168 145 170 105 95 38 46 50 79 95 57 41 1,089Cyprus 98 138 81 74 94 70 71 103 118 141 143 115 1,246Czech Rep. 47 30 52 36 42 38 40 66 32 44 36 40 503Denmark 760 590 601 581 508 534 642 705 686 753 659 521 7,540Estonia 11 9 4 11 17 2 12 1 7 5 14 4 97Finland 255 205 226 228 210 218 257 319 329 267 264 244 3,022France 4,625 5,090 5,351 5,393 4,644 5,075 5,602 4,502 4,471 5,770 4,768 4,804 60,095Germany 7,530 5,995 5,790 7,712 7,683 8,601 9,806 9,830 11,729 13,285 12,401 9,218 109,580Greece 754 707 608 744 594 536 776 608 676 833 761 628 8,225Hungary 285 662 1,322 1,942 3,319 4,077 2,176 1,100 1,036 740 903 1,011 18,573
Iceland (2) 32 21 20 16 9 7 9 9 14 15 .. .. 152
Ireland 79 83 65 91 79 72 70 65 80 81 108 69 942Italy 1,719 1,256 1,933 1,844 1,829 2,323 2,574 2,610 2,692 3,487 3,258 2,307 27,832
Japan (3) 316 277 255 234 282 260 260 240 238 280 281 329 3,252
Latvia 5 6 13 16 11 8 35 31 25 16 8 11 185Liechtenstein 13 3 1 5 15 13 14 8 8 7 1 5 93Lithuania 19 27 13 13 11 26 29 44 11 28 27 29 277Luxembourg 73 69 71 90 65 84 94 74 111 121 84 52 988Malta 23 21 60 161 129 53 434 738 287 116 127 51 2,200Montenegro 62 129 164 224 193 295 587 523 534 340 234 269 3,554Netherlands 1,305 976 956 1,042 903 1,039 1,187 1,081 1,498 1,557 1,500 1,355 14,399New Zealand 30 19 28 38 15 15 38 18 18 18 19 36 292Norway 937 642 813 766 730 885 1,223 1,564 1,324 1,044 815 725 11,468Poland 617 702 1,279 1,915 2,857 2,296 1,483 882 712 537 377 326 13,983Portugal 24 23 24 71 25 35 39 30 54 44 30 107 506Rep. of Korea 93 67 64 89 103 95 110 144 158 265 196 190 1,574Romania 121 94 125 131 137 103 184 95 183 135 112 79 1,499Serbia (and Kosovo: S/RES/1244 (1999)) 159 196 394 497 374 284 379 335 638 651 607 614 5,128
- of which Kosovo 2 3 13 7 4 12 10 - 11 - - - 62Slovakia 15 12 14 24 33 35 21 34 7 31 32 23 281Slovenia 49 14 31 21 30 22 13 16 14 19 4 9 242Spain 284 447 440 406 447 452 433 301 352 354 316 269 4,501Sweden 3,802 2,970 2,964 3,061 3,084 2,978 4,061 4,798 7,767 7,908 5,535 5,331 54,259Switzerland 1,953 1,633 1,661 1,881 1,513 1,412 1,672 1,418 1,310 1,624 1,753 1,610 19,440The former Yugoslav Republic of Macedonia 23 13 76 145 111 155 180 293 121 111 71 44 1,343
Turkey (4) 2,076 2,735 2,661 3,076 3,068 3,810 3,829 3,578 5,325 4,406 5,174 5,069 44,807
United Kingdom 2,406 2,265 2,305 2,450 2,363 2,376 2,691 2,323 2,547 2,770 2,506 2,183 29,185
United States (5) 7,232 6,418 6,794 7,023 8,562 7,626 7,474 7,731 6,975 7,917 6,993 7,614 88,358
EU-Total (28) 27,776 24,921 27,208 30,828 31,878 34,281 36,126 33,447 38,980 43,170 37,785 31,834 398,234Nordic countries (5) 5,786 4,428 4,624 4,652 4,541 4,622 6,192 7,395 10,120 9,987 7,273 6,821 76,441Southern Europe (8) 4,981 5,328 5,815 6,376 6,230 7,306 8,201 8,014 9,535 9,393 9,810 8,554 89,543Total Europe (38) 33,043 30,296 33,007 37,443 37,955 41,188 44,069 41,222 48,294 51,383 46,456 40,189 484,545
Canada/USA 8,022 7,079 7,486 7,853 9,339 8,356 8,305 8,643 8,085 9,057 7,961 8,555 98,740Australia/New Zealand 4,543 2,411 2,652 2,907 3,686 2,275 1,123 1,204 1,225 985 814 791 24,616Japan/Rep. of Korea 409 344 319 323 385 355 370 384 396 545 477 519 4,826Total non-Europe (6) 12,974 9,834 10,457 11,083 13,410 10,986 9,798 10,231 9,706 10,587 9,252 9,865 128,182
Total (44) 46,017 40,130 43,464 48,526 51,365 52,174 53,867 51,453 58,000 61,970 55,708 50,054 612,727
NotesSee notes in Annex Table 1.(1) Figures are based on the number of applications lodged for protection visas. They do not include asylum-seekers who arrived in Australia by boat in 2012 or 2013 and have not been able to lodge protection visa applications or who have been transferred to third countries for refugee status determination.(2) Excludes data for November and December. October data is based on Eurostat.(3) UNHCR estimate(4) Figure includes asylum-seekers registered with UNHCR as well as asylum-seekers who have been pre-registered but who are pending official registration with UNHCR.(5) Data for the Executive Office for Immigration Review (EOIR) is available up to August 2013. The total number of applications lodged between September and December 2013 has been estimated by UNHCR using a statistical model (seasonal ARIMA). No information is available on the country of origin during this period, however.
TABLE 16 Monthly asylum applications lodged in 44 industrialized countries | 2013
Covering 44 countries which provided monthly data to UNHCR.
41UNHCR Asylum Trends 2013 41

42 UNHCR Asylum Trends 201342

www.unhcr.org
© 2014 United Nations High Commissioner for RefugeesAll rights reserved. Reproductions and translations are authorized, provided UNHCR is acknowledged as the source.
For more information, please contact:Field Information and Coordination Support SectionDivision of Programme Support and ManagementCase Postale 25001211 Geneva, [email protected]
This document along with further statistical information on global displacement is available on UNHCR’s Statistics website:http://www.unhcr.org/statistics
Cover photo: Boat arrivals on the Italian island of Sicily. Those who disembark have risked their lives in a desperate attempt to reach safety or find a better life. Coming from various countries in sub-Saharan Africa, they include both asylum-seekers with protection needs and economic migrants.U N H C R / F . M A L A V O LTA
produced and printed by unhcr (21 march 2014).
43UNHCR Asylum Trends 2013 43