Embed Size (px)
Citation preview
ASX Australian Investor Study2017

Brochure / report title goes here | Section title goes here ASX Australian Investor Study | 2017

ContentsTop 10 findings 01
Executive summary 03
1. Retail investment in Australia 11
1.1 Definitionsusedinthisreport 11
1.2 Thevalueofinvestingtoindividuals 11
1.3 Thevalueofawell-functioningfinancialexchange 12
2. The investment landscape is changing 14
2.1 Lowinterestrateenvironment 14
2.2 Policychange 15
2.3 Digitalinnovation 17
2.4 Demographicshifts 17
3. Who is investing? 20
3.1 ChangesininvestmentownershipinAustralia 21
3.2 TheprofileoftheAustralianinvestor 27
3.3 Understandingpotentialinvestors 40
4. What are Australians investing in and how? 46
4.1 Australianinvestors’portfoliosarenotverydiversified 46
4.2 Useofadvisoryservices 52
4.3 Useoftransactionservices 54
5. Why do Australians invest? 59
5.1 Awareness,knowledgeandattitudes 62
5.2 Australians’attitudestorisk 66
5.3 Diversification 71
6. Seeking a more diversified future 72
References 73
ASX Australian Investor Study | 2017

Top10findings
60%Australian adults or 11.2 million people hold investments outside of their institutional superannuation fund
37%
31% 7% 11%
of Australian adults or 6.9 million people hold investments that are available through a financial exchange
ofAustralian adultsholdshares
ofAustralianadultsholdderivatives
holdotheron-exchangeinvestments
10% to 20%
24% to 39%
More and more young people are investing outside their institutional superannuation funds
Overthelast5 yearstheproportionof18-24 yearoldsinvestinghasdoubledfrom
Theproportion of25-34yearolds hasincreasedfrom
overthe sameperiod
62% 56% 37%
On-exchange investments are a more common investment choice than cash or property
ofinvestors holdon-exchangeinvestments
ofinvestors holdcash
ofinvestorsholdinvestmentproperty
15% 13% 8%
Self-managed superannuation funds (SMSF) use will continue to grow, with 30% of Australian adults that do not currently use an SMSF planning to set one up in the future
ofadultsclaimto haveanSMSF
ofadultswithoutanSMSFareplanningtoestablishonewithinthenextyear
arefurtherplanningtoestablishoneinthenext13-24 months
ASX Australian Investor Study | 2017
1

46% 40% 15%
75%
Diversification is still not well understood
ofinvestorsclaim tobediversifiedand hold2.7investmentproducts
ofinvestorssaytheydonothavediversifiedportfolios. Theyhold1.6 investmentproducts
ofinvestorsdon’tknow ifthey’rediversified
ofshare ownersholdonly Australianshares
65%
40%
42%
of investors holding on-exchange investments transacted in the last 12 months
tradedusingnon-advicebrokersandonlinetradingplatforms
ofshareownershavetradedinthelast12months
71% ofinvestorsthattradedinthelast12monthsmadefewerthan10trades
81% 21%41%ofinvestorsunder35areseekingguaranteedorstableinvestmentreturns
ofthemostriskaverseinvestorsexpectreturns over10%
ofinvestorsover55arecomfortablewithsomevariabilityintheirreturns
Disconnect between investor risk profiles and their return expectations
Younginvestorsaremoreriskaversethanolderinvestors
60% of all investors use some form of professional advice (financial planner, full-service stockbroker, accountant, and/or lawyer) to help them make investment decisions
41%
84%of lapsed investors intend to return to investing
intendtoreturninnext2 years
ASX Australian Investor Study | 2017
2

ASX Australian Investor Study | 2017
3
ExecutivesummaryInvestingisacriticalactivityinanymoderneconomy.It’showbusinessesprepareforservingcustomersinthefuture,howanationgrowsovertime,andhowindividualsandfamiliescanparticipateinfinancialsuccessesofbusinessesandearn anincome.
Investingisasoldaseconomies themselves.Andyet,theearly Twenty-FirstCenturyisalsoatimeofconsiderablechangeintheinvestmentlandscape.Thechangingstructureofourpopulationisreshapingwhoisinvesting andwhy.Newdigitaltechnologieshavebroughtnewwaysforpeopletoinvest,alteredwhattheyinvestin,andhowtheyreceiveadvice.
IntheaftermathoftheglobalfinancialcrisisandtheEuropeansovereigndebtcrisis,therehasbeenaslowingofglobalgrowthandlownominalinterestrates,whichhavecontributedtoloweryieldsandledtoinvestorsreconsideringtheirriskappetite.OverthepastdecadetheAustralianfinancialsectorhasbeensubjecttosignificantpolicychangewhichhasseenatighteningofregulation.Thischangecontinuestounfoldandwillimpactthebehavioursoffinancialintermediaries andinvestors.
In2016,theAustralianequitymarketgenerallyoutperformedotherdevelopedequitymarketsglobally(RBA,2017).Atthetimeofwriting,theS&P/ASX200wasatitshighestlevelsincepriortotheglobalfinancialcrisis.Tradingvolumeshaveincreased23%overthe12monthstoMarch,andcontinuetogrow(ASX,2017a).Thedomesticequitymarketcapitalisationisatahistorichigh,reaching$1.8trillioninMarchthisyear(ASX,2017b).
Atthesametime,significantglobaleventshaveinfluenceddomesticmarketsoverthelastyear.TheannouncementsofdecisionsbyBritishvoterstoleavetheEuropeanUnionandbyUSvoterstoelectPresidentTrumpcoincidedwithincreasedtradingvolumesonASX.Thesetwolargelyunexpecteddevelopmentsarekeyexamplesofaglobalenvironmentcharacterisedbysignificantuncertainty.Geopoliticaldevelopmentsarelikelytocontinuetobeafocusforinvestorsinthenearfuture(InvestmentMagazine,2017).Againstthisbackground,riskmanagementwillbeanimportantconsiderationforallinvestors,increasingtheimportanceofhavinganappropriatelydiversifiedportfolio.
Thisstudydoesnotprovideanassessmentaboutwhetherretailinvestors(hereafterreferredtoas‘investors’)aredoingtherightthing,nordoesitofferadvicefortheseinvestorstofollow.Instead,thisstudyseekstoshedlightoninvestorbehaviourinthiscomplexandchanginginvestmentlandscape,andprovidessome‘foodforthought’fortheinvestmentindustrythatcaterstothem.
This2017editionofthestudyhasbeenpreparedbyDeloitteAccessEconomics, asuccessortodecadesofeffortbyASX, whichhasbienniallypublishedaprofile ofAustralianshareownershipsince1986. Thisstudyisbasedonanonlinesurveyof4,000individuals(arepresentativesample oftheAustralianadultpopulation). ThefocusisonAustralianadultsthat investoutsideoftheirinstitutional superannuationfundarrangements.
Theinvestmentlandscapehasbecomemoresophisticatedovertime,andwhileAustraliahasrankedwellagainstglobalmeasuresoffinancialliteracy,thereisscopetoimprove.Australianinvestors’portfoliosarenotverydiversified,andtheirawarenessoffinancialproductsdeclinesquickly outsideofshares.
Atthesametime,theinvestmentindustrymaynotbeengagingwithinvestorsaswellastheycouldbe.Someofthesurveyfindingsmaychallengeexistingindustryperceptionsofinvestors.Thereisanopportunityfortheindustrytochangeandbecomemoreresponsivetoitscustomers,whichcanhelpdeliverimprovedfinancialoutcomesforAustraliansand theeconomy.
This study also identifies some ‘food for thought’ for the investment industry.
Food for thought for the investment industry
• Do you have a good understanding of how these changes will impact investors?
• Is your business model geared towards supporting investors as the investment environment and their preferences change?

ASX Australian Investor Study | 2017
4
Investment ownership trends Thelevelofownershipof‘on-exchangeinvestments’(whichisdefinedtoincludeinvestmentproductsthatareboughtandsoldthroughafinancialexchange,forexample,sharesandderivatives)hasremainedbroadlyconsistentsincethe 2014study,ataround37%ofthe adultpopulation.
However,investingisbecoming morecommonamongyoungpeople. Theproportionof18-24yearoldsinvestinghasdoubledinthepastfiveyears,from 10%to20%.
Ownershipofinternationalshareshas alsoincreased.Today,nearly8%oftheadultpopulationsaythattheydirectlyholdshareslistedonaninternationalfinancialexchange,upfrom5%in2014.1
Profile of the Australian investor Three-fifths(60%)ofAustralianadultsdirectlyholdinvestmentsofsomesort(includinginvestmentsnotavailable onafinancialexchange)outsideof theirinstitutionalsuperannuationfund (Figurei).ThismeansthatmanyAustralianadultsarecomfortableinvesting, buttheyarenotnecessarilyinvesting inon-exchangeinvestments.
Mostcommonly,Australianinvestors holdtheirinvestmentsinapersonalcapacity.Ofinvestorsholdinginvestmentspersonally,younginvestorsaretheleastprominent.Thismaypartlyreflectthereal orperceivedbarriersthatthisgroupfaces,orthefactthattheyhaveotherpriorities.
Younginvestorsaremoredigitallysavvy, andwhiletheadventofdigitalwealthadvisory(i.e.roboadvice)offersopportunitiesforbothinvestorsandfinancialadviserstotakeadvantageof digitalinnovation,usehasbeenlimited. Thisismostlyduetoalackofknowledgeabouttheseproducts,whichsuggeststhattheinvestmentindustrycoulddomoretoeducateinvestors(andraisesquestionsaboutwhethertheseinnovationstrulymeetinvestors’needs).
Food for thought
• How is your business responding to the growth in numbers of young investors and self-directed investors?
• Do you promote the use of specific investments, like exchange-traded products, to facilitate easy access to international markets?
Figure i: Investment structures used, proportion of adult population
Investments
ShareoftheAustralianadultpopulationholding:
Investmentsinselfmanaged
superannuationfunds*
Investmentsincompanystructures
Investmentsinfamilytrusts
Investmentsinapersonalcapacity
60% 51% 15% 10% 7%
*ThisishigherthantheATO’sSMSFstatisticalreport–December2016,whichindicatesthataround6%ofAustralianadults aremembersofSMSFs
Note: Optionsdonotsumto100%becausemanyinvestorsholdinvestmentsthroughmorethanonestructure;2017(n=4000)
1Itispossiblethatrespondentsmayhavemisinterpretedthequestionandareinpartreportinginternationalsharestheyholdindirectly.

ASX Australian Investor Study | 2017
5
Atthesametime,andcontrarytoconventionalexpectations,younginvestorsalsoappearmoreriskaversethanolderinvestors–with4in5younginvestorspreferringguaranteedorstableinvestmentreturns.Theinvestmentindustrycouldseektobettertailortheirproductsandadvicetomeetthisneed,forexample,byconsideringcapitalprotectedproductsandprovidingeducationonriskmanagement.
On-exchangeinvestmentscollectivelycomprisethemostcommonlyheldinvestments–62%ofallinvestors(thatis, ofthe60%ofAustralianadultsthatinvest insomeway)holdtheminsomeform. Thisisfollowedbycashsavings(56%) andinvestmentproperty(37%).
Irrespectiveofhouseholdincomelevels,cash,shares,andpropertyarethemostcommonlyheldinvestmentsinAustralia,althoughwealthierhouseholdstendtoinvestrelativelymoreinpropertyandshares.
ThereisasignificantdomesticfocusinAustralians’investmentportfolios,with75%ofallshareowners(thatis,thoseinvestorsthatholdsharesofsomekind)onlyholdingdomesticshares,althoughtheymayhaveoverseasequitiesexposurethroughtheirinstitutionalsuperannuationfund.
Overthenext12months,moreinvestorsareplanningtomoveoutofcashthanotherinvestments.Thisislikelyaresultofrecordlowinterestratesandthelowrelativereturnsoncash.However,cashislikelytocontinuetobeoneofthemostpopularinvestmentchoices.
Why Australians invest Australianstypicallyinvestforthelongterm.Retirementandwealthaccumulationarefrontofmindforallagegroups,andindividualsareinvestinginproductsthatreflectthesegoals.
However,investingcanbeapathtoachievingotherlifeoutcomes.Forexample,asreflectedinthesurveyresultsandthecasestudyonWealthEnhancersPtyLtd(seeBoxAonpage34),youngerinvestorsmaybeincreasinglyconsideringinvestingasawaytosavefortheirhomedeposit.Theinvestmentadvisoryindustryisalreadyshiftingawayfrombusinessandproduct-ledoperatingmodelstocustomer-ledones.Byfocusingonbuildinglong-termclientrelationships,financialadviserscanhelptheirclientsinvesttoachieveabroaderrangeofoutcomesthroughoutdifferentlifestages.Thiswillrequirefinancialadviserstohaveabetterunderstandingoftheirclients'individualneeds.Makingbetteruseofcustomerdatawillbeanimportantenablertoachievingthisatscale.
Investors,onthewhole,feelconfidentinvestingincash,shares,andproperty, butquicklyloseconfidencewhenaskedaboutotherinvestments.Lessthan20%ofallinvestorsfeelconfidentinvestinginunlistedmanagedfunds,derivatives,andotheron-exchangeinvestments(suchasbonds,hybridsecurities,andexchange tradedfunds).
Therearelikelyanumberofreasonsforthis,whichmayincludethelingeringinvestorscepticismfromtheglobalfinancialcrisis.Itmayalsobepartlydrivenbyalackofunderstandingoftheseinvestmentproducts.Atthesametimeover30%ofinvestorsarenotawareoftheseproducts.Onewaytoimproveawarenessandunderstandingcouldbethroughimprovingfinancialeducation,includingthroughgreateruseoffinancialadvice.
Food for thought
• Does your business model cater for investors at all life stages?
• Are you developing low cost entry level products to cater for investors just starting out?
• How will you help educate young investors about the pros and cons of investing and of the value of professional financial advice?
Australian investors’ portfolios are not very diversified Diversificationisaboutaninvestor limitingtheirexposuretoanysingleasset(ASIC,2017a).However,Australianshaverelativelyconcentratedinvestmentportfolios,holdingprimarilycashsavings,shares,andinvestmentproperty.Thisonlyreflectsinvestors’holdingsoutsidetheirinstitutionalsuperannuationfund,and couldbebalancedoutdependingonhowtheirsuperannuationisinvested.Typically,superannuationassetsareprimarilyheldinequities(ABS,2017a).
Food for thought
• How can you help investors think about diversification?
• How can you engage investors to improve their awareness of and confidence with different financial products?

ASX Australian Investor Study | 2017
6
Australians’ attitudes to risk Australiansareriskaversebyglobalstandards.Aglobalinvestmentsurveyfoundthatonly29%ofAustralianinvestorsarepreparedtoincreasetheirriskprofilefortheopportunitytoearnmoreincome,comparedto66%ofinvestorsglobally (LeggMason,2015).Thisstudyfindsthatnearly70%ofallAustralianinvestorsareseekingstable,reliableorguaranteedreturnsfromtheirinvestments(Charti).
Thisriskaversionisparticularlystrongamongyounginvestors,challengingthestereotypethatolderpeoplearemoreriskaversethanyoungpeople.Thisisalsoreflectedinyounginvestors’higheraversiontoloss(Chartii).Thismayberelatedtotheeconomicenvironmentthattheyoungercohortshavegrownupin–witnessingtheimpactoftheglobalfinancialcrisisintheirformativeyears.Atthesametime,relativelylowerfinancialknowledgeandfinancialexperiencemayalsobedrivingthishigherdegreeofcautiousness(Kanetal.,2016).
10%
20%
30%
40%
50%
60%
70%
80%
90%
100%
Chart i: Investors attitudes to risk, proportion of investors
0
Accepthighervariabilitywiththepotentialforhigherreturns
Acceptmoderatevariabilityinreturns
Preferstable,reliablereturns
Preferguaranteedreturns
MaleFemale
Notes: n=2391
Overall
The rise of SMSFs Self-managedsuperannuationfunds(SMSFs)havebecomeincreasinglypopular.Thisstudyfoundthat30%ofinvestorsthatdonotcurrentlyuseanSMSFintendtosetoneupinthefuture,suggestinggrowthinthenumberofusersofthisstructure.
SMSFinvestorsarelong-termfocused– inlinewiththepurposeofsuperannuation.Theirtopinvestmentgoalissavingforretirement.Theyarealsomorelikelytouseprofessionaladvicethantheaverageinvestor,citingtheadvantagesoftailoredadvice,andthecomplexitiesoftaxandadministrativeproceduresastheirmainreasonsfordoingso.
SimilartoAustralianinvestorsmorebroadly,SMSFsareinvestedheavilyincash,shares,andproperty,thoughthecasestudyonClassLimited(seeBoxBonpage36)revealedthatsomeSMSFinvestorsarealsointerestedinalternativessuchascrowd-fundingandpeer-to-peerlending.
Food for thought
• How can you help investors think through whether an SMSF is right for them, including educating them on portfolio construction, administrative and regulatory requirements?
• Given the expected growth of SMSFs, can you afford not to be an SMSF expert?

ASX Australian Investor Study | 2017
7
Notes: n=2391
10%
20%
30%
40%
50%
60%
70%
80%
90%
100%
Chart ii: Reaction to investment balance dropping 20%, proportion of investors
0
I'dinvestmorefundstotakeadvantageofthelowerunit/sharepricesexpectingfuturegrowth
ThiswasariskIunderstood–I'dleavemyinvestmentsinplaceexpectingperformancetoimprove
I'dbeconcerned,butwouldwaittoseeiftheinvestmentsimprove
I'dcutmylossesandtransfermyfundstomoresecureinvestmentsectors
Losesleep–SecurityofmycapitaliscriticalandIdon'tintendtotakerisks
Overall 35-44 75+45-54 55-6425-3418-24 65-74
Moreriskaverseinvestorsareexpecting (onaverage)lowerreturnsthanlessriskaverseinvestors.However,1in5ofthemoreriskaverseinvestorsareseekingdoubledigitreturns.Giventhatinterestratesarecurrentlyathistoricallows,theseinvestorsmaybeunrealisticallyoptimisticabouttheirreturnexpectations.
Diversificationisoneofthemosteffectivewaystomanageinvestmentrisk(ASIC,2017a),andgiventhelevelofcautiousnessamongstAustralianinvestors,itmaybeexpectedtobewidelyused.However,around40%ofallinvestorsreportthat theydonothaveadiversified investmentportfolio.
Althoughsomeinvestorswillhavemadeaclearchoicetohavemoretargetedportfolios,othersmaybeconstrainedbyalackofaccesstoorknowledgeofcertaininvestmentproducts.
Whiletheinvestmentindustryhastakenstepstoimprovepublicunderstandingofthebenefitsofdiversification,theremaystillbeaninsufficientunderstandingofdiversificationamongstinvestors.Thiscouldmeanthattheinvestmentindustryisstrugglingtoconnectwithinvestors.Theindustryneedstoconsidernewapproachestohelpinvestorsbetterunderstandandnavigatetheirinvestmentjourney.
Food for thought
• How can you help investors understand what returns are reasonable for different asset classes in the current environment?
• How are you helping investors think through the risk and return trade-off?
• How can you help investors to understand the benefits of diversification?

ASX Australian Investor Study | 2017
8
How Australians approach investing Financialadviserscanassistinvestorswithunderstandingandaccessingtheirinvestmentoptions.Newtechnologiesbeingintroducedinthisspacehavethepotentialtosubstantiallychangethefutureoffinancialadviceprovision.
Currently,around60%ofallinvestorsusesomeformofprofessionaladvice(fromafinancialplanner,full-servicestockbroker,accountant,orlawyer)tohelpguidetheirinvestmentdecisions.Financialadvice(fromafinancialplannerorfullservicestockbroker)ismorecommonlysoughtbyhigherincomeinvestors,althoughthedifferencesaremodest(Chartiii).
Ownresearch Financialplanner oradviser
Fullserviceoradvicestockbroker
Accountant LawyerFamilyandfriends
10%
20%
30%
40%
50%
60%
70%
0%
Chart iii: Use of professional advice, by household income
Lessthan$80,000 $80,000-$150,000 Over$150,000
Notes: Investorscouldselectmorethanoneanswer,n=2391
Investorssaidthatthetopreasonsthey useadvicearethattheadvicecanbetailoredtotheirpersonalcircumstances,andthatanadviserhelpsthembettermanageriskintheirportfolio.Forthosenotusingadvice,theirmainreasonsareapreferencetobeincontrol(‘do-it-yourself’investors),andthattheyarenotconvincedthatadviceaddsvalue.
Ofthese‘do-it-yourself’(DIY)investors,theymaynotbeaversetousingfinancialadvice,butitcouldbethatthecurrentformofadvicedoesnotsuittheirpreferences.Innovationssuchasdigitalwealthadvice(i.e.roboadvice),whichoffersadvisoryserviceson-demand,maybemoresuitabletothisgroupofinvestors.Forexample,OwnersAdvisorysuggeststhatmanySMSFusershavetakenupthisservice(seeBoxD onpage56).
However,whenaskedaboutroboadvice, themajorityofinvestorssaidthatthey didnotknowenoughaboutroboadvicetoconsiderusingit.Younginvestorsweremorepositiveaboutusingroboadvice thanolderinvestors.
Providersoffinancialadviceneedto betterdemonstratethevalueoftheirservicestoinvestors.Whiledevelopments intheindustryhavesoughttoincreasetheuseoffinancialadvicebyimprovingitsqualityandaffordability,convincing investorsofthevalueofadvicehasbeen anongoingchallenge.
Developmentsintechnologycanhelpadviserstoengageinvestorsthrough moreefficientandconvenientchannels. Thiswillcontinuetobeanimportantfocusfortheindustry.
Food for thought
• Are you thinking about how you can engage DIY investors?
• How can you demonstrate the value of advice to counter the perceptions of a lack of value and high cost?
• Are you considering the development of your own technology or partnering with other organisations (white labelling) to increase the range of lower cost investment options for investors?

ASX Australian Investor Study | 2017
9
Understanding potential investors Non-investorsarepotentialinvestors.Understandingthebarrierstheyface andtheirattitudestoinvestingwillhelp torealisethatpotential.
Manynon-investorsareyoung,andas suchhavelowerincomes.Of18-34yearoldswhodonotinvest,61%haveanannualhouseholdincomeoflessthan$80,000. Themainreasoncitedbyindividualsthathaveneverinvestedfornotinvestingwasthattheydidnotthinktheyhadenoughmoneytodoso.Threeinfiveindividuals thathaveneverinvestedthinkthattheyneedmorethan$5,000tobegininvesting.2 Astheincomesoftheseindividuals increase,theywillbemorelikelytoinvest.
Individualsthathaveneverpreviouslyinvestedarealsomoreriskaversethaninvestors.Oftheseindividuals,36%wouldwantguaranteedreturnsontheirinvestments,comparedtoaround18% forinvestors.Theseindividualsarealso lessfinanciallysavvythaninvestorsand havelowerawarenessofalternative financialproducts.
Non-investorsthathavepreviouslyinvestedwerenotaversetostartinvestingagainoncetheirpersonalcircumstancesallowed.Around84%oflapsedinvestorssaidthattheyplantostartinvestingagainatsomepoint,with41%ofthisgroupintendingtoinvestagainwithinthenexttwoyears.
Thebarrierstonon-investorsbecominginvestorsaregenerallysurmountable.Improvingfinancialliteracywillencouragemanytostartinvesting.Theinvestmentindustrycouldreviewthetypesof‘entry-level’productsandservicesthatare offeredtoneworreturninginvestors, andhowtocommunicatetheiravailability tothesegroups.
Conclusion InvestingisimportantforAustralians. Asthepopulationages,andpeoplespendmoretimeinretirement,wealthaccumulationisbecomingcriticalto supportstandardsofliving.
Asinglepersonseekinga‘modest’lifestyleinretirementrequiresalumpsumofatleast$370,000(withouttheagepension)investedandreturning7%p.a.(SuperGuide,2017).Forcouples,thislumpsumneedstobeatleast$400,000.Inordertohavea‘comfortable’retirement,householdswillrequiredoubletheseamounts(SuperGuide,2017,andASFA,2016).Compulsorysuperannuationwillnotalwaysbeenoughtomaintainindividuals’lifestyleexpectations inretirement.
Investingearlytoaccumulatewealthwillmakethedifferencebetweenamodestandacomfortableretirementinthefuture–andwhetherornotindividualswillneedtorelyontheagepension.
WhilethemajorityofAustralianadultsholdinvestmentsofsomekind,thereremainsasignificantminoritywhodonotinvest.Thereisabigopportunity–engagingnon-investorswouldsignificantlyincreasethepoolofinvestedfunds,aswellasassistingthosepeopletofurthertheirfinancialgoals.
2Excludesthoseindividualsthatdidnotknoworwereunsure.
Whilemostinvestorsfeelcomfortablewithshares,cash,andproperty,diversificationremainsanissueimpactingoverallrisk.Thismaybeconstraininginvestors’abilitytobestmatchtheirinvestmentbehaviourstotheirfinancialgoals.Furthermore,investorsmaynotbeoptimisingtheirreturnforthelevelofrisktheyaretakingon.
Currently,mostinvestorsinAustraliaareself-directed,andchoosetoconducttheirownresearch.Manyalsoprefertodefertotheirfamilyandfriends.Moreknowledgeableinvestorsmaymakemoreuseofawiderrangeofinvestmentsproducts.However,manyinvestorssimplydonotseethevalueinseekingprofessionalfinancialadvice.Thissuggeststhattheindustryneedstoreconsiderthewayinwhichitinteractswithinvestorstodemonstrateitsrelevanceasapartnerin aninvestor’sjourney.
Thismaybethroughadoptingbusinessmodelsthatarecustomer-ledandfocusingonhowitcanhelpinvestorsachievetheirdesiredoutcomesthroughoutdifferentlifestages.Aswellasadoptingdevelopmentsintechnology.Theimpactofongoingpolicychangealsohasthepotentialtoimprovethevalueandreducethecostoffinancialadvice.Allofthesedevelopmentshavethepotentialtoenhancethevalueoffinancialadvice forinvestors.
Thereisalsoanopportunitytosupportparticipationofnon-investorsbyraisingfinancialliteracythroughfinancialeducationinitiativesandgreateraccesstofinancialadvice,aswellasofferingentrylevelproductstoinvestorsthataretaking theirfirststeps.
Australiahasover11millioninvestors.Butthiscouldbehigher.Thebarrierstoachievingthisarenotinsurmountable.
Food for thought
• How can you engage individuals that have never previously invested or have lapsed?
• Do you offer investment products with low entry costs and appropriate risk profiles for new investors?

ASX Australian Investor Study | 2017
10

ASX Australian Investor Study | 2017
11
TheAustralianShareOwnershipStudyisalongstandingASXinitiative.Firstconductedin1986,thestudyprofilesinvestorstoprovideanunderstandingoftheinvestmentlandscapeinAustralia:perceptions,attitudes,behaviours,anddemographicsofinvestors.
This2017AustralianInvestorStudy isthemostcomprehensiveiterationyet.Thisstudydiscussessomemegatrends andtheirimpactontheinvestmentlandscape,aswellasincludingmorecomprehensivequestionsaboutriskattitudes,familiaritywithalargerrangeofon-exchangeinvestments,useofdiversificationamonginvestors,andviews ofnewtechnologiessuchasroboadvice.
Thisstudyalsoidentifiessome foodforthoughtforthe investmentindustry.
Asurveywasconductedonline,withanationallyrepresentativesampleof4,000Australianresidentsansweringquestionsabouttheirinvestmentactivities.Afullexplanationofthesurveymethodology canbefoundinAppendixA.
Beyondthequantitativesurveyinsights,casestudieshavebeencompiledfromdiscussionswithsixindustryparticipants,whichprovideinsightsintoinvestingfromtheperspectivesofserviceproviders suchasfinancialadvisersand full-servicestockbrokers.
1.1 Definitions used in this report Thisreportfocusesonretailinvestors,specifically,thoseinvestorswhochoosetoinvestoutsideoftheirinstitutionalsuperannuationfund(thatis,superannuationheldinretail,industry,publicsector,andcorporatefunds),andthosewhotakeamoreactiveroleinmanagingtheirsuperannuation,suchasusersofself-managedsuperannuationfunds(SMSFs).
Inthisreport,investmentisdefinedasany'asset acquired for the purpose of producing income and/or capital gains for its owner' (ASX,2017c).Thisincludesinvestmentproperty,cashsavings,andfinancialproductsavailableonafinancialexchangesuchasshares,derivatives,bonds,andexchangetradedfunds.Italsoincludesinvestmentsheldthroughunlisted managedfunds(excludinginstitutional superannuationfunds).
1.2 The value of investing to individuals InvestmentisanimportantsourceofincomeforAustralians.Forthemedianhousehold,approximately20%ofweeklyincomecomesfrominvesting(ABS,2015).3Itprovidesawayforindividualstodiversifytheirsourcesofincome,managefinancialrisk,growtheirwealth,andplantheirretirement.AlmostallAustraliansareinvestorsthroughtheircompulsorysuperannuation,buttheirlevelofparticipationindecisionsaroundtheirinvestmentscandiffersignificantly.
1.2.1 Investment income and wealth creation Wealthcreationisaboutaccumulatingassets.Individualscanbuildtheirwealthmorequicklybysupplementingtheirwageswithreturnsfromtheirinvestments.
3Thisfigureincludeshouseholdsinthedrawdownphaseoftheirinstitutionalsuperannuation.
1.RetailinvestmentinAustralia
Key definitions
Adult population refers to all Australians aged 18 years and older.
Financial advice is advice provided by a financial adviser/planner or full-service/advice stockbroker. This is a subset of Professional Advice.
Lapsed investors are people who have held investments in the past, but do not currently do so.
Never invested are people who have never owned investments.
Non-investors comprise both Lapsed Investors and people that have Never Invested.
On-exchange investments is a term used in this report to refer to listed investments and other financial products available on a financial exchange and held through unlisted managed funds. This includes shares, derivatives, and other products such as bonds and ETFs.
On-exchange investors are people who hold some form of on-exchange investments.
Other investors are people who invest, but not in on-exchange investments. Instead they hold at least one of the following: commercial or residential investment property, cash or term deposits, or other investments that are not on-exchange investments.
Professional advice is advice provided by a financial adviser/planner, full-service/advice stockbroker, lawyer, or accountant.
Share owners are investors who hold shares, either domestically or internationally. This is a subset of on-exchange investors.

ASX Australian Investor Study | 2017
12
Labourincomeisthemainsourceofincomeformostpeople(ABS,2015),butitisrelativelydifficultforpeopletoadjustthisincomequickly.Whilesomeindividualsmayworklongerhoursthisislimitedbythenumberofhoursinaday(andotherphysicallimits).Otherindividualsmay seekouthigherpayingjobs,butcould beconstrainedbytheirqualifications andexperience.
Ontheotherhand,theirmoney(suchassavingsaccruedovertime)maybeeasiertoreallocatetomoreproductiveuses.Individualscanmakeachoicetoallocatetheirmoneyintodifferentassetswithincomegeneratingorcapitalgrowthpotential.Effectively,investingisaboutmakingthemostoftheirmoney,andbydoingsohelpingthembuildwealth morequickly.
Wealthcreationisimportantforsustainingqualityoflife,particularlyinretirement.Afterretiring,individualsrelyontheirsavingsastheirsourceofincome,andhavingaccumulatedmorewealthintheirworkingyearsmeansamorecomfortableretirement.Similarly,wealthaccumulationenablesindividualstoachievefinancialgoalsthroughoutlife,whethertheybehomeownership,payingforchildren’seducation,travelling,orsomethingelseentirely.
1.2.2 Risk management and diversification Withoutinvestmentincome,wages/salarieswouldbetheonlysourceofincomeformany(ABS,2015).Ifpeoplestopworkingorretirewithouthavingaccumulatedsufficientsavings,theymayhavetorelyongovernmentsupport,e.g.agepension.Maintainingtheirdesiredstandardoflivingcouldbechallengingiftheyrelypurelyonwelfarepayments.Investmentallowspeopletodiversifytheirincomestreams,protectagainstlossofasinglesourceofincome,andmaintainahigherstandardoflivinginretirement(ASIC,2017a).
Diversificationisaboutanindividual investormanagingtherisk/rewardtrade-offoftheirinvestmentportfoliotoachievemoreconsistentreturnsovertime,bylimitingtheirexposuretoanysingleasset(ASIC,2017a).Thisconceptofriskmanagementappliestoanindividualwithlabourincomewhoalsoholdsinvestmentpropertyanddividend-payingshares.Thefactthatthisindividualhasmultiplesourcesofincomemeans thattheymaybelessimpactedby aneventsuchasjobloss.
Atthesametime,aninvestorthatspreadstheirfundsacrossawiderangeofassetswilllimittheimpacttotheirportfoliofromthelossofvalueofanyoneasset.Thatis,bydiversifying,individualscanreducethechancethatthevalueoftheirentireinvestmentportfolioisimpactedbya singleevent.
1.3 The value of a well-functioning financial exchange Financialexchangesplayanumberofimportantrolesintheeconomy,includingbeinganinformationsourceandaidingefficientpricediscovery,andaplatformofexchange.Theyprovideindividualswithaccesstocapitalmarkets,assistwithensuringresourcesareallocatedefficiently,givebusinessesacosteffectivewaytoraisecapital,andallowgovernmentstoincreasethedepthofthebondmarket.
Theyalsohaveinstitutionalvalues, providingaframeworkandsetofguidelinesforensuringfinancialtradingisdoneinawaythatmanagesindividuals’riskandstabilityofthesystem.
Australiahaswelldevelopedfinancialmarketswhichofferinvestorsaccessto awiderangeofinvestmentproducts. Thesemarketshavedemonstratedeconomicresilienceandadaptability, makingAustraliaasafe,low-riskenvironmentinwhichtoinvest(Austrade,2017).Morebroadly,theAustralianfinancialservicessectoralsocontributestoeconomicgrowth.In2015,itcontributed$140billiontoGDP(TheTreasury,2016).
Individualscanparticipateinfinancialmarketstodiversifytheirincome,managetheirrisks,andaccumulatewealth.Individualsarealsoabletoaccessinvestmentopportunitiesthattheymayotherwisebeunawareoforunabletoaccess.Forexample,sophisticatedfinancialproductssuchasoptionsandhybridsecuritiesaremadeaccessibleto individualsthroughfinancialmarkets.
Byprovidingtransparencyaroundthespectrumofinvestmentoptionsandthehistoricalreturnandriskofeachoption,exchangesfacilitatedecision-makingbyinvestors.Thiscancontributetoimprovingtheallocationofcapital,asfundsarelikelytobedirectedtotheirmostproductiveuse.Improvingtheproductivityofcapitalcontributestoeconomicgrowth (Musonera,2008).
Exchangesalsocreatesubstantialvalue forbusinesses.Benefitsincludeaccesstoawiderpoolofinvestors,increasedabilitytoraiseequity,andreducedtransactioncostsofcapitalraisingachievedthrough aplatform.

ASX Australian Investor Study | 2017
13
ASX Australian Investor Study | 2017
14
In2016,theAustralianequitymarketgenerallyoutperformedotherdevelopedequitymarketsglobally(RBA,2017a).Atthetimeofwriting,theS&P/ASX200wasatitshighestlevelsincepriortotheglobalfinancialcrisis.Tradingvolumeshaveincreased23%overthe12monthstoMarch,andcontinuetogrow(ASX,2017a).Thedomesticequitymarketcapitalisation isatahistorichigh,reaching$1.8trillion inMarchthisyear(ASX,2017b).
Atthesametime,significantglobaleventshaveinfluenceddomesticmarketsoverthelastyear.TheannouncementsofdecisionsbyBritishvoterstoleavetheEuropeanUnionandbyUSvoterstoelectPresidentTrumpcoincidedwithincreasedtradingvolumesonASX.
Thesetwo,largelyunexpected,developmentsarekeyexamplesofa globalenvironmentcharacterisedbysignificantuncertainty.Geopoliticaldevelopmentsarelikelytocontinueto beafocusforinvestorsinthenear future(InvestmentMagazine,2017).
Theworldofinvestingisfastpacedandrespondstochangequickly.Astheunderlyingenvironmentevolves,sotoo dotheinvestmentspeoplechooseand thewaytheyinvest.
Megatrendssuchasthelowinterestrateenvironment,policychanges,digitalinnovation,anddemographicshiftsareinfluencingthewaythattheAustralianinvestmentmarketoperates.
Thischapteroutlinesthesechangesandhowtheywillinfluenceinvestors’approachtoinvesting.
2.1 Low interest rate environment Globally,interestratesareathistoricallows,evenatnegativelevelsinsomecases (seeChart2.1).
2.Theinvestment landscapeischanging
0
1
2
3
4
5
6
7
8
-1
Chart 2.1: Selected policy interest rates (%)
2007 2008 2009 2010 2011 2012 2013 2014 2015 2016 2017
UK USA Canada EU Japan Australia
Source: RBA

ASX Australian Investor Study | 2017
15
SincetheGFC,Australianmonetarypolicyhasbeeneasedinanattempttostimulategrowth,leadingtoaperiodofsustainedlowinterestrates.Priortothe2008financialcrisis,Australia’scashrateaveraged6.4%.Since2008thishasdroppedto3.1%,andiscurrentlyatarecordlowof1.5%.Chart2.2showsthatinterestratesonbanktermdepositshavefallensignificantlyoverthelast20years,reducingthereturnoncashinvestments.
Thelowinterestrateenvironment hastwomainimplicationsforinvestors.
Firstly,lowinterestrateshaveanimpactonreturnsacrossarangeofinvestments,notjustcash.CreditSuisseanalysisshowsthatlowinterestratesareassociatedwithlowfutureequityreturns(Buttonwood,2013).Asaresult,investorsmaybeforcedtoseekoutriskierinvestmentsinordertomaintainthereturnstheyareusedtointheirportfolios(Yeates,2016).
Secondly,lowerreturnsmeanthatfeesasaproportionofreturnsarehigher–essentiallyithasbecomemoreexpensivetoinvest.Therefore,investorsmayseekout low-feeinvestmentopportunities,forexampleinexchangetradedinvestments(suchasExchangeTradedProducts)ratherthanunlistedmanagedfunds.Alternatively,someinvestorsmayturntofinancialadvicetohelpthemnavigatethisnewenvironment.
2.2 Policy change TheAustralianfinancialsystemhasbeensubjecttoextensivereviewoverthepastfewyears.Whiletheheadlineshavebeendominatedbybankingsectorregulation,Australianpolicymakershavebeenmorewidelyfocused,withinitiativesthathaveimplicationsforfinancialadvisers,recipientsoffinancialadvice,andinvestors.
Opportunitiesandchallengeshavebeencreatedforbothinvestorsandfinancialadvisersthroughthesereforms.Achangingpolicylandscapecreatesuncertaintyandinvestorsmayturntoprofessionalstohelpthemnavigateit.Conversely,someofthesereformsaimtoempowerinvestorsandimprovefinancialliteracy,andthereforeadvisersmaybeusedlessbyinvestorsorindifferentwaystointhepast.
Akeystreamofreformhasaimedtoimprovethequalityofadviceandfacilitateaccesstofinancialadvice.TheFutureofFinancialAdvice(FoFA)legislationwasintroducedin2012andmandatedin2013,withaspectsofitrefinedin2016.FoFAaimedtoimprovethequalityofadvicewhilebuildingtrustandconfidenceinthefinancialadviceindustrythroughreducingconflictsofinterestandbetteraligningtheinterestsoftheadviserwiththeclient.Atthesametime,thereformsalsoaimedtoincreasetheavailabilityoflow-costsimpleadvicetomakefinancialadvicemoreaccessibletothepublic(Treasury,2010).
0
2
4
6
8
10
12
14
16
18
Chart 2.2: Australian banks' term deposit rates (% per annum)
1982
Source: RBA
Notes:Averagesofthefivelargestbanks'rateson$10,000termdeposits,exceptpriortoApril2001,whentheaveragesareforthefourlargestbanks.
1986 1990 1994 1998 2002 2007 2011 2013
1month 3months 6months 1year 3years

ASX Australian Investor Study | 2017
16
The2014FinancialSystemInquiry(FSI)alsorecommendedfurtherreformstostrengthenconsumeroutcomes,andhadaviewthatthecurrentframeworkwasnotsufficienttodeliverfairtreatmenttoconsumersaroundtheperformanceoffinancialproductsandservices.Inparticular,theFSIidentifiedaneedtoaddressshortcomingsindisclosureand financialadvice.
TheGovernment(2015)respondedto theFSIandcommittedtoanumberofreforms,including:
• Raisingthestandardsoffinancialadvisersbyintroducinglegislationwhichprovidesaprofessionalstandardsframework;
• Improvingthecustomerfocusoffinancialproductdesignandmarketbyintroducinglegislationtomakeissuersanddistributorsoffinancialproductsaccountablefortheirofferings;
• DevelopinganewproductinterventionpowerfortheAustralianSecurities&InvestmentsCommission(ASIC)thatcouldbeusedtomodifyproductsorremoveharmfulproductsfrom themarket;and
• Enablinginnovativedisclosureforfinancialproductsbyintroducinglegislationtofacilitategreater useoftechnologyinfulfilling disclosurerequirements.
Morebroadly,ASIChasfocuseditssupervisoryeffortsonconcernsaroundconductandculture,inthecontextofconsumerandinvestorprotectionandmarketintegrity.Thebehaviourof“gatekeepers”–suchaspromotersofinvestmentproducts–willbepaidparticularattention.Investorresponsibilityremainsa“cornerstone”offinancialmarkets,andimprovingdisclosureforconsumersisa keygoalfortheindustryandregulators.
Suchreformsareaimedatimprovingconsumerprotectioninfinancialmarkets.Theywillimpactthewaythatinvestorsreceivefinancialproductinformationandobtainfinancialadvice,andcouldencourageindividualstoinvest,aswellaschangingwhatproductstheychoosetohold.Theaimofthereformsistoimproveinvestorconfidenceinfinancialmarketsandtoincreasetrustin,andaccessibilityof,financialadviceinAustralia.Someoftheseinitiativesmayhelpaddresssomeofthebarrierstoindividualsseekingfinancialadvice(Section4.2).Ontheotherhand,thestricterrequirementsaroundqualificationsoffinancialadvisersandapproachtoprovidingadvicecouldhaveimplications forthesupplyoffinancialadvisersand thepricetheychargeforadvice.
Otherdevelopmentshavesoughttoimproveinvestoraccesstoinvestmentproducts.Forexample,theAsiaRegionalFundsPassport(ARFP)establishesamultilateralframeworktofacilitatecrossbordermarketingoffundsacrosscountriesinAsia.TheARFPisexpectedtocommencebytheendof2017,andwillmeanthatlicencedmanagedfundmanagersareabletotradeacrossnotjustAustralia,butalsoNewZealand,Singapore,theRepublicofKorea,Japan,Thailand,andthePhilippines(APEC,2017).
ThiswillprovideinvestorswithgreateraccesstoinvestmentoptionsintheAsiaregion,andshouldenablegreaterinvestmentflowsbetweenparticipatingcountries.Theincreasedcompetitionfrominternationalexposurecouldalsomeanthatlocalfundmanagersbecomemorecompetitive,increasingefficiencyacross thefinancialmarket.
TheParliamentrecentlypassedlegislationtoenablesmallandmediumbusinessestoseekcrowd-sourcedequityfunding.Thelegislationwillallowunlistedentitiestoadvertisetheirbusinessplansonlicensedcrowdfundingportals.Thiswillopenthemarketuptoretailinvestors,whereitwaspreviouslyonlyavailableto‘sophisticatedinvestors’,andsetsoutvariousinvestorprotectionprovisionsincludinganinvestorcapof$10,000ayear.

ASX Australian Investor Study | 2017
17
Thisreformwillfurtherexpandtheuniverseofinvestmentproductsavailabletoinvestors,andmayhaveimplicationsforinvestorsallocatingmoreoftheirportfoliooutsideoftraditionalinvestments.Italsobroadensthescopeofinformationandproductsthatadvisersneedtobeacross.
Overallthesepolicychangesarelikelytoofferinvestorsmorechoiceandvariabilityinhowandwhattheychoosetoinvestin.
2.3 Digital innovation Digitalinnovationisoccurringatanincreasinglyrapidpace,facilitatingmoreefficienttrading,fasterandbetteraccesstoinformation,andcheaperandwideraccesstoglobalmarkets.
MobilephonesarebeingusedtotradesharesinAustraliamorethaneverbefore.Infactin2015,6outof10Australianonlineinvestorsusedamobiledevicetotrade(InvestmentTrends,2015).Onlinetradingplatformssuchasnabtrade,CommSec,WestpacOnlineInvesting,andHSBCOnlineShareTradingallowcustomerstousetheirphonestobuyandsellshares,viewtheirportfolios,createwatchlists,andobservemarketmovements.Accordingtothissurvey,onlinetradingplatformsarethemostfrequentlyusedtradingmethodamongstAustralianinvestors(seeSection4.3).
Thesedevelopmentsarechangingthewaythatinvestorsconducttheirtradingactivity,andalsohowtheyaccessadvice.TheefficiencyofthesedigitaltechnologiesandAustralians’propensitytoadoptsuchinnovationsmayleadtoashiftawayfromuseofmoretraditionalmethodsoftradingandadvice.
Australiansarestrongadoptersoftechnology,forexample,86%ofAustralianhouseholdsownsmartphones(DAE,2016a),makingAustraliathesecondmostconcentratedsmartphonemarketintheworld(SMSGlobal,2016).Thisisoftenusedasameasureofopennesstotechnologicaladvance,andmayimplythatdomesticinvestorsaremorewillingtoadoptfinancialtechnology(‘fintech’)innovationssuchasroboadvice.
Roboadviceusescomputingprograms togeneratecustomisedinvestmentadvicebasedoninformationaboutanindividual'sportfolio.Thiscanbeanattractive,lowercostalternativetoinperson professionaladvice.
However,thereisuncertaintyamongstsomeinvestorsastothereliabilityoftheadvicegenerated,andusingfinancialadviserswillremainanimportantpartoftheinvestmentprocess.Furthermore,whileroboadvicemaybeabletomoreefficientingeneratingtransactionaladvice,andrecommendsoundinvestments,itreliesontheinvestorknowingwhatinvestmentsupporttheyneed.RoboadviceisdiscussedinmoredetailinSection4.3.2.
Withdigitalinnovationcomesanewconcern:cybersecurity.Astheeconomybecomesmorereliantoncomputingsystems,theimportanceofprotectingthosesystemsfromattackincreases.Cybercrimeisnowthesecondmostreportedtypeofeconomiccrimeinbusiness(behindassetmisappropriation)andisrising(Layer8Security,2016).Thistrendcouldslowthepaceofadoptionofnewtechnologies.
Overall,digitalinnovationislikelytohavemoreofanimpactonthemethodsoftrading,andthewaysinvestorschoosetoaccessadviceabouttheirinvestmentsthanonthetypesofinvestmentstheyhold.
2.4 Demographic shifts Australia’spopulationisageing.TheproportionoftheAustralianpopulationaged65andoverhasalmostdoubledfrom8%in1964to15%in2016(AIHW,2015&ABS,2017b).Decliningfertilityandfallingmortalityratesmeanthatthistrendisexpectedtocontinue,andthenumberofpeopleagedover65willagaindoubleby2055(Treasury,2015a).
Onaverage,olderAustraliansarewealthierandinvestmorethanyoungerAustralians.4 Thisgroupisbecomingalargershareofthepopulation,andtheyhavedifferentpreferencesaroundhowtheyreceiveadvice,executetheirtrades,andwhat theychoosetoinvestin.
TheageingpopulationhasimportantimplicationsfortheriskprofileofAustralianinvestors.AstheGovernoroftheReserveBankofAustraliaputit,'Older workers tend to become more risk averse when it comes to investment decisions…' (Lowe,asquotedinPickering,2016).RiskattitudesinAustraliawillchangeasthepopulationages,andthiswillhaveabigimpactoninvestmentbehaviour.However,resultsfromthisstudyfindtheopposite,atleastinthecontextofinvesting(Chapter5).Eitherway,theageingpopulationwillchangetheoverallmixofinvestmentsheldbyAustralians.
4Averagehouseholdwealthforthoseaged65andoverwas$900,000in2012,and$710,000forthoseaged35-55(GrattanInstitute,2014)

ASX Australian Investor Study | 2017
18
Intheshortterm,anageingpopulationcouldcounteracttheeffectofdigitalinnovationonthewayinvestorsobtainadvice,asolderpeoplearemorelikelytousein-personfinancialadvicethannewtechnologiessuchasroboadvice.However,thistrendcouldlessenasthecurrentgenerationofyoung,technology-savvyinvestorsage.
TheageingpopulationshouldmeanthequantityofinvestmentandtradinginAustraliawillincrease.OlderAustralianshaveexperiencedthelargestincreaseinwealthofanyagegroupoverthepastdecade.Householdsaged65andoverhaveexperienced2.7%annualgrowthinwealthoverthepastdecade,while55-64yearoldhouseholdshaveexperienced1.9%annualgrowthoverthesameperiod(GrattanInstitute,2014).
Food for thought
• Do you have a good understanding of how these changes will impact investors?
• Is your business model geared towards supporting investors as the investment environment and their preferences change?
DemographicchangesintheAustralianpopulationshouldseethetypesofinvestmentsindividualsholdchange,andalsothewaytheyobtainadvice.Forexample,findingsfromthisstudyshowthatolderpeoplearemorelikelytorelyontheirownresearchregardinginvestmentthanyoungpeople.Thissuggeststhatasthepopulationages,useoffinancialadvicedecreases(astheyoungercohortwhoarenotconfidentenoughtorelyontheirownresearchmatureandgainconfidence).Alternativelyitcouldmeanthatfinancialadvisersadapttheirroletobecomelessprescriptive,morelikeasoundingboard totestideaswithorageneratorofideas oninvestmentoptions.

ASX Australian Investor Study | 2017
19

Investor profiles
Next generation Wealth accumulators Retirees
Top 3 financial goals 1. Accumulatingwealth
2. Savingforahomedeposit
3. Savingfortravel
1.Planningforretirement
2.Accumulatingwealth
3.Supplementingcurrent orfutureincome
1.Planningforretirement
2.Supplementing currentorfutureincome
3.Accumulatingwealth
Risk appetite 81%areseekingguaranteed orstablereturns
67%areseekingguaranteed orstablereturns
60%areseekingguaranteed orstablereturns
Return expectations Expectonaveragea8.2% returnontheirinvestments
Expectonaveragea9.2% returnontheirinvestments
Expectonaveragea8.0% returnontheirinvestments
Mix of investments • 44%holdcash
• 31%holdshares
• 25%holdinvestmentproperty
• 22%holdotheron-exchangeinvestments,includingderivatives
• 53%holdcash
• 51%holdshares
• 42%holdinvestmentproperty
• 25%holdotheron-exchangeinvestments,includingderivatives
• 68%holdcash
• 58%holdshares
• 26%holdinvestmentproperty
• 18%holdotheron-exchangeinvestments,includingderivatives
Use of financial advice 37%usefinancialadvice 44%usefinancialadvice 52%usefinancialadvice
Top 3 reasons for using financial advice
1.Obtainadvicetailoredto theirpersonalcircumstances
2.Getinvestmentideas
3.Helpthemdiversifytheirportfoliosandminimiserisk
1.Obtainadvicetailoredto theirpersonalcircumstances
2.Helpthemdiversifytheirportfoliosandminimiserisk
3.Gainaccesstoinvestments theywouldotherwisenot beawareoforabletoaccess
1.Obtainadvicetailoredto theirpersonalcircumstances
2.Helpthemdiversifytheirportfoliosandminimiserisk
3.Helpthemnavigatetheadministrativeandtaxrequirementsofinvesting
Use of robo advice 15%woulduseroboadvice,28%wouldnot,(therestareunsure)
13%woulduseroboadvice,29%wouldnot(therestareunsure)
4%woulduseroboadvice,41%wouldnot(therestareunsure)
Trading methods of investors that have transacted in the past 12 months
1.42%usedanon-advice brokeroronline tradingplatform
2.36%usedanadvice orfull-servicebroker
3.24%usedafinancialplanner
1.65%usedanon-advice brokeroronline tradingplatform
2.21%usedanadvice orfull-servicebroker
3.18%usedafinancialplanner
1.69%usedanon-advice brokeroronline tradingplatform
2.21%usedanadvice orfull-servicebroker
3.13%usedafinancialplanner
Notes:‘Nextgeneration’isdefinedas18-24yearoldinvestors;‘Wealthaccumulators’isdefinedas25-59yearoldinvestors;and‘Retirees’isdefinedtobeinvestorsaged60andover.
ASX Australian Investor Study | 2017
20
3.Whoisinvesting?

ASX Australian Investor Study | 2017
21
Three-fifths(60%)ofAustralianadultsdirectlyholdinvestmentsofsomesort(includingthosenotavailableonafinancialexchange)outsideoftheirinstitutionalsuperannuationfund.Thischapterexamineswhotheseinvestorsare,aswellasprovidingsomeinsightintowhytheremaining40%ofAustralianadultsdo notinvest.
Beforedivingintothedetail,thischapterbeginsbyreviewingsomeofthehigh-leveltrendsininvestmentownership.
3.1 Changes in investment ownership in Australia Ownershipofon-exchangeinvestmentshasremainedbroadlyconsistentsincethe2014study.Therehasbeenanincreaseinyounginvestorshowever,whohavebeenengagingmorewithon-exchangeinvestments.Theproportionof18-24yearoldswhoholdon-exchangeinvestmentshasdoubledinthepastfiveyears.Therehasalsobeenanincreaseininternationalshareownership inthistime.
Around37%oftheadultpopulation heldon-exchangeinvestmentsasofFebruary2017,upslightlyfrom2014.Ownershipwashigheramongmenthanwomen,with44%and31%holdingon-exchangeproductsrespectively.Therateofon-exchangeinvestmentownershiphasbeenfairlystableoverthepastfiveyears,followingasignificantdeclineafter theearly2000s(Chart3.1).
10%
20%
30%
40%
50%
60%
Chart 3.1: Ownership of on-exchange investments, proportion of adult population
Notes: 1986(n=1304),1988(n=2637),1991(n=3018),1994(n=3253),1997(n=1174),2000(n=1200),2002(n=2401),2004(n=2402),2006(n=2405),2008(n=2400), 2010(n=2400),2012(n=2000),2014(n=4009),2017(n=4000)
01985
9% 9%
16%
21%
34%
52%50%
53%
47%
41% 42%
38%36%
37%
1990 1995 2000 2005 2010 2015 2020

ASX Australian Investor Study | 2017
22
3%
4%4% 4%
5%
8%
6% 6%
7%
Thesignificantincreaseinownershipinthe1990smaybepartlyexplainedbythelargeinitialpublicofferings(IPOs)overtheperiod.Forexample,theCommonwealthBankin1991,Qantasin1993,andTelstrain1997(RBA,1997).TheGlobalFinancialCrisis(GFC)in2007-08shookinvestorconfidenceglobally,andsomeinvestorsmaystillberecovering.Atthesametime,recordlowinterestrateshaveledtoincreasedpropertyinvestmentandhighpropertypricesincapitalcities(ABS,2017c).
ASXdataindicatethat,sincethe laststudy(in2014),thenumberofETFs onissueinAustraliahasincreasedby61%,to203.Overthesameperiod,theproportionoffundsundermanagementallocatedtoglobalequityhasincreased by7.7percentagepointsto39.2%.
Ownershipofinternationalshares,boughtdirectlythroughoverseasexchanges,hasreturnedtoitspre-GFCpeak(Chart3.2).Thismaypartlyreflectimprovedappetiteforoverseaslistedinvestmentsaswellasbetteraccess.However,investingdirectlyininternationalsharescanbeexpensive,andmanyindividualsinsteadinvestthroughmanagedfundsorexchangetradedfunds(ASIC,2016a).5
1%
2%
4%
5%
3%
6%
7%
8%
9%
Chart 3.2: International share ownership, proportion of adult population
Notes: 2017(n=4000)
0%2000 2001 2003 2005 20072002 2004 2006 2008 2009 2010 2011 2012 2013 2015 20172014 20182016
5Againstthisbackground,itispossiblethatsomerespondentsmayhavemisinterpretedthequestionandareinpartreportinginternationalsharestheyholdindirectly,forexample,throughexchangetradedproducts(ETPs).

ASX Australian Investor Study | 2017
23
3.1.2 Change in investor profile YoungAustraliansareinvestingmore.Between2012and2017theproportionofinvestorsagedbetween18and24yearsoldthatholdon-exchangeinvestmentshasdoubledtojustover20%,andtherehasbeena15percentagepointincreaseintheproportionof25-34yearoldsinvestinginon-exchangeinvestmentsoverthesameperiod(Chart3.3).Theagedistributionofinvestorshasbecomeflatter,theproportionofeachagerangeinvestingiseveningout.
Theshareofadultsthatownon-exchangeinvestmentshasbeenbroadlyunchangedformoststatesandterritoriesoverthepastdecade(Chart3.4).On-exchangeinvestmentrateshavehistoricallybeen(andcontinuetobe)highestinNewSouthWales(42%in2017),theAustralianCapitalTerritory(40%),andWesternAustralia(40%),andlowerintheNorthernTerritory(26%),Queensland(32%),and Tasmania(33%).
Notes: 2017(n=4000)
10%
20%
30%
40%
50%
60%
Chart 3.3: Age profile of on-exchange investors, proportion of adult population
02008 2010 2012 2014 2016
18-24 25-34 35-44 45-54 55-64 65-74 75+

ASX Australian Investor Study | 2017
24
*DataareunavailableforACTin2008andNTin2010.
Notes:2017(n=4000)
Notes:2017(n=4000)
10%
20%
30%
40%
50%
60%
Chart 3.4: Incidence of on-exchange investors by location, proportion of adult population
0
2008 2010 2012 2014 2017
WAVICTASSAQLDNT*NSWACT*
In2017justover40%ofadultslivinginmetropolitanareaswereon-exchangeinvestorscomparedto32%ofadultsinregionalareas (seeChart3.5).Theshareofadultsincapitalcitiesthatheldon-exchangeinvestmentshasreturnedtoitsdecadehigh.
25%
30%
35%
40%
45%
Chart 3.5: Incidence of on-exchange investors by metro/regional split, proportion of adult population
20172010 2012 20142008
Capitalcities Regionalareas

ASX Australian Investor Study | 2017
25
Notes:2017(n=605)
Investorsusingthismethod Investorsnotusingthismethod
3.1.3 Changes in investor behaviour Non-advicebrokersandonlinetradingplatformshaveremainedthepreferredtradingmethodforinvestors,andhavebecome morepopularsince2014(Table3.1).
Table 3.1: Changes in method of trading, proportion of on-exchange investors who have traded in the last 12 months
Method 2014 2017
Non-advice broker or online trading platform e.g. nabtrade
An advice or full-service broker e.g. Bell Potter
Through a financial planner/adviser
Purchased directly via a prospectus of a company listed on a stock exchange
Through an employee share scheme
Other
58% 65%
15% 22%
16% 17%
17% 11%
8% 4%
4% 1%
Therehasbeenanincreaseintheshareofinvestorsusingbothnon-advicebrokersandtradingplatforms,andfull-servicebrokers comparedto2014.Therehasbeenadeclineintheshareofinvestorsdirectlypurchasinglistedinvestmentsthroughacompanyprospectusandemployeeshareschemes.Digitalinnovationislikelyinfluencingthistrend.Technologicaladvanceshavemadeiteasierformoreinvestorstodirectlyparticipateintradingthroughonlineplatformssuchasnabtrade.
Whilechangestothesurveymeanthatdirectcomparisonwiththe2014resultsarenotpossible,manyinvestorsinon-exchangeinvestmentscontinuenottouseadvicefromprofessionals(Chart3.6).Otherinvestorsusemorethanoneformofadvice;forexample,13%ofinvestorsselectedboth‘financialplanner/adviser’and ‘ownresearch’.
Food for thought
• How is your business responding to the growth in numbers of young investors and self-directed investors?
• Do you promote the use of specific investments, like exchange-traded products, to facilitate easy access to international markets?

ASX Australian Investor Study | 2017
26
Chart 3.6: Investment advice sought by investors, proportion of on-exchange investors
2017
2014
0%
0%
10%
10%
20%
20%
30%
30%
40%
40%
50%
50%
60%
60%
70%
70%
Ownresearch
Personalnetwork(Friends,Family,Colleague)
Financialplanneroradviser
Reading/Listeningtoexpertcommentators
Familyandfriends
None/Donotseekadviceaboutinvestments
Accountant
Financialplanners/advisers
Lawyer
Stockbrokerswhoprovideadvice
Solicitors/Lawyers
Other
Wealthmanagementadvisers
Other
Fullserviceoradvicestockbroker
Accountants
Notes:2017(n=1494)

ASX Australian Investor Study | 2017
27
3.2 The profile of the Australian investor Three-fifths(60%)ofAustralianadultsdirectlyholdinvestmentsofsomesort(includingthosenotavailableonafinancialexchange)outsideoftheirinstitutionalsuperannuationfund.Thissectionexaminesbothon-exchangeandotherinvestors, whotheyareandhowtheyinvest.
3.2.1 What investment structures do investors use? TherearefourmainstructuresthroughwhichAustraliansholdinvestments:
Figure 3.1: Investment vehicles used, proportion of adult population
Investments
ShareoftheAustralianadultpopulationholding:
Investmentsinselfmanaged
superannuationfunds*
Investmentsincompanystructures
Investmentsinfamilytrusts
Investmentsinapersonalcapacity
60% 51% 15% 10% 7%
*Figureislikelytobeoverstatedduetosamplingerror.TheATO’sSMSFstatisticalreport–December2016indicatethataround 6%ofAustralianadultsaremembersofSMSFs
Note: Optionsdonotsumto100%becausemanyinvestorsholdinvestmentsthroughmorethanonestructure;2017(n=4000)
• Investmentsheldintheirpersonalcapacity,eitheraloneorinjointnames
• Investmentsheldinacompanystructurewheretheyareadirectorofthecompany
• Investmentsheldinafamilytrust
• Investmentsheldinaself-managedsuperannuationfund(SMSF),wheretheyareatrusteeormemberofthefund.
Aroundhalf(51%)ofAustralianadultschoosetoinvestintheirpersonal capacity(Figure3.1).

ASX Australian Investor Study | 2017
28
Notes: n=4000
10%
20%
30%
40%
50%
60%
70%
Chart 3.7: Use of investment structures by age, proportion of adult population
0
18-24 25-34 35-44 45-54 55-64 65-74 75+
Company(7%)SMSF(15%) Familytrust(10%)
3.2.2 Which Australians are investing? TheproportionofAustralianswithpersonalinvestmentsincreaseswithage,whileuse ofotherstructurestypicallyreflectstheir usefortaxplanningandother purposes(Chart3.7).
Ofinvestorsholdinginvestmentspersonally,younginvestorsaretheleastprominent(Chart3.7).However,investingisbecomingmorecommonamongyoungpeople(Section3.1.2).
However,theindustrymaynotbeadaptingtothepreferencesofthisgroupquicklyenough.Younginvestorsaremoredigitallysavvy,andwhiletheadventofdigitalwealthadvice(i.e.roboadvice)offersopportunitiesforbothinvestorsandfinancialadviserstotakeadvantageofdigitalinnovation,take-upgenerallyhasbeenlimited(Section4.3.2).Thisismostlyduetoalackofknowledgeabouttheseproducts,whichsuggeststhattheinvestmentindustrymaynotbedoingenoughtoeducateinvestorsaboutthem(andraisesquestionsaboutwhethertheseinnovationstrulymeetinvestors’needs).
Atthesametime,andcontrarytoconventionalexpectations,younginvestorsalsoappearmoreriskaversethanolderinvestors–with4in5younginvestorspreferringguaranteedorstableinvestmentreturns(Section5.2).Financialproductdevelopersandfinancialadviserscouldseektobettertailortheirproductsandadvicetomeetthisneed,forexample,byconsideringcapital-protectedproducts.
Thecharacteristicsofyounginvestors arediscussedfurtherinSection3.2.3, andinBoxA.
Personal(51%)
ASX Australian Investor Study | 2017
29
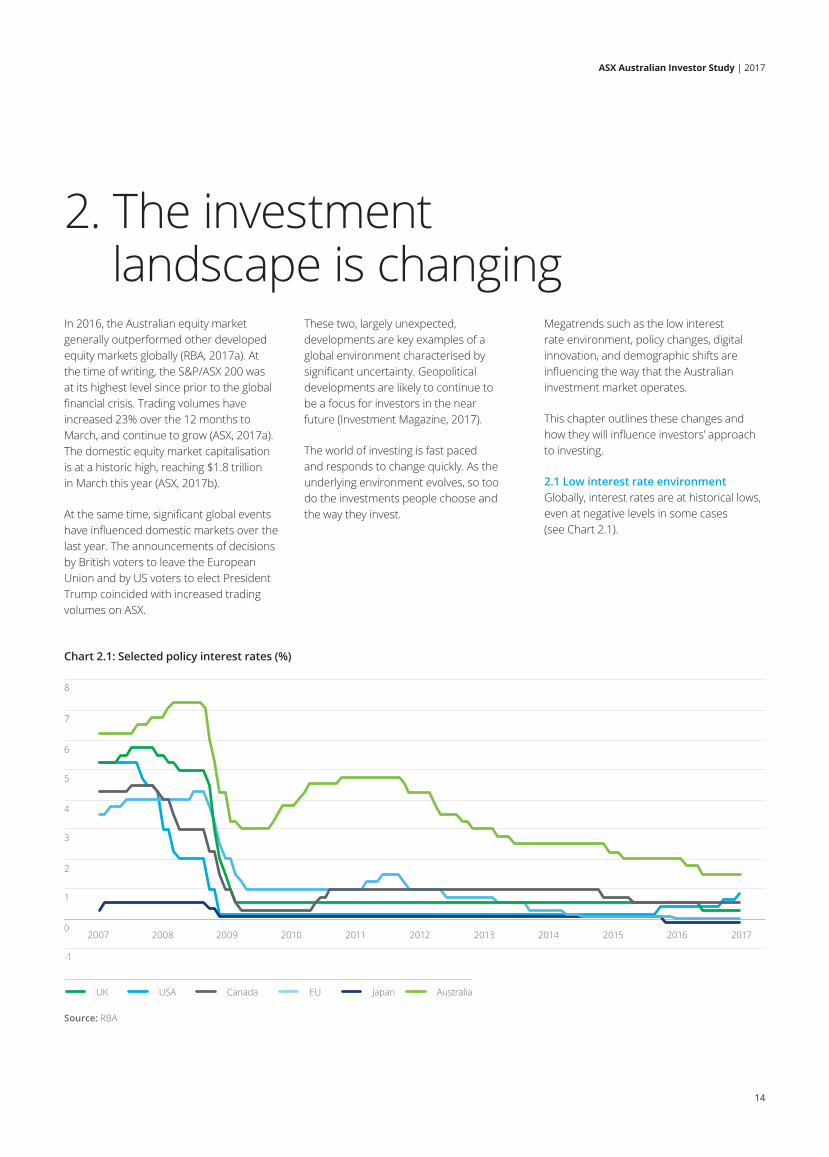
Theproportionoffamilytrustinvestorsdeclineswithage:17%of25-34yearoldshaveafamilytrust,butjust4%ofthose65andabovedo.Thissuggeststhatfamilytrustsare,insomecases,beingusedasameansofachievingamoretaxeffectiveoutcomeforthefamilybyredistributingincometofamilymembersthathavelowerincomes,suchasyoungerfamilymembers.
TheuseofSMSFsisrelativelystableacrossallagegroups,althoughthismaybecapturingyoungerinvestorswhoaremembersofafamilySMSF.Chart3.8showstheATO’srecordofuseofSMSFsbyagecomparedwithwhatwasfoundinthissurvey.ThissurveyfoundahigherproportionofyoungpeoplewithSMSFsthanwhatisrecordedbytheATO.6
Source: ATO;surveyfindings
5%
10%
15%
20%
25%
30%
Chart 3.8: Use of SMSFs by age
018-24 25-34 35-44 75+45-54 55-64 65-74
ATO ASX
6ThissamplingerrorislikelythereasonSMSFuseisoverstatedinthissurvey.
Companystructuresaremostoftenusedtorunabusinessalthoughinsomecircumstancesmayalsobeusedforinvestmentpurposes.Thismaypartlyexplainthefactthatthesestructuresaremorecommonlyusedamonginvestors ofworkingage.
ASX Australian Investor Study | 2017
30
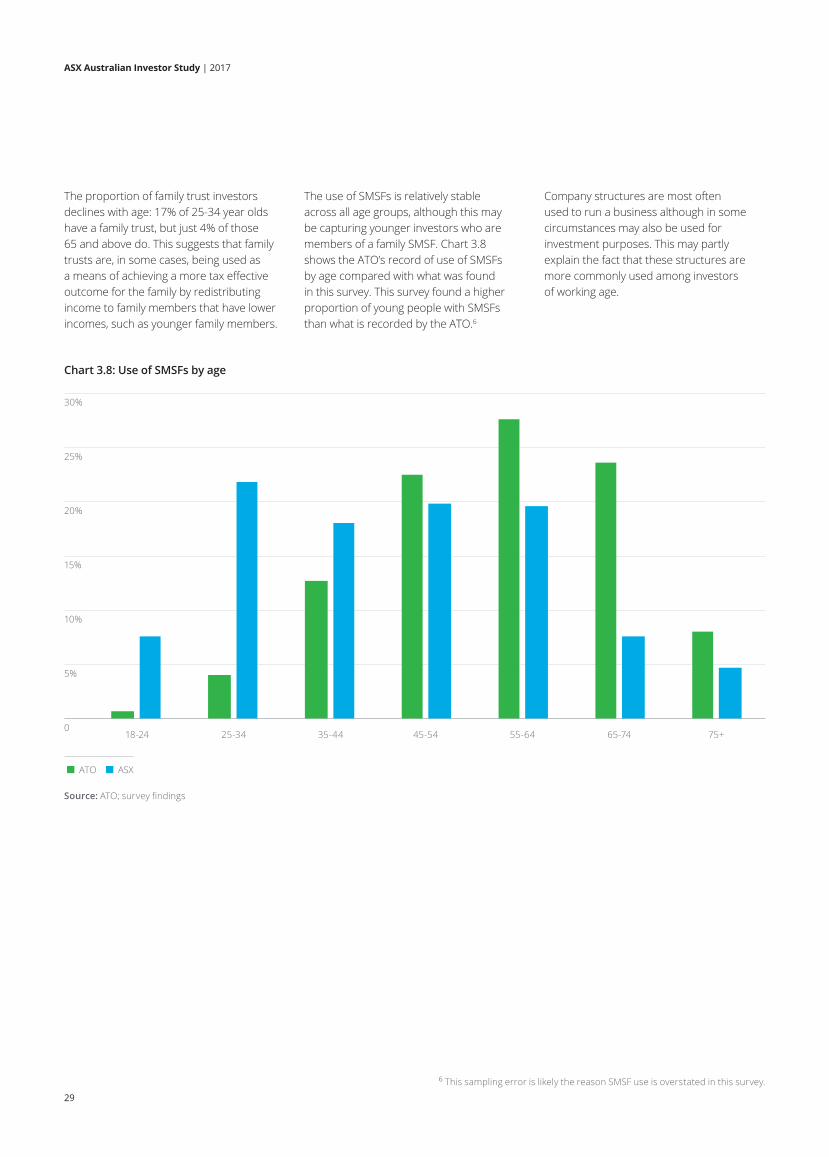
3.2.3 Next generation Theproportionof18-24yearoldindividualsinvestinghasdoubledinthepastfiveyears.AnannualsurveyofmillennialattitudesbyDeloitteshowsthatwhilein2015and2016,millennialswerepessimisticaboutthefuture,andgettingmoreso,thistrendhasflippedin2017andmillennialsarenowcautiouslyoptimisticaboutthefuture(Deloitte,2017).7Astheiroverallconfidenceintheeconomycontinuestoimprove,thismayopenthedoortomoreyoungpeoplebeingopentoinvesting.
Nonetheless,despitethisrecentgrowthinparticipationtheyremainunderrepresentedasinvestors;thisagegrouprepresentsaround12%ofthetotalpopulationbutunder9%ofallinvestors.
Againstthisbackground,itisusefultounderstandthecharacteristicsofindividualswithinthisagegroup.Thissectionidentifiessomeofthecharacteristicsofthese younginvestors.
MostyounginvestorsareatleastYear12graduates,withalargesharebeingtertiaryeducated(Chart3.9).
Chart 3.9: Highest education qualification, 18-24 year old investors
Year12/Higherschoolcertificate
Primaryschool
Tradescertificate/Diploma
Year10/Schoolcertificate
UniversityDegree
PostGraduateDegree
Don'tknow/Unsure
0% 5% 10% 15% 20% 25% 35%30% 40%
Notes:n=207
7TheDeloitteMillennialsSurveydefinesamillennialassomeoneborninorafter1982.Thiscapturesawidercohortthanthe18-24year oldsreferredtointhissectionas‘younginvestors’.

ASX Australian Investor Study | 2017
31
Chart 3.11: Top employing industries, 18-24 year old investors
Chart 3.10: Employment status, 18-24 year old investors
Otherservices
Retailtrade
Educationandtraining
Professional,scientific,andtechnicalservices
Administrativeandsupportservices
Artsandrecreationservices
Accommodationandfoodservices
Rental,hiring,andrealestateservices
Healthcareandsocialassistance
Construction
Transport,postal,andwarehousing
0% 2% 4% 6% 8% 12%10%
Notes:n=207
Notes:n=207
Inpaidemployment/self-employed Notinpaidemploymentorself-employed
Ofthoseyounginvestorsthatareinpaidemploymentorself-employed,mostworkinthetradeorprofessional servicesindustries(Chart3.11).
59%
41%
Mostinvestorsinthisagegroupareinsomekindofpaidemploymentorareself-employed(Chart3.10).

ASX Australian Investor Study | 2017
32
5%
10%
15%
20%
25%
Chart 3.12: Gross household income per year, 18-24 year olds
0 Lessthan $20,000
$20,000-$39,999
$40,000-$59,999
$60,000-$79,999
$80,000-$99,999
$100,000-$149,999
$150,000-$199,999
$200,000-$299,999
Over $300,000
Don'tknow /Unsure
Reflectingtheearlystageoftheirworkinglife,individualsinthisagegrouptypicallycompriselowerincomehouseholds. Onaverage,younginvestorshavehigherhouseholdincomescomparedtonon-investors(Chart3.12).
Notes: Totalinvestors(n=207);totalnon-investors(n=485)
Shareoftotalinvestors Shareoftotalnon-investors

ASX Australian Investor Study | 2017
33
10%
20%
30%
40%
50%
60%
Chart 3.13: Value of total household assets, 18-24 year olds*
0
Asindividualsmatureandtheirincome andwealthgrows,theywillbemorelikely toinvest.Nonetheless,thisdoesnotmeanthat18-24yearoldindividualscouldnotinvestmoreatthisstage.Professionaladviserscanplayaroleineducatingyounginvestors.However,only37%ofyounginvestorsusefinancialadvice,compared to45%ofallinvestors(seeSection4.2).
Oftheyounginvestorsthatdonotuse anyprofessionaladvice,thetoptwomost citedreasonsweretheybelievedthat:
1. Advicewastooexpensiveforthem toobtain;and
2. Theirinvestmentwastoosmallto needadvice.
AccordingtoGeorgeLucas,managingdirectorofAcornsGrow,millennialsdo notunderstandtheimportanceofengagingwithfinancialprofessionals(Lucas,2017).Theytendtopreferonlineengagement,andwhiletheyarenotcurrentlylookingforstrictfinancialguidance,theywilllookformoreadviceastheygetolder.Itisimportantforadviserstoadapttodigitalplatformsnow,sothatmillennialswillbemorecomfortableseekingadvisersovertime.
WealthEnhancersPtyLtd,afinancialadvisoryfirmwithafocusonyoungerinvestors,hasfoundthatyounginvestorsarecostconscious–manyfeelthatadviceistooexpensive,particularlythosewithsmallerportfolios.BoxAcontainsfurtherviewsfromWealthEnhancersPtyLtd.
Under $100,000
$100,000- $299,999
$300,000- $499,999
$500,000- $749,999
$750,000- $999,999
$1,000,000- $1,999,999
$2,000,000ormore
Don'tknow /Unsure
*Excludesvalueofthefamilyhome,carandinstitutionalsuperannuationbalance
Notes: Totalinvestors(n=207);totalnon-investors(n=485)
Shareoftotalinvestors Shareoftotalnon-investors
Food for thought
• Does your business model cater for investors at all life stages?
• Are you developing low cost entry level products to cater for investors just starting out?
• How will you help educate young investors about the pros and cons of investing and of the value of professional financial advice?
Inlinewiththedistributionofhouseholdincomesacrossthisagegroup,younginvestorsaretypicallywealthierthan non-investors(Chart3.13).

ASX Australian Investor Study | 2017
34
Box A: Wealth Enhancers Pty Ltd
Wealth Enhancers is a financial advisory firm catering predominantly to younger investors. For their clients, getting value is front of mind and they are conscious of the cost of advice. Many feel that they may not have enough money available to invest to warrant getting advice on how to invest well.
Among those using advice, there are a wide range of financial goals. Some are saving for education, a wedding, starting a business, while others are looking for wealth accumulation or income replacement in order to start a family. However, for almost everyone, investment is about feeling more secure, having a buffer.
Wealth Enhancers considers there to be three main barriers to investing for Gen Y: a lack of confidence, negative prior experiences, and a misunderstanding as to the amount of money required to get started.
• Many young people are not confident in their ability to invest well, and for those who think advice is too expensive, this may not be easy to overcome
• Some young investors may have invested before, but were overly speculative, and subsequently lost money. This experience has been discouraging to them, and made them nervous to invest again
• Many Gen Y investors have a misconception that investment must be done with a large sum of money, and do not understand that they can start building their portfolio with small amounts
Advisers at Wealth Enhancers have also noticed that many Gen Y investors are open to the idea of borrowing to invest. At the same time, some are also using equity investments as a short term tool in order to save for a deposit and enter the housing market.
In Wealth Enhancers’ experience, robo advice has not been something that Gen Y investors have been well aware of. Wealth Enhancers have suggested robo advice as an alternative source of advice to those investors that are likely to value its cost-effectiveness.

ASX Australian Investor Study | 2017
35
3.2.4 The rise of SMSFs SMSFsallowinvestorstohavegreatercontrolovertheirsuperannuation,somethingthatmanyinvestorswant(seeChapter5).ThenumberofSMSFsinAustraliaisgrowingrapidly,andissettocontinuetodosointothefuture.InDecember2012,therewerearound491,000SMSFsinAustraliacomparedtoover585,000today(ATO,2017).MoreinvestorswilluseSMSFsinthefuture. Some30%ofinvestorsthatdonot currentlyuseanSMSFintendtoset oneupinthefuture.
Why do investors use SMSFs? SMSFinvestorshavelongtermgoals broadlyinlinewiththepurposeofsuperannuation–58%ofSMSFinvestorschoosesavingforretirementasagoal, and55%selectedwealthaccumulation.Chart3.14presentsabreakdownofthe topfivegoalsamonginvestorsthatuseSMSFs(respondentswereaskedtorank uptothreegoalsinorderofimportance).
ResearchbyAMPCapitalshowsthat 56%ofSMSFtrusteesestablishedtheirSMSFinanefforttohavemorecontrol overtheirinvestments,and32%establishedthemsothattheycouldchoosespecificsharestoinvestin(AMP,2017).
ThedesireforgreatercontrolovertheirinvestmentportfolioisacommoncharacteristicofinvestorsthatuseSMSFs.Assuch,SMSFinvestorsareengagedinvestors,andusefinancialadviceforguidanceratherthaninstruction.
ClassLimited(BoxB),whosesoftware isusedbyprofessionalstoadviseSMSFs, hasalsofoundthatSMSFinvestorsareusingtheflexibilityofthisstructureto investinalternativeproducts.Thiscouldbearesultofthelowinterestrateenvironment,whereinvestorsaresearchingforwaystoearnhighreturnsoutsideoftraditionalinvestmentoptions.
Notes: n=607
5%
10%
15%
20%
25%
30%
Chart 3.14: Top 5 goals of SMSF investors, proportion of SMSF investors
0
Rank1 Rank2 Rank3
Retirement Wealth accumulation
Supplementing income
Travel Rainyday saving

ASX Australian Investor Study | 2017
36
SMSF investors’ profile Asdiscussedearlierinthischapter,SMSFinvestorsarefairlyevenlysplitfromanageperspective,andaremorelikelytobeestablishedbypeoplewithhigherhouseholdincomeandassets.
TheriskprofileofSMSFinvestorsissimilartothatofinvestorsmorebroadly. MostSMSFinvestorsareseekingstable,reliablereturnsasopposedtovariability.
Chart3.15showsthemake-upofSMSFportfolios.Cashisthemostcommonlyheldasset(51%ofSMSFinvestorsreportholdingcashintheiraccount),followedbysharesandthenotheron-exchangeinvestments.
Box B: Class Limited
Class Limited creates innovative software used by accountants and financial advisers to service SMSFs. Its software is currently used to administer over 120,000 portfolios across Australia.
Class cites the desire for control as the number one reason that investors use SMSFs.
An SMSF opens the door to more flexible uses of an investor’s superannuation balance. For example, Class says that some SMSFs are used by clients to invest in their own business.
Class says that SMSF investors are bold and open to alternative investment opportunities. One example is a recent trend observed by Class that some SMSFs are investing in peer-to-peer (P2P) lending platforms. On average, when SMSFs invest in these platforms, they invest far more than other investors do – in many cases five times as much as a typical investor. This trend has been so strong that Class has begun to partner with P2P platforms (Rate Setter, and SocietyOne–underway) in order to make it easier for SMSFs to invest.
Class notes that SMSF clients typically look for advice rather than instruction, as these are engaged investors. At the same time they are also looking for value. In this context, Class expects that technology such as robo advice will become increasingly popular amongst SMSF investors.

ASX Australian Investor Study | 2017
37
Chart 3.15: Investment products held in SMSFs, proportion of SMSF investors
0% 10% 20% 30% 40% 50% 60%
Cash
Shares
Property
Otheron-exchangeproducts
Unlistedmanagedfunds
Notes: n=607‘Otheron-exchangeproducts’isdefinedinChapter1inthedefinitionsbox,aswellasinAppendixB.
Whilethesurveyfoundthat15%ofAustralianadultshaveanSMSF,thisislikelyanoverestimate.TheAustralianTaxationOffice estimatesthenumberofSMSFsinAustraliaataround585,000,withjustover1.1millionAustraliansmembersofanSMSF(ATO,2017).
Thisnumberislikelytocontinuetogrow.OfthoseinvestorsthatdonotuseanSMSF,whenaskedabouttheirfutureintentions, 30%ofthisgroupplantosetoneupinthefuture.
Who advises SMSF investors? Chart3.16showsthatSMSFinvestorsaremoreinclinedtouseprofessionaladvicethaninvestorsmorebroadly,andwhile doingtheirownresearchisstillthemostpopularoption,fewerSMSFsrelyonthisthaninvestorsmorebroadly.8
Notes: Respondentscouldselectuptothreeanswers,n=2391
5%
10%
15%
20%
25%
30%
35%
40%
Chart 3.16: Advice channels used by SMSF investors, proportion of SMSF investors
0
SMSF Otherinvestors
Fullserviceoradvicestockbroker
Financialplanner oradviser
Accountant Lawyer FamilyandFriends
Idomyownresearch
8Professionaladvicereferstopaidadvicefromafinancialadviser,afullservicestockbroker,alawyer,oranaccountant.

ASX Australian Investor Study | 2017
38
ThegreateruseofadvicemaybeduetothemorecomplexnatureoftheadministrativeandtaxationrequirementsofestablishingandmanaginganSMSF.InvestBluePtyLtd(afinancialadviser)foundthattheirclientsoftenrequireassistancewiththeadministrativesideofinvesting.BoxChasmoredetailonthetypesofSMSFinvestorsthatseekadviceandwhattheytypicallyinvestin.
Whenquestionedonwhytheyusefinancialadvice,SMSFinvestorsnominatedthreemainreasons:9
• 25%said–“Myadviserprovidesmewithadvicetailoredtomypersonalcircumstances”
• 23%said–“Myadviserhelpsmenavigatetheadministrativeandtaxrequirementsofinvesting”
• 22%said–“MyadvisergivesmeaccesstoinvestmentsIotherwisewouldn’tknowaboutorhaveaccessto”
9Financialadvicemeanseitherusingafullserviceoradvicestockbroker,orafinancialplanneroradviser.
Box C: Invest Blue Pty Ltd
Invest Blue is a financial advice practice with 14 offices located in rural and coastal locations across Queensland and NSW. They provide financial advice to people at all stages of life, including SMSF investors.
Among their clients, managing administrative compliance is the main advice sought. Few SMSFs are completely self-run, most use some form of advice, either for navigating compliance or to get investment choice advice.
Invest Blue advisers work with three broad types of SMSF investors: young accumulators, pre-retirees, and retirees. Each of these types of investors have different goals and therefore different investment portfolios.
Young accumulators in their late 30s or early 40s are typically high-income individuals (or couples). Given they have a fair amount of time before they need to access their super balances, they are typically advised to invest in growth assets. Because of their age they are unlikely to have large superannuation balances, so diversification is a challenge. Invest Blue uses a range of on-exchange products to help them diversify within their constraints, such as exchange-traded funds.
Pre-retirees invest more conservatively than young accumulators. This is because they have less time available before they begin to access their super balance, and as such they are advised to invest around 30% of their funds in defensive assets. A common investment among this group is commercial property, particularly among the self-employed. Some choose to purchase the premises from which their business is run.
Retirees are advised to invest for moderate growth – with around half growth assets and half defensive assets. This is to minimise the risk that their balances will drop at the stage of life where they rely, at least to some extent, on their SMSF for income. Fixed income assets such as corporate bonds are commonly used. Given the low interest rate environment, term deposits (which used to make up a large part of their portfolios) are now not recommended.
Invest Blue sees technology playing an important role in advising all three of these groups in the future. It will improve the customer experience, such as by improving real-time reporting, and allowing investors to check their balance at their convenience. At the same time it could lower the cost of advice.

ASX Australian Investor Study | 2017
39
Future SMSF users OfthoseindividualsthatdonotcurrentlyuseanSMSF(investorsandnon-investors),30%areplanningtoestablishan SMSFinthefuture,13%ofthemwithinthenextyear.Itmaybeusefultounderstandwhothesepeopleare.
Most(65%)ofthesepotentialSMSFusersalreadyinvestelsewhere,eitherinon-exchangeproductsorotherinvestmentproducts.
Theyaresplitevenlyalonggenderlines,butdovarybyage.AsChart3.17shows,potentialSMSFinvestorsaregenerallyyounger, 36%ofthemareunder30.GiventhatSMSFsareestablishedbeforeretirementitisnotsurprisingsofewofthesepotentialSMSF investorsareover60,butitisnoteworthythatthereissignificantinterestamongthoseatveryearlystagesoftheircareer.
Notes: n=1017
5%
10%
15%
20%
Chart 3.17: Age of potential SMSF investors, proportion of non-SMSF investors
0 18-24 25-29 30-34 35-39 40-44 45-49 50-54 55-59 60-64 65-74 75+

ASX Australian Investor Study | 2017
40
5%
10%
15%
20%
25%
Chart 3.18: Income of potential SMSF investors, proportion of total
0 Lessthan $20,000
$20,000-$39,999
$40,000-$59,999
$60,000-$79,999
$80,000-$99,999
$100,000-$149,999
$150,000-$199,999
$200,000-$299,999
Over $300,000
Don'tknow /Unsure
Notes: Totalinvestors(n=207);totalnon-investors(n=485)
PotentialSMSFinvestors Allsurveyrespondents
Food for thought
• How can you help investors think through whether an SMSF is right for them, including educating them on portfolio construction, as well as administrative and regulatory requirements?
• Given the expected growth of SMSF use, can you afford not to be an SMSF expert?
3.3 Understanding potential investors Non-investorsarepotentialinvestors.Understandingthebarrierstheyfaceandtheirattitudestoinvestingwillhelptorealisethatpotential.Themajorityofnon-investors(54%)statethatalackofmoneyisthereasontheyhaveneverinvested.Thisisfollowedby33%ofnon-investorsquotingalackofconfidenceintheirability.Thisindicatesthatlackoffundsandconfidencearekeycharacteristicsoftheseinvestors.
Manynon-investorsareintheyoungeragegroups,andassuchdonotyethavetheincometoinvest.Ofthe18-34yearoldswhodonotinvest,61%haveanannualhouseholdincomeoflessthan$80,000.Onequarterofnon-investorsareundertheageof35,comparedwithjust11%over65.Itislikelythatmanyoftheseyoungpeoplewillinvestinthefuture,astheirincomesgrow,providededucationandadviceareavailabletothemwhentheyarereadytobegin.Thissectionfocusesonwhatdrivesnon-investorsandformerinvestorsin on-exchangeproducts(whowerefer toaslapsedinvestors),andhowthey differtoinvestors.
PotentialSMSFinvestorsare,onthewhole,mediumincomeearners(Chart3.18).RelativetotheAustralianaverage,potentialSMSFinvestorsareslightlylesslikelytobelowincomeearners(39%earnlessthan$80,000relativeto43%ofthepopulation)andslightlymorelikelytobemediumorhighincomeearners.

ASX Australian Investor Study | 2017
41
3.3.1 Awareness, knowledge and attitude Non-investorshavedifferentfinancialgoalstoinvestors.Whileinvestorsarefocusedonthelongterm(savingforretirement,wealthaccumulation,supplementingincome),non-investorsareinterestedintheshorterterm.Topgoalsincludetravel,payingoffdebt,andsavingforarainyday(Chart3.19).
10%
20%
30%
40%
50%
Chart 3.19: Top financial goals among non-investors, proportion of non-investors
0% Payingoffdebt RainydaysavingTravel Homedeposit Retirement
Notes: n=1609
Total Rank1 Rank2 Rank3
Theirawarenessofalternativeinvestmentproductsislowercomparedtoinvestors(Chart3.20).Almosthalfofallnon-investorswerecompletelyunawareofalltheseproducts.Ofthosenon-investorsthatweresomewhataware,theorderofawarenessissimilartothat ofinvestors.
Chart 3.20: Awareness of on-exchange investments, proportion of never invested
Government/CorporateBonds
Noneoftheseproducts
Options
Futures
InfrastructureFunds
A-REITs
HybridSecurities
LICs
InstalmentsorOrdinaryWarrants
ETFs
mFund
0% 10% 20% 30% 40% 50%
Notes: Askedonlyofthosewhohaveneverinvested,n=1203

ASX Australian Investor Study | 2017
42
Individualsthathaveneverinvestedaremoreriskaversethanthosethathave(Chart3.21).Overonethird(36%)ofthosewhohaveneverinvestedwouldseekguaranteedreturnscomparedwith18%ofinvestors.Onepossibledriverofthisisthatinvestors(andlapsedinvestors)haveabetterunderstandingofinvestingandarethereforemorecomfortable,makingthemlessriskaversethanthosewhohaveneverinvested(Kanetal.,2016).
Whenaskedaboutadvice,58%ofthosewhohaveneverinvestedsaidthattheywouldseekprofessionaladvicetohelpmanagetheirinvestmentsiftheyweretoinvest,andonly13%saidtheywouldnot.
Chart 3.21: Attitudes to risk, by investment group
Highvariabilityofreturns
Guaranteedreturns
Moderatevariabilityofreturns
Stablereturns
0% 10% 20% 30% 40% 50%
Notes: n=4000
Investors Lapsedinvestors Neverinvested

ASX Australian Investor Study | 2017
43
Manyindividualsthathaveneverinvestedsaidthattheythoughtitcosttoomuchtobegininvesting.Whenaskedhowmuchtheyactuallythoughttheywouldneedtobegininvesting,thedistributionwasfairlyeven.Around15%oftheseindividualseachsaidthattheywouldneedlessthan$2,000,between$2,000and$5,000,andbetween$5,000and$10,000.Justonequarterofnon-investorsexpectedtoneedmorethan$10,000tobegininvesting.Another25%oftheseindividualsdidnotknoworwereunsure.Youngindividualsthatneverinvestedalsoprovidedanswersinlinewiththisbroadertrend–mostthoughttheywouldneedlessthan$10,000.Thereareopportunitiesheretobotheducateandinformthesepotentialnewinvestorsofproductsthataresuitableforthosewithoutalargeamountofcapital.
Whenaskedwhylapsedinvestorsnolongerinvest,mostsaidthatitwasduetoachangeintheirpersonalcircumstances(Chart3.23). Thiscouldincludeanythingfromachangeinemploymentstatustoanincreasedneedfordisposablefundsafterhavingchildren.
Chart 3.22: Reasons for never having invested, proportion of never invested
0% 10% 20% 30% 40% 50% 60%
Ithinkitcostsalottobegininvesting
I'dneedtotakeprofessionaladviceanddon'tknowhowtofinditorhowmuch itcosts
Thevolatilityofthesharemarket andeconomyconcernsme
Idon'thaveenoughmoneytoinvest
I'mnotinterestedininvesting
I'mnotconfidentthatIknowenough aboutinvestingtomakethebestdecisions
Idon'thaveenoughtimetodoresearchormanageinvestments
Notes: n=1203
Other
Couldnotaffordadvice
Governmentpolicychanged
Lackoftime
Marketvolatilityconcerns
Investmentgoalschanged
Lostmoneyinthemarket
Personalcircumstanceschanged
Chart 3.23 Reasons for ceasing investment, proportion of lapsed investors
0% 10% 20% 30% 40% 50% 60%
Notes: n=406
3.3.2 Barriers to investing Thosewhohaveneverinvestednominatedanumberofreasonsfornotinvesting(Chart3.22).Themainreasonsareaperceivedlackoffunds,alackofconfidence,anduncertaintyastohowtogetadvice.Encouragingly,alackofinterestwasrankedverylowonthelist.

ASX Australian Investor Study | 2017
44
Around84%oflapsedinvestorssaidthattheyplantostartinvestingagainatsomepoint,with41%ofthisgroupintendingtoinvestagainwithinthenexttwoyears.Whattheyneedinordertobegininvestingagainisfewerfinancialcommitments,confidenceinfuturereturns,andmarketstability(Chart3.24).Thesurveydidnotaskwhatthesefinancialcommitmentswere,buttheycouldincludearangeofthingssuchaspayingofftheirmortgageorotherdebt,ortheirchildren’seducationexpenses.
Chart 3.24: What lapsed investors need before they will invest again, proportion of lapsed investors
0% 10% 20% 30% 40% 50% 60%
Confidenceinfuturereturns
Marketstability
Moretimetoresearch
Stablegovernmentpolicy
Fewerfinancialcommitments
Moreknowledgeaboutinvesting
Notes: n=406
Thesefindingssuggestthatthebarrierstonon-investorsbecominginvestorsaregenerallysurmountable.Formorethanhalfofnon-investorsalackoffundsiswhatpreventsthemfrominvesting,butimprovedfinancialliteracymayhelpalargeminoritytostartinvesting.Additionally,beingsureofhowtogetfinancialadvicemayalsoincreaseinterestininvestingforsome.Theinvestmentindustrycouldreviewthetypesof‘entry-level’productsandservicesthattheyareoffering,andwhethertheyaresuitablefornewinvestors.
Food for thought
• How can you engage individuals that have never previously invested or have lapsed?
• Do you offer investment products with low entry costs and appropriate risk profiles for new investors?

ASX Australian Investor Study | 2017
45

ASX Australian Investor Study | 2017
46
Investmentinon-exchangeinvestments ismorecommonthaninvestmentinanyotherproduct(includingcashsavings)– 62%ofinvestorsholdsomeformof on-exchangeinvestment.Ofthese,40%haveactivelytradedinthepastyear.Investorsareincreasinglyusingtechnologiessuchasonlineplatformstobuyandsell,howeverthereisstillasignificantportionofinvestorswhoprefertousefull-servicestockbrokersandothermoretraditionalmeansoftransacting.Thischapterlooksat whatAustralianschoosetoinvestin,and providesanoverviewofattitudestoadviceandmethodsoftradingamongstinvestors.
4.1 Australian investors’ portfolios are not very diversified On-exchangeinvestmentsareheldbymoreinvestorsinAustraliathananyotherinvestment.Almosttwothirds(62%)ofinvestorsholdsomeformofon-exchangeinvestment.Thiscouldbepartlyattributabletothelowinterestrateenvironment(Section2.1)–holdingcashisnotveryrewardinginthecurrentmarket.
Chart 4.1: Investments held by investors, proportion of investors
On-exchangeinvestments
Cash
Property
Unlistedmanagedfunds
Other
0% 10% 20% 30% 40% 50% 60% 70%
Notes: n=2391
4.WhatareAustralians investinginandhow?
Sharesarebyfarthemostcommonlyheldon-exchangeinvestment;just24%ofinvestors(or14%oftheadultpopulation)ownother on-exchangeinvestments.Ofotheron-exchangeinvestments,listedinvestmentcompaniesarethemostcommonproducttoinvestin,followedbyexchangetradedproducts(Chart4.2).

ASX Australian Investor Study | 2017
47
Chart 4.2: Other on-exchange investments held by investors, proportion of investors
0% 1% 2% 3% 4% 5% 6% 7%
ListedInvestmentCompanies(LICs)
ExchangeTradedProductse.g.exchangetradedfunds(ETFs)
Other,e.g.Gold
AustralianRealEstate InvestmentTrusts(A-REITs)
InfrastructureFunds
mFund
Optionsand/orFutures
HybridSecurities,e.g.FloatingRateNotes
GovernmentbondsorCorporatebonds
Notes: Includesdomesticandinternationalholdings;n=561
Theuseoftheseproductshasincreasedfromthe2014tothe2017survey.LICsforinstancearenowheldby3.9%ofthepopulation,morethandoublethe2014figureof1.1%.Overthesameperiod,thenumberofLICsoperatingonASXhasincreased88%to96(ASX,2017d).
Notallon-exchangeinvestorsactivelybuyandsell.Themajority(60%)havenotboughtorsoldintheprevious12months.Theseinvestorsmaybeemployingpassiveinvestmentstrategies,suchasholdingontoselectedsecuritieswiththepurposeofachievingcapitalgrowthoverthelong-term.Thisbroadlyalignswiththelongtermfocusoftheirinvestmentgoals(seeSection5.1).
Chart4.3showsthatthecompositionofinvestorportfoliosarenotheavilyinfluencedbyhouseholdincome–withcash,shares,andpropertybeingthemostcommonlyheldassets.Higherincomehouseholdstendtoinvestmoreinsharesandproperty,possiblyderivingtaxbenefitsfromholdingpropertyinparticular.
Thisconcentrationofinvestors’portfoliosonlyreflectstheirholdingsoutsidetheirinstitutionalsuperannuationfund,and couldbebalancedoutdependingonhowtheyinvestintheirsuperannuationfund. Ontheotherhand,superannuationassetsareprimarilyheldinequities(ABS,2017a).

ASX Australian Investor Study | 2017
48
Notes: n=2391
10%
20%
30%
40%
50%
60%
70%
Chart 4.3 Investments held by household income, proportion of investors
0
Cash Shares Property Otheron-exchangeinvestments
Lessthan$80,000 $80,000-$150,000 Over$150,000
Unlistedmanagedfund Other

ASX Australian Investor Study | 2017
49
Notes: Respondentswereaskedtorankuptothreeconsiderationsinorderofimportance,n=2391
10%
20%
30%
40%
50%
60%
70%
Chart 4.4: Top considerations for investors, proportion of investors
0
Overall Rank1 Rank2
Return Personal circumstances
Tax effectiveness
Flexibility ofcapital
Advice received
Impact onpension
OtherDiversificationRisk
Rank3
Whenmakinginvestmentdecisions,returnandriskremainthemostimportantconsiderationsforinvestors(Chart4.4).
Chart4.4showsthatforinvestors,taxeffectivenessisnotatopconsideration. Ofthosewhoselectedittheypredominantlyrankeditthird(asaminorconsideration).Thisisinterestinggiventhepolicydebatearoundtaxationrequirementswheninvesting(forexamplediscussionaroundcapitalgainstaxdiscounts).
Thesefindingssuggestthattheappeal ofinvestmentslieintheirrisk/returnprofiles,ratherthantaxconcessions.
4.1.2 Domestic or overseas focus AsdiscussedinChapter3, internationalshareownershipisrising, buton-exchangeinvestmentsarestill largelyhelddomestically.Forinstance, 75%ofshareownersholdonlydomesticshares,whilejust11%holdonlyinternationalshares(Chart4.5).
Further,someofthis11%couldbetheresultofoverseascompaniespurchasingAustraliancompanieswhereinvestorswere
alreadyholdingshares(forinstancethe saleofOptustoSingtelin2001).Migration isanotherfactorwhichcouldaccountforthe11%internationalownership,ifpeoplehavemovedtoAustraliaalreadyholdingsharesfromothercountires.Atthesametime,somepeoplemaybereporting theirndirectownershipofinternationalsharesthroughETFs.

ASX Australian Investor Study | 2017
50
Onaverage,thereturnssoughtbythoseinvestingoverseasareonlyslightlyhigherthanthoseinvestingdomestically(8.8%comparedto8.5%).Thenarrowdifferenceinexpectationsmayreflectthatwhileoverthepast30years,theannualreturntoAustralianshareshasexceededthatofglobalshares(9.1%p.a.comparedwith7.0%p.a.),thisgaphasclosedoverthepast10years:annualreturnsonAustralianshareshavebeen4.5%p.a.overthepast 10yearscomparedwith4.7%globally10 (FidelityInternational,2016).
4.1.3 Investors’ outlook Overthenext12months,alargerproportionofinvestorsareplanningtomoveoutofcashthanotherinvestments.Thisisconsistentwithpredictionsinthelowinterestrateenvironment.Lowreturnisdrivinginvestorstolookbeyondcashforinvestmentopportunities.Shares,cash,andpropertycontinuetobethemostpopulardestinationforinvestorfunds(Chart4.6).
Notes: n=4000
5%
10%
15%
20%
25%
30%
35%
Chart 4.5 Domestic and international holdings of on-exchange investment products, proportion of adult population
0
Both Domesticonly Internationalonly
Shares Other
10Calculatedlookingattheaverageannualreturnsoverthepast10and30yearsoftheS&P/ASX200,AllOrdinariesTR,andMSCIWorldIndexNR.Thecalculationassumesdividendreinvestmentovertheperiod.

ASX Australian Investor Study | 2017
51
Chart 4.6: Future intentions, proportion of investors
0% 20% 40% 60% 80%
Cash
Otheron-exchangeproducts
Shares
Property
Unlistedmanagedfunds
100%
Notes: n=2391
Investorbuymore Maintaincurrentholdings Investlessorreduceholdings Donotholdandnotintendingtoinvest
Investorswereaskedwhethertheyplannedtochangetheirholdingsofeachinvestmentproduct,andthosewhoanswered‘yes’wereasked,'why?'.Inresponse,mostinvestorscitedchangingpersonalcircumstancesandadesiretoalterrisklevelsintheirportfolios(Chart4.7).ThisisinlinewiththefindinginChart4.4,whichshowsthetopreasonsforchangingholdingsallrelatetoreturn,risk,andpersonalcircumstances.
Inaddition,investorswhoansweredthattheydidnotholdcertainproductswereaskedwhynot.Chart4.8showstheirresponses; lackoffundswasthemostcommonreasongiven.
Chart 4.7: Top reasons for planning to change holdings over the next 12 months, proportion of those investors who have plans to change
0% 5% 10% 15% 20% 25% 30% 35%
Personalcircumstanceschanged
Toalterriskofportfolio
Toalterliquidityofportfolio
Returnishigher/lowerelsewhere
Investmentgoalschanged
Notes: n=1470
Chart 4.8: Reasons for not investing, proportion of those investors who have no plans to invest
0% 5% 10% 15% 20% 25% 35%30% 45%40%
Lackoffunds
Unsureofrisk/return
Notfamiliarwithhowitworks
Doesnotmatchinvestmentgoals
Notimetoresearch
Notes:n=1460
23%
20%
18%
9%
6%
39%
30% 53%
43%10%
11%
52%
46% 30%6%
13%
51% 8% 18%
14%
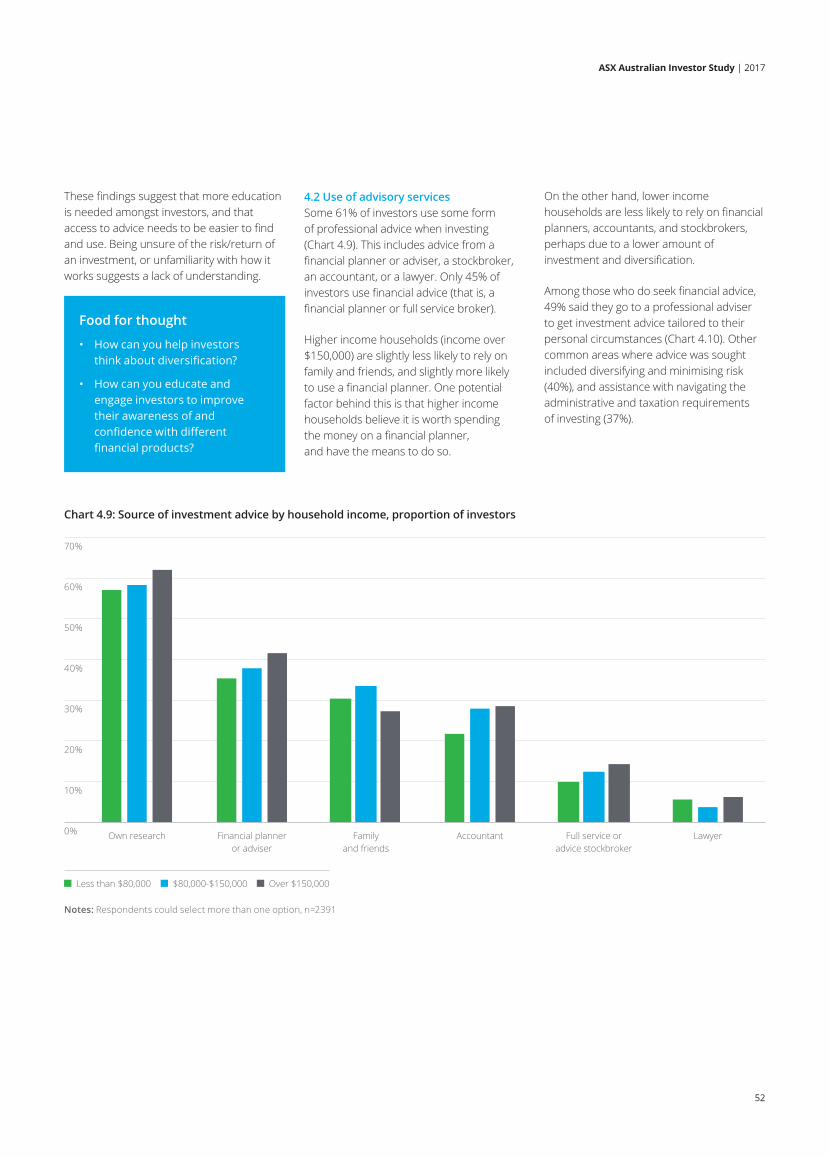
ASX Australian Investor Study | 2017
52
Thesefindingssuggestthatmoreeducationisneededamongstinvestors,andthataccesstoadviceneedstobeeasiertofindanduse.Beingunsureoftherisk/returnofaninvestment,orunfamiliaritywithhowitworkssuggestsalackofunderstanding.
10%
20%
30%
40%
50%
70%
60%
Chart 4.9: Source of investment advice by household income, proportion of investors
0%
Notes:Respondentscouldselectmorethanoneoption,n=2391
Lessthan$80,000 $80,000-$150,000 Over$150,000
Ownresearch Financialplanneroradviser
Family andfriends
Accountant Fullserviceoradvicestockbroker
Lawyer
4.2 Use of advisory services Some61%ofinvestorsusesomeformofprofessionaladvicewheninvesting(Chart4.9).Thisincludesadvicefromafinancialplanneroradviser,astockbroker,anaccountant,oralawyer.Only45%ofinvestorsusefinancialadvice(thatis,afinancialplannerorfullservicebroker).
Higherincomehouseholds(incomeover$150,000)areslightlylesslikelytorelyonfamilyandfriends,andslightlymorelikelytouseafinancialplanner.Onepotentialfactorbehindthisisthathigherincomehouseholdsbelieveitisworthspending themoneyonafinancialplanner, andhavethemeanstodoso.
Food for thought
• How can you help investors think about diversification?
• How can you educate and engage investors to improve their awareness of and confidence with different financial products?
Ontheotherhand,lowerincomehouseholdsarelesslikelytorelyonfinancialplanners,accountants,andstockbrokers,perhapsduetoaloweramountofinvestmentanddiversification.
Amongthosewhodoseekfinancialadvice,49%saidtheygotoaprofessionaladvisertogetinvestmentadvicetailoredtotheirpersonalcircumstances(Chart4.10).Othercommonareaswhereadvicewassoughtincludeddiversifyingandminimisingrisk(40%),andassistancewithnavigatingtheadministrativeandtaxationrequirements ofinvesting(37%).

ASX Australian Investor Study | 2017
53
Chart 4.10: Top reasons for seeking professional advice, proportion of those investors who use financial advice
Providestailoredadvice
Helpsmediversifyandminimiserisk
Navigatingtheadminandtaxrequirements
Accesstonewinvestments
GivesmeideaswhichIthenusetodo
myownresearch
0% 10% 20% 30% 40% 50%
Notes: n=1077
Oftheinvestorsthatdonotuseprofessionaladvice,themostcommonlycitedreasonisthattheyprefertobeincontroloftheirinvestments(seeChart4.11).Ofconcernfortheadviceindustryaretheperceptionsofalackofvalue(overhalf56%),highcosts(39%)andinvestmentsbeingtoosmalltoneedadvice(32%).
Notes:n=948
Prefertobe incontrol
Notconvinced adviceaddsvalue
Investmentistoosmalltoneedadvice
Notsurehow togetadvice
Tooexpensive
10%
20%
30%
40%
50%
60%
70%
80%
90%
100%
Chart 4.11: Reasons for not seeking professional advice, proportion of those investors who do not use advice
0

ASX Australian Investor Study | 2017
54
4.3 Use of transaction services Buyingandsellingthroughanon-advicebrokeroronlinetradingplatformwasthemostcommonmethodoftransactionoverthelast 12months.AsChart4.12shows,justover40%ofon-exchangeinvestorshaveactivelyboughtorsoldinthelastyear,andofthose, 65%usedanon-advicebroker/onlinetradingplatform.11
Chart 4.12 Number of trades in the past 12 months, proportion of those on-exchange investors who have traded in the past 12 months
Notes: n=1494
10%
20%
30%
40%
50%
60%
0 0 1-2 3-4 5-9 10-49 50-99 100+
11Investorscouldselectmorethanonemethodoftrading.

ASX Australian Investor Study | 2017
55
Chart4.13showshowtradingmethodsvariedbyagegroup.Ineverycaseanon-advicebrokeroronlinetradingplatformwasthedominanttransactionmethod.Younginvestorsaremorelikelytouseafull-servicebrokerorfinancialadvisertobuyandsellthanolderinvestors,perhapsreflectinginexperienceoralackofconfidencedoingitthemselves.
Brochure / report title goes here | Section title goes here
58
Chart 4.13 shows how trading methods varied by age group. In every case a non-advice broker or online trading platform was the dominant transaction method. Young investors are more likely to use a full-service broker or adviser to buy and sell than older investors, perhaps inexperience or a lack of doing it themselves.
10%
20%
30%
40%
50%
70%
80%
60%
Chart 4.13: Method of trading used by actively trading investors, by age, proportion of those on-exchange investors who have traded in the last 12 months
0%35-44 75+45-54 55-6425-3418-24 65-74 Overall
Non-advice broker or online trading platform
Advice or full-service broker
Financial planner/adviser
Directly through prospectus of a listed company
Employee share scheme
Notes: n=604
Chart 4.13: Method of trading by age of investor, proportion of those on-exchange investors who have traded in the last 12 months
4.3.2 Attitudes to robo advice Digitalandautomatedadvisoryservicesarestillintheirearlystagesofadoption.Platformsthatutiliseclientinformationandalgorithmstodevelopautomatedportfolioallocationandinvestmentrecommendationstailoredtoindividualclientpreferencesareknownasroboadvice(Deloitte,2015b).
Roboadvice,alsoknownasdigitalwealthmanagement,candrawonclientinformationtodeterminecertainvariablessuchasriskappetiteorliquidity,toproposeappropriateinvestmentopportunities
(Deloitte,2016).Itwillprovidegreateropportunitiestounderstandinvestorsusinginformationsuchasincome,maritalstatusandtotalsuperandnon-superassets(Ashe,2016).Theevolutionoftheplatformisheadingtowardstheuseofself-learningartificialintelligenceinvestmentalgorithms,whichleveragesophisticatedriskmanagementandprofilingquestionnairestodeterminedirectinvestments.
Theroboadviceplatformhasanumber ofbenefits,includingsignificantlylower feesandcreatingfurthervalueforinvestorsbyappealingtocurrent-generationpreferences(i.e.morecontroloverfinancesanywhereandanytime)(Deloitte,2015b).OwnersAdvisory,thedigitaladvicedivisionofMacquarieGroup,seesthemainadvantagesofroboadvicecomefrom itsincreasedrigour,unbiasedadvice, andincreasedconvenienceforinvestors(seeBoxD).

ASX Australian Investor Study | 2017
56
Box D: Owners Advisory
Owners Advisory is the digital advice division of Macquarie Group. It focuses on providing digital wealth management – known colloquially as ‘robo advice’.
Owners Advisory's direct online advice tool is able to provide customised advice quickly and cheaply. Advice can be high level, or very granular (down to recommending the sale of individual shares). It can also take legacy assets into account, so it recommends investments to fit in with an existing portfolio.
Users of their tool typically have a ‘do it yourself’ attitude, and see the tool as a second opinion before making their own investment decisions. A large portion of users are SMSF investors, and the average age of users is just over 50, which contrasts with the view that older investors are less open to the idea of using robo advice.
Owners Advisory sees a number of advantages to investors of robo advice. Firstly, it can be more rigorous in its investment selection process. Their system can sort through 30,000 investment opportunities and find the investment best suited to each client.
Secondly, it is non-biased in its recommendations. Using digital advice means that the marketing aspect of selecting an investment is removed – a computer will look beyond the well-known and find new opportunities which may fit an investor’s portfolio better.
Thirdly, it is more convenient for a lot of people. Robo advice can be used whenever and wherever is convenient for each individual, whereas often professional advice must be sought within business hours, or at the office of the adviser.
These advantages combine to make robo advice more efficient and convenient than traditional advice channels. The automation process has made providing advice faster, and more easily customised, meaning better value for investors.
However,someinvestorsmaystillpreferobtainingadviceinperson,andOwnersAdvisoryexpectthatinthefuturehybridmodelswherein-personfinancialadvisersuseroboadviserstoimprovethequalityofadviceavailabletoinvestors.
Theuptakeofroboadviceisstillinitsearlystages.Thisispartlyduetoaknowledgegap,thatis,manyinvestorsdonotknowoforunderstandroboadvice.Chart4.14highlightsthatatleast50%ofinvestorsacrossallagegroupsdonotknowenoughaboutroboadvicetoconsiderusingit.
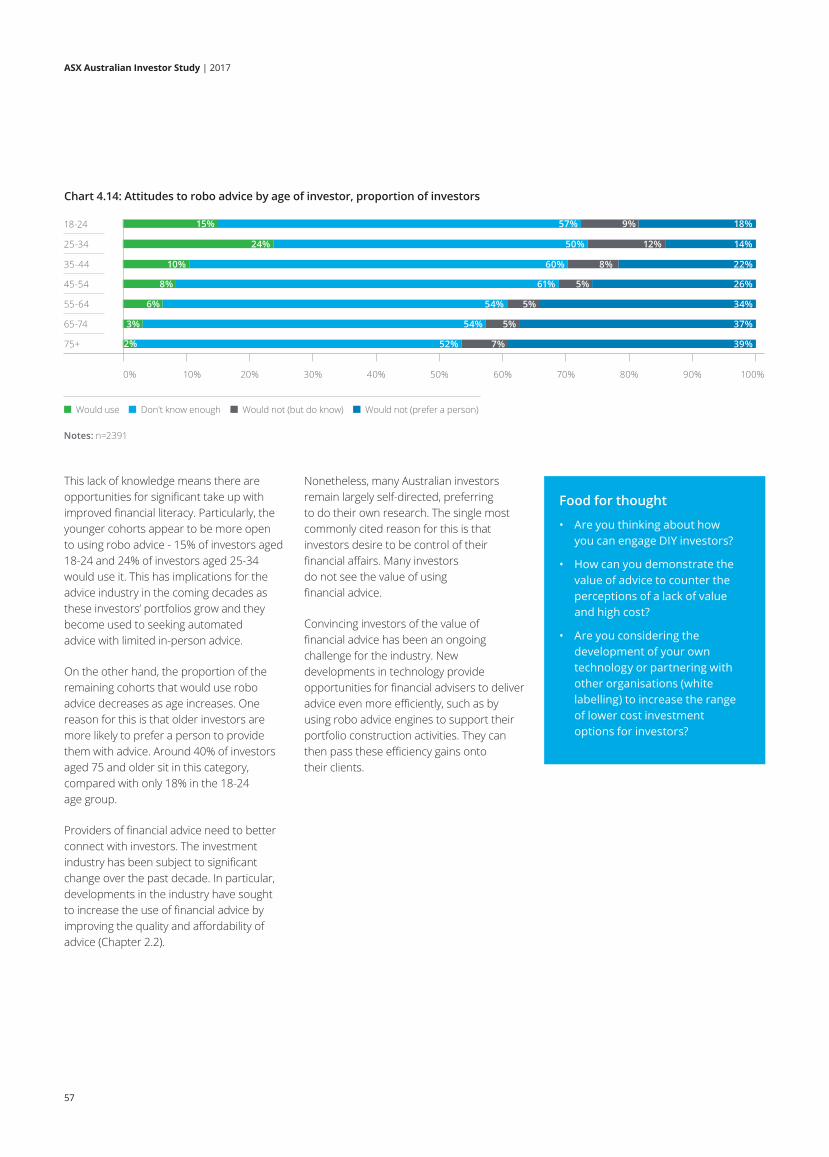
ASX Australian Investor Study | 2017
57
Brochure / report title goes here | Section title goes here
60
Chart 4.14: Attitudes to robo advice, proportion of investors, by age
0% 10% 20% 30% 40% 50% 60% 100%70% 80% 90%
25-34
18-24
35-44
45-54
55-64
65-74
75+
Notes: n=2391
Would use Don't know enough Would not ( but do know) Would not (prefer a person)
Food for thought
• Are you thinking about how you can engage DIY investors?
• How can you demonstrate the value of advice to counter the perceptions of a lack of value and high cost?
• Are you considering the development of your own technology or partnering with other organisations (white labelling) to increase the range of lower cost investment options for investors?
Thislackofknowledgemeansthereareopportunitiesforsignificanttakeupwithimprovedfinancialliteracy.Particularly,theyoungercohortsappeartobemoreopentousingroboadvice-15%ofinvestorsaged18-24and24%ofinvestorsaged25-34woulduseit.Thishasimplicationsfortheadviceindustryinthecomingdecadesastheseinvestors’portfoliosgrowandtheybecomeusedtoseekingautomated advicewithlimitedin-personadvice.
Ontheotherhand,theproportionoftheremainingcohortsthatwoulduseroboadvicedecreasesasageincreases.Onereasonforthisisthatolderinvestorsaremorelikelytopreferapersontoprovidethemwithadvice.Around40%ofinvestorsaged75andoldersitinthiscategory,comparedwithonly18%inthe18-24 agegroup.
Providersoffinancialadviceneedtobetterconnectwithinvestors.Theinvestmentindustryhasbeensubjecttosignificantchangeoverthepastdecade.Inparticular,developmentsintheindustryhavesoughttoincreasetheuseoffinancialadvicebyimprovingthequalityandaffordabilityofadvice(Chapter2.2).
Nonetheless,manyAustralianinvestorsremainlargelyself-directed,preferring todotheirownresearch.Thesinglemostcommonlycitedreasonforthisisthatinvestorsdesiretobecontroloftheirfinancialaffairs.Manyinvestors donotseethevalueofusing financialadvice.
Convincinginvestorsofthevalueof financialadvicehasbeenanongoingchallengefortheindustry.Newdevelopmentsintechnologyprovideopportunitiesforfinancialadviserstodeliveradviceevenmoreefficiently,suchasbyusingroboadviceenginestosupporttheirportfolioconstructionactivities.Theycanthenpasstheseefficiencygainsonto theirclients.
Chart 4.14: Attitudes to robo advice by age of investor, proportion of investors
15%
24%
10%
8%
6%
3%
2%
60%
61%
54%
54%
52% 39%
34%
37%
5%
5%
7%
26%5%
22%8%
50% 12% 14%
57% 18%9%

ASX Australian Investor Study | 2017
58

ASX Australian Investor Study | 2017
59
5.WhydoAustraliansinvest?Australianstypicallyinvestforthelongterm.Retirementandwealthaccumulationarefrontofmindforallages,andindividuals areinvestinginproductsthatreflectthat. AlsoreflectedinproductchoiceistherelativelyhighriskaversenatureofAustralianinvestors.Morethantwothirds(67%)ofAustralianinvestorsareseekingguaranteedorstablereturnsfrom theirinvestments.
Thisproportionishigherforyounginvestors,challengingthewidespreadbeliefthatolderinvestorsaremoreriskaverse.Thischapterexaminesinvestorgoals,knowledge,andriskattitudes.
5.1 Awareness, knowledge and attitudes Investorsreportedthattheirtopthreegoalswheninvestingareplanningforretirement,accumulatingwealth,andsupplementingcurrentorfutureincome(Chart5.1).
Whilethespecificgoalsvarybyinvestorage,theyremainfocusedonthelongterm(Chart5.2).Theyoungeragegroups(18-24and25-34)arefocusedmoreheavilyonsavingforhomedeposits,especiallyinatimewherehousepriceshavebeenontheincrease forsometime.
Wealthaccumulationappearstobearelativelyconsistentgoalacrossallages,consideringthatinvestorsarelikelytobealwaysthinkingaboutbeingfinanciallypreparedforthenextstagesoftheir livesandhavingenoughmoney.
Brochure / report title goes here | Section title goes here
63
Australians typically invest for the long term. Retirement and wealth accumulation are front of mind for all ages, and individuals are investing in products that that. Also
in product choice is the relatively high risk averse nature of Australian investors. (67%) of Australian investors are seeking stable, reliable returns from their investments. This proportion is higher for young investors, challenging the widespread belief that older investors are more risk averse. This chapter examines investor goals, knowledge, and risk attitudes
5.1 Awareness, knowledge and attitudes Investors reported that their top three goals when investing are planning for retirement, accumulating wealth, and supplementing current or future income (Chart 5.1).
While the goals vary by investor age, they remain focused on the long term (Chart 5.2). The younger age groups (18-24 and 25-34) are focused more heavily on saving for home deposits, especially in a time where house prices have been on the increase for some time.
Wealth accumulation appears to be a relatively consistent goal across all ages, considering that investors are likely to be always thinking about being prepared for the next stages of their lives and having enough money.
10%
20%
30%
40%
50%
60%
Chart 5.1: Top investment goals, investors
0% Planning for retirement
Accumulating wealth
Supplementing current or future income
Saving for a 'rainy day'
Saving for a deposit on a home
Travel
Notes: n=2391
Total Rank 1 Rank 2 Rank 3
Two third
Chart 5.1: Top investment goals, all investors

ASX Australian Investor Study | 2017
60
Investorsaged18-34arelikelytoplanfortravelmorethanthoseinthe35-44agegroup.Thiscouldbeexplainedbyindividualsinthe35-44agegroupbeingmorelikelytohavedependantsandpotentiallyshiftingtheirgoalstowardssavingforeducation.
Thegoalofplanningmoreforretirementislikelytobemorecommonasinvestorsbecomeolderandbegintoplacemoreimportanceonhavingenoughmoneyatthattime.
Forexample,the18-24agegroupplantheleastforretirementbecauseofotherimpendingpurchasessuchashouses.Ontheotherhand,Chart5.2showsthatasinvestorsbecomeolder,theybegintosavemoreforretirement,untiltheyreachretirementage(sincetheyarealready livinginretirement).
Atthesametime,supplementingincomeappearstobemoreimportantforinvestorsaged65+comparedwiththeyoungerages.
Inretirement,investorsneedtosupplementtheincometheyreceivefrompensionsandsuperannuation,whileinvestorsaged18-34donotrequireasmuch.
However,theimportanceofsupplementingincomeishigherforinvestorsaged35-44,potentiallyduetofamiliesneedingtopayforchildren’seducationandtheincreasedcostoflivingaschildrenbecomeolder.
Brochure / report title goes here | Section title goes here
64
Investors aged 18-34 are likely to plan for travel more than those in the 35-44 age group. This could be explained by individuals in the 35-44 age group more likely to have dependants and potentially having shifted their goals towards saving for education.
The goal of planning more for retirement is likely to be more common as investors become older and begin to place more importance on having enough money at that time. For example, the 18-24 age group plan the least for retirement because of other impending purchases such as houses. On the other hand, Chart 5.2 shows that as investors become older, they begin to save more for retirement, until they reach retirement age (since they are already living in retirement).
At the same time, supplementing income appears to be more important for investors aged 65+ compared with the younger ages. In retirement, investors need to supplement the income they receive from pensions and superannuation, while investors aged 18-34 do not require as much. However, the importance of supplementing income is higher for investors aged 35-44, potentially due to families needing to pay for children’s education and the increased cost of living as children become older.
While most Australian investors are generally long-term focused, investing can be a path to achieving other life outcomes.
For example, as in the survey results and in consultation with Wealth Enhancers Pty Ltd, younger investors may be increasingly considering investing as a way to build their home deposit. The
advice industry is already shifting away from business and product-led operating models to customer-led ones. By focusing on building long-term client relationships, advisers can help their clients invest to achieve a broader range of outcomes throughout life stages. This will require advisers to have a better understanding of their clients. Being willing to review business models to ensure they align with emerging customer needs, and making better use of customer data will be important components of this.
5%
10%
15%
20%
25%
40%
35%
30%
Chart 5.2 Top investor goals by age, proportion of investors
0%
Notes: Other, less common, goals were included in the survey but are not presented here, n=2391
Home deposit Travel Wealth accumulation Retirement Supplementing income
35-44 75+45-54 55-6425-3418-24 65-74
Chart 5.2: Top investment goals by age of investor, all investors

ASX Australian Investor Study | 2017
61
WhilemostAustralianinvestorsaregenerallylong-termfocused,investingcanbeapathtoachievingotherlifeoutcomes.Forexample,asreflectedinthesurveyresultsandinconsultationwithWealthEnhancersPtyLtd,youngerinvestorsareconsideringinvestingasawaytobuildtheirhomedeposit.Thefinancialadvice industryisalreadyshiftingawayfrombusinessandproduct-ledoperatingmodelstocustomer-ledones.Byfocusingonbuildinglong-termclientrelationships,financialadviserscanhelptheirclientsinvesttoachieveabroaderrangeofoutcomesthroughoutdifferentlifestages.
Thiswillrequirefinancialadviserstohaveabetterunderstandingoftheirclients.Beingwillingtoreviewbusinessmodelstoensuretheyalignwithemergingcustomerneeds,andmakingbetteruseofcustomerdatawillbeimportantcomponentsofthis.
Investors’confidencevariesacrossinvestmentproducts(Chart5.3).Investorsgenerallyfeelconfidentinvestingincash,property,andshares,andprogressivelylesssowithmorealternativeproducts.Lessthan20%ofinvestorsfeelconfidentinvestingin
unlistedmanagedfunds,derivatives,andotheron-exchangeinvestments(suchasbonds,hybridsecurities,andexchangetradedfunds).Thereisanopportunityhereforfinancialadvisers:ifinvestorswerebettereducatedabouttheseproductstheymaybegintoengagewiththemandinvest morebroadly.
Thiscouldbedrivenbyanumberofthings(forinstance,lingeringinvestorscepticismfromtheGFC),butlackofawarenessislikelyasignificantfactor.Chart5.4showsinvestorawarenessofselected‘Otheron-exchangeinvestments’.Whilebondsarethemostwell-known,withnearlytwo-thirdsofinvestorsawareofthem,thisawarenessquicklydeclinesforotherfinancialproducts.Whileawarenessfor productssuchasA-REITsisnotveryhigh,theyperformquitewellwithanaverageannualreturnofjustunder17%overfiveyearsto March2017(Collett,2017).
Brochure / report title goes here | Section title goes here
65
Investors’ varies across investment products (Chart 5.3). Investors generally feel investing in cash, property, and shares, and progressively less so with more alternative products. Less than 20% of investors feel investing in unlisted managed funds, derivatives, and other on-exchange investments (such as bonds, hybrid securities, and exchange traded funds). There is an opportunity here for advisers: if investors were better educated about these products they may begin to engage with them and invest more broadly.
This could be driven by a number of things (for instance lingering investor scepticism from the GFC), but lack of awareness is likely a factor. Chart 5.4 shows investor awareness of selected ‘Other on-exchange investments’. While bonds are the most well-known, with nearly two-thirds of investors aware of them, this awareness quickly declines for other products. While awareness for products such as A-REITS is not extremely high, they perform quite well with an average annual return of just under 17% over years to March 2017 (Collett, 2017). If awareness for these products was higher, then it is likely that there would have been a greater take up of A-REITS.
5.1.2 Financial literacy While investors are investing in cash, property and shares, there are a range of other more complex or alternative products with which investors are not (Chart 5.3). At the same time, investors are not as aware of those products that are seen as complex (i.e. hybrid securities), when compared to products such as government/corporate bonds (Chart 5.4). The lack of awareness about more complex products and the corresponding lower
highlights a knowledge gap.
5%
10%
15%
20%
25%
40%
45%
35%
30%
0%
Notes: n=2391
Very Somewhat Not
Cash Property Shares Other on -exchange investments
Unlisted managed funds
Derivatives
Chart 5.3: Investor confidence level with investing by investment product, all investors

ASX Australian Investor Study | 2017
62
5.1.2 Financial literacy Whileinvestorsareconfidentinvestingincash,property,andshares,therearearangeofothermorecomplexoralternativeproductswithwhichinvestorsarenot (Chart5.3).Atthesametime,investorsarenotasawareofthoseproductsthatareseenascomplex(i.e.hybridsecurities),whencomparedtoproductssuchasgovernment/corporatebonds(Chart5.4).Thelackofawarenessaboutmorecomplexfinancialproductsandthecorrespondinglowerconfidence,highlightsa knowledgegap.
Financialliteracyisdefinedasa combinationoffinancialknowledge, skills,attitudes,andbehavioursnecessary tomakesoundfinancialdecisions,based onpersonalcircumstances,inordertoimprovefinancialwellbeing(ASIC,2017b).AustraliahasthehighestfinancialliteracyrateintheAsia-Pacificregion,andisranked ninthglobally(Klapperetal.,2015).
ThereisstillroomforAustralia’sliteracytoimprove.ThemostrecentAustralianFinancialAttitudesandBehaviourTrackershowsthatunderstandingkeyfinancialconceptssuchasthe‘risk/returntrade-off’and‘diversification’isachallenge forAustralians.
Chart 5.4: Awareness of specific financial products, proportion of investors
0% 10% 20% 30% 40% 50% 70%60%
Government/corporatebonds
ETFs
Futures
Infrastructurefunds
LICs
Hybridsecurities
Options
InstalmentsorOrdinaryWarrants
A-REITs
mFund
Notes: Notes: n=2391
OnlyoneinthreeAustraliansreportunderstandingtherisk/returntrade-off, andevenfewerunderstanddiversification (ASIC,2016b).Thisisindicatedbytherelativelyhigherconfidenceofinvesting inmorewell-knownproducts,as discussedabove.
Itisimportantforindividualstounderstandhowtomanagetheirmoneyandfinancialriskseffectively,inordertoprotectagainstvariouspitfalls.Inregardstoinvestments,financialknowledgeisvitalatatimewherecomplexfinancialproductsarefreelyavailabletothebroaderpopulation.
Thispresentsanopportunity.Withmostinvestorsbeingself-directedratherthanseekingfinancialadvice(Chapter4),onewaytoboostawarenessandconfidenceisthroughpromotinggreateruseoffinancialadvice.Anotherwouldbetocommitmoreresourcestoeducatinginvestorsabouttheseproducts.

ASX Australian Investor Study | 2017
63
5.2 Australians’ attitudes to risk Australiansarerelativelyriskaverse.AccordingtoaglobalinvestmentstudyconductedbyLeggMason(2015),only 29%ofAustralianinvestorsareprepared toincreasetheirriskprofilefortheopportunitytoearnmoreincome,comparedto66%ofinvestorsglobally,and77%ofAustralianinvestorsdescribethemselvesasconservativecompared to59%globally.
Inthisstudy,48%ofinvestorsreportthattheypreferstable,reliablereturns.Some34%ofinvestorswouldacceptmoderate orhighervariabilityinreturns.
Contrarytoperceivedwisdom,younginvestorsaremoreriskaversethanolderinvestors(Chart5.5).About31%of18-24yearoldsseekguaranteedreturnsontheirinvestments,andonly19%wouldacceptvariabilityinreturns.
Incontrast,just8%ofthoseaged75andoverlookforguaranteedreturns,and35%wouldacceptvariability.Thismaypartlyreflectalevelofriskaversionattributedtolimitedinvestmentexperience,ornothavingexperiencedbuoyantpre-GFCconditions.
Notes: n=2391
10%
20%
30%
40%
50%
60%
70%
80%
90%
100%
Chart 5.5: Investors' attitudes to risk by age of investor, proportion of investors
035-44 75+45-54 55-6425-3418-24 65-74
Accepthighervariabilitywiththepotentialforhigherreturns
Acceptmoderatevariabilityinreturns
Preferstable,reliablereturns
Preferguaranteedreturns

ASX Australian Investor Study | 2017
64
Notes: n=2391
10%
20%
30%
40%
50%
60%
70%
80%
90%
100%
Chart 5.6: Investors' attitudes to risk by gender of investor, proportion of investors
0
Accepthighervariabilitywiththepotentialforhigherreturns
Acceptmoderatevariabilityinreturns
Preferstable,reliablereturns
Preferguaranteedreturns
Male Female Overall
Femaleinvestorsaremoreriskaversethanmaleinvestors,withjust26%offemaleinvestorswillingtoacceptvariabilityinreturnscomparedwith40%ofmaleinvestors(Chart5.6).

ASX Australian Investor Study | 2017
65
10%
20%
30%
40%
50%
60%
70%
80%
90%
100%
Chart 5.7: Investors' reaction to investment balance dropping 20% overnight, proportion of investors
0
I'dinvestmorefundstotakeadvantageofthelowerunit/sharepricesexpectingfuturegrowth
ThiswasariskIunderstood–I'dleavemyinvestmentsinplaceexpectingperformancetoimprove
I'dbeconcerned,butwouldwaittoseeiftheinvestmentsimprove
I'dcutmylossesandtransfermyfundstomoresecureinvestmentsectors
Losesleep–SecurityofmycapitaliscriticalandIdon'tintendtotakerisks
Overall 35-44 75+45-54 55-6425-3418-24 65-74
Notes: n=2391
Chart5.7reportswhattheinvestors’reactionswouldbetofindingtheirportfoliobalancehasdropped20%overnight.Thesamepatternisobserved,withyounginvestorsbeingmoreriskaversethanolderinvestors.Investorsinthe18-24and25-34agebracketsaremorelikelytorespondtosuchaneventbytransferringtheirfundsintomoresecureinvestments,whileinvestorsagedover55mostlyreportedthatwhiletheywouldbeconcerned,theywouldwaittoseeiftheinvestmentsimprove.

ASX Australian Investor Study | 2017
66
2%
4%
6%
8%
8.4% 8.5%
9.0%9.2%
10.3%
10%
12%
Chart 5.8 Average expected portfolio returns by reaction to loss, all investors
0% Losesleep-Security ofcapitaliscritical
Cutlossesandtransferfundstomoresecureinvestmentsectors
Concerned,butwaittoseeiftheinvestments
improve
Leaveinvestmentsinplaceexpectingperformanceto
improve
Investmoretotakeadvantageofthelower
unit/sharepricesexpectingfuturegrowth
Notes: n=2391
Whilethisdoesfollowtheexpectedtrendofriskaverseinvestorsexpectinglowerreturns,thefactthatoneinfiveriskaverseinvestorsstillseekdoubledigitreturnsissurprising.Thecurrentinvestmentenvironmentisoneoflowreturns,soto getdoubledigitreturnsinvestorswouldneedtochoosehigherriskproducts.
Itcouldbethatfinancialliteracyamongtheseinvestorsislow,andthattheydonotfullyunderstandtherisk/returntrade-offandthecurrentfinancialclimate.
AnalternativeexplanationisthattherapidappreciationofhousepricesinAustralia(particularlyinSydneyandMelbourne)hasgiveninvestorsawarpedideaastowhatisreasonabletoexpectwheninvesting.HousingpricesinSydneyhaveappreciatedanaverageof11.3%perannumoverthelastfiveyears,andacrossallcapitalcitiestheaveragehasbeen7.7%overthesameperiod(ABS,2017c).
Mediacoverageofthehousingmarketandthespeedwithwhichitisgrowingmaybegivinginvestorstheincorrectideathatdoubledigitreturnsare‘normal’inthislowinterestrateenvironment.
Chart5.8showsthatonaverage,themostriskaverseinvestorsseeklowerportfolioreturnscomparedtolessriskaverseinvestors. Itshowstheaveragereturnsthatpeoplereportingeachlevelofriskareexpectingfromtheirportfolios.Ofthosethatarethe mostriskaverse,18%seekbetween0%and5%returnsontheirportfolio,comparedwithjust2%oftheleastriskaverseinvestors. Inlinewiththis,21%ofthemostriskaverseinvestorsseekdoubledigitreturns,comparedto34%oftheleastriskaverseinvestors.

ASX Australian Investor Study | 2017
67
Notes: n=2391
10%
20%
30%
40%
50%
60%
Chart 5.9 Proportion of investors comfortable borrowing to invest, by age and gender
018-24 25-34 35-44 75+45-54 55-64 65-74
Male Female
Whileyounginvestorsaremostriskaverse,theyarealsomostwillingtoborrowinordertoinvest(Chart5.9).Nonetheless, whilesomemaybecomfortableborrowingtoinvest,onlyasmallproportionofinvestorsactuallydoso(lessthan5%ofinvestors).

ASX Australian Investor Study | 2017
68
5.3 Diversification Nearlyhalf(46%)ofinvestorsconsideredtheirportfoliostobediversified(Chart5.10).However,15%ofinvestorswereunsure iftheyhaddiversifiedportfolios,while40%consideredthattheydidnot.
40%
15%
46%
Chart 5.10: Diversified portfolios, proportion of investors
Notes: n=2391
DiversifiedNotdiversifiedUnsure
Theseanswersalignwithwhatinvestorsreportedhavingintheirportfolios.Thosewhosaidthattheywerediversifiedhadanaverageof2.7assetclassesintheirportfolioswhilethosewhowerenotdiversifiedhad1.6.12Theinvestorsthatdonotdiversifymaybedoingsobychoiceormaybefacingbarrierstodiversification,suchaslackofaccessortheyperceivethebuy-inpricetobeprohibitive.
PatersonsSecuritiesLimited,astockbrokingfirm,hasseenashiftinunderstandingofdiversificationamonginvestorsoverthepastdecade(seeBoxE).Ithasnotedthatanindustry-widepushhasledtoimprovementsininvestors’understandingoftheconcept,butsomestilldonotseethebenefitsofdiversification.NationalAustraliaBankLtd(NAB)alsoconsidersthatthereisagapbetweenunderstandingofdiversificationandimplementation(BoxF).Thesesuggestthattheremaystillbeworktodotoimproveinvestors’useofdiversification.
12Assetclassesrefertodifferentproducts:shares,property,cash,derivatives, otheron-exchangeinvestmentproducts,unlistedmanagedfunds,otherinvestments.
Box E: Patersons Securities Limited
Patersons Securities Limited is a full-service stockbroking firm operating nationally.
They noted that risk attitudes have changed over the past decade, and that since the GFC and the end of the resources boom investors have become more conservative.
This has also been accompanied by a shift in responsibility relating to their expectation of advice – during the boom investors would come to advisers with a plan of what they wanted to do, and seek advice as to how to achieve it. Today, investors come for advice about what to invest in, and advisers take more of a driving role, explaining what is possible and realistic for them.
Investors’ understanding of diversification has also changed. As a result of an industry-wide push, investors have a better understanding of diversification, but there are a number of reasons why people do not diversify.
While some people may understand the concept, they do not see the benefits for their portfolios. For others, they have specific investment interests and do not want to diversify beyond them. Some investors have insufficient capital to enable efficient diversification.

ASX Australian Investor Study | 2017
69
Box F: National Australia Bank – Self-Directed Investors
Investors generally acknowledge the importance of diversification, however implementation of the concept is varied at times. When this is the case, investors may wrongfully believe they have a diversified portfolio when in reality this may not be the case.
The types of investments selected also depend on an investor’s objectives and risk tolerance. An investor with a higher risk tolerance may have a larger allocation to more volatile assets (in search of higher returns). However the diversification premise remains consistent; seeking to achieve your objectives consistent with your risk tolerance.
The greatest diversification benefits are achieved when portfolio assets move in opposite directions when a market event occurs (they are negatively correlated). In a practical sense, this is generally achieved by investing across several sectors rather than just one. As an example, a four stock portfolio invested in four different sectors will have different diversification characteristics than a four stock portfolio invested in four companies within the same sector. NAB often sees a disconnect between investors’ understanding and implementation of diversification. A big part of this is access. Investors do not always have easy access to certain asset classes making diversification more challenging. Therefore, one of NAB’s priorities is assisting investors in accessing other assets (for instance, international equities and fixed income).
NAB sees technology such as robo-advice playing an important role in helping investors build diversified portfolios to meet their investment objectives. Offered at a lower cost than personal advice, it is an attractive option with great potential as investors begin to place more trust in robo-advice.

ASX Australian Investor Study | 2017
70
Whileaccesstodifferentassetclassesandtheavailabilityofinvestmentproductshasimprovedovertime,shares,cash,andpropertyarethemostcommonlyheldinvestments(Section4.1).Thisassetmixdoesnotchangesignificantlyforinvestors indifferentlifestages.
Againstthisbackground,investorsmaynotbeholdingtheoptimalportfoliofortheircircumstances.Partly,thismaybebecauseinvestorsarenotactivelyengagedintheirinvestmentactivities;almosthalf(45%)ofinvestorsreviewedtheirportfoliosonlyafewtimesinthelastyear,orlessfrequently.Thismaysuggestthatfinancialeducationisstilllacking.Itcouldalsomeanthatfinancialadvisersarestrugglingtoconnectwithinvestors.Thefinancialadviceindustryneedstoconsidernewapproachestohelpinvestorsbetterunderstandandnavigatetheirinvestmentjourney.
Diversificationhelpstospreadinvestmentrisk.Adiversifiedportfoliomeansthaninvestorsarelessexposedtoasingleeconomicevent,andthusarelesslikely tosufferfinancialloss(ASIC,2017a).Investorswhoconsideredtheirportfoliosdiversifiedwereonaveragelessriskaversethanthosewhoconsideredtheirportfoliosundiversified(Chart5.11).Theyalsohadslightlyhigherreturnexpectations-thosewithadiversifiedportfoliosaidtheyexpect9.1%returns,whilethosewhoareundiversifiedareexpecting8.8%returns.
Mostoftheundiversifiedinvestorsseeking‘stable,reliablereturns’areinvestedincash.Sharesandpropertyaretheotherproductsusedbythisgroup,butfarlessfrequently.
Theinvestmentindustryhastakenstepstoimprovepublicunderstandingofthebenefitsofdiversification,butmanyAustralianinvestorsarenotdiversified.
Chart 5.11 Relationship between diversification and risk attitudes among investors
50%
60%
40%
30%
20%
0Guaranteedreturns Stable,reliablereturns Moderatevariability Highervariability
10%
Diversifiedportfolio Undiversifiedportfolio
Notes: n=2391
Food for thought
• How can you help investors understand what returns are reasonable for different asset classes in the current environment?
• How are you helping investors think through the risk and return trade-off?
• How can you help investors to understand the benefits of diversification?

ASX Australian Investor Study | 2017
71

ASX Australian Investor Study | 2017
72
6.SeekingamorediversifiedfutureInvestingisimportantforAustraliansanditisgoingtobeevenmoreimportantovertime.Asthepopulationages,andpeoplespendmoretimeinretirement,wealthaccumulationisbecomingmoreandmoreimportant.Compulsorysuperannuationwillnotalwaysbeenoughtomaintainindividuals’lifestyleexpectations inretirement.
In2013/14,themeansuperannuationbalanceforanindividualatretirementwasaround$214,000(ASFA,2015).Theaveragetotalsuperannuationbalanceforahouseholdatretirementwas$355,000(ASFA,2015).
Asinglepersonseekinga‘modest’lifestyle inretirementrequiresalumpsumofatleast$370,000(withouttheagepension)investedandreturning7%p.a.(SuperGuide,2017).Forcouples,thislumpsumneedstobeatleast$400,000.Inordertohavea‘comfortable’retirement,householdsrequirebetween1.8and2.3timestheselumpsumamounts(making$665,000and$910,000thenewlumpsumsneeded forsinglesandcouplesrespectively) (SuperGuide,2017,andASFA,2016).
Investingearlytoaccumulatewealthwillmakethedifferencebetweenamodestandacomfortableretirementinthefuture–andwhetherornotindividualswillneedtorelyontheagepension.
Most(60%)Australianadultsnowengageinsomeformofinvesting(inadditiontotheirinstitutionalsuperannuationfund),butthereisstillasignificantminoritywhodonotinvest.Thereisabigopportunitythere–engagingnon-investorswouldsignificantlyincreasethepoolofinvestedfunds,aswellasassistingthosepeopletofurthertheirfinancialgoals.
Mostinvestorsfeelcomfortablewithshares,cash,andproperty,butlittleelse.Thisispartlydrivenbyalackofawarenessandunderstandingofcertaininvestmentproducts,whichmaybeconstraininginvestors’abilitytobestmatchtheirinvestmentbehaviourstotheir financialgoals.
Atthesametime,itmeansthatinvestorshavelessdiversifiedportfoliosthantheyotherwisecouldhave.Thatis,investorsmaynotbeoptimisingtheirreturnforthelevelofrisktheyaretakingon.Whiletheunderstandingofdiversificationamonginvestorshasimproved,thereseemstobefurtherworktodo.Around40%ofretailinvestorsreportnothavingadiversifiedinvestmentportfolio.
Thiscouldbedrivenlargelybychoice,howeverthecasestudiessuggestthattheremaybebarriershamperinginvestors’effortstodiversify.Inadditiontoalackofreadyaccesstocertainassetclasses,eitherbecauseoflimitedavailabilityorpricingbeingoutofreachforsome,thelackofunderstandingofthebenefitsorcontributionthatmoresophisticatedfinancialproductscanhaveinaportfolio isalsoabarrier.
Currently,mostinvestorsinAustraliaareself-directed,choosingtoconducttheirownresearch.Moreknowledgeableinvestorsmaymakemoreuseofawiderrangeofinvestmentsproducts.However,manyinvestorswanttobeincontrolanddonotseethevalueinseekingprofessionalfinancialadvice.
Thissuggeststhattheinvestmentindustryneedstoreviewthewayinwhichitinteractswithinvestors.Partly,thiswillbethroughadoptingbusinessmodelsthatarecustomer-ledandfocusingonhowitcanhelpinvestorsachievetheirdesiredoutcomesthroughoutdifferentlifestages.
Atthesametime,adoptingdevelopmentsintechnologyandtheimpactsofongoingpolicychangesalsohavethepotentialtoimprovethevalueandreducethecostoffinancialadvice.Thesethingscanchangethevaluepropositionofprofessionalfinancialadviceforinvestors.
Thereisalsoanopportunitytosupportparticipationofnon-investorsbyraisingfinancialliteracy,throughfinancialeducationinitiativesandthroughgreateraccesstofinancialadvice.
Australiahasover11millioninvestors.Butthiscouldbehigher.Thebarrierstoachievingthisarenotinsurmountable.

ASX Australian Investor Study | 2017
73
AMPCapital2017,BlackSkyReport2017.
Ashe,F.2016,DiscussionpointsonRoboadvice,QuantitativeStrategies.
Asia-PacificEconomicCooperation(APEC)2017,AsiaRegionFundsPassport,availableat:http://fundspassport.apec.org/
ASIC2017a,Diversification,availableat:https://www.moneysmart.gov.au/investing/invest-smarter/risk-and-return/diversification
ASIC2017b,Financialliteracystrategy,availableat:http://www.financialliteracy.gov.au/strategy-and-action-plan/financial-literacy-strategy
ASIC2016a,InternationalShares,availableat:https://www.moneysmart.gov.au/investing/shares/international-shares
ASIC2016b,AustralianFinancialAttitudesandBehaviourTrackerWave4,availableat:http://www.financialliteracy.gov.au/media/559536/australian-financial-attitudes-and-behaviour-tracker_wave-4.pdf
AssociationofSuperannuationFundsofAustraliaLimited2016,ASFARetirementStandard,availableat:https://www.superannuation.asn.au/resources/retirement-standard
AssociationofSuperannuationFundsofAustraliaLimited2015,Superannuationaccountbalancesbyageandgender.
ASX2017a,Dailytradingvolumes,availableat:http://www.asx.com.au/asx/statistics/tradingVolumes.do
ASX2017b,Endofmonthvalues,availableat:http://www.asx.com.au/about/historical-market-statistics.htm
ASX2017c,Glossary,availableat:http://www.asx.com.au/education/glossary.htm#I
ASX2017d,ASXFundStatistics,availableat:http://www.asx.com.au/products/managed-funds/market-update.htm
ASX2017e,Corporateoverview,availableat:http://www.asx.com.au/about/corporate-overview.htm
ASX2014,TheAustralianShareOwnershipStudy2014
Austrade2017,InvestinAustralia–Growth,availableat:http://www.austrade.gov.au/International/Invest/Why-Australia/Growth
AustralianBureauofStatistics2017a,5655.0–ManagedFunds,Australia,Dec2016,availableat:http://www.abs.gov.au/AUSSTATS/[email protected]/Lookup/5655.0Main+Features1Dec%202016?OpenDocument
AustralianBureauofStatistics2017b,3101.0–AustralianDemographicStatistics,Sep2016,availableat:http://www.abs.gov.au/AUSSTATS/[email protected]/DetailsPage/3101.0Sep%202016?OpenDocument
AustralianBureauofStatistics2017c,6416.0–ResidentialPropertyIndexes:EightCapitalCities,Dec2016,availableat:http://www.abs.gov.au/AUSSTATS/[email protected]/DetailsPage/6416.0Dec%202016?OpenDocument
AustralianBureauofStatistics2016,3101.0–AustralianDemographicStatistics,Jun2016,availableat:http://www.abs.gov.au/AUSSTATS/[email protected]/DetailsPage/3101.0Jun%202016?OpenDocument
AustralianBureauofStatistics2015,6523.0–HouseholdIncomeandWealth,Australia,2013-14,availableat:http://www.abs.gov.au/AUSSTATS/[email protected]/DetailsPage/6523.02013-14?OpenDocument
AustralianGovernment2015,ImprovingAustralia’sfinancialsystem–GovernmentresponsetotheFinancialSystemInquiry,availableat:http://treasury.gov.au/~/media/Treasury/Publications%20and%20Media/Publications/2015/Government%20response%20to%20the%20Financial%20System%20Inquiry/Downloads/PDF/Government_response_to_FSI_2015.ashx
AustralianInstituteofHealthandWelfare2015,AboutageinginAustralia,availableat:http://www.aihw.gov.au/ageing/about/
AustralianTaxationOffice2017a,Populationandassetallocationtables,availableat:https://www.ato.gov.au/Super/Self-managed-super-funds/In-detail/Statistics/Quarterly-reports/Self-managed-super-fund-statistical-report---December-2016/?anchor=Assetallocation#Assetallocation
AustralianTaxationOffice2017b,Self-managedsuperfundstatisticalreport–December2016,availableat:https://www.ato.gov.au/About-ATO/Research-and-statistics/In-detail/Super-statistics/SMSF/Self-managed-super-fund-statistical-report---December-2016/?anchor=SMSFannualdata#SMSFpopulationtableannualdata
Buttonwood2013,Theimpactoflowinterestrates,TheEconomist,availableat:http://www.economist.com/blogs/buttonwood/2013/02/investing
Canstar2016,AppsforAustraliansharetraders,availableat:https://www.canstar.com.au/online-trading/apps-for-australian-share-traders/
Christie,R.2015,Behaviouraleconomics,financialliteracy,keytoAustralia’sfinancialfuture,FINSIA,availableat:http://www.finsia.com/insights/news/news-article/2015/03/11/behavioural-economics-financial-literacy-key-to-australias-financial-future
Collett,J.2017,Let’sdrinkto17%return,SydneyMorningHerald,26April2017.
References

ASX Australian Investor Study | 2017
74
Deloitte2017,The2017DeloitteMillennialSurvey.
Deloitte2016,TheexpansionofRobo-AdvisoryinWealthManagement.
Deloitte2015a,Robo-Advisors:Capitalisingonagrowingopportunity.
Deloitte2015b,Thedynamicsofa$9.5trillionAustraliansupersystem,availableat:https://www2.deloitte.com/au/en/pages/media-releases/articles/dynamics-of-9-5-trillion-australian-super-system-171115.html
DeloitteAccessEconomics2016a,Australia’sDigitalPulse2016.
DeloitteAccessEconomics2016b,MediaConsumptionSurvey2016.
FidelityInternational2016,30yearsinAustralianandglobalshares,availableat:http://www.fidelity.com.au/fidelityP2/?LinkServID=B91D14A6-B125-E8DC-BB83AAD60C35BC5A
FinancialSystemsInquiry2015,Finalreport,availableat:http://fsi.gov.au/publications/final-report/
GrattanInstitute2014,Thewealthofgenerations,availableat:https://grattan.edu.au/wp-content/uploads/2014/12/820-wealth-of-generations3.pdf
InvestBlue2017,WhyInvestBlue,availableat:https://www.investblue.com.au/trust/
InvestmentMagazine2017,OnthegeopoliticalhorizonintheYearoftheRooster,availableat:https://investmentmagazine.com.au/2017/02/on-the-geopolitical-horizon-in-the-year-of-the-rooster/
InvestmentTrends2015,2015FirstHalfAustralianTradingBehaviourSurvey,availableat:http://www.investmenttrends.com.au/wp-content/uploads/2015/09/Highlights-from-the-Investment-Trends-2015-First-Half-Australia-Trading-Behaviour-Survey.pdf
Kan,S.,Ahmad,I.,Haddad,H.andMumtaz,K.2016,Dofinancialknowledgeandfinancialexperienceaffectthegenderrisktakingattitude?,EuropeanJournalofBusinessandManagement,availableat:http://www.iiste.org/Journals/index.php/EJBM/article/viewFile/34460/35462
Klapper,L.,Lusardi,A.andvanOudheusden,P.2015,FinancialLiteracyAroundtheWorld:InsightsfromtheStandard&Poor’sRatingsServicesGlobalFinancialLiteracySurvey,availableat:http://gflec.org/wp-content/uploads/2015/11/Finlit_paper_16_F2_singles.pdf
Layer8Security,Cybersecuritygovernanceinpublic,privatesectorsfallsshort,availableat:https://layer8security.com.au/cyber-security-governance-in-public-private-sectors-falls-short/
LeggMason2015,2015LeggMasonGlobalInvestmentStudy,availableat:http://www.leggmason.com.au/en/pdf/global-investment-survey-2015.pdf
Lucas,G2017Advisersmustbridgegapwithyouth,IndependentFinancialAdviser,availableat:https://www.ifa.com.au/opinion/17666-advisers-must-bridge-gap-with-youth?utm_source=IFA&utm_campaign=24_04_17&utm_medium=email&utm_content=2
Macquarie2015,FutureofFinancialAdvice,availableat:http://www.macquarie.com.au/mgl/au/advisers/keep-up-to-date/fofa?cid=fofa:ad:0313
Musonera,E,&Safari,V2008,EstablishingaStockExchangeinEmergingEconomies:ChallengesandOpportunities,TheJournalofInternationalManagementStudies,Vol3,No2.
Pickering,C.2016,Canretailhead-offtheageingsqueeze?,InvestSmart,availableat:https://www.investsmart.com.au/investment-news/can-retail-head-off-the-ageing-squeeze/138206
ReserveBankofAustralia2017a,4.DomesticFinancialMarkets,availableat:http://www.rba.gov.au/publications/smp/2017/feb/pdf/04-domestic-financial-markets.pdf
ReserveBankofAustralia2017b,CashRate,availableat:http://www.rba.gov.au/statistics/cash-rate/
ReserveBankofAustralia2017c,StatisticalTables,availableat:http://www.rba.gov.au/statistics/tables/
ReserveBankofAustralia2014,SubmissiontotheFinancialSystemInquiry,availableat:http://www.rba.gov.au/publications/submissions/financial-sector/financial-system-inquiry-2014-03/pdf/financial-system-inquiry-2014-03.pdf
ReserveBankofAustralia1997,PrivatisationinAustralia,availableat:https://www.rba.gov.au/publications/bulletin/1997/dec/pdf/bu-1297-2.pdf
SMSGlobal2016,SmartphonePenetrationByCountry–Top10,availableat:http://thehub.smsglobal.com/smartphone-penetration-by-country-top-10/
SuperGuide2017,Howmuchsuperdoyouneedtoretirecomfortably?,availableat:https://www.superguide.com.au/boost-your-superannuation/comfortable-retirement-how-much-super-need
TheTreasury2017,SuperannuationReforms,availableat:http://www.treasury.gov.au/Policy-Topics/SuperannuationAndRetirement/Superannuation-Reforms
TheTreasury2016,ThestrengthofAustralia’sfinancialsector,availableat:https://fintech.treasury.gov.au/the-strength-of-australias-financial-sector/
TheTreasury2015a,2015IntergenerationalReport–Australiain2055,availableat:http://www.treasury.gov.au/~/media/Treasury/Publications%20and%20Media/Publications/2015/2015%20Intergenerational%20Report/Downloads/PDF/2015_IGR.ashx
TheTreasury2015b,GovernmentResponsetotheFinancialSysteminquiry,availableat:http://treasury.gov.au/fsi
TheTreasury2010,OverhaulofFinancialAdvice,availableat:http://ministers.treasury.gov.au/DisplayDocs.aspx?doc=pressreleases/2010/036.htm&pageID=003&min=ceba&Year=&DocType=0
UNSWNewsroom2016,Howinvestorsholdoninatimeoflowinterestrates,availableat:http://newsroom.unsw.edu.au/news/business-law/how-investors-hold-time-low-interest-rates
Yeats,C.2016,Investorreturnscrunchedinanultra-lowinterestrateworld,TheSydneyMorningHerald,availableat:http://www.smh.com.au/business/the-economy/investor-returns-crunched-in-an-ultralow-interest-rate-world-20160513-gouu6a.html

ASX Australian Investor Study | 2017
75
AppendixA–MethodologyApproach Therewerethreemajorcomponentstothedatacollectionprocessforthisreport.Thefirstwastoundertakesecondaryresearchtounderstandthecurrenteconomic,environmental,andmarketforcesdrivinginvestmentbehaviourinAustralia.
Thisanalysisofmegatrendsandtheinvestmentlandscapeinformedthedesignofacomprehensivequestionnairefocusingoninvestors’propensitytoseekadviceandtypeofadvicesought,thewaythattheytrade,andthetypesofinvestmentstheychoosetohold.
ResearchNowwascommissionedtofieldthesurveyandcollectdatawhichwasthenanalysedbyDeloitteAccessEconomics.Datawascollectedviaanonlineportalandtookrespondentsapproximately10-15minutestocomplete.ThesurveywasinfieldoverFebruaryandMarch2017,with4,000responsescollectedintotal.
Surveydatahasbeensupplementedbycasestudies.Sixconsultationswereheldwithfinancialprofessionalstotesttheconclusionsfromthedata,andadddetail totheinsightsthesurveyrevealed.
Sample population Thesurveysamplewasnationallyrepresentative,usingage,gender,andlocationquotastoensurethatresultsalignedwithABSestimatesofthenation.Thismeansthatresultsdidnotneedtobere-weightedtoalignwiththepopulation,ashasbeendoneinpreviousstudies.
Thesampleincluded2,391investorsand1,609non-investors.Thetablebelowprovidesafurtherbreakdown.
Number of responses Percentage of sample
Investors 2,391 60%
On-ExchangeInvestors 1,494 37%
OtherInvestors 897 22%
Non-Investors 1,609 40%
LapsedInvestors 406 10%
NeverInvested 1,203 30%
Total 4000 100%

ASX Australian Investor Study | 2017
76
Margin of error Themarginoferrorforanysurveybasedonarandomsampledependsonboththesizeofthesampleandtheobservedproportion.Thetablebelowcontainsthemarginoferror(ata95%confidenceinterval)fordifferentsamplesizesandforobservedproportionsthatrangefrom10%to90%.Forexample,themarginoferrorforasurveyof4,000,wheretheobservedproportionis50%is±1.6%.Thismeansthetrueproportionisbetween48.4%and51.6%.
Age brackets Theagebreakdownfortheinvestorpersonasisasfollows:
• Nextgeneration–18-24yearoldinvestors(207respondents)
• Wealthaccumulators–25-59yearoldinvestors(1,622respondents)
• Retirees–60yearoldandolderinvestors(562respondents)
• Non-investors(1,609respondents).
Observed population
Sample size 10% or 90% 20% or 80% 30% or 70% 40% or 60% 50%
100 ± 5.9% 7.8% 9.0% 9.6% 9.8%
200 ± 4.2% 5.6% 6.4% 6.8% 6.9%
300 ± 3.4% 4.6% 5.2% 5.6% 5.7%
400 ± 2.9% 3.9% 4.5% 4.8% 4.9%
500 ± 2.6% 3.5% 4.0% 4.3% 4.4%
700 ± 2.2% 3.0% 3.4% 3.6% 3.7%
1000 ± 1.9% 2.5% 2.8% 3.0% 3.1%
1500 ± 1.5% 2.0% 2.3% 2.5% 2.5%
2000 ± 1.3% 1.8% 2.0% 2.2% 2.2%
2500 ± 1.2% 1.6% 1.8% 2.0% 2.0%
3000 ± 1.1% 1.4% 1.6% 1.8% 1.8%
3500 ± 1.0% 1.3% 1.5% 1.6% 1.7%
4000 ± 0.9% 1.2% 1.4% 1.5% 1.6%

ASX Australian Investor Study | 2017
77
AppendixB–DefinitionsAdult populationreferstoallAustraliansaged18yearsandolder.
Bondsareatypeofdebtsecurity.TheyareeffectivelyanIOUbetweenaborrowerortheissuerofthebond,usuallyagovernmentorcompany,andtheinvestor.Investorsreceiveinterestpaymentsatcertainintervalsandalsohavetheirprincipalreturnedonastatedfuturedate.
Exchange Traded Funds (ETFs)areatypeofmanagedfundwhichcanbetradedonASX.Theyholdaportfolioofsecurities,whichmayincludeAustralianorinternationalshares,fixedincome,commodities,propertytrusts,oracombinationofassetclasses.
Financial adviceisadviceprovidedbyafinancialadviser/plannerorfull-service/advicestockbroker.ThisisasubsetofProfessionalAdvice.
Futuresarecontractstobuyorsellaparticularasset(orcashequivalent)onaspecifiedfuturedate.ThemostpopularinAustraliaistheS&P/ASX200orASXSPI200®IndexFuturescontract.
Hybrid securitiesblendsomeofthefeaturesofdebt(fixedinterest)andequity(shares).Theymakeinterestpaymentsuntilacertaindate.Somehybridsconvertintosharesafteraperiodoftime.
Infrastructure fundsprovidetheopportunitytoinvestinessentialpublicassets,suchastollroads,airportsandrailfacilities.Theyaremanagedbyspecialistfundmanagersandtheirreturnsusuallycombinecapitalgrowthanddividendincomeinvaryingproportions.
Instalments warrantsletyoubuyaninvestmentoveraperiodoftime.Instalmentsallowyoumakeapartpaymentonthesharesandpaythebalanceinoneormorepaymentsovertime.Yougetallthebenefitsofowningthesharesfromdayone,suchasreceivingfulldividends.
Lapsed investorsarepeoplewhohave heldinvestmentsinthepast,butdonotcurrentlydoso.
Listed Investment Companies(LICs)provideexposuretoadiversifiedportfolioofinvestmentsonbehalfoftheirinvestors.TheseinvestmentsmayincludeAustralianshares,internationalshares,privateequityandspecialistsectors,suchasresources.
mFundsareunlistedmanagedfundsavailabletoinvestorsthroughthemFundSettlementServicewhichallowsinvestorstobuyandselltheunlistedfundsviatheirbrokerinasimilarwaytoshares.
Never investedarepeoplewhohaveneverownedinvestments.
Non-investorscomprisebothLapsedInvestorsandpeoplethathaveNeverInvested.
On-exchange investmentsisatermusedinthisreporttorefertolistedinvestmentsandotherfinancialproductsavailableonafinancialexchangeorheldthroughunlistedmanagedfunds.Thisincludesshares,derivatives,andotherproductssuchasbondsandETFs.
On-exchange investorsarepeople whoownsomeformofon-exchangeinvestmentproduct.
Options arecontractsbetweentwoparties,givingthebuyertheright–butnotanobligation–tobuyorsellanunderlyingsecurityatapredeterminedpriceataparticulartimeinthefuture.Theunderlyingsecuritiesmaybecompaniesorindices.
Ordinary warrantsareissuedbyabankorotherfinancialinstitutionandaretradedonASX.Itissimilartoanoption.Itgivesyoutherighttobuyanassetsuchasashareatasetpriceuntiladateinthefuture.Usedforspeculation.Underlyingsecuritiesmaybeshares,indices,ETFs,commodities,currencies.
Other investorsarepeoplewhoinvest,butnotinon-exchangeinvestments.Insteadtheyatleastoneofthefollowing:commercialorresidentialinvestmentproperty,cashortermdeposits,orotherinvestmentsthatarenoton-exchangeinvestments.
Professional adviceisadviceprovidedbyafinancialadviser/planner,afull-service/advicestockbroker,alawyer,oranaccountant.
Real Estate Investment Trusts (REITs)usethepooledcapitalofmanyinvestorstopurchaseandmanagepropertyassets.Theycanspecialiseinparticulartypesofpropertylikeoffices,industrialbuildings,hotels,retailshoppingcentres,orincludeacombinationofpropertytypes.
Share ownersareinvestorswhoholdshares,eitherdomesticallyorinternationally.

ASX Australian Investor Study | 2017
78
AppendixC– Internationalcomparisons
• HongKong–NielsenrevealsHongKongfirstquarterconsumerconfidence,Nielsenmediarelease,31May2016
• Germany–AktionärszahlendesDeutschenAktieninstituts2016,DeutschesAktieninstitute.V.
• NewZealand–Offshoreownershiphitsafiveyearhigh,JBWere,5December2016
• Sweden–ShareholderStatistics,OwnershipofsharesincompaniesquotedonSwedishexchanges,StatisticsSweden,December2016,Table5b
ASXhascompletedaninternationalcomparisonofshareownershipaspartoftheAustralianInvestorStudy2017.
Thebestavailablefigureshavebeenused.However,itshouldbenotedthatthe2017studydoesnotprovideanabsolute comparisonduetodifferencesinmethodology,sampling,timing,anddefinitionswiththeavailableinternationalstudies.
Theincidenceofownershipofon-exchangeinvestmentproductsinAustraliaremainshighbyinternationalstandards.
% 2006 2007 2008 2009 2010 2011 2012 2013 2014 2015 2016 2017
Australia – on-exchange investments
46 41 43 38 36 37
New Zealand 26 28 22 22 23 23 26 26 23
Hong Kong – shares 36 35 36 36 41
Germany – shares 7 6 6 6 6 6 7 7 6 7
Germany – shares/funds 16 16 14 14 13 13 15 14 13 14
Sweden – shares 20 19 18 17 17 16 15 14 14 14
UK – stocks/funds 20 20 18 18 17 17 15 18
USA – shares 18 15 14
Notes: Studiesarenotdirectlycomparable.USandUKdataarebasedonhouseholds,notindividuals.
• UK–FamilyResourcesSurvey2015/16,UKDepartmentforWorkandPensions,Savingsandinvestmentsdatatables, 16March2017
• USA–SurveyofConsumerFinance,2013SCFChartbook,FederalReserve,p291.September2014.

ASX Australian Investor Study | 2017
79
Limitationofourwork
General use restrictionThisreportispreparedsolelyfortheuseofASXLimited.ThisreportanditscontentsarenotintendedtoandshouldnotbeusedorrelieduponbyanyoneelseandnoneofDeloitteToucheTohmatsuLimited,itsmemberfirms,ortheirrelatedentities(collectivelythe“DeloitteNetwork”),oranyotherentitiesorpersonsmentionedinthereportorcontributingcontenttothereport(the“Contributors”),acceptanydutyofcaretoanyotherpersonorentity.ThereporthasbeenpreparedtoanalyseAustralianinvestorbehaviourandmegatrendsaffectingtheinvestmentlandscape.Thisreportcontainsgeneralinformationonly,[hasbeenpreparedwithouttakingintoaccountyourobjectives,financialsituationorneeds]andnoneoftheDeloitteNetworkortheContributorsis,bymeansofthisreport,renderingprofessionaladviceorservices.Beforemakinganydecisionortakinganyactionthatmayaffectyourfinancesoryourbusinessoractingonanyinformationinthisreport,youshouldconsultaqualifiedprofessionaladviserandconsiderwhethertheinformationisappropriateforyourcircumstances.NoentityintheDeloitteNetworkandnoneoftheContributorsshallberesponsibleforanylosswhatsoeversustainedbyanypersonwhoreliesonthisreport.

ASX Australian Investor Study | 2017
80

Contact us
Deloitte Access EconomicsACN: 149 633 116Level 14, 225 George StreetSydney NSW 2000Tel: +61 2 9322 7000Fax: +61 2 9322 7001
Deloitte Access Economics is Australia’s pre-eminent economics advisory practice and a member of Deloitte's global economics group. For more information, please visit our website
www.deloitte.com/au/deloitte-access-economics
Deloitte refers to one or more of Deloitte Touche Tohmatsu Limited, a UK private company limited by guarantee, and its network of member firms, each of which is a legally separate and independent entity. Please see www.deloitte.com/au/about for a detailed description of the legal structure of Deloitte Touche Tohmatsu Limited and its member firms.
The entity named herein is a legally separate and independent entity. In providing this document, the author only acts in the named capacity and does not act in any other capacity. Nothing in this document, nor any related attachments or communications or services, have any capacity to bind any other entity under the ‘Deloitte’ network of member firms (including those operating in Australia).
About Deloitte
Deloitte provides audit, tax, consulting, and financial advisory services to public and private clients spanning multiple industries. With a globally connected network of member firms in more than 150 countries, Deloitte brings world-class capabilities and high-quality service to clients, delivering the insights they need to address their most complex business challenges. Deloitte's approximately 200,000 professionals are committed to becoming the standard of excellence.
About Deloitte Australia
In Australia, the member firm is the Australian partnership of Deloitte Touche Tohmatsu. As one of Australia’s leading professional services firms. Deloitte Touche Tohmatsu and its affiliates provide audit, tax, consulting, and financial advisory services through approximately 6000 people across the country. Focused on the creation of value and growth, and known as an employer of choice for innovative human resources programs, we are dedicated to helping our clients and our people excel. For more information, please visit our web site at www.deloitte.com.au.
Liability limited by a scheme approved under Professional Standards Legislation.
Member of Deloitte Touche Tohmatsu Limited
© 2017 Deloitte Touche Tohmatsu
MCBD_HYD_05/17_053996