Embed Size (px)
Citation preview

59
© 2019 Adama Science & Technology University. All rights reserved
Ethiopian Journal of Science and Sustainable Development
e-ISSN 2663-3205 Volume 6 (1), 2019
Journal Home Page: www.ejssd.astu.edu.et ASTU
Research Paper
Prediction of Bearing Capacity of Fine Grained Soils from Field Dynamic Cone
Penetration Reading: Case of Clayey Soil from Asella, Ethiopia
Kemal Abdela1, Yadeta C. Chemeda2,*
1Bule Hora University, College of Engineering and Technology, Civil Engineering Department, P.O. Box 144, Bule Hora,
Ethiopia 2Adama Science and Technology University, School of Applied Natural Sciences, Department of Applied Geology, Adama,
Ethiopia
* Corresponding author, e-mail: [email protected]
Abstract
Bearing capacity is one of the important parameters that needs to be considered for design and construction of foundations of
civil engineering structures. The conventional method of estimating this parameter is commonly using Terzaghi’s equation,
which requires the shear strength parameter of soil. Shear strength test is expensive and time consuming, hence conventional
method of estimating bearing capacity is uneconomical especially for small scale projects. Dynamic cone penetrometer (DCP)
is one of the simple in situ test methods widely used in site investigation for estimating the strength and density of soils. This
work is, therefore, aimed at predicting bearing capacity of shallow foundations from field in situ DCP reading for fine grained
soils of Asella town, Ethiopia. The soil index properties and tri-axial tests to determine the shear strength parameters were
performed on soil samples extracted from different pits. On the same pits, DCP test have been performed in the field to record
D-value (mm/blow). Then, regression analyses have been performed to determine relationship of allowable bearing capacity
(qall) with D-value and index properties. Regression analyses results showed that qall have strong relation with D-value having
coefficient of determination (R2=0.89) than index properties. The footing dimension have no effect on the predicted bearing
capacity of foundation. The comparison between the developed equation and the actual qall obtained from Terzaghi’s bearing
capacity equation shows average variations of 11.7%, suggesting the validity of the developed equation.
Keywords: Dynamic Cone Penetration, Bearing Capacity, Shallow foundation, Shear strength, Correlation
1. Introduction
The causes of failure of light weight engineering
structures built on clayey soils are mostly related to the
expansive nature of the soils (Bell, 1996). Improper
estimation of bearing capacities of the soil mass can also
lead to failure. On the other hand, underestimation of
soil load carrying ability leads to increase of cost of
project unnecessarily. Bearing capacity is, therefore,
one of the important parameters to be accurately
investigated for design of foundations of civil
engineering structures (Bowles, 1993).
In conventional approach, bearing capacity of
foundation soil is mostly calculated from Terzaghi’s
bearing capacity equation (Murthy, 2007), which
requires the shear strength parameters such as cohesion
(C) and angle of internal friction (Ф). Tri-axial
compression test is a widely used method to measure the
shear strength parameters of a soil in the laboratory by
controlling confining stress and drainage condition. The
aforementioned method, however, requires relatively
more time, effort as well as money. Therefore, it may
not be economical for small engineering projects such
Kemal Abdela & Chemeda Y.C. Ethiop.J.Sci.Sustain.Dev., Vol. 6 (1), 2019
60
as in residential house development. In light of these
challenges, there is a need to find time and cost effective
ways that can replace shear strength parameters for
determination of bearing capacity of shallow foundation
for light structures. In addition, the application of field
tests for site investigation are important for professional
engineers since present practice is to rely more on field
tests. The in situ field test can avoid some of the
problems of sample disturbance associated with the
extraction of soil samples from ground.
Dynamic cone penetrometer (DCP) instrument is
simple and portable. It is one of the in situ penetration
test methods widely used in site investigation for
estimating the strength and density of soils (Sanglerat,
1972). The principle of DCP test is based on dynamic
resistance offered by soil to deformation caused by
dynamic penetrometer (Braja, 1985). Its application
mostly limited to pavement overlay design. Due to this,
extensive attempts have been made by different
researchers to find the empirical relationship between
DCP reading and California bearing ratio (CBR) (Scala,
1956; Van Vuuren, 1969; Kleyn, 1975; Livney, 1987;
Amini, 2003, etc.). Their results suggests that CBR can
be predicted satisfactorily from DCP values. However,
as the results of previous works showed, the relationship
between different engineering parameters with DCP is
highly material dependent. Regarding correlation
between DCP reading and bearing capacity of a soil,
only few works have been carried out on limited types
of soil (i.e., lateritic soil) and mainly on re-moulded
soils at lab scale (Sanglerat, 1972; Cearns and
McKenzie, 1988; Ampadu, 2005; Dzitse-Awuku,
2008). Ampadu & Dzitse-Awuku (2009) also
contributed towards the search for a correlation by
measuring the bearing capacity of a model ground in the
laboratory and correlating it to the DCP test results. In
all these mentioned works, the DCP test was conducted
on re-moulded and re-compacted materials at optimum
moisture contents.
In Ethiopia including the study area, it is common to
place the foundation of simple structure on natural
ground at depth less than 3 meter. So far no attempt has
been made to correlate the in situ DCP result with the
bearing capacity of natural ground (uncompacted and at
natural moisture content). In addition, previously
developed correlation by different researchers to predict
bearing capacity of soil have limited application to
different study area and are typically only reliable over
the range of data from which they were derived.
Adopting those developed correlations without
improvement can lead to misinterpretation of soil
behaviors. This study, therefore, attempts to establish
correlation between allowable bearing capacity of
shallow foundation and field dynamic cone penetration
(DCP) reading for the case of expansive soils of Asella
town.
2. Materials and Methods
Field DCP test and soil sampling were carried out in
Asella town on 15 test pit locations (Figure 1) where
expansive soils are identified visually. Depth of
sampling varies from 1.5 – 2.5 m as it is common on the
study area to place the foundation at this depth. Both
disturbed soil (for index properties test) and undisturbed
soil (for tri-axial compression test) samples were
extracted from test pits.
For index properties test, the bulk soil samples were
first air dried for about 3 days to almost constant
moisture content. All the tests (i.e. grain size
distribution, liquid limit (by Casagrande method),
plastic limit, specific gravity, free swelling index, etc.)
were conducted on representative sample following the
ASTM standards. Two methods were used to find the
particle-size distribution of the soil samples: sieve
analysis, for particle sizes larger than 0.075 mm (No.
200) in diameter; and hydrometer analysis for particle-
sizes smaller than 0.075 mm in diameter. Sodium
hexametaphosphate (NaPO3) was used as a dispersion
agent.
The DCP test was performed in the test pit after
excavation to the desired depth. The test device used in
this study consists of two 16 mm diameter rods. The
lower rod contains anvil and replaceable 60° apex cone.
The upper rod contains 8 kg slide hammer with 575 mm
drop height. The cone diameter (20 mm) is made wider
than rod diameter (16 mm) so that penetration resistance
is provided by cone alone and not side friction of the
rods. The penetration achieved by each blow was
recorded and plotted to obtain the dynamic cone
penetration index (D-value). D-value is the penetration
produced by one drop of the sliding hammer and it is
obtained as the gradient of the line of best fit of the graph
of cumulative blow against penetration in mm (Figure
2).
Kemal Abdela & Chemeda Y.C. Ethiop.J.Sci.Sustain.Dev., Vol. 6 (1), 2019
61
R² = 0.9968
y = 31.665x - 20.118
0
200
400
600
800
1000
0 10 20 30 40
De
pth
pf
pe
ne
trat
ion
(m
m)
Σ blow
Figure 1: Location map of the study area and test pits
Figure 2: Typical cumulative blows-penetration curve
from DCP test (Test pit 4)
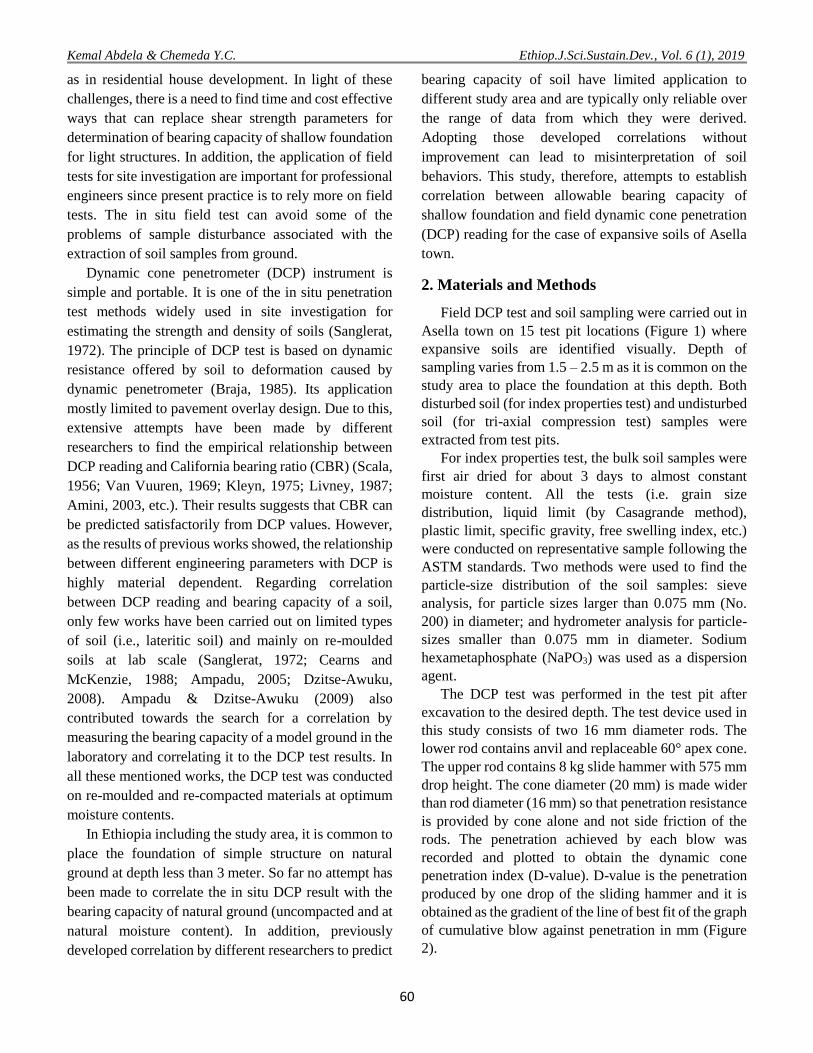
In tri-axial compression tests, a cylindrical soil
sample of standard size (diameter = 38 mm and height
= 76 mm) was trimmed from undisturbed core sample
and encased by a thin rubber membrane and placed
inside a chamber. For conducting the test, the chamber
is filled with water and the sample is subjected to a
confining pressure of 150 and 300 kPa by application of
pressure to the water in the chamber. Axial (or deviator)
stress is applied through a vertical loading ram. No
drainage is permitted during the test and specimen is
sheared in compression without drainage at constant rate
of axial deformation (strain controlled) of 1 mm/min.
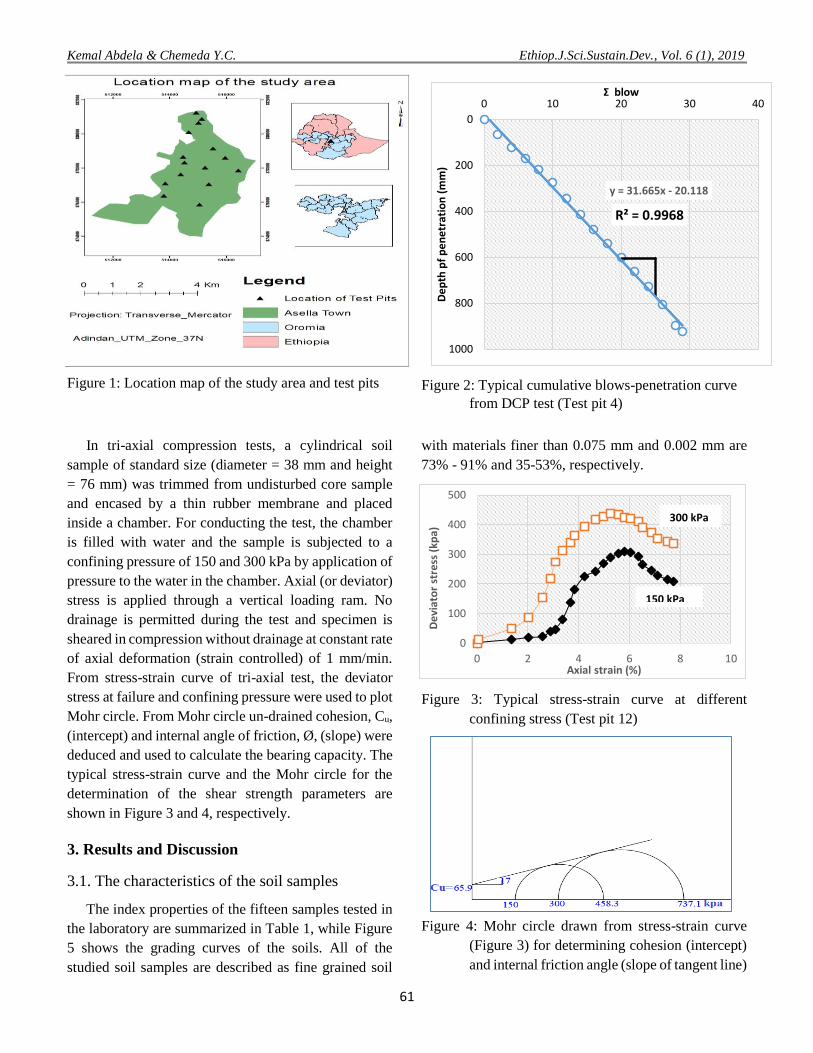
From stress-strain curve of tri-axial test, the deviator
stress at failure and confining pressure were used to plot
Mohr circle. From Mohr circle un-drained cohesion, Cu,
(intercept) and internal angle of friction, Ø, (slope) were
deduced and used to calculate the bearing capacity. The
typical stress-strain curve and the Mohr circle for the
determination of the shear strength parameters are
shown in Figure 3 and 4, respectively.
3. Results and Discussion
3.1. The characteristics of the soil samples
The index properties of the fifteen samples tested in
the laboratory are summarized in Table 1, while Figure
5 shows the grading curves of the soils. All of the
studied soil samples are described as fine grained soil
with materials finer than 0.075 mm and 0.002 mm are
73% - 91% and 35-53%, respectively.
Figure 3: Typical stress-strain curve at different
confining stress (Test pit 12)
Figure 4: Mohr circle drawn from stress-strain curve
(Figure 3) for determining cohesion (intercept)
and internal friction angle (slope of tangent line)
0
100
200
300
400
500
0 2 4 6 8 10
De
viat
or
stre
ss (
kpa)
Axial strain (%)
300 kPa
150 kPa

Kemal Abdela & Chemeda Y.C. Ethiop.J.Sci.Sustain.Dev., Vol. 6 (1), 2019
62
Table 1: Basic properties of the soils used in this study
The specific gravity of most of the soil was found to be
in the range of 2.67 to 2.83 which is typical range for
black cotton expansive soils (Murthy, 2007). The liquid
limit (LL) and plastic limit (PL) range from 56% - 70%
and 23% - 40%, respectively. The plasticity index (PI)
range from 12 to 47%. Most of the soils of the study area
fall in high plasticity type, except the soil from test pit 3
which is low plasticity type. Similarly, the free swelling
index (SI) values and natural moisture content (NMC)
are relatively higher indicating the soils under
investigation possess significant water adsorption and
retention capacity and higher swelling-shrinkage
potential.
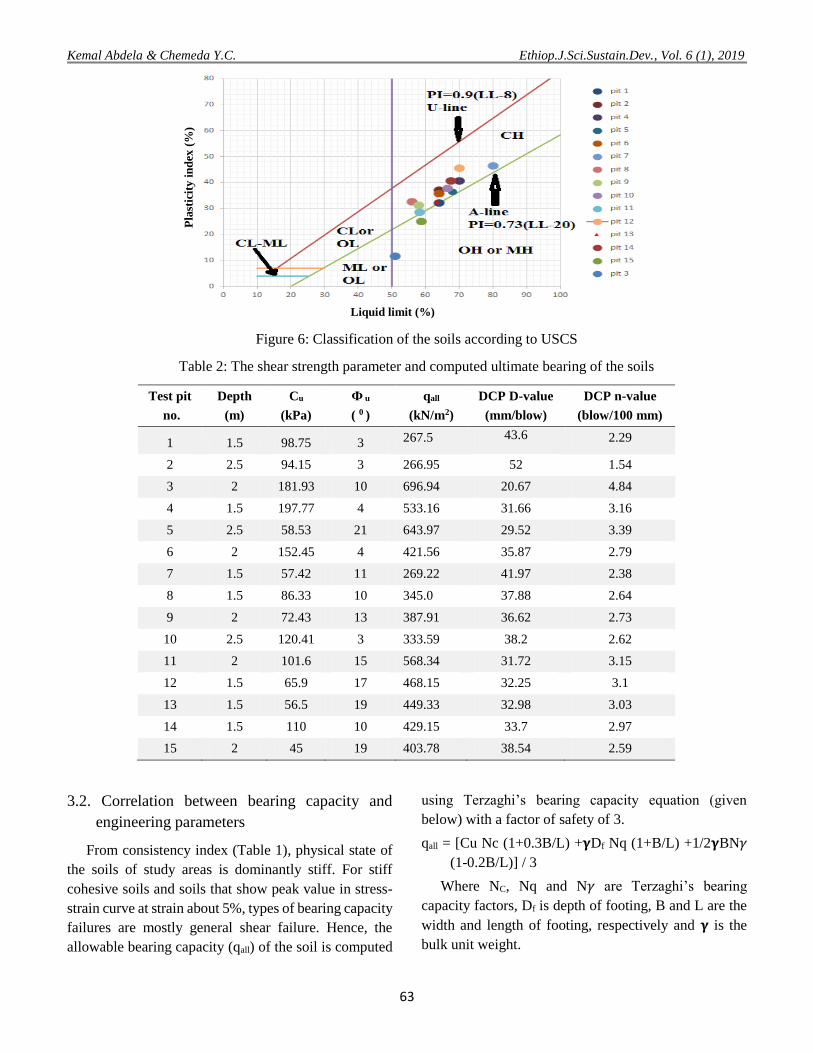
Classification of the soils according to unified soil
classification system (USCS) is shown in Figure 6. The
plot shows that except the soil from test pit 3 and 15,
which are high plastic inorganic silt (MH), the soil
samples are classified as high plastic inorganic clay
(CH).
The results of the tri-axial tests showed that for all of
the tested soils, a clear maximum deviator stress
occurred at axial strain less than 7% at which the failure
defined. The shear strength parameters (i.e. underained
cohesion (Cu) and internal friction angles (Ø)) of the
soils that used for computing bearing capacity are
summarized in Table 2. As indicated in the table, the Cu
ranges between 45 and 197.8 kPa and Ø value ranges
between 3º and 21º. The cohesion value is relatively
higher and friction angle is lower as expected for fine
grained cohesive soils.
Figure 5. Grain size distribution of the soils
Test pit
no.
Depth
(m)
Clay
fraction
(%)
NMC
(%)
LL
(%)
PL
(%)
PI
(%)
SI
(%) CI 𝛾dry
(kN/m3) 𝛾
(kN/m3)
1 1.5 37.1 48.8 64 33.3 30.7 130 0.5 12.9 17.95
2 2.5 52.5 47 64 26.8 37.2 105 0.46 12.2 17.65
3 2 28.2 42.5 61 39.4 21.6 62.5 0.74 13.1 17.9
4 1.5 50 44.6 70 29.3 40.7 107.5 0.62 12.5 17.6
5 2.5 48.5 43.3 68 31.7 36.3 82.5 0.68 12.6 17.9
6 2 47.8 41.6 64 28.3 35.7 102.5 0.63 12.5 17.6
7 1.5 58.5 35.3 80 33.3 46.7 132.5 0.98 12.4 17.4
8 1.5 47.4 37.9 56 23.4 32.6 112.5 0.71 12.8 17.65
9 2 49.7 37.3 58 26.8 31.2 125 0.66 12.5 17.65
10 2.5 48.3 35.4 66 28.6 37.9 135 0.82 12.7 17.9
11 2 43.4 40.5 60 31.4 28.6 117.5 1.03 12.8 17.85
12 1.5 49.5 40.1 70 24.4 45.6 115 0.66 12.8 17.85
13 1.5 46.7 37.8 63.5 31 32.5 122.5 0.91 13 17.9
14 1.5 47.4 39.3 67.5 31.7 35.8 97.5 0.79 12.7 17.6
15 2 34.3 37.5 58.5 33.3 25.2 85 0.84 12.3 17.7
Kemal Abdela & Chemeda Y.C. Ethiop.J.Sci.Sustain.Dev., Vol. 6 (1), 2019
63
Figure 6: Classification of the soils according to USCS
Table 2: The shear strength parameter and computed ultimate bearing of the soils
3.2. Correlation between bearing capacity and
engineering parameters
From consistency index (Table 1), physical state of
the soils of study areas is dominantly stiff. For stiff
cohesive soils and soils that show peak value in stress-
strain curve at strain about 5%, types of bearing capacity
failures are mostly general shear failure. Hence, the
allowable bearing capacity (qall) of the soil is computed
using Terzaghi’s bearing capacity equation (given
below) with a factor of safety of 3.
qall = [Cu Nc (1+0.3B/L) +𝛄Df Nq (1+B/L) +1/2𝛄BN𝛾
(1-0.2B/L)] / 3
Where NC, Nq and N𝛾 are Terzaghi’s bearing
capacity factors, Df is depth of footing, B and L are the
width and length of footing, respectively and 𝛄 is the
bulk unit weight.
Test pit
no.
Depth
(m)
Cu
(kPa)
Ф u
( 0 )
qall
(kN/m2)
DCP D-value
(mm/blow)
DCP n-value
(blow/100 mm)
1 1.5 98.75 3 267.5 43.6 2.29
2 2.5 94.15 3 266.95 52 1.54
3 2 181.93 10 696.94 20.67 4.84
4 1.5 197.77 4 533.16 31.66 3.16
5 2.5 58.53 21 643.97 29.52 3.39
6 2 152.45 4 421.56 35.87 2.79
7 1.5 57.42 11 269.22 41.97 2.38
8 1.5 86.33 10 345.0 37.88 2.64
9 2 72.43 13 387.91 36.62 2.73
10 2.5 120.41 3 333.59 38.2 2.62
11 2 101.6 15 568.34 31.72 3.15
12 1.5 65.9 17 468.15 32.25 3.1
13 1.5 56.5 19 449.33 32.98 3.03
14 1.5 110 10 429.15 33.7 2.97
15 2 45 19 403.78 38.54 2.59
Liquid limit (%)
Pla
stic
ity
in
dex
(%
)
Kemal Abdela & Chemeda Y.C. Ethiop.J.Sci.Sustain.Dev., Vol. 6 (1), 2019
64
qall = -6.485 PI + 662.3R² = 0.2
0
100
200
300
400
500
600
700
800
0 10 20 30 40 50
qal
l(k
Pa)
PI (%)
qall = -2.9531 LL + 635.3R² = 0.02
0
100
200
300
400
500
600
700
800
40 50 60 70 80 90
qal
l(k
Pa)
LL (%)
qall = 44.936 CI + 410.25R² = 0.003
0
100
200
300
400
500
600
700
800
0.4 0.6 0.8 1 1.2
qal
l(k
Pa)
CI
qall = 230.91 ℽdry - 2483.1R² = 0.21
0
100
200
300
400
500
600
700
800
12 12.5 13
qal
l(k
Pa)
ℽdry (kN/m3)
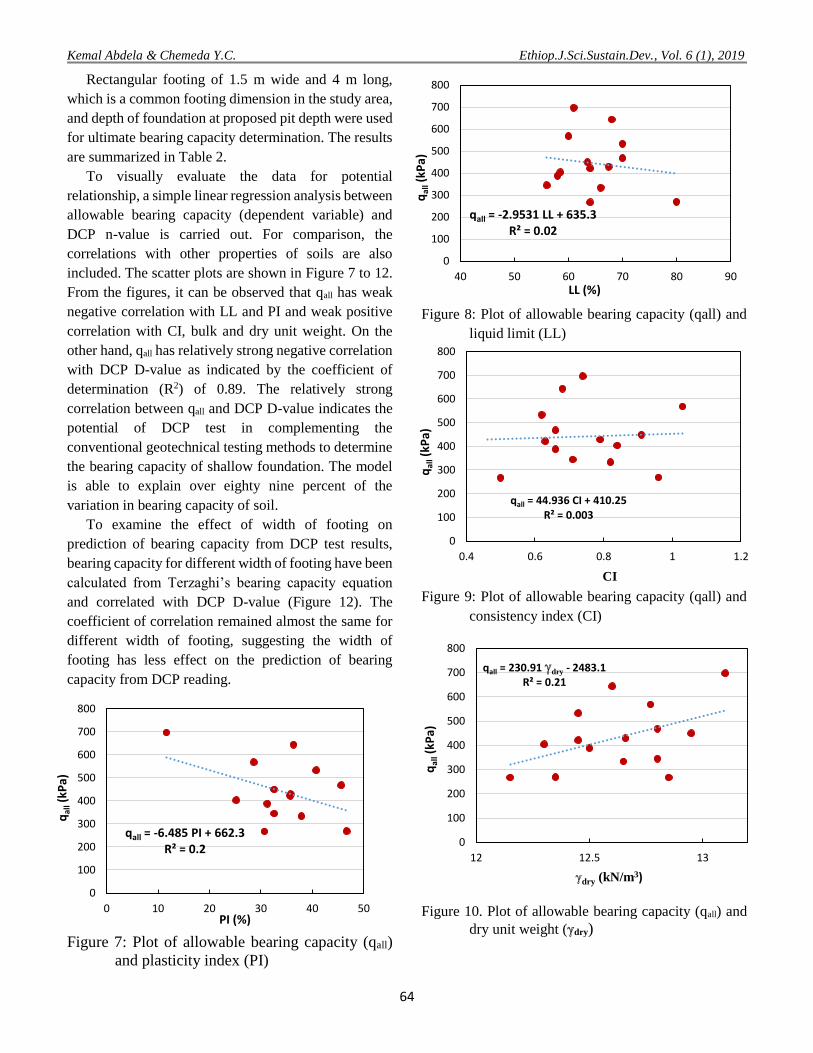
Rectangular footing of 1.5 m wide and 4 m long,
which is a common footing dimension in the study area,
and depth of foundation at proposed pit depth were used
for ultimate bearing capacity determination. The results
are summarized in Table 2.
To visually evaluate the data for potential
relationship, a simple linear regression analysis between
allowable bearing capacity (dependent variable) and
DCP n-value is carried out. For comparison, the
correlations with other properties of soils are also
included. The scatter plots are shown in Figure 7 to 12.
From the figures, it can be observed that qall has weak
negative correlation with LL and PI and weak positive
correlation with CI, bulk and dry unit weight. On the
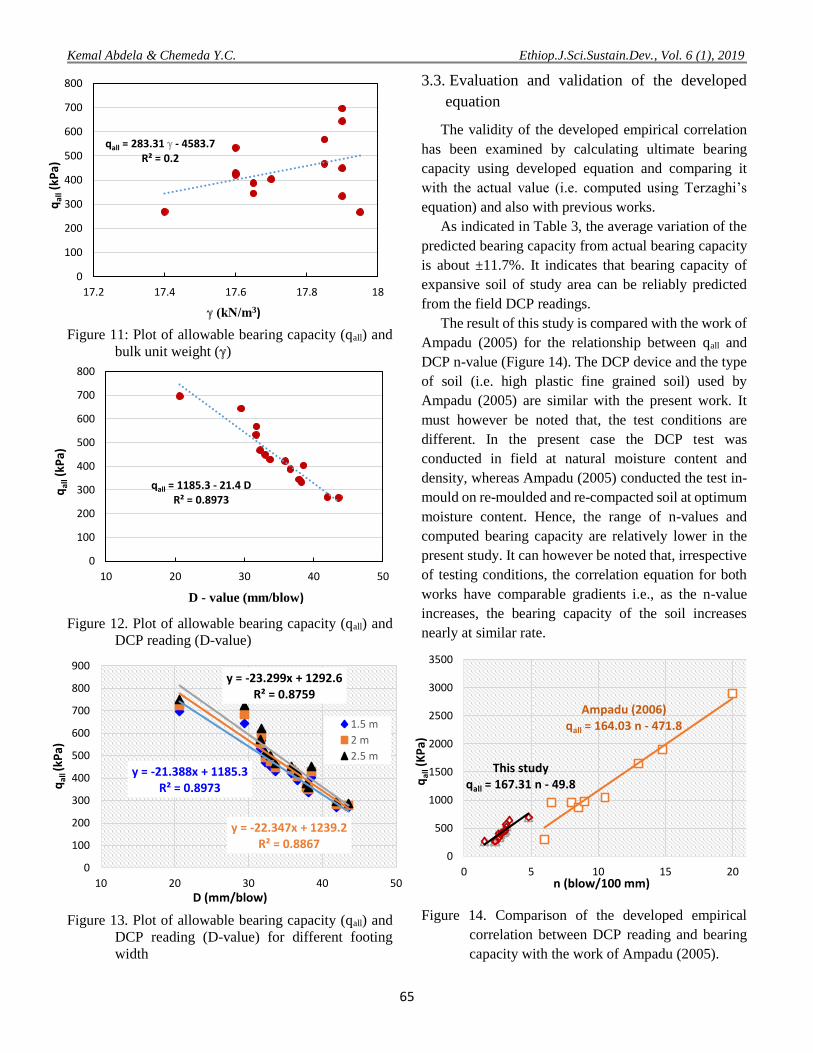
other hand, qall has relatively strong negative correlation
with DCP D-value as indicated by the coefficient of
determination (R2) of 0.89. The relatively strong
correlation between qall and DCP D-value indicates the
potential of DCP test in complementing the
conventional geotechnical testing methods to determine
the bearing capacity of shallow foundation. The model
is able to explain over eighty nine percent of the
variation in bearing capacity of soil.
To examine the effect of width of footing on
prediction of bearing capacity from DCP test results,
bearing capacity for different width of footing have been
calculated from Terzaghi’s bearing capacity equation
and correlated with DCP D-value (Figure 12). The
coefficient of correlation remained almost the same for
different width of footing, suggesting the width of
footing has less effect on the prediction of bearing
capacity from DCP reading.
Figure 7: Plot of allowable bearing capacity (qall)
and plasticity index (PI)
Figure 8: Plot of allowable bearing capacity (qall) and
liquid limit (LL)
Figure 9: Plot of allowable bearing capacity (qall) and
consistency index (CI)
Figure 10. Plot of allowable bearing capacity (qall) and
dry unit weight (ℽdry)
Kemal Abdela & Chemeda Y.C. Ethiop.J.Sci.Sustain.Dev., Vol. 6 (1), 2019
65
qall = 283.31 ℽ - 4583.7R² = 0.2
0
100
200
300
400
500
600
700
800
17.2 17.4 17.6 17.8 18
qal
l(k
Pa)
ℽ (kN/m3)
qall = 1185.3 - 21.4 DR² = 0.8973
0
100
200
300
400
500
600
700
800
10 20 30 40 50
qal
l(k
Pa)
D - value (mm/blow)
y = -21.388x + 1185.3R² = 0.8973
y = -22.347x + 1239.2R² = 0.8867
y = -23.299x + 1292.6R² = 0.8759
0
100
200
300
400
500
600
700
800
900
10 20 30 40 50
qal
l (kP
a)
D (mm/blow)
1.5 m
2 m
2.5 m
Figure 11: Plot of allowable bearing capacity (qall) and
bulk unit weight (ℽ)
Figure 12. Plot of allowable bearing capacity (qall) and
DCP reading (D-value)
Figure 13. Plot of allowable bearing capacity (qall) and
DCP reading (D-value) for different footing
width
3.3. Evaluation and validation of the developed
equation
The validity of the developed empirical correlation
has been examined by calculating ultimate bearing
capacity using developed equation and comparing it
with the actual value (i.e. computed using Terzaghi’s
equation) and also with previous works.
As indicated in Table 3, the average variation of the
predicted bearing capacity from actual bearing capacity
is about ±11.7%. It indicates that bearing capacity of
expansive soil of study area can be reliably predicted
from the field DCP readings.
The result of this study is compared with the work of
Ampadu (2005) for the relationship between qall and
DCP n-value (Figure 14). The DCP device and the type
of soil (i.e. high plastic fine grained soil) used by
Ampadu (2005) are similar with the present work. It
must however be noted that, the test conditions are
different. In the present case the DCP test was
conducted in field at natural moisture content and
density, whereas Ampadu (2005) conducted the test in-
mould on re-moulded and re-compacted soil at optimum
moisture content. Hence, the range of n-values and
computed bearing capacity are relatively lower in the
present study. It can however be noted that, irrespective
of testing conditions, the correlation equation for both
works have comparable gradients i.e., as the n-value
increases, the bearing capacity of the soil increases
nearly at similar rate.
Figure 14. Comparison of the developed empirical
correlation between DCP reading and bearing
capacity with the work of Ampadu (2005).
This studyqall = 167.31 n - 49.8
Ampadu (2006)qall = 164.03 n - 471.8
0
500
1000
1500
2000
2500
3000
3500
0 5 10 15 20
qal
l(K
Pa)
n (blow/100 mm)
Kemal Abdela & Chemeda Y.C. Ethiop.J.Sci.Sustain.Dev., Vol. 6 (1), 2019
66
Table 3. Comparison of calculated and predicted allowable bearing capacity
4. Conclusion
There is better correlation between bearing capacity
and in situ DCP reading than between bearing capacity
and index properties. The width of footing has no effect
on the empirical correlation equation between DCP
reading and bearing capacity. Based on the results of
this research study, it can be conclude that bearing
capacity of shallow foundation can be predicted reliably
from field DCP reading. Therefore, it can be considered
as cost effective alternative for preliminary site
investigation of simple structures. However, for soils
outside of the study area and/or on different soil types,
users are advised not to fully rely on the developed
equation or it should be used with extreme caution.
Additional works need to be done by increasing
sample number and for different footing shape so as to
validate the established correlation over the wide range.
Acknowledgment
The author wish to thank Adama Science and
Technology University, postgraduate program, and Bule
Hora University for providing financial support to Mr.
Kemal.
Reference
Amini, F. (2003). Potential application of dynamic and static cone penetrometers in Mississippi department of transportation
pavement design and construction. Final report, Mississippi department of transportation, USA.
Ampadu, S.I.K. (2005). A correlation between the Dynamic Cone Penetrometer and bearing capacity of a local soil formation.
Proceedings of the 16th International Conference on Soil Mechanics and Geotechnical Engineering, 655-659.
Sample no.
Actual qall (kN/m2) from
Terzaghi equation Predicted qall (kN/m2) Variation %
A a (A-a)*100/A
1 267.5 252.3 5.7
2 267.0 72.5 72.8
3 696.9 743.0 -6.6
4 533.2 507.8 4.8
5 644.0 553.6 14.0
6 421.6 417.7 0.9
7 269.2 287.1 -6.7
8 345.0 374.7 -8.6
9 387.9 401.6 -3.5
10 333.6 367.8 -10.3
11 568.3 506.5 10.9
12 468.2 495.2 -5.8
13 449.3 479.5 -6.7
14 429.2 464.1 -8.1
15 403.8 360.5 10.7
Average + 11.7
Kemal Abdela & Chemeda Y.C. Ethiop.J.Sci.Sustain.Dev., Vol. 6 (1), 2019
67
Ampadu, S.I.K. and Dzitse-Awuku, D. (2009). Model tests for bearing capacity in a lateritic soil and implications for the use of
the dynamic cone penetrometer. Proceedings of the 17th International Conference on Soil Mechanics and Geotechnical
Engineering.
Bell, F.G. (1996). Lime stabilisation of clay minerals and soils. Eng. Geol. 42, 223–237.
Bowles, J. E. (1993). Foundation Analysis and Design, 4th Edition, McGraw-Hill, Inc., New York
Braja, M.D. (1985). Principles of Foundation Engineering, PWS Publisher Boston
Cearns, P.J. and McKenzie, A. (1988). Application of Dynamic Cone Penetrometer in East Anglia, Proc. of the Symposium on
Penetration Testing in the UK, Thomas Telford, London.
Dzitse-Awuku, D. (2008). Correlation between dynamic cone penetrometer and allowable bearing pressure of shallow foundation
using model footing: Thesis submitted to department of civil engineering, Kwame Nkrumah University of science and
technology.
Kleyn, E.G. (1975). The Use of the Dynamic Cone Penetrometer (DCP), Report No. 2/74 Transvaal Road Dept, South Africa.
Livney, M. (1987): Validation of Correlations between a Number of Penetration Tests and In Situ California Bearing Ratio
Tests, Transportation Research Record 1219, Transportation Research Board, Washington D.C.
Murthy, V. (2007). Geotechnical Engineering, Principles and Practice of Soil Mechanics and Foundation Engineering. New
York: Marcel Dekker, INC.
Sanglerat, G., 1972, The Penetrometer and Soil Exploration-Interpretation of Penetrometer Diagrams-Theory and Practice,
Elsevier Scientific Publishing Company
Scala, A.J. (1956). Simple Methods of flexible pavement design using cone penetrometers, New Zealand Engineer, 11 (2), 33-
44.
Van Vuuren, D.J. (1969). Rapid Determination of CBR with the Portable Dynamic Cone Penetrometer, The Rhodesian Engineer,
Paper No. 105.

![[Astu] La galerie Gradiva par Renée Mabin - Mélusinemelusine-surrealisme.fr/site/SurrealismeAuJourLeJour/Sjj_2013/... · La rubrique Astu a publié dernièrement l'article de Renée](https://img.dokumen.tips/doc/110x75/5c5f019109d3f28e758cfab5/astu-la-galerie-gradiva-par-renee-mabin-melusinemelusine-la-rubrique.jpg)