Embed Size (px)
Citation preview

A&A 555, A112 (2013)DOI: 10.1051/0004-6361/201321318c© ESO 2013
Astronomy&
Astrophysics
Global collapse of molecular clouds as a formation mechanismfor the most massive stars
N. Peretto1,2, G. A. Fuller3,4, A. Duarte-Cabral5,6, A. Avison3,4, P. Hennebelle1, J. E. Pineda3,4,7, Ph. André1,S. Bontemps5,6, F. Motte1, N. Schneider5,6, and S. Molinari8
1 Laboratoire AIM, CEA/DSM-CNRS-Universté Paris Diderot, IRFU/Service d’Astrophysique, C.E. Saclay, France2 School of Physics and Astronomy, Cardiff University, Queens Buildings, The Parade, Cardiff CF24 3AA, UK
e-mail: [email protected] Jodrell Bank Centre for Astrophysics, School of Physics and Astronomy, University of Manchester, Manchester, M13 9PL, UK4 UK ALMA Regional Centre node5 Université de Bordeaux, LAB, UMR 5804, 33270 Floirac, France6 CNRS, LAB, UMR 5804, 33270 Floirac, France7 European Southern Observatory (ESO), 85748 Garching, Germany8 IFSI, INAF, Area di Recerca di Tor Vergata, via Fosso Cavaliere 100, 00133 Roma, Italy
Received 19 February 2013 / Accepted 2 June 2013
ABSTRACT
The relative importance of primordial molecular cloud fragmentation versus large-scale accretion still remains to be assessed in thecontext of massive core/star formation. Studying the kinematics of the dense gas surrounding massive-star progenitors can tell usthe extent to which large-scale flow of material impacts the growth in mass of star-forming cores. Here we present a comprehensivedataset of the 5500(±800) M� infrared dark cloud SDC335.579-0.272 (hereafter SDC335), which exhibits a network of cold, dense,parsec-long filaments. Atacama Large Millimeter Array (ALMA) Cycle 0 observations reveal two massive star-forming cores, MM1and MM2, sitting at the centre of SDC335 where the filaments intersect. With a gas mass of 545(+770
−385) M� contained within a sourcediameter of 0.05 pc, MM1 is one of the most massive, compact protostellar cores ever observed in the Galaxy. As a whole, SDC335could potentially form an OB cluster similar to the Trapezium cluster in Orion. ALMA and Mopra single-dish observations of theSDC335 dense gas furthermore reveal that the kinematics of this hub-filament system are consistent with a global collapse of the cloud.These molecular-line data point towards an infall velocity Vinf = 0.7(±0.2) km s−1, and a total mass infall rate Minf ' 2.5(±1.0) ×10−3 M� yr−1 towards the central pc-size region of SDC335. This infall rate brings 750(±300) M� of gas to the centre of the cloudper free-fall time (tff = 3 × 10⁵ yr). This is enough to double the mass already present in the central pc-size region in 3.5+2.2
−1.0 × tff .These values suggest that the global collapse of SDC335 over the past million year resulted in the formation of an early O-type starprogenitor at the centre of the cloud’s gravitational potential well.
Key words. stars: formation – ISM: kinematics and dynamics – ISM: clouds – stars: massive – ISM: structure
1. Introduction
The formation of massive stars remains, in many ways, a mys-tery (Beuther et al. 2007; Zinnecker & Yorke 2007). Morespecifically, the key question of which physical processes de-termine their mass accretion history is yet to be answered. Onone hand, some theories predict that primordial fragmentation ofglobally stable molecular clouds may form compact reservoirsof gas, called cores (with sizes up to 0.1 pc), from which a form-ing star subsequently accumulates its mass (McKee & Tan 2003;Beuther & Schilke 2004). In an alternative scenario, molecularclouds undergo global collapse (Peretto et al. 2006, 2007), gath-ering matter from large scales to the centre of their gravitationalpotential well, where cores, and protostars in them, are simulta-neously growing in mass (Bonnell et al. 2004; Smith et al. 2009).Even though only statistical studies of large samples of massivestar-forming clouds can definitely tell us which of these scenar-ios, if any, is most relevant, detailed observations of individualmassive star-forming clouds can still provide important hints.
The cloud under investigation is the Spitzer dark cloudSDC335.579-0.292 (hereafter SDC335; Peretto & Fuller 2009),a massive infrared dark cloud (IRDC) located at a distance
of 3.25 kpc from the Sun (distance obtained using the Reid et al.2009 model). The low level of radiative feedback from protostarsin IRDCs ensures that the initial conditions for star formationare still imprinted in the gas properties (Rathborne et al. 2006;Peretto & Fuller 2010). Massive IRDCs, such as SDC335, aretherefore ideal places to study the earliest stages of high-massstar formation (e.g. Kauffmann & Pillai 2010). SDC335 exhibitsa remarkable network of filaments seen in extinction at 8 µm(Fig. 1), reminiscent of hub-filament systems (Myers 2009) ob-served in a number of low-mass (André et al. 2010; Perettoet al. 2012) and high-mass (Schneider et al. 2012; Hennemannet al. 2012) star-forming regions. The SDC335 filaments inter-sect at the centre of the cloud where two infrared protostars(Lbol > 2 × 10⁴ L�; Garay et al. 2002) excite extended 4.5 µmemission, a tracer of powerful outflow activity (Cyganowskiet al. 2008). Consistently, class II methanol masers, unique trac-ers of massive star formation (Xu et al. 2008), have also beenreported towards these sources (Caswell et al. 2011). However,despite these signposts of massive star formation, no 6 cm free-free emission has been detected towards SDC335 down to a limitof 0.2 mJy (Garay et al. 2002). This shows that little gas hasbeen ionized in the centre of SDC335 and suggests that we are
Article published by EDP Sciences A112, page 1 of 10

A&A 555, A112 (2013)
a
1 pc
F1
F2
F3
F4 F5
F6
1 pc
b
1 pc MM2
MM1
c
0.2 pc MM2
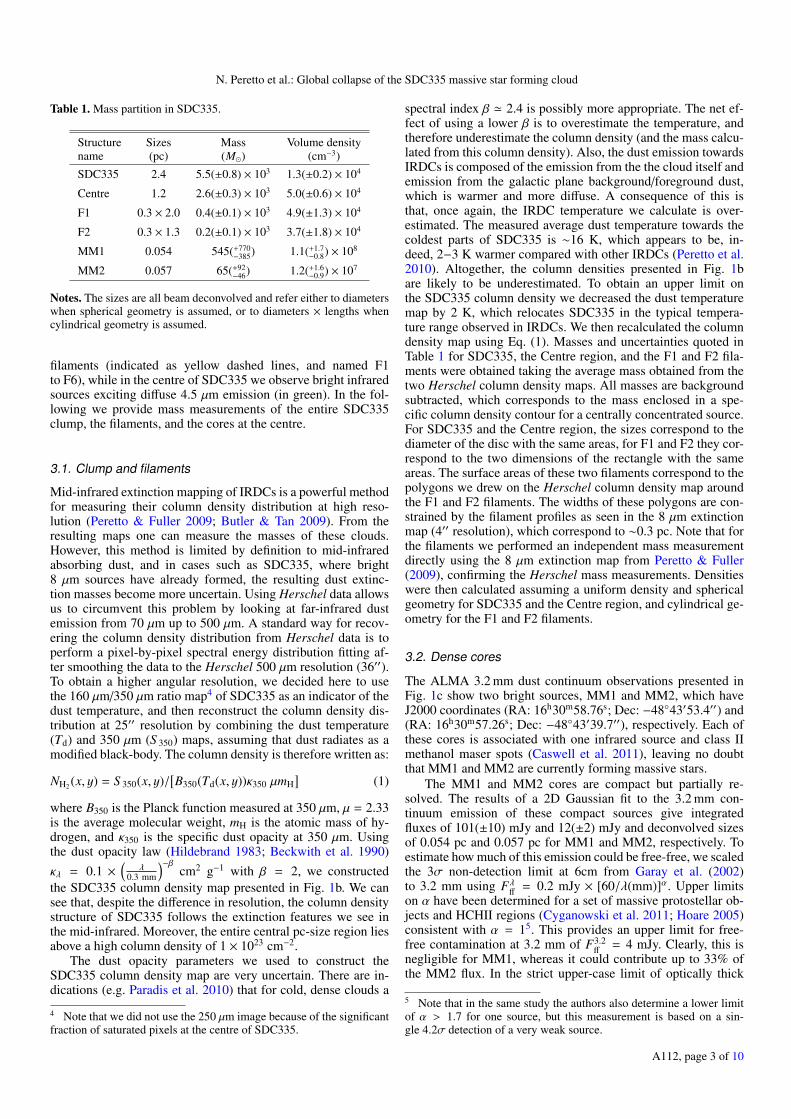
Fig. 1. a) Mid-infrared Spitzer composite image (red: 8 µm; green: 4.5 µm; blue: 3.6 µm) of SDC335. The 6 filaments identified by eye areindicated with yellow dashed lines, emphasizing their converging pattern. The diffuse 4.5 µm emission associated with the two IR sources in thecentre is usually interpreted as a signature of powerful outflow activity. The positions of the two cores are marked with black crosses. b) Herschelcolumn density image of SDC335. The locations of the filaments and cores are marked similarly as in the a) panel. The final angular resolutionof this image is 25′′ (yellow circle), that of Herschel at 350 µm (see text). The contours range from 3.5 × 10²² to 9.5 × 1022 cm−2 in steps of2 × 1022 cm−2, and from 2.15 × 10²³ to 4.15 × 1023 cm−2 in steps of 1 × 1023 cm−2. The two yellow contours define the regions in which wecalculated the SDC335 and Centre region masses quoted in Table 1. c) ALMA 3.2 mm dust continuum emission of the central region of SDC335where two cores are identified, MM1 and MM2. The rms noise is 0.4 mJy/beam. The contours range from 2 to 22 in steps of 5 mJy/beam, andfrom 22 to 62 in steps of 10 mJy/beam. The yellow ellipse represents the ALMA beam size.
witnessing the early stages of the formation of, at least, two mas-sive stars.
The goal of this paper is to map the dense gas kinematics ofSDC335 and analyse it in the context of massive star formationscenarios. In Sect. 2 we describe the observations. In Sect. 3we discuss the mass partition in SDC335, and Sect. 4 presentsobservations of the SDC335 dense gas kinematics. Finally, wediscus our results and their implications in Sect. 5, the summaryand conclusions are presented in Sect. 6.
2. Observations
2.1. Spitzer and Herschel observations
We used publicly available1 Spitzer GLIMPSE data (Churchwellet al. 2009). The angular resolution of the 8 µm data is ∼2′′.We also used the PACS (Poglitsch et al. 2010) 160 µm andSPIRE (Griffin et al. 2010) 350 µm Herschel (Pilbratt et al. 2010)data from the Hi-GAL survey (Molinari et al. 2010). These datawere reduced as described in Traficante et al. (2011), using theROMAGAL map making algorithm. The nominal angular reso-lution at these two wavelengths are 12′′ and 25′′.
2.2. Mopra observations
In May 2010 we observed SDC335 with the ATNF Mopra22 m single-dish telescope. We observed transitions includingHCO+(1−0), H13CO+(1−0) and N2H+(1−0) in a 5′×5′ field cen-tred on SDC335. We performed on-the-fly observations, switch-ing to an off-position free of dense gas emission. Pointing waschecked every hour and was found to be better than 10′′. We usedthe zoom mode of the MOPS spectrometer providing a velocityresolution of 0.1 km s−1. The angular resolution of these 3 mm
1 http://irsa.ipac.caltech.edu/data/SPITZER/GLIMPSE
Mopra observation is ∼37′′ and the rms noise is 0.1 K on the T ∗Ascale (∼0.2 K on the Tmb scale because the beam efficiency fac-tor is ∼2 at 93 GHz on Mopra − Ladd et al. 2005).
2.3. ALMA observations
In September and November 2011 we observed SDC335at 3 mm wavelength with the 16 antennas of ALMA (Cycle 0) inits compact configuration. We performed an 11-pointing mosaiccovering the entire area seen in extinction with Spitzer (Fig. 1a).We simultaneously observed the 3.2 mm dust continuum, alongwith the CH3OH(13−12) and N2H+(1−0) transitions at a spec-tral resolution of ∼0.1 km s−1. Flux and phase calibration wereperformed on Neptune and B1600-445, respectively. The datawere reduced using CASA2 (McMullin et al. 2007). The synthe-sized beam is 5.6′′×4.0′′ with a position angle of +97◦. The rmsnoise in the continuum is 0.4 mJy/beam, while for the line wereach an rms sensitivity of 14 mJy/beam (∼0.08 K).
As with any interferometer, ALMA filters out large-scaleemission. To recover this emission, we used the Mopra single-dish data to provide the short-spacing information, for whichwe used the GILDAS3 software. This combination significantlyimproved the image quality, in particular in the central re-gion of SDC335. The rms noise on these combined datacubesis 0.14 Jy/beam (∼0.8 K), significantly higher than the ALMA-only dataset. This reflects the higher noise of the Mopra datasetper ALMA beam.
3. Mass partition in SDC335
The mid-infrared composite image of SDC335 is displayedin Fig. 1a. In extinction we easily identify a network of six
2 http://casa.nrao.edu3 http://www.iram.fr/IRAMFR/GILDAS
A112, page 2 of 10
N. Peretto et al.: Global collapse of the SDC335 massive star forming cloud
Table 1. Mass partition in SDC335.
Structure Sizes Mass Volume densityname (pc) (M�) (cm−3)
SDC335 2.4 5.5(±0.8) × 103 1.3(±0.2) × 104
Centre 1.2 2.6(±0.3) × 103 5.0(±0.6) × 104
F1 0.3 × 2.0 0.4(±0.1) × 103 4.9(±1.3) × 104
F2 0.3 × 1.3 0.2(±0.1) × 103 3.7(±1.8) × 104
MM1 0.054 545(+770−385) 1.1(+1.7
−0.8) × 108
MM2 0.057 65(+92−46) 1.2(+1.6
−0.9) × 107
Notes. The sizes are all beam deconvolved and refer either to diameterswhen spherical geometry is assumed, or to diameters × lengths whencylindrical geometry is assumed.
filaments (indicated as yellow dashed lines, and named F1to F6), while in the centre of SDC335 we observe bright infraredsources exciting diffuse 4.5 µm emission (in green). In the fol-lowing we provide mass measurements of the entire SDC335clump, the filaments, and the cores at the centre.
3.1. Clump and filaments
Mid-infrared extinction mapping of IRDCs is a powerful methodfor measuring their column density distribution at high reso-lution (Peretto & Fuller 2009; Butler & Tan 2009). From theresulting maps one can measure the masses of these clouds.However, this method is limited by definition to mid-infraredabsorbing dust, and in cases such as SDC335, where bright8 µm sources have already formed, the resulting dust extinc-tion masses become more uncertain. Using Herschel data allowsus to circumvent this problem by looking at far-infrared dustemission from 70 µm up to 500 µm. A standard way for recov-ering the column density distribution from Herschel data is toperform a pixel-by-pixel spectral energy distribution fitting af-ter smoothing the data to the Herschel 500 µm resolution (36′′).To obtain a higher angular resolution, we decided here to usethe 160 µm/350 µm ratio map4 of SDC335 as an indicator of thedust temperature, and then reconstruct the column density dis-tribution at 25′′ resolution by combining the dust temperature(Td) and 350 µm (S 350) maps, assuming that dust radiates as amodified black-body. The column density is therefore written as:
NH2 (x, y) = S 350(x, y)/[B350(Td(x, y))κ350 µmH
](1)
where B350 is the Planck function measured at 350 µm, µ = 2.33is the average molecular weight, mH is the atomic mass of hy-drogen, and κ350 is the specific dust opacity at 350 µm. Usingthe dust opacity law (Hildebrand 1983; Beckwith et al. 1990)κλ = 0.1 ×
(λ
0.3 mm
)−βcm2 g−1 with β = 2, we constructed
the SDC335 column density map presented in Fig. 1b. We cansee that, despite the difference in resolution, the column densitystructure of SDC335 follows the extinction features we see inthe mid-infrared. Moreover, the entire central pc-size region liesabove a high column density of 1 × 1023 cm−2.
The dust opacity parameters we used to construct theSDC335 column density map are very uncertain. There are in-dications (e.g. Paradis et al. 2010) that for cold, dense clouds a
4 Note that we did not use the 250 µm image because of the significantfraction of saturated pixels at the centre of SDC335.
spectral index β ' 2.4 is possibly more appropriate. The net ef-fect of using a lower β is to overestimate the temperature, andtherefore underestimate the column density (and the mass calcu-lated from this column density). Also, the dust emission towardsIRDCs is composed of the emission from the the cloud itself andemission from the galactic plane background/foreground dust,which is warmer and more diffuse. A consequence of this isthat, once again, the IRDC temperature we calculate is over-estimated. The measured average dust temperature towards thecoldest parts of SDC335 is ∼16 K, which appears to be, in-deed, 2−3 K warmer compared with other IRDCs (Peretto et al.2010). Altogether, the column densities presented in Fig. 1bare likely to be underestimated. To obtain an upper limit onthe SDC335 column density we decreased the dust temperaturemap by 2 K, which relocates SDC335 in the typical tempera-ture range observed in IRDCs. We then recalculated the columndensity map using Eq. (1). Masses and uncertainties quoted inTable 1 for SDC335, the Centre region, and the F1 and F2 fila-ments were obtained taking the average mass obtained from thetwo Herschel column density maps. All masses are backgroundsubtracted, which corresponds to the mass enclosed in a spe-cific column density contour for a centrally concentrated source.For SDC335 and the Centre region, the sizes correspond to thediameter of the disc with the same areas, for F1 and F2 they cor-respond to the two dimensions of the rectangle with the sameareas. The surface areas of these two filaments correspond to thepolygons we drew on the Herschel column density map aroundthe F1 and F2 filaments. The widths of these polygons are con-strained by the filament profiles as seen in the 8 µm extinctionmap (4′′ resolution), which correspond to ∼0.3 pc. Note that forthe filaments we performed an independent mass measurementdirectly using the 8 µm extinction map from Peretto & Fuller(2009), confirming the Herschel mass measurements. Densitieswere then calculated assuming a uniform density and sphericalgeometry for SDC335 and the Centre region, and cylindrical ge-ometry for the F1 and F2 filaments.
3.2. Dense cores
The ALMA 3.2 mm dust continuum observations presented inFig. 1c show two bright sources, MM1 and MM2, which haveJ2000 coordinates (RA: 16h30m58.76s; Dec: −48◦43′53.4′′) and(RA: 16h30m57.26s; Dec: −48◦43′39.7′′), respectively. Each ofthese cores is associated with one infrared source and class IImethanol maser spots (Caswell et al. 2011), leaving no doubtthat MM1 and MM2 are currently forming massive stars.
The MM1 and MM2 cores are compact but partially re-solved. The results of a 2D Gaussian fit to the 3.2 mm con-tinuum emission of these compact sources give integratedfluxes of 101(±10) mJy and 12(±2) mJy and deconvolved sizesof 0.054 pc and 0.057 pc for MM1 and MM2, respectively. Toestimate how much of this emission could be free-free, we scaledthe 3σ non-detection limit at 6cm from Garay et al. (2002)to 3.2 mm using Fλ
ff= 0.2 mJy × [60/λ(mm)]α. Upper limits
on α have been determined for a set of massive protostellar ob-jects and HCHII regions (Cyganowski et al. 2011; Hoare 2005)consistent with α = 15. This provides an upper limit for free-free contamination at 3.2 mm of F3.2
ff= 4 mJy. Clearly, this is
negligible for MM1, whereas it could contribute up to 33% ofthe MM2 flux. In the strict upper-case limit of optically thick
5 Note that in the same study the authors also determine a lower limitof α > 1.7 for one source, but this measurement is based on a sin-gle 4.2σ detection of a very weak source.
A112, page 3 of 10

A&A 555, A112 (2013)
MM1
MM2
Fig. 2. ALMA CH3OH(13−12) integrated-intensity image of SDC335in colour scale; overplotted are the contours of the 3.2 mm dust contin-uum emission as displayed in Fig. 1c. We can see that the two typesof emission coincide spatially. The insert in the top left corner showsthe methanol spectra observed at the central position of each core. Thecyan solid lines are the best Gaussian fit to the data. The yellow ellipserepresents the ALMA beam size.
free-free emission at both 6 cm and 3.2 mm α equals 2, in-creasing the upper limit for free-free contamination to 70% ofthe MM1 ALMA 3.2 mm flux. However, the recent detectionof MM1 at 7 mm with ATCA (Avison et al., in prep.) shows noexcess emission over that expected from the dust. Still, conserva-tively assuming that the entire 7 mm emission is from opticallythick free-free emission implies an upper limit on the free-freecontamination of 30% of the observed 3.2 mm flux. Such a levelof contamination would not change any of the results presentedhere, therefore we neglect any potential free-free contaminationin the remainder of the paper. The gas mass and the 3.2 mm fluxof the MM cores are related through
Mgas =d2F3.2
κ3.2B3.2(Td), (2)
where d is the distance to the source, F3.2 is the 3.2 mm flux, κ3.2is the specific dust opacity (accounting for the dust-to-gas-massratio) and B3.2(Td) is the Planck function measured at 3.2 mmwith a dust temperature Td. The main sources of uncertaintieson this mass estimate come from the dust properties, tempera-ture, and opacity. The dust temperatures of these two sources aredifficult to determine based on these ALMA observations alone.However, both sources have strong mid/far-IR emission seenwith Spitzer (Churchwell et al. 2009) and Herschel (Molinariet al. 2010), class II methanol maser emission (Caswell et al.2011), and are detected in high-excitation thermal lines ofmethanol (Sect. 4). These are indicative of dust in the centre ofthe cores with temperatures >100 K, but it is also clear that onlarger scales the dust within the dark SDC335 filaments is cold,with temperatures ∼15 K as measured in many other IRDCs(Peretto et al. 2010; Wilcock et al. 2012). For the vast major-ity of massive protostellar cores in the literature (cf. caption ofFig. 6), the assumed or measured dust/gas temperature (via SEDor K-ladder fitting of some specific lines) varies between 15 Kand 100 K. Here, we adopted an intermediate dust temperatureof 50 K for both MM cores, and considered that a factor of 2 un-certainty on this dust temperature is conservative. In the future,
Fig. 3. Spitzer 8 µm image of SDC335 (colour scale) over-plotted withthe Mopra HCO+(1−0) spectra. The temperature scale and velocityare indicated in the bottom-left corner. The HCO+(1−0) line is self-absorbed and blue-shifted in the bulk of the cloud. This is usually inter-preted as a signature of collapse.
radiative transfer modelling of these sources will be necessary tobetter constrain their temperature profiles.
We took the same dust opacity law as used for the Herscheldata, providing κ3.2 = 8.7 × 10⁻⁴ cm2 g−1 (assuming a dust-to-gas-mass ratio of 1%). However, this value is sensitive to the dustmodel used. It is unclear which model is the most appropriate forprotostellar cores, but as shown in Fig. 6, most values adoptedin the literature for core-mass measurements agree within a fac-tor of 2. With these assumptions we estimated the gas massesand their associated uncertainties as MMM1 = 545+770
−385 M� andMMM2 = 65+92
−46 M�.
4. Dense-gas kinematics in SDC335
In this section we discuss the dense-gas kinematics of the cores,filaments, and clump as observed with the Mopra and ALMAtelescopes.
4.1. ALMA CH3OH(13−12) core velocities
To determine the systemic velocity of the MM cores, wemapped the thermal methanol CH3OH(13−12) transition at105.063761 GHz. Because of the high energy levels of this tran-sition (Eu = 223.8 K), CH3OH(13−12) is preferentially ob-served in dense and warm regions. Figure 2 shows the ALMAintegrated-intensity image towards the cores. We see the ex-cellent agreement between the position of the peak of the dustcontinuum cores and the methanol emission, indicating thatmethanol is a good tracer of their systemic velocities. We alsonote that the methanol emission is more compact (unresolved,i.e. <0.01 pc) than the dust continuum emission, which indi-cates that it arises from the warm, innermost regions of thecores. Gaussian fits to the methanol spectra observed at the cen-tral position of the two cores (insert of Fig. 2) provide the sys-temic velocities of the cores (VMM1 = −46.6 km s−1, VMM2 =−46.5 km s−1) and the gas velocity dispersion in the densest partsof MM1 and MM2 (∆VMM1 = 4.6 km s−1, ∆VMM2 = 4.8 km s−1).
A112, page 4 of 10

N. Peretto et al.: Global collapse of the SDC335 massive star forming cloud
a
1 pc
F1
F2
F3
F4 F5
F6
b
1 pc 1 pc
c
Fig. 4. a) Same as in Fig. 1a; b) ALMA-only image of the N2H+(1−0) integrated intensity over the 7 hyperfine structure components. The rmsnoise on the resulting map is ∼6 mJy/beam km s−1. The contours go from 0.1 to 1.5 in steps of 0.7 Jy/beam km s−1 and 1.5 to 9 in steps of 1.5Jy/beam km s−1. The crosses mark the positions of the two dense cores. The ALMA beam is represented as a yellow elliptical symbol in the bottom-right corner of the image. We can see the excellent match between the Spitzer dust extinction of the filaments and the N2H+(1−0) emission; c)ALMA N2H+(1−0) velocity field using the first order moment map. The crosses mark the positions of the cores and the contours are the same asin the b) panel.
4.2. Mopra HCO+(1−0) self-absorbed lines
HCO+ is a well-known tracer of dense gas in molecular clouds.In these regions, HCO+(1−0) can be optically thick, in whichcase the line shape can provide information of the global motionsof the gas along the line of sight (e.g. Fuller et al. 2005; Smithet al. 2012). The HCO+(1−0) observations towards SDC335(Fig. 3) show blue-shifted self-absorbed spectra in the bulk ofthe cloud. Such line profiles are expected for an optically thicktracer of idealized collapsing clouds in which the excitation tem-perature is rising towards the centre. What is important to notehere is the extent (over at least 12 independent Mopra beams)over which this spectral signature is observed, and the absenceof any other line asymmetry. For expanding motions we wouldexpect red-shifted self-absorbed spectra, while in the case of ro-tation blue-shifted and red-shifted spectra on either side of therotation axis should be produced. Therefore these HCO+(1−0)observations towards SDC335 already rule out the possibility ofa rotating or expanding cloud, and strongly suggest that SDC335is collapsing.
SDC335 is well enough characterised that we can estimatethe HCO+ abundance using the 1D non-LTE RADEX radia-tive transfer code (van der Tak et al. 2007). This code predictsline intensities based on a set of input parameters for whichwe have strong constraints: the kinetic temperature (20 ± 5 K,estimated from Herschel data), the cosmic background tem-perature (2.73 K), the central H2 density averaged over theMopra beam (6 ± 1 × 104 cm−3, estimated from the columndensity map presented in Fig. 1), and the velocity dispersion(1.3 ± 0.3 km s−1; cf. Sect. 5.4). Then we iterate on the last in-put parameter, i.e. the molecule column density, to match themodel line intensities with the observed line temperature, i.e.T peak
HCO+ = 6.4(±0.2) K on the Tmb scale. Doing so, we obtainNHCO+ = 6+7
−3 × 1013 cm−2, corresponding to an abundanceXHCO+ = 7+8
−4 × 10⁻¹⁰. The corresponding excitation tempera-ture is Tex = 10.4+1.2
−0.7 K, confirming that HCO+(1−0) is not ther-malised. Using the same set of parameters, we performed the
same exercise for the central H13CO+(1−0) line (se Fig. B.1),which has T peak
H13CO+ = 1.2(±0.2) K on the Tmb scale. For thisline we obtain NH13CO+ = 4+3
−2 × 1012 cm−2, correspondingto an abundance XH13CO+ = 5+3
−3 × 10⁻¹¹. The correspondingexcitation temperature is Tex = 6.5+2.7
−1.2 K. Therefore, as forHCO+(1−0), H13CO+(1−0) is not thermalised. Note that thelower excitation temperature of H13CO+(1−0) is most likely dueto a lower beam-filling factor. Another important point is thatgiven the abundances we calculated for both molecules, we ob-tain an abundance ratio 15 ≤ [HCO+]/[H13CO+] ≤ 20. The[12C]/[13C] ratio is known to increase as a function of the galac-tocentric radius, and at the galactocentric distance of SDC335(i.e. ∼5 kpc) the predicted [12C]/[13C] is around 30 (Langer &Penzias 1993; Savage et al. 2002). The value we find is abouthalf this value, which, considering the uncertainties on thesekinds of measurements, is in reasonable agreement. We use thelatter value of the fractional abundance for the radiative mod-elling presented in Sect. 5.3.
4.3. ALMA N2H+(1−0) cloud velocity field
Figure 4b shows the ALMA N2H+(1−0) integrated-intensitymap of SDC335. The visual comparison with the Spitzer imageof SDC335 demonstrates how efficient this molecule is in trac-ing the network of pc-long filaments seen in dust extinction. Thisjustifies our choice of using this line to trace the filaments kine-matics. On the other hand, we can also see that N2H+ is a poortracer of the cores, where the central heating may have partlyremoved it from the gas phase (Zinchenko et al. 2009; Busquetet al. 2011).
Figures 4c and 5 show that SDC335 velocity field is ho-mogeneous in each filament, with distinct velocities from fila-ment to filament (e.g. 〈VF1〉 = −47.4 ± 0.1 km s−1; 〈VF3〉 =−45.8 ± 0.2 km s−1). It becomes more complex towards thecentre of the cloud. In Fig. 5 we see that two separate ve-locity components are present close to MM2, while the broad
A112, page 5 of 10

A&A 555, A112 (2013)
Fig. 5. (Left) Examples of combined ALMA and Mopra N2H+(1−0)spectra observed at some specific positions in SDC335 (upper panelfor filaments − lower panel for cores), along with their best fits as redsolid lines. The N2H+(1−0) spectra exhibit a hyperfine structure (HFS)composed of 7 components (the positions are displayed as blue ver-tical ticks for the F2 filament). Some of these components are closeenough to be blended when the velocity dispersion of the gas is su-personic, resulting in three groups of lines. For a kinetic temperatureof 10 K, the velocity dispersion along the filaments is supersonic bya factor 1.5 to 3, similar to what is observed in other IRDCs (Raganet al. 2012). (Right) Schematic representation of the systemic velocityand velocity dispersion of the different structures. The length of eachbox represents the velocity dispersion (FWHM) of the gas, and its cen-tral position the systemic velocity (represented as a filled circle). Thecolour of the boxes codes the line that has been used for the measure-ments: red for N2H+(1−0), and cyan for CH3OH(13−12). The verticaldashed lines mark the systemic velocities of the cores.
asymmetric line profiles around MM1 suggest their blending,consistent with observations of other massive cores (Csengeriet al. 2011). This line shape cannot be the result of high opti-cal depth since the N2H+(1−0) hyperfine line-fitting (performedwith GILDAS) gives an opacity lower than 1 everywhere in thecloud. Kinematically, the gas traced by N2H+(1−0) at the centreof the cloud appears to be composed of a mix of the gas origi-nating from the two main filaments, F1 and F2. Figure 5 (right)presents a schematic view of the velocities of the filaments andcores. We can actually see that the two cores lie at an interme-diate velocity between the velocities of the different filaments.This configuration suggests that the cores are at least partly fedby the pristine gas flowing along these filaments at a velocityVinf ' 1 km s−1.
5. Discussion
5.1. SDC335: an OB cluster progenitor
In Sect. 3 we inferred core masses of MMM1 = 545+770−385 M� and
MMM2 = 65+92−46 M� in deconvolved diameters 0.05−0.06 pc.
Figure 6 shows a radius-versus-mass diagram for a signifi-cant (but not complete) sample of massive protostellar cores
Fig. 6. Mass-radius diagram of massive protostellar cores. The cyan cir-cles correspond to the values as published in the literature (Peretto et al.2007; Ren et al. 2012; Rathborne et al. 2011; Wang et al. 2011; Zhang &Wang 2011; Bontemps et al. 2010; Rathborne et al. 2007, 2008; Beutheret al. 2002, 2003, 2005, 2012; Molinari et al. 1998; Rodón et al. 2012),while the empty circles correspond to the same set of sources for whichwe recalculated the mass using the same dust opacity law as in thispaper. The MM1 and MM2 sources are indicated as red filled circles.The green filled square marks the position of the W51 North star+discsystem from Zapata et al. (2009). The shaded area indicates the regionwhere most sources lie. The cross in the bottom right corner indicates afactor of 2 uncertainty in both the masses and sizes, typical of the resultspresented here.
published in the literature. In this diagram we can see thatSDC335 MM1 stands out, and for cores with similar sizes MM1is a factor of between 3 and 20 more massive. However, giventhe uncertainties on the dust properties and density profile ofcores, MM1 could match the mass of the most massive cores ob-served, on smaller scales, in Cygnus X (Bontemps et al. 2010).Nevertheless, MM1 clearly appears to be one of the most mas-sive, compact protostellar cores ever observed in the Galaxy.
Another interesting source that provides an informative com-parison is W51 North. This source is believed to contain an al-ready formed ≥65 M� star, with a surrounding 3000 AU ac-creting disc of 40 M� (Zapata et al. 2009). Adding this sourceto Fig. 6 using its total (star+disc) mass shows it to be an ex-treme object as well. SDC335 MM1 could represent an earlierversion of such an O-type star-forming system. For compactcores, the fraction of mass likely to be accreted onto the staris typically 50% of the total core mass (McKee & Tan 2003;Duarte-Cabral et al. 2013). Despite probable unresolved frag-mentation on smaller scales, the MM1 core and its large masshave the potential to form at least one star of 50 M� to 100 M�.
Assuming now that within SDC335 (M = 5500 ± 800 M�)a fully sampled standard initial mass function forms (Kroupa2002; Chabrier 2003), then, in addition to the early O-type starin MM1, a thousand solar mass cluster of ∼320 stars with massesfrom 1 to 50 M� should emerge from SDC335. Including lowermass stars in this calculation, we would reach a star formationefficiency ≥50%, the necessary condition to form a bound opencluster (e.g. Lada & Lada 2003). As a whole, SDC335 couldpotentially form an OB cluster similar to the Trapezium clusterin Orion (Zinnecker & Yorke 2007).
A112, page 6 of 10

N. Peretto et al.: Global collapse of the SDC335 massive star forming cloud
5.2. A large mass reservoir for MM1
We can estimate the conditions under which MM1 formed withinthe context of gravo-turbulent fragmentation models. Using thestandard (lognormal) volume-density probability density func-tion (PDF) of non-self-gravitating turbulent clouds (e.g. Padoanet al. 1997; Hennebelle & Chabrier 2008), we calculated (seeAppendix A) that less than 0.01% of the gas is expected tobe above a density of 107 cm−3, while >10% of the SDC335mass is above this threshold in the form of cores (see Table 1).Therefore, gravity must have brought together such a large massin such a small volume. A first possibility is that the materialcurrently lying in MM1 was initially part of a larger volume thatthen collapsed. To calculate the diameter Dini of this volume wefirst need to calculate the density ρini above which 10% of the gasis lying, assuming a lognormal density PDF. Using the observedparameters of SDC335 (see Appendix A), we found that Dini ofthis initial volume must have been ∼15 times larger than the cur-rent MM1 size, which means Dini ∼ 0.8 pc. This size is in fact alower limit since the calculation implicitly assumes that the en-tire dense gas above ρini lies within a single dense region. Thesecond possibility is that MM1 initially had the same diameteras observed today. It is then possible to calculate the maximummass that this volume can contain to match the lognormal PDF.We can show (see Appendix A) that the maximum initial mass ofsuch a core is ∼3 M�. This low mass means that most of the cur-rent MM1 mass must have been accreted from its surroundings.Using the current average density of SDC335, we calculated thatthe region from which MM1 accreted matter would had to have adiameter of 1.2 pc. Either of these scenarios, therefore, requireslarge-scale, rather than local, accretion/collapse to form MM1.
5.3. Collapse on large scales
The Mopra HCO+(1−0) spectra presented in Fig. 3 are sugges-tive of global gravitational collapse. A simple analytical model(Myers et al. 1996) allows one to infer an infall velocity fromthese spectra. Using this model, we obtained an infall veloc-ity of ∼0.4 km s−1. However, as noted by De Vries & Myers(2005), this model underestimates the infall velocity by a factorof ∼2. We therefore decided to run a more sophisticated radia-tive transfer model to better constrain this infall velocity. Forthis purpose we used the RATRAN 1D Monte Carlo radiativetransfer code (Hogerheijde & van der Tak 2000). The input pa-rameters for the calculations are the mass of the cloud, its ra-dius, density profile, kinetic temperature profile, turbulent ve-locity dispersion, the infall velocity profile, and the abundanceprofile of the line to be modelled. Obviously, a 1D model can-not describe the detailed kinematics of the filamentary struc-tures observed in SDC335, and for this reason we decided tomodel only the central HCO+(1−0) and H13CO+(1−0) spectra.We used the SDC335 mass and size quoted in Table 1, a cloud-density profile ρ ∝ r−1.5, and a constant temperature profileof 20 K. Based on the discussion in Sect. 4.2, we fixed theHCO+ abundance (relative to H2) to 7 × 10⁻¹⁰ and an abun-dance ratio [HCO+]/[H13CO+] of 30. We then ran a grid ofmodels varying the last two input parameters, i.e., the infallvelocity and the velocity dispersion. Figure 7 shows the re-sults of the HCO+(1−0) modelling of the central pixel for infallvelocities ranging from 0.4 km s−1 to 0.9 km s−1, and veloc-ity dispersions from 0.8 km s−1 to 1.2 km s−1. For each spec-trum we calculated a reduced χ2 parameter representative ofthe quality of the fit. This parameter is given in the top right-hand corner of each spectrum. The corresponding H13CO+(1−0)
Fig. 7. Grid of HCO+(1−0) spectra obtained from RATRAN modellingof a collapsing cloud (see text). All input parameters are fixed with theexception of the infall velocity (Vinf) and velocity dispersion (σturb).Each modelled spectrum (in red) has been obtained for the correspond-ing Vinf−σturb displayed in the top and right-hand sides of the figure. Thenumbers in the top right-hand corner of each spectrum give a relativeidea of the fit quality. The HCO+(1−0) spectrum observed at the centreof SDC335 is plotted in black. Since we aimed to keep the observedspectra displayed in T ∗a scale, we applied a 0.5 factor to the modelledspectra to take into account the Mopra main-beam efficiency.
predictions from the model are displayed in Appendix B. FromFig. 7 we consider that 0.5 km s−1 ≤ Vinf ≤ 0.9 km s−1
and 0.9 km s−1 ≤ σturb ≤ 1.1 km s−1 provide reasonable fitsto the central HCO+(1−0) spectrum. We also performed modelsvarying the radius of the collapsing region Rinf . For Rinf < 0.5 pcthe modelled HCO+(1−0) spectra remain symmetric, which isinconsistent with the observations. Only for Rinf ≥ 0.8 pc isthe asymmetry large enough to resemble the observed one. Thisshows that the observed HCO+(1−0) self-absorbed spectra to-wards SDC335 do trace global collapse.
5.4. Energy balance
To be collapsing, the gravitational energy of a cloud has to over-come the kinetic energy that supports it. This occurs if the virialparameter αvir = 5σ2
turbR/(GM) is lower than 1 (Bertoldi &McKee 1992). In this equation σturb, R, and M are the 1D ve-locity dispersion, the cloud radius, and the cloud gas mass. Inthe case of SDC335, we estimated σturb = 1.3 km s−1 fromthe averaged N2H+(1−0) spectrum over SDC335 as observedwith Mopra. Using Mopra 13CO(1−0) data, which trace lessdense gas, we obtained σturb = 1.6 km s−1. Note also that thesevelocity-dispersion measurements include any systematic mo-tions within the beam, such as infall, which artificially increasethe velocity-dispersion estimate (Peretto et al. 2007). Taking thisinto account, and because the filaments are well traced by N2H+,we estimate σturb = 1.3(±0.3) km s−1. With R = 1.2 pc andM = 5500(±800) M� we find αvir = 0.4+0.4
−0.2 < 1. Additionalsupport against gravity could be provided by the magnetic field.Following previous studies (Pillai et al. 2011), we estimated thatthe magnetic field strength |B|vir necessary to virialize SDC335is |B|vir = 300 µG, which is at least three times higher than
A112, page 7 of 10

A&A 555, A112 (2013)
observations of clouds at similar densities suggest (Crutcher2012). Finally, note that the support provided by centrifugalforces can potentially stabilise a cloud against gravity. However,calculating the rotational energy of SDC335 by assuming thatit is a homogenous rotating sphere with an angular velocityω = 1 km s−1/pc, we estimated that it is ∼10 times smaller thanits kinetic energy as measured from the velocity dispersion. Inother words, it is negligible.
5.5. Large-scale velocity field and accretion rates
To illustrate some of the expected signatures of globally col-lapsing clouds we present, in Fig. 8 a snapshot of a publishedMHD simulation modelling the evolution of a turbulent andmagnetized 10 000 M� cloud, that was initially designed to re-produce some of the observational signatures of the DR21 re-gion (Schneider et al. 2010, see Appendix C for more detailson the simulation). Overall, this simulation shows some similar-ities with SDC335, i.e. massive cores in the centre, the formationof filaments converging towards these cores, and a velocity fieldresembling the one observed in SDC335 (see Fig. 4c). But mostimportantly, Fig. 8 shows that although a fraction of the gas isindeed collapsing along the filaments, a large portion is collaps-ing off filaments. In this case the filamentary accretion observedalong the filaments represents only the tip of the entire accretiontowards the cloud centre.
In the context of a global collapse scenario, the observedvelocity field along the filaments is the consequence of theinflowing cold gas. We can therefore estimate the current in-fall rate of gas running through the filaments using Minf =NfilπR2
filVinfρfil, where Nfil is the number of filaments, Rfil isthe filament cross-section radius, Vinf is the gas infall veloc-ity, and ρfil is the gas volume density. With six filaments, aninfall velocity of 0.7(±0.2) km s−1, a filament section radiusof 0.15 pc, and a density of 4(±1) × 104 cm−3, we derive aninfall rate of 0.7(±0.3) × 10−3 M�/yr. At this rate, a total massof 210(±90) M� would have been gathered in the centre by fil-amentary accretion within a free-fall time tff ∼ 3 × 10⁵ yr. Thisis slightly less than half of the cumulated core masses. However,less than 20% of the SDC335 mass is lying within the filaments(cf. Sect. 3). Assuming that the remaining gas is collapsing offfilaments at a similar infall velocity, as observed in the simu-lations (see Fig. 8a), the total accretion rate becomes Minf =4πR2
sphVinfρsph, where Rsph is the radius of the considered spheri-cal volume and ρsph is the density at that radius. At the radius ofthe Centre region, Rsph = 0.6 pc and ρsph = 1.3(±0.2)×104 cm−3,which leads to Minf = 2.5(±1.0) × 10−3 M�/yr. With this ac-cretion rate 750(±300) M� of pristine gas is trapped inside theCentre region every cloud free-fall time. This is enough to dou-ble the mass of material currently present in the Centre regionin 3.5+2.2
−1.0 cloud free-fall times. This is few free-fall times longerthan the typical timescale over which simulations modelling theevolution of massive star-forming clouds evolve (e.g. Smith et al.2009; Krumholz et al. 2012). However, free-fall times in simu-lations are estimated at the initial average density ρini while heretff is calculated from the SDC335 current average density ρcur.Therefore, a fair comparison with models would imply that weestimate tff from SDC335 ρini, which would then increase tffas (ρcur/ρini)1/2. Altogether, evidence indicates that a significantfraction, if not all, of the SDC335 core mass could have beenbuilt through the parsec-scale collapse of their parental cloudover a few cloud free-fall times.
b a
1 pc
Fig. 8. Snapshot of a MHD simulation of a 10 000 M� collapsing cloud(see Appendix C for more details; Schneider et al. 2010). a) Columndensity (colour and contours) smoothed to the resolution of the ALMAdata (5′′). The arrows show the plane-of-the-sky velocity field. We seethat gas flows along filaments and also off the filaments. b) Dense gasline-of-sight velocity field (colour scale) smoothed to the resolution ofthe ALMA data. We highlighted the filaments by white dashed lines.The contours are the same as in panel a).
6. Summary and conclusion
SDC335 is a massive (5500 ± 800 M�) IRDC with two mas-sive star-forming cores located in its centre, one of which islikely to be an early O-type star progenitor. This core has anestimated mass of 545+770
−385 M� in a deconvolved diameter of∼0.05 pc, which makes it one of the most massive protostel-lar cores ever observed in the Galaxy. A theoretical argumentbased on volume-density PDFs of molecular clouds suggeststhat such a concentration of mass must occur through the large-scale collapse of the surrounding cloud. This scenario was sup-ported by several observational facts presented in this paper:optically thick molecular line observations showing extendedcollapse signatures; a virial parameter distinctly lower than 1;a velocity field consistent with models of globally collapsingmolecular clouds; accretion rates that are high enough to pro-vide an additional 750(±300) M� of pristine gas to the centralpc-size region of SDC335 per cloud free-fall time. Altogether,these observations strongly suggest that the SDC335 massivestar-forming cores managed to build-up their large masses asa result of the supersonic global collapse of their surroundingcloud.
It is always adventurous to draw general conclusions basedon a single example. However, there are several sources now forwhich large-scale infall has been suggested to play a major rolein building up the mass of star-forming cores (e.g. Peretto et al.2006; Schneider et al. 2010; Barnes et al. 2010; Galván-Madridet al. 2010; Liu et al. 2012). Global infall also naturally explainsthe mass segregation observed in SDC335 and other regions.Although a number of questions remain to be answered, it isbecoming clear that large-scale evolution of molecular clouds isthe key to the mass determination process of massive stars.
Acknowledgements. We thank the anonymous referee for his/her thorough re-port, which significantly improved the quality of this paper. N.P. was supportedby a CEA/Marie Curie Eurotalents fellowship and benefited from the support ofthe European Research Council advanced grant ORISTARS (Grant Agreementno. 291294). A.D.C. was supported by the PROBeS project funded by theFrench National Research Agency (ANR). J.E.P. has received funding from theEuropean Community Seventh Framework Programme (/FP7/2007-2013/) un-der grant agreement No. 229517. N.S. was supported by the ANR-11-BS56-010
A112, page 8 of 10

N. Peretto et al.: Global collapse of the SDC335 massive star forming cloud
STARFICH project. We also acknowledge the support of the European ALMARegional Centre (ARC) and the UK ARC node. This paper makes use of thefollowing ALMA data: ADS/JAO.ALMA#2011.0.00474.S. ALMA is a partner-ship of ESO (representing its member states), NFS (USA) and NINS (Japan),together with NRC (Canada) and NSC and ASIAA (Taiwan), in cooperationwith the Republic of Chile. The Joint ALMA Observatory is operated by ESO,AUI/NRAO and NAOJ. The Mopra radio telescope is part of the AustraliaTelescope National Facility, which is funded by the Commonwealth of Australiafor operation as a National Facility managed by CSIRO. The University of NewSouth Wales Digital Filter Bank used for the observations with the Mopra tele-scope was provided with the support from Australian Research Council.
Appendix A: Volume-density PDF calculations
Volume-density PDFs of turbulent, non-self-gravitating molec-ular clouds can be described as a lognormal function of thelogarithmic density contrast δ = log (ρ/ρ) (Padoan et al. 1997;Hennebelle & Chabrier 2008):
P(δ) =1√
2πσ20
exp− (δ − δ)2
2σ20
, (A.1)
where σ0 is the standard deviation of the distribution, and δ =−σ2
0/2. Furthermore, the standard deviation of this PDF can bewritten as σ2
0 = ln (1 + bM2), whereM is the Mach number andb ' 0.25.
Integrating Eq. (A.1), we can estimate the fraction of a cloudthat lies above a certain density threshold, ρth, before gravitybecomes important. Setting the two free parameters of Eq. (A.1)to the SDC335 observed values (ρ = 1.3×104 cm−3 andM = 6),we find that less than 0.01% of the gas should lie above ρth = 1×107 cm−3. This is more than three orders of magnitude differentfrom what is observed in SDC335.
Now we can estimate the density ρini (and δini = ρini/ρ) atwhich the following relation is fulfilled:
MMM1
MSDC335=
∫ ∞
δini
P(δ)dδ, (A.2)
which is equivalent to
0.1 = 0.5 ×(1 − erf
[(δini − δ)/
√2σ2
0
]), (A.3)
This gives ρini = 3.5 × 104 cm−3. Then we can calculate the vol-ume diameter in which the MM1 mass was initially contained,using Dini = 2 × [3MMM1/(4πρini)]1/3 = 0.8 pc. Note that herewe used ρini as the mean density of the initial volume, while itformally is the minimum density within the volume under con-sideration. The true mean density is necessarily higher, althoughit cannot be too centrally concentrated either because this wouldnot satisfy the volume density PDF. It is therefore reasonableto use ρini as the mean density, especially since the dependencyof Dini on ρini is weak.
Alternatively, we can estimate the maximum Mini in the cur-rent MM1 volume that satisfies the volume density PDF:
Mini
MSDC335=
∫ ∞
δini
P(δ)dδ, (A.4)
with Mini = ρini VMM1. We find that Mini ' 3 M�, which meansthat in this case nearly the whole MM1 mass must come fromits surrounding. We can estimate the volume of this region bytaking Dini = 2 × [3MMM1/(4πρ)]1/3 = 1.2 pc.
Fig. B.1. Same as Fig. 7, but for the H13CO+(1−0) line.
Appendix B: H13CO+(1−0) RATRAN modelling
Figure B.1 presents the optically thin H13CO+(1−0) modelledspectra obtain with RATRAN for the cloud-collapse model dis-cussed in Sect. 5.3. We see that the modelled lines overall matchthe observed spectrum quite well even though, in nearly allcases, the modelled spectrum is slightly too narrow. This canpotentially be explained by a more complex infall profile thanthe one we used for these calculation, resulting in a slightlybroader line. The modelled spectra have peak temperatures closeto the observed one, which supports our choice of HCO+ andH13CO+ abundances.
Appendix C: Additional detailson the MHD simulation
The simulation presented in this study (Fig. 8 of the paper) wasinitially performed to model the DR21 region (Schneider et al.2010). It is an MHD simulation of a self-gravitating cloud per-formed with the AMR RAMSES code. The initial conditionsof the simulation consisted of a 10 000 M� ellipsoidal cloudwith an aspect ratio of 2 and a density profile as ρ(r, z) =
ρ0/[1 + (r/r0)2 + (z/z0)2], where r =√
(x2 + y2), z0 = 2r0,r0 = 5 pc, and ρ0 = 500 cm−3. The density at the edge of thecloud is ρedge = 50 cm−3, and is maintained in pressure equi-librium with an external medium at lower density. The magneticfield is perpendicular to the main axis of the cloud, with an inten-sity proportional to the cloud column density and a peak valueof 7 µG. By the time of the snapshot presented in this paper,the magnetic field had increased to ∼100 µG in the densest re-gions, with an average value over the dense gas of ∼20 µG. Thesimulation is isothermal at a temperature of 10 K. A turbulentvelocity field was seeded to initially obtain 2T +W + M ' 0 overthe entire cloud, where T is the kinetic energy (thermal and tur-bulent), W the gravitational energy, and M the magnetic energy.Turbulence was undriven and allowed to decay. These conditionslead to W ' 2T ' 9M. Although globally, the turbulent andmagnetic energy compensate for the gravitational energy of thecloud, it quickly becomes sub-virial due to the compressive na-ture of turbulence and because its energy quickly dissipates. Theconsequence of this is the fragmentation and global collapse ofthe simulated cloud.
A112, page 9 of 10
A&A 555, A112 (2013)
References
André, P., Men’shchikov, A., Bontemps, S., et al. 2010, A&A, 518, L102Barnes, P. J., Yonekura, Y., Ryder, S. D., et al. 2010, MNRAS, 402, 73Beckwith, S. V. W., Sargent, A. I., Chini, R. S., & Guesten, R. 1990, AJ, 99, 924Bertoldi, F., & McKee, C. F. 1992, ApJ, 395, 140Beuther, H., & Schilke, P. 2004, Science, 303, 1167Beuther, H., Schilke, P., Gueth, F., et al. 2002, A&A, 387, 931Beuther, H., Schilke, P., & Stanke, T. 2003, A&A, 408, 601Beuther, H., Sridharan, T. K., & Saito, M. 2005, ApJ, 634, L185Beuther, H., Churchwell, E. B., McKee, C. F., & Tan, J. C. 2007, Protostars and
Planets V, 165Beuther, H., Tackenberg, J., Linz, H., et al. 2012, A&A, 538, A11Bonnell, I. A., Vine, S. G., & Bate, M. R. 2004, MNRAS, 349, 735Bontemps, S., Motte, F., Csengeri, T., & Schneider, N. 2010, A&A, 524, A18Busquet, G., Estalella, R., Zhang, Q., et al. 2011, A&A, 525, A141Butler, M. J., & Tan, J. C. 2009, ApJ, 696, 484Caswell, J. L., Fuller, G. A., Green, J. A., et al. 2011, MNRAS, 417, 1964Chabrier, G. 2003, in IAU Symp., 221, 67Churchwell, E., Babler, B. L., Meade, M. R., et al. 2009, PASP, 121, 213Crutcher, R. M. 2012, ARA&A, 50, 29Csengeri, T., Bontemps, S., Schneider, N., et al. 2011, ApJ, 740, L5Cyganowski, C. J., Whitney, B. A., Holden, E., et al. 2008, AJ, 136, 2391Cyganowski, C. J., Brogan, C. L., Hunter, T. R., & Churchwell, E. 2011, ApJ,
743, 56De Vries, C. H., & Myers, P. C. 2005, ApJ, 620, 800Duarte-Cabral, A., et al. 2013, A&A, submittedFuller, G. A., Williams, S. J., & Sridharan, T. K. 2005, A&A, 442, 949Galván-Madrid, R., Zhang, Q., Keto, E., et al. 2010, ApJ, 725, 17Garay, G., Brooks, K. J., Mardones, D., Norris, R. P., & Burton, M. G. 2002,
ApJ, 579, 678Griffin, M. J., Abergel, A., Abreu, A., et al. 2010, A&A, 518, L3Hennebelle, P., & Chabrier, G. 2008, ApJ, 684, 395Hennemann, M., Motte, F., , N., et al. 2012, A&A, 543, L3Hildebrand, R. H. 1983, QJRAS, 24, 267Hoare, M. G. 2005, Ap&SS, 295, 203Hogerheijde, M. R., & van der Tak, F. F. S. 2000, A&A, 362, 697Kauffmann, J., & Pillai, T. 2010, ApJ, 723, L7Kroupa, P. 2002, Science, 295, 82Krumholz, M. R., Klein, R. I., & McKee, C. F. 2012, ApJ, 754, 71Lada, C. J., & Lada, E. A. 2003, ARA&A, 41, 57Ladd, N., Purcell, C., Wong, T., & Robertson, S. 2005, PASA, 22, 62Langer, W. D., & Penzias, A. A. 1993, ApJ, 408, 539Liu, H. B., Jiménez-Serra, I., Ho, P. T. P., et al. 2012, ApJ, 756, 10
McKee, C. F., & Tan, J. C. 2003, ApJ, 585, 850McMullin, J. P., Waters, B., Schiebel, D., Young, W., & Golap, K. 2007, in
Astronomical Data Analysis Software and Systems XVI, eds. R. A. Shaw,F. Hill, & D. J. Bell, ASP Conf. Ser., 376, 127
Molinari, S., Testi, L., Brand, J., Cesaroni, R., & Palla, F. 1998, ApJ, 505, L39Molinari, S., Swinyard, B., Bally, J., et al. 2010, A&A, 518, L100Myers, P. C. 2009, ApJ, 700, 1609Myers, P. C., Mardones, D., Tafalla, M., Williams, J. P., & Wilner, D. J. 1996,
ApJ, 465, L133Padoan, P., Nordlund, A., & Jones, B. J. T. 1997, MNRAS, 288, 145Paradis, D., Veneziani, M., Noriega-Crespo, A., et al. 2010, A&A, 520, L8Peretto, N., & Fuller, G. A. 2009, A&A, 505, 405Peretto, N., & Fuller, G. A. 2010, ApJ, 723, 555Peretto, N., André, P., & Belloche, A. 2006, A&A, 445, 979Peretto, N., Hennebelle, P., & André, P. 2007, A&A, 464, 983Peretto, N., Fuller, G. A., Plume, R., et al. 2010, A&A, 518, L98Peretto, N., André, P., Könyves, V., et al. 2012, A&A, 541, A63Pilbratt, G. L., Riedinger, J. R., Passvogel, T., et al. 2010, A&A, 518, L1Pillai, T., Kauffmann, J., Wyrowski, F., et al. 2011, A&A, 530, A118Poglitsch, A., Waelkens, C., Geis, N., et al. 2010, A&A, 518, L2Ragan, S. E., Heitsch, F., Bergin, E. A., & Wilner, D. 2012, ApJ, 746, 174Rathborne, J. M., Jackson, J. M., & Simon, R. 2006, ApJ, 641, 389Rathborne, J. M., Simon, R., & Jackson, J. M. 2007, ApJ, 662, 1082Rathborne, J. M., Jackson, J. M., Zhang, Q., & Simon, R. 2008, ApJ, 689, 1141Rathborne, J. M., Garay, G., Jackson, J. M., et al. 2011, ApJ, 741, 120Reid, M. J., Menten, K. M., Zheng, X. W., et al. 2009, ApJ, 700, 137Ren, Z., Wu, Y., Zhu, M., et al. 2012, MNRAS, 422, 1098Rodón, J. A., Beuther, H., & Schilke, P. 2012, A&A, 545, A51Savage, C., Apponi, A. J., Ziurys, L. M., & Wyckoff, S. 2002, ApJ, 578, 211Schneider, N., Csengeri, T., Bontemps, S., et al. 2010, A&A, 520, A49Schneider, N., Csengeri, T., Hennemann, M., et al. 2012, A&A, 540, L11Smith, R. J., Longmore, S., & Bonnell, I. 2009, MNRAS, 400, 1775Smith, R. J., Shetty, R., Stutz, A. M., & Klessen, R. S. 2012, ApJ, 750, 64Traficante, A., Calzoletti, L., Veneziani, M., et al. 2011, MNRAS, 416, 2932van der Tak, F. F. S., Black, J. H., Schöier, F. L., Jansen, D. J., & van Dishoeck,
E. F. 2007, A&A, 468, 627Wang, K., Zhang, Q., Wu, Y., & Zhang, H. 2011, ApJ, 735, 64Wilcock, L. A., Ward-Thompson, D., Kirk, J. M., et al. 2012, MNRAS, 424,
716Xu, Y., Li, J. J., Hachisuka, K., et al. 2008, A&A, 485, 729Zapata, L. A., Ho, P. T. P., Schilke, P., et al. 2009, ApJ, 698, 1422Zhang, Q., & Wang, K. 2011, ApJ, 733, 26Zinchenko, I., Caselli, P., & Pirogov, L. 2009, MNRAS, 395, 2234Zinnecker, H., & Yorke, H. W. 2007, ARA&A, 45, 481
A112, page 10 of 10