Embed Size (px)
Citation preview

Articleshttps://doi.org/10.1038/s41593-021-00800-0
1Centre National de la Recherche Scientifique, University of Strasbourg, Institute of Cellular and Integrative Neurosciences, Strasbourg, France. 2Center for Neuroinflammation and Cardiometabolic Diseases, Georgia State University, Atlanta GA, USA. 3Department of Neuropeptide Research for Psychiatry, Central Institute of Mental Health, University of Heidelberg, Mannheim, Germany. 4Center for Psychiatric Neurosciences, Hôpital de Cery, Lausanne University Hospital (CHUV), Lausanne, Switzerland. 5German Cancer Research Center (DKFZ), Heidelberg, Germany. 6OpenLab of Neurobiology, Kazan Federal University, Kazan, Russia, Federal Center of Brain Research and Neurotechnologies, Moscow, Russia and Department of Physiology and Pathophysiology, University of Heidelberg, Heidelberg, Germany. 7Department of Molecular and Cellular Biology, Center for Brain Science, Harvard University, Cambridge MA, USA. 8Department of Pharmacology, Heidelberg University, Heidelberg, Germany. 9Pain center, Department of Anesthesiology, Lausanne University Hospital (CHUV), Lausanne, Switzerland. 10Interdisciplinary Neurobehavioral Core (INBC), Ruprecht-Karls-Universität, Heidelberg, Germany. 11Division of Anatomy, Faculty of Medicine, University of Geneva, Geneva, Switzerland. 12Department of Fundamental Neurosciences, Faculty of Biology and Medicine (FBM), University of Lausanne, Lausanne, Switzerland. 13Neuroglial Interactions in Cerebral Physiopathology, Center for Interdisciplinary Research in Biology, Collège de France, Centre National de la Recherche Scientifique UMR 7241, Institut National de la Santé et de la Recherche Médicale U1050, Labex Memolife, PSL Research University, Paris, France. 14Section on Neural Gene Expression, National Institute of Mental Health, National Institutes of Health, Bethesda, MD, USA. 15University of Strasbourg Institute for Advanced Study (USIAS), Strasbourg, France. 16Present address: KU Leuven, Leuven Brain Institue, Department of Neurosciences, VIB-KU Leuven Center for Brain and Disease Research, Laboratory of Glia Biology, Leuven, Belgium. 17Present address: Group of Systemic and Cellular Neuroscience, Institute of Physiology, University of Freiburg, Freiburg, Germany. 18Present address: The Brain Cognition and Brain Disease Institute of Shenzhen Institutes of Advanced Technology, Chinese Academy of Sciences, Beijing, China. 19These authors contributed equally: Jérôme Wahis, Angel Baudon, Ferdinand Althammer, Damien Kerspern. 20These authors jointly supervised this work: Valery Grinevich, Alexandre Charlet. e-mail: [email protected]; [email protected]
OT is a neuropeptide that acts as both a peripheral neurohor-mone and a central neuromodulator to modulate key physi-ological functions, from ion homeostasis to complex social
behaviors1. OT is produced in hypothalamic magnocellular neurons that project further to virtually all forebrain regions. When activated, OTergic axons release OT both synaptically and extra-synaptically in the extra-cellular fluid2,3. This last mode of OT release has the potential to activate virtually every cell type expressing OT receptors (OTRs) located in close proximity to the sites of axonal OT release3.
A few studies using immunohistochemistry on central nervous system (CNS) sections or a knock-in mice model found that not
only neurons but also astrocytes express OTRs in various brain regions4,5. Early studies indicated that locally released OT induces morphological and functional changes in both the astroglial and neuronal networks of the hypothalamic nuclei producing the neu-ropeptide6. Astrocytes are part of the tripartite synapse and capable to modulate neuronal activity as well as to sense the release of neu-romodulators into the neuropil7. Astrocytes express receptors for various neuromodulators, and accumulating evidence demonstrates that they actually mediate part of their neurophysiological effects7, but such evidence is lacking for OT. Mapping of OTR expression in the rodent brain found that it was expressed at high levels in several
Astrocytes mediate the effect of oxytocin in the central amygdala on neuronal activity and affective states in rodentsJérôme Wahis1,16,19, Angel Baudon1,19, Ferdinand Althammer2,19, Damien Kerspern1,19, Stéphanie Goyon1, Daisuke Hagiwara3, Arthur Lefevre 1,3, Lara Barteczko3, Benjamin Boury-Jamot4, Benjamin Bellanger1, Marios Abatis4, Miriam Da Silva Gouveia5, Diego Benusiglio 3, Marina Eliava3, Andrei Rozov 6, Ivan Weinsanto1, Hanna Sophie Knobloch-Bollmann7,17, Matthew K. Kirchner 2, Ranjan K. Roy 2, Hong Wang8,18, Marie Pertin9, Perrine Inquimbert 1, Claudia Pitzer10, Jan Siemens 8, Yannick Goumon1, Benjamin Boutrel 4, Christophe Maurice Lamy 11, Isabelle Decosterd9,12, Jean-Yves Chatton9, Nathalie Rouach 13, W. Scott Young 14, Javier E. Stern2, Pierrick Poisbeau1, Ron Stoop4, Pascal Darbon1, Valery Grinevich 3,20 and Alexandre Charlet 1,15,20
Oxytocin (OT) orchestrates social and emotional behaviors through modulation of neural circuits. In the central amygdala, the release of OT modulates inhibitory circuits and, thereby, suppresses fear responses and decreases anxiety levels. Using astrocyte-specific gain and loss of function and pharmacological approaches, we demonstrate that a morphologically distinct subpopulation of astrocytes expresses OT receptors and mediates anxiolytic and positive reinforcement effects of OT in the central amygdala of mice and rats. The involvement of astrocytes in OT signaling challenges the long-held dogma that OT acts exclusively on neurons and highlights astrocytes as essential components for modulation of emotional states under normal and chronic pain conditions.
NAtuRE NEuRoSCIENCE | VOL 24 | APRIL 2021 | 529–541 | www.nature.com/natureneuroscience 529

Articles NaTUrE NEUrOScIENcE
brain regions4 and, of interest in this study, particularly in the lateral and capsular part (CeL) of the CeA8, albeit the types of cells express-ing the OTR in this brain region were never elucidated.
Functionally, the release of OT in the CeL leads to increased fir-ing of GABA-expressing interneurons2,8. These interneurons inhibit projection neurons in the medial CeA (CeM), which serve as CeA output. OT action in this circuit affects amygdala-related functions, including activity of the autonomous nervous system, fear expres-sion and anxious behaviors2,9,10. Furthermore, the CeA is involved in the pathophysiology of several neurological diseases, including neuropathic pain and anxiety11,12, in which both astrocytes13 and the OT system14 are thought to play an important role. Therefore, it is crucial to understand how the OT system controls pain and its emotional comorbidities and if astrocytes are involved in these mechanisms.
Indeed, a role for astrocytes in the regulation of CeA circuits has already been proven in the CeM15, where astrocyte activity can reduce fear expression in a fear-conditioning paradigm—a role that is surprisingly similar to the effect of OTR signaling in the CeL2. We, therefore, sought to investigate if CeL astrocytes could also play a role in the OT-mediated regulation of CeA circuits and some of their behavioral correlates.
Our study shows the expression of OTRs in CeL astrocytes and demonstrates that OT directly acts on CeL astrocytes to gate CeL neuron excitability through N-methyl-D-aspartate recep-tor (NMDAR) (co)activation. Furthermore, we found that the astrocyte-mediated OTR signaling underlies the anxiolytic and pos-itive reinforcement effects of OT in the CeA. We, thus, provide the first evidence that OT drives astrocyte activity and that this effect is an essential part of the OTergic modulation of amygdala neuronal circuits and the behaviors they regulate.
ResultsCeL astrocytes express functional OTRs in rats and mice. To investigate whether CeA astrocytes express OTRs, we performed fluorescence in situ hybridization (FISH) combined with immuno-histochemistry on rat CeA sections and found some overlap between OTR messenger RNA (mRNA) signal and an astrocyte marker, glutamine synthase (GS) (Fig. 1a,b and Extended Data Fig. 1a). Within the rat CeL, 18.6 ± 1.8% of astrocytes and 67.8 ± 3.1% of neurons expressed OTR mRNA (Fig. 1c), with similar results in mice (Extended Data Fig. 1b). We confirmed these results using other astrocyte markers, namely ALDH1L1 and GFAP (Extended Data Fig. 1c,d). Next, we employed immunohistochemistry-based three-dimensional (3D) reconstruction using the Imaris technique and a semi-automated pipeline16 by combining immunohistochem-ical staining for GS and GFAP with FISH for OTR mRNA in the rat CeL (Fig. 1d,e). This analysis confirmed the presence of OTR mRNA in astrocytes and revealed that OTR+ astrocytes have, on average, a significantly larger cell volume and surface area and a higher number and an increased length of processes compared to OTR− astrocytes (Fig. 1e). Subsequent Sholl analysis revealed that OTR+ astrocytes bear more complex morphological features than OTR− astrocytes (Fig. 1f), suggesting that OTR+ astrocytes repre-sent a distinct subpopulation of astrocytes within the CeL.
To test whether CeL astrocytes respond to endogenous OT release, we expressed the ChR1/VChR1 chimera channel rhodopsin variant17 (referred to here as C1V1) in OTergic neurons to optoge-netically control CeA-innervating OT axons (POT-C1V1-mCherry; referred to as OxytOpto). To this end, we employed a previously characterized adeno-associated viral (AAV) vector equipped with the OT promoter2, which was injected into the paraventricu-lar (PVN), supraoptic and accessory nuclei of rat hypothalamus (Fig. 2a and Extended Data Fig. 2a,b). We then identified CeL astro-cytes through sulforhodamine 101 (SR101) labeling and measured the relative changes in cytosolic calcium using the small organic
dye Oregon Green 488 BAPTA-1 (OGB1) (Fig. 2b and Extended Data Fig. 2c–e). We found that 61.9 ± 8.7% of recorded astrocytes responded to the optogenetic OT axon stimulation (Fig. 2c,d). To avoid the possibility that astrocyte activity was increased due to the increased spiking of CeL interneurons caused by optogeneti-cally evoked OT release, tetrodotoxin (TTX) was added to the bath before the stimulation (Fig. 2c,d). Further calcium imaging experi-ments described below use TTX incubation (unless stated other-wise) for the same reason. We analyzed the area under the curve (AUC) and Ca2+ transient frequency normalized to the baseline of astrocyte responses (Method in Extended Data Fig. 2f) and found both parameters to be increased after stimulation of OT axons (Fig. 2d). Taken together, these results indicate that optogenetically evoked OT release from axons present in the CeL elicits an increase in activity of CeL astrocytes.
To ensure that the observed responses are exclusively due to OTR activation, we applied the selective agonist of OTR ([Thr4Gly7]-oxytocin, TGOT), which increased calcium tran-sients in 60.1 ± 9.2% of the recorded astrocytes, a result unchanged when replicated with slices pre-incubated with TTX (Fig. 2e,f). Similar pre-incubation of the slices with the OTR antagonist [d(CH2)5,Tyr(Me)2,Orn8]-vasotocin (dOVT) reduced the propor-tion, AUC and Ca2+ transient frequency of TGOT-evoked calcium responses in astrocytes (Fig. 2e,f), confirming that the activation of astrocytes by TGOT is indeed mediated by OTR.
To test whether these effects involve the direct stimulation of astrocytic OTR, we employed a transgenic mouse line with LoxP sites flanking the OTR gene18 (OTR conditional knockout (cKO) mice). To specifically delete OTRs in astrocytes, we injected AAV PGFAP-Cre in the CeL of OTR cKO mice (Fig. 2g). This led to expression of Cre in 56.0 ± 4.9% of astrocytes within the injection site, with a specificity reaching 96.2 ± 1.05% (Extended Data Fig. 2g). PGFAP-Cre AAV injection in OTR cKO mice resulted in a drastic decrease in OTR mRNA signal in astrocytes (Fig. 2h) but not in neurons (Extended Data Fig. 2h). TGOT application in TTX-treated acute slices of the CeL from control mice led to responses in 43.9 ± 7.2% of astrocytes (Fig. 2i), whereas these responses were largely reduced in CeL astrocytes from PGFAP-Cre AAV-injected OTR cKO mice (GFAP OTR KO; Fig. 2i). These results confirm that astrocyte response to TGOT is a direct consequence of astrocytic OTR activation and not secondary to neuronal activity.
Activation of OTR+ astrocytes propagates through the astro-cyte network. Because astrocytes are known to form extensive intercellular networks, we next studied the spatial connectivity of OTR+ astrocytes in the CeL. (Fig. 3a and Extended Data Fig. 3a). We found that the distance between OTR+ astrocyte pairs (96.0 ± 4.0 μm) was larger than the distance between OTR–astro-cyte pairs (37.4 ± 0.9 μm; Fig. 3a). In addition, we found that OTR+ astrocytes had significantly more contacts with OTR− astrocytes than with OTR+ astrocytes (Fig. 3a), whereas OTR− astrocytes regu-larly contact other OTR− astrocytes.
These anatomical results suggest a specific distribution pattern of OTR+ astrocytes within the CeL, where OTR+ astrocytes are found distant from one another and exhibit many connections with their OTR− counterparts. Interestingly, the proportion of rats and mice astrocytes responsive to OTR activation always exceeded 40% of recorded cells (Fig. 2) despite our FISH/Imaris results indicating that fewer than 20% of astrocytes expressed OTR mRNA (Fig. 1). This apparent discrepancy led us to test whether the sole activation of OTR+ astrocytes could drive the activity of the overall astrocyte network, including that of OTR− astrocytes.
There are two common signaling pathways typical for astro-cytes that could facilitate the spread of activation from OTR+ to OTR− astrocytes. This could occur via 1) paracrine purinergic communication (for example, ATP release) or 2) spread of Ca2+
NAtuRE NEuRoSCIENCE | VOL 24 | APRIL 2021 | 529–541 | www.nature.com/natureneuroscience530

ArticlesNaTUrE NEUrOScIENcE
activity through a connexin gap junction network. To decipher the underlying mechanism, we first blocked purinergic receptors using pyridoxalphosphate-6-azophenyl-2’,4’-disulfonic acid (PPADS)
and found that this blocker did not significantly affect the aver-age proportion of astrocytes activated by TGOT (Fig. 3b) nor the properties of these responses (Fig. 3b), a result replicated using a set
c
CeM
CeL
GS OTR mRNA
a b
GFAP GS OTR
3D reconstruction
OTR+ astrocyteOTR– astrocyte
Cel
l vol
ume
(µm
3 )
Mea
n pr
oces
s le
ngth
(µm
)
40
0
20
Surfa
ce (µ
m2 )
Num
ber o
f pro
cess
es
600
0
200
d e
3.104
0
104
***********
40030
2.104
0
10
20
30
40
Distance from the soma (µm)
Shol
l int
erse
ctio
ns
###
0 10 20 30 40 50 60 70
f
10
0
2.104
4.014
6.104
8.104
Dom
ain
volu
me
(µm
3 )
***
0
20
40
60
80
100
OTR
mR
NA-
expr
essi
ngce
lls (%
)
Astro
cyte
Neu
ron
3.104
0
104
2.104
Fig. 1 | Specific CeL astrocytes express otRs. a, Overview of CeA FISH of OTR mRNA (red) and GS immunostaining (green). b, High-magnification images of cells positive for OTR mRNA and/or GS (double arrows); green arrows point to GS-positive cells; red arrows point to OTR mRNA-positive cells. Scale bars, 100 µm (a) and 10 µm (b). c, Proportion of CeL astrocytes (GS-positive cells, left) and neurons (NeuN-positive cells, right) positive for OTR mRNA (red) (nrats = 5, nslices = 20, nastrocytes = 1,354, nneurons = 1,254). d, Cells were reconstructed in 3D using Imaris, and morphological parameters were evaluated. Scale bar, 20 µm. e, OTR-expressing astrocytes are bigger and more complex, as indicated by several morphological parameters (cell volume, surface, number of processes, process length and domain volume, OTR-negative: nmice = 5, nslices = 20, nastrocytes = 1,142; OTR-positive: nmice = 5, nslice = 20, nastrocytes = 212). f, OTR-expressing astrocytes display a more complex morphology, as revealed by Sholl analysis (OTR-negative: nmice = 5, nslices = 20, nastrocytes = 1,142; OTR-positive: nmice = 5, nslice = 20, nastrocytes = 212). All data are expressed as mean ± s.e.m., except in violin plots where the hatched line represents the median and the dot lines are the first and third quartiles. ***P < 0.001, **P < 0.01, two-sided unpaired Student’s t-test; ###P < 0.001, two-way ANOVA followed by Tukey post hoc test. Statistics are presented in Supplementary Table 1.
NAtuRE NEuRoSCIENCE | VOL 24 | APRIL 2021 | 529–541 | www.nature.com/natureneuroscience 531

Articles NaTUrE NEUrOScIENcE
AU
C (
norm
. to
base
line)
4
2
0
OGB1: baseline
OGB1: TGOT + TTX
SR101
0
20
40
60
80
100
PGFAP-Cre
Control
GSOTR mRNA
10
5
0
4
2
Res
pons
e to
TG
OT
(%
)
100
50
0
100
50
3
0
200 s
OTROxytocin
CeM
CeL
200 s
AU
C (
norm
. to
base
line)
4
2
0
Res
pons
e to
Oxy
tOpt
o (%
)
100
50
0
10
5
0
Ca2+
tran
sien
t fre
q.(n
orm
. to
base
line)
**
* *
OxytOptoλ542 nm 20 s
TGOT0.4 µM 20 s
POT
ITR ITR
C1V1-mCherry
Wistar rat
a
OTR cKO mouse
PGFAP
ITR ITR
GFP-IRES-Cre
b c d
e f
g h i
**
00
AU
C (
norm
. to
base
line)
Res
pons
e to
TG
OT
(%
)
OT
R m
RN
A-e
xpre
ssin
gas
troc
yte
(%)
GFAP OTR KOWT
Ctr
l
C1V1
PVN
CeA
AAV
AAV
2
1
***
150%
∆F
100%
∆F
Ca2+
tran
sien
t fre
q.(n
orm
. to
base
line)
No
TT
X
dOV
T
Ctr
l
No
TT
X
dOV
T
Ctr
l
No
TT
X
dOV
T
Ca2+
tran
sien
t fre
q.(n
orm
. to
base
line)
0
64
128
191
255
Fig. 2 | Astrocytic otR activation evokes calcium transients in CeL astrocytes of rats and mice. a, Experimental strategy to express the ChR1/VChR1 chimera channel rhodopsin variant C1V1 in OTergic neurons (OxytOpto). b, Experimental scheme of the horizontal CeA slice preparation used, showing C1V1-expressing OT axons (yellow) arising from the PVN and projecting to the CeL. c, Typical traces of relative changes in intracellular calcium in astrocytes (ΔF) induced by the activation of C1V1 in OT axons located in the CeL through λ542-nm light pulses (10-ms width, 30 Hz, duration 20 s). d, Proportion of responding astrocytes (left), AUC of ΔF traces (middle), and Ca2+ transient frequency (right) normalized to baseline values after C1V1 activation in CeL OT axons, nslice (ns) = 7, nastrocytes (na) = 36. e, Left: images of CeL astrocytes identified through SR101 (red, top) and corresponding pseudocolor images of OGB1 fluorescence during baseline and after drug application (middle, bottom, stacks of 50 images over 25 s of recording; n = 18). Scale bar, 10 μm. Right: typical ΔF traces after TGOT + TTX (Ctrl) application. f, Proportion of responding astrocytes (left), AUC of ΔF traces (middle), and Ca2+ transient frequency (right), normalized to baseline values after application of TGOT (0.4 μM) with TTX (1 μM) (Ctrl, ns = 18, na = 136), without TTX (No TTX, ns = 7, na = 43) and with an OTR antagonist (dOVT, 1 µM; ns = 3, na = 24). Data are expressed as means across slices plus s.e.m. g, Experimental strategy for the specific deletion of OTRs in mice CeL astrocytes. h, Left: example pictures of OTR mRNA (red) and GS (green) labeling in mice injected with PGFAP-GFP-IRES-Cre (top) or PGFAP-GFP rAAV vector (bottom); right: proportion of CeL astrocytes (GS-positive cells) also positive for OTR mRNA (left, blue, PGFAP-GFP: nastrocytes = 897, nmice = 4; right, red, PGFAP-GFP-IRES-Cre: nastrocytes = 940, nmice = 4). Scale bar, 50 µm. i, Proportion of responding astrocytes (left), AUC of ΔF traces (middle), and Ca2+ transient frequency (right), normalized to baseline values after application of TGOT + TTX in control (blue, ns = 12, na = 237) or GFAP OTR KO mice (red, ns = 5, na = 47; red) acute brain slices. Calcium imaging data are expressed as means across slices plus s.e.m., and white circles indicate averages across astrocytes per slice. *P < 0.05, **P < 0.01, ***P < 0.001, two-sided unpaired t-test or Mann–Whitney U test. Statistics are presented in Supplementary Table 2. ITR, inverted terminal repeat; WT, wild type.
NAtuRE NEuRoSCIENCE | VOL 24 | APRIL 2021 | 529–541 | www.nature.com/natureneuroscience532

ArticlesNaTUrE NEUrOScIENcE
of purinergic receptor antagonists blocking most known puriner-gic receptors (Extended Data Fig. 3b,c). However, the incubation with the gap junction blocker carbenoxolone (CBX) significantly reduced the number of astrocytes responsive to TGOT + TTX application (Fig. 3b). Given that astrocyte gap junctions are primar-ily composed of connexins 30 and 43, we assessed astrocyte Ca2+ activity in CeL slices obtained from Cx30/Cx43 double-KO mice19 and found that the number of astrocytes activated by TGOT was significantly reduced in these mice (Fig. 3c). These results indicate
that gap junctions play a role in the propagation of responses after OTR activation in the CeL astrocytes network, possibly from OTR+ to OTR− astrocytes.
CeL astrocyte activity increases CeL neuron excitability. We next wanted to test if this direct astrocyte network response to OTR activation could be relevant to the known effect of OTR signaling on CeA neuronal networks2,8,9. To manipulate astro-cytic activity, we expressed the opsin C1V1 under the control of
0
2
4
6
8
Con
tact
s w
ith o
ther
ast
rocy
tes
***
***
OTR–
OTR–
OTR+
OTR+
0
50
100
150
***
4
2
100
50
0
Nea
rest
nei
ghbo
r (µ
m)
OTR–
OTR–
OTR+
OTR+OTR–
OTR+
**
100%
ΔF
100 s
PPADS
TGOT0.4 µM 20 s
a
b
200 1050
% Δ
F
100 s
CBX
AU
C (
norm
. to
base
line)
Res
pons
e to
TG
OT
(%
)
Ca2+
tran
sien
t fre
q.(n
orm
. to
base
line)
GFAP 3D reconstruction
10 µm
0
3
0
2
1
Cx30/Cx43 KO mousec
40%
ΔF
100 s
2
1
100
50
0
*
AU
C (
norm
. to
base
line)
Res
pons
e to
TG
OT
(%
)
Ca2+
tran
sien
t fre
q.(n
orm
. to
base
line)
0
6
0
3
3
Cx30/Cx43 KOWT
*
Ctr
l
PP
AD
S
CB
X
Ctr
l
PP
AD
S
CB
X
Ctr
l
PP
AD
S
CB
X
Fig. 3 | otR-expressing CeL astrocytes are positioned to recruit a CeL astrocyte network through gap junction. a, Left: the distance between two OTR+ astrocytes is larger than the distance between two OTR− astrocytes. Right: OTR+ astrocytes predominantly form contacts with OTR− astrocytes (nastrocytes = 1,354; OTR+ nastrocytes = 212; nrats = 4). Contacts are defined by a proximity of less than 1 µm between GFAP-positive fibers/endfeet from two different astrocytes. b, Left: typical ΔF traces after TGOT + TTX application in the presence of CBX (100 μM, top) or PPADS (50 μM, bottom). Right: proportion of responding astrocytes, AUC of ΔF traces and Ca2+ transient frequency normalized to baseline values after application of TGOT + TTX (0.4 μM) in the presence of CBX (ns = 9, na = 75) or PPADS (ns = 7, na = 53). c, Left: typical ΔF traces after TGOT + TTX application in Cx30/Cx43 KO mice brain slices. Right: proportion of responding astrocytes, AUC of ΔF traces and Ca2+ transient frequency, normalized to baseline values after TGOT + TTX application in wild-type mice (ns = 19, na = 78) and in Cx30/Cx43 KO mice acute brain slices (ns = 17, na = 100). Calcium imaging data are expressed as means across slices plus s.e.m., and white circles indicate averages across astrocytes per slice. *P < 0.05, **P < 0.01, ***P < 0.001, two-sided unpaired t-test or Mann–Whitney U test. Statistics are presented in Supplementary Table 3. WT, wild type.
NAtuRE NEuRoSCIENCE | VOL 24 | APRIL 2021 | 529–541 | www.nature.com/natureneuroscience 533

Articles NaTUrE NEUrOScIENcE
the GFAP promoter using recombinant AAV (rAAV) injections (PGFAP-C1V1-mCherry, referred to as AstrOpto; Fig. 4a). After confirmation of vector expression in 62.5 ± 3.1% of CeL astrocytes, with a specificity reaching 98.8 ± 0.7% (Extended Data Fig. 4a), we evaluated the effect of C1V1 stimulation on astrocyte calcium activ-ity (Fig. 4b). We observed responses in 60.8 ± 9.0% of astrocytes (Fig. 4c), a proportion similar to what we observed after OTR stimu-lation by TGOT + TTX (AstrOpto versus TGOT + TTX; P = 0.8265, unpaired two-sided t-test). The removal of extracellular calcium prevented the C1V1-driven astrocyte activity (Extended Data Fig. 4b). This indicates that influx of extracellular calcium through the plasma membrane is required to generate calcium transient activity in astrocytes after C1V1 activation (Extended Data Fig. 4b).
Next, we measured the effect of evoked astrocyte activity, using AstrOpto or direct OTR stimulation through TGOT application, on CeL neuron inputs. Optical stimulation of C1V1 in astrocytes increased the frequency of miniature excitatory post-synaptic cur-rents (mEPSCs) in CeL neurons (Fig. 4d), and bath-applied TGOT had a similar effect (Fig. 4f). To block the increase in calcium tran-sients evoked by TGOT, we infused BAPTA specifically in astro-cytes and found that this was sufficient to block TGOT effect on CeL neuron mEPSCs (Fig. 4e,f). This indicates that OTR activation and the ensuing increase in calcium transients in astrocytes is driv-ing up excitatory inputs to CeL neurons.
To identify the intercellular communication pathway involved in astrocyte–neuron communication after OTR activation of astro-cytes, we studied whether NMDA receptor (NMDAR), a well-known neuronal receptor that can be activated by astrocytic gliotransmitter d-serine20–22 and whose activation in the CeA relies on astrocytes23, was involved. Thus, we applied an NMDAR antagonist (2R)-amino-5-phosphonovaleric acid (AP5) before TGOT application and found that it inhibited TGOT effect on mEPSC frequency (Fig. 4f). Notably, AP5 had no effect on astrocyte responses to TGOT (Extended Data Fig. 3d). Finally, we repeated the mEPSC measurements in control and GFAP OTR KO mice. TGOT application increased mEPSC fre-quency in control mice but not in GFAP OTR KO mice (Fig. 4g,h), confirming the role of astrocytic OTR in mediating the effects of OTR signaling on synaptic inputs in CeL neurons.
To investigate whether the increase in mEPSC frequency in CeL neurons after OTR activation was able to increase their firing fre-quency, we applied the same stimulation protocols as before and subsequently recorded spontaneous action potential (AP) firing (Fig. 5a,b). First, AstrOpto increased firing of CeL neurons, an effect that was blocked by previous infusion of BAPTA in the astroglial network, hence indicating that AstrOpto effect on neurons depends on astrocyte calcium signaling (Fig. 5c). Similarly, and in agreement with its effect on CeL neuron mEPSCs, TGOT also increased neuro-nal spiking activity (Fig. 5d), an effect that was abolished by BAPTA infusion in the astroglial network or pre-incubation of AP5 in the
recording bath and, crucially, in mice lacking OTR in astrocytes (Fig. 5d–f).
These results unequivocally demonstrate that OTR signaling in the CeL requires the activation of astrocytic OTR, astrocytic cal-cium activity and downstream NMDAR activation to increase excit-ability of CeL interneurons.
CeL astrocyte activity increases inhibitory inputs onto CeM projection neurons. Previous work showed that the activation of CeL OTRs leads to increased activity of GABAergic CeL neu-rons (replicated here (Fig. 5)), resulting in an increased frequency of GABAA-mediated inhibitory post-synaptic currents (IPSCs) in CeM projection neurons2,8,9. In agreement with these findings, we found that optogenetic activation of CeL astrocytes (through AstrOpto) evoked an increase in IPSC frequency in rat CeM neu-rons (Fig. 6a–c). This effect was also dependent on CeL astrocytic calcium signaling, as BAPTA infusion in CeL astrocytes abolished it (Fig. 6c). Furthermore, the effect of AstrOpto on CeM IPSC fre-quency was suppressed by application of AP5 in agreement with AP5 effects on CeL neurons (Fig. 4f). An important element of NMDAR activation is the binding of a co-agonist on the glycine site. d-serine can bind the glycine site in the CeA23 and is a known glio-transmitter whose levels are increased after astrocytic GPCR activa-tion21. We incubated CeA slices in D-amino acid oxidase23 (DAAO) before measuring IPSCs and found that it also suppressed effects of AstrOpto (Extended Data Fig. 5a). Altogether, these results indicate that the effect of AstrOpto on IPSCs in CeM neurons is dependent on the activation of NMDARs in CeL neurons. TGOT application produced a similar effect on CeM neurons, also dependent on CeL astrocytic calcium signaling (Fig. 6d) and on NMDARs (Fig. 6d and Extended Data Fig. 5b) but not on AMPA receptors (Extended Data Fig. 5b). Initial incubation with DAAO similarly blocked the effect of TGOT on IPSC frequency (Extended Data Fig. 5c). Crucially, d-serine supplementation in the DAAO-treated slices after the first, effectless TGOT application rescued the effect of a second TGOT application on IPSC frequency (Extended Data Fig. 5c–e). This con-firms the involvement of neuronal NMDARs and their co-agonist d-serine in OTR-mediated modulation of the CeA neuronal net-work. Another known mode of astrocyte-to-neuron communica-tion relies on purinergic signaling, notably in the CeM15. To test if purinergic signaling was also involved here, we pre-incubated slices with the purinergic receptor antagonists PPADS, CPT or SCH 58261 and found that they had no effects (Extended Data Fig. 5f). This confirms that the primary mode of astrocyte-to-neuron communi-cation engaged after OTR signaling in CeA involves NMDARs, but not purinergic signaling in neurons, and is mediated by an increase in d-serine levels.
TGOT application also led to an increased IPSC frequency in CeM neurons in brain slices from control mice but not in slices
Fig. 4 | CeL astrocyte activity promotes excitatory transmission into CeL neurons. a, Experimental strategy for the specific expression of C1V1 in mice CeL astrocytes (AstrOpto). b, Experimental scheme of the horizontal CeA slice preparation used, showing a C1V1 expressing astrocytes and a patched CeL neuron, recorded in whole-cell voltage-clamp configuration with bath-applied TTX and bicuculline to isolate mEPSCs. c, Left: proportion of responding astrocytes, AUC of ΔF traces and Ca2+ transient frequency after AstrOpto activation (ns = 12, na = 49); right: typical ΔF traces after AstrOpto activation. d, Frequency of mEPSCs in CeL neurons before (basal), during (AstrOpto) and after (Wash) AstrOpto activation (λ542 nm, 3 min long, 1-s width pulse at 0.5 Hz; n = 17). e, Example of an astrocyte in CeL patched with a BAPTA–biocytin-filled capillary (white arrow). Biocytin can be seen diffusing in neighboring astrocytes (n = 3). Scale bars, 400 μm (top) and 50 μm (bottom). f, Frequency of mEPSCs in CeL neurons before (basal), during (TGOT, 0.4 µM) and after (Wash) TGOT application (left, n = 16). This effect can be blocked by loading BAPTA in the CeL astrocyte network (middle, BAPTAstro, n = 11) and by prior incubation of an NMDAR antagonist (right, AP5, 50 µM, n = 9). g, Experimental strategy for the specific deletion of OTRs in mice CeL astrocytes. h, Frequency of mEPSCs in CeL neurons before (basal), during (TGOT, 0.4 µM) and after (Wash) TGOT application in acute brain slices from wild-type mice (left, blue, n = 10) and from GFAP OTR KO mice (right, red, n = 8). Calcium imaging data are expressed as means across slices plus s.e.m., and white circles indicate averages across astrocytes per slice. Patch-clamp data are expressed as average frequency plus s.e.m. across cells; linked white circles indicate individual cell values; example traces of the various conditions are displayed on the right. #P < 0.05, ###P < 0.001, one-way repeated-measures ANOVA and Holm–Sidak multiple comparisons or Friedman and Dunn multiple comparisons; *P < 0.05, **P < 0.01, Mann–Whitney U test. Statistics are presented in Supplementary Table 4. ITR, inverted terminal repeat; WT, wild type.
NAtuRE NEuRoSCIENCE | VOL 24 | APRIL 2021 | 529–541 | www.nature.com/natureneuroscience534

ArticlesNaTUrE NEUrOScIENcE
from GFAP OTR KO mice (Fig. 6e,f). These ex vivo results indi-cate that direct, OTR-mediated CeL astrocyte activation leads to an NMDAR-dependent increase in CeL neuron excitability, which fur-ther increases inhibitory inputs into CeM projection neurons.
Our data so far demonstrate that, when OTR signaling is engaged in astrocytes, these cells increase the excitability of CeL neurons, directly leading to an increase in inhibitory inputs into CeM
projection neurons. Altogether, these results demonstrate that the effect of OT on neuronal activity is abolished when astrocyte func-tion is compromised, establishing, for the first time, that OT signal-ing in CeA circuitry is locally transduced by astrocytes.
OTR signaling effects on CeA behavioral correlates rely on astro-cytes. The CeA is a key nucleus for the processing of emotional
50 p
A
2 s
AstrOpto λ542 nm 3 min
Basal
mE
PS
C fr
eque
ncy
(Hz)
0
2
4
6
8
Basal
TGOT
TGOT + AP5
0
mE
PS
C fr
eque
ncy
(Hz)
0
1
2
3
mE
PS
C fr
eque
ncy
(H
z)
20%
∆F
120 s
AstrOptoλ542 nm 3 min
4
2
1
###
###
#
TG
OT
b
c
d
e f
h
Wash
50 p
A
2 s
8
0
100
50
0
10
5
0
4
BAPTA–biocytin
CeLCeM
A
LMP
WT
50 p
A
2 s
Basal
TGOT in WT
TGOT in GFAP OTR KO
a
PGFAP
ITR ITR
C1V1-mCherry
g
CeM
CeL/C
**
*
AstrOptoλ542 nm 3 min
AU
C (
norm
. to
base
line)
Res
pons
e to
Ast
rOpt
o (%
)
Ca2+
tran
sien
t fre
q.(n
orm
. to
base
line)
BAPTAstro AP5
GFAP OTR KO
mEPSC
Bas
al
Was
h
TG
OT
Bas
al
Was
h
TG
OT
Bas
al
Was
h
TG
OT
Bas
al
Was
h
TG
OT
Bas
al
Was
h
Ast
rOpt
o
Bas
al
Was
h
Wistar rat
OTR cKO mouse
PGFAP
ITR ITR
GFP-IRES-Cre
CeA
CeA
AAV
AAV
C1V1
NAtuRE NEuRoSCIENCE | VOL 24 | APRIL 2021 | 529–541 | www.nature.com/natureneuroscience 535

Articles NaTUrE NEUrOScIENcE
information and, notably, plays an important role in pain-associated disorders11, in which OT is a crucial regulator14. We, therefore, sought to test the involvement of astrocyte-mediated OTR signal-ing in modulating mechanical pain hypersensitivity, levels of anxi-ety and reinforcement behavior in rats and mice in conditions of
neuropathic pain after a spared nerve injury (SNI) surgery24 (Extended Data Fig. 6a).
We found that SNI animals displayed a decreased mechanical threshold, but bilateral micro-injections of TGOT in the CeA had no clear effect on it, with a mild anti-nociceptive effect only in rats
0
2
1
AP
freq
uenc
y (H
z)
0
2
1
AP
freq
uenc
y (H
z)
0
2
1
AP
freq
uenc
y (H
z)
#
##
****
#*
CeM
CeL/C
c
d
f
30 m
V
2 s
Basal
AstrOpto λ542 nm 3 min
Wash
30 m
V
2 s
30 m
V
2 s
Basal
TGOT
TGOT + AP5
Basal
TGOT in WT
TGOT in GFAP OTR KO
3
b
a
AP
TG
OT
BAPTAstro AP5
Bas
al
Was
h
TG
OT
Bas
al
Was
h
TG
OT
Bas
al
Was
h
WT
TG
OT
Bas
al
Was
h
TG
OT
Bas
al
Was
h
BAPTAstro
Ast
rOpt
o
Bas
al
Was
h
Ast
rOpt
o
Bas
al
Was
h
PGFAP
ITR ITR
C1V1-mCherry
e
Wistar rat
OTR cKO mouse
PGFAP
ITR ITR
GFP-IRES-Cre
CeA
CeA
AAV
AAV
GFAP OTR KO
AstrOptoλ542 nm 3 min C1V1
Fig. 5 | CeL astrocyte activity promotes CeL neuron firing. a, Experimental strategy for the specific expression of C1V1 in mice CeL astrocytes (AstrOpto). b, Experimental scheme of the horizontal CeA slice preparation used, showing a C1V1 expressing astrocytes and a patched CeL neuron, recorded in whole-cell current-clamp configuration to record APs. c, Frequency of APs in CeL neurons before (basal), during (AstrOpto) and after (Wash) AstrOpto activation (λ542 nm, 3 min long, 1-s width pulse at 0.5 Hz) in control condition (left, n = 10) or after BAPTA loading in the CeL astrocyte network (right, BAPTAstro, n = 12). d, Frequency of APs in CeL neurons before (basal), during (TGOT, 0.4 µM) and after (Wash) TGOT application (left, n = 9). This effect can be blocked by loading BAPTA in the CeL astrocyte network (middle, BAPTAstro, n = 9) and by prior incubation of the NMDAR antagonist AP5 (right, AP5, 50 µM, n = 7). e, Experimental strategy for the specific deletion of OTRs in mice CeL astrocytes (GFAP OTR KO). f, Frequency of APs in CeL neurons before (basal), during (TGOT, 0.4 µM) and after (Wash) TGOT application in acute brain slices from wild-type mice (left, blue, n = 7) and GFAP OTR KO mice (right, red, n = 11). Example traces of the various conditions are displayed on the right. Patch-clamp data are expressed as average frequency plus s.e.m. across cells; linked white circles indicate individual cell values. #P < 0.05, ##P < 0.01, one-way repeated-measures ANOVA and Holm–Sidak multiple comparisons or Friedman and Dunn multiple comparisons; *P < 0.05, ***P < 0.001, two-sided unpaired t-test or Mann–Whitney U test. Statistics are presented in Supplementary Table 5. ITR, inverted terminal repeat; WT, wild type.
NAtuRE NEuRoSCIENCE | VOL 24 | APRIL 2021 | 529–541 | www.nature.com/natureneuroscience536

ArticlesNaTUrE NEUrOScIENcE
(Fig. 7b,f). Moreover, neither the bilateral optogenetic stimulation of rat CeL astrocytes (AstrOpto; Fig. 7a) nor the removal of OTR from mice astrocytes (Fig. 7e) had a noticeable effect on mechanical threshold (Fig. 7b,f and Extended Data Fig. 7b,f). Given that there is a proven link between chronic pain etiology and synaptic changes
in the CeA25, we tested whether the effect of TGOT on astrocyte cal-cium signaling and CeM neuron IPSC frequency was altered in SNI rats, but we did not find any differences compared to sham-operated animals (Extended Data Fig. 6b–d). These last results indicate that the absence of powerful OTR-induced anti-nociceptive action in
0
6
4
2
0
6
4
2
8
6
4
IPS
C fr
eque
ncy
(Hz)
2
10
#
###***
###*
c
d
f
7
8
2 s
100
pA
Basal
TGOT
TGOT + AP5
Basal
TGOT in WT
TGOT in GFAP OTR KO
b
Basal
Wash
AstrOpto λ542 nm 3 min
CeM
CeL/C
IPS
C fr
eque
ncy
(Hz)
IPS
C fr
eque
ncy
(Hz)
0
**
***
a
IPSC
TG
OT
BAPTAstro AP5
Bas
al
Was
h
TG
OT
Bas
al
Was
h
TG
OT
Bas
al
Was
h
WT GFAP OTR KO
TG
OT
Bas
al
Was
h
TG
OT
Bas
al
Was
h
BAPTAstro
Ast
rOpt
o
Bas
al
Was
h
Ast
rOpt
o
Bas
al
Was
h
PGFAP
ITR ITR
C1V1-mCherry
e
Wistar rat
OTR cKO mouse
PGFAP
ITR ITR
GFP-IRES-Cre
CeA
CeA
AAV
AAV
C1V1AstrOpto
λ542 nm 3 min
2 s
100
pA
2 s
100
pA
Fig. 6 | Astrocyte-driven CeL neuron activity modifies amygdala output. a, Experimental strategy for the specific expression of C1V1 in mice CeL astrocytes (AstrOpto). b, Experimental scheme of the horizontal CeA slice preparation used, showing a C1V1 expressing astrocytes and a patched CeM neuron, recorded in whole-cell voltage-clamp configuration to record IPSCs. c, Frequency of IPSCs in CeL neurons before (basal), during (AstrOpto) and after (Wash) AstrOpto activation (λ542 nm, 3 min long, 1-s width pulse at 0.5 Hz) in control condition (left, n = 19) or after BAPTA loading in the CeL astrocyte network (right, BAPTAstro, n = 9). d, Frequency of IPSCs in CeL neurons before (basal), during (TGOT, 0.4 µM) and after (Wash) TGOT application (left, n = 17). This effect can be blocked by loading BAPTA in the CeL astrocyte network (middle, BAPTAstro, n = 17) and by prior incubation of the NMDAR antagonist AP5 (right, AP5, 50 µM, n = 5). e, Experimental strategy for the specific deletion of OTRs in mice CeL astrocytes (GFAP OTR KO). f, Frequency of APs in CeL neurons before (basal), during (TGOT, 0.4 µM) and after (Wash) TGOT application in acute brain slices from wild-type mice (left, blue, n = 27) and GFAP OTR KO mice (right, red, n = 15). Example traces of the various conditions are displayed on the right. Patch-clamp data are expressed as averaged frequency plus s.e.m. across cells; linked white circles indicate individual cell values. #P < 0.05, ###P < 0.001, one-way repeated-measures ANOVA and Holm–Sidak multiple comparisons or Friedman and Dunn multiple comparisons; *P < 0.05, **P < 0.01, ***P < 0.001, Mann–Whitney U test. Statistics are presented in Supplementary Table 6. ITR, inverted terminal repeat; WT, wild type.
NAtuRE NEuRoSCIENCE | VOL 24 | APRIL 2021 | 529–541 | www.nature.com/natureneuroscience 537

Articles NaTUrE NEUrOScIENcE
neuropathic animals is not the consequence of an altered OTR sig-naling in the CeA, at least at the level of the circuit studied here.
To assess the effect of the neuropathic pain state on anxiety behavior, we used the elevated plus maze and found that SNI ani-mals spent significantly more time in the closed arm compared to sham-operated ones, indicating that the SNI procedure induced a state of elevated anxiety (Fig. 7c,g), as expected26. When TGOT was injected in the CeA, time spent in the closed arm was significantly reduced to levels similar to those observed in sham animals, indi-cating an anxiolytic effect of OTR signaling in both rats and mice (Fig. 7c,g), in line with an earlier report27. Crucially, AstrOpto in rats had a similar effect (Fig. 7c), whereas the deletion of OTR from CeL astrocytes in mice abolished the anxiolytic effects of TGOT (Fig. 7g). Interestingly, sham mice lacking OTR in CeL astrocytes displayed an anxiety-like behavior (Fig. 7g). Together, these data indicate that astrocyte-mediated OT signaling in the CeA is cen-tral to the regulation of anxiety-like behavior in pain-free condi-tions and to the beneficial effect of OT signaling on neuropathic pain-induced increased anxiety28. Furthermore, in a conditioned place preference (CPP) assay, both SNI and sham animals exhibited a preference for the chamber paired with intra-CeA TGOT infu-sion, in line with an earlier report27. Strikingly, this effect was lost by the deletion of OTR in astrocytes but recapitulated by bilateral optogenetic stimulation of CeL astrocytes (Fig. 7d,h). These experi-ments highlight the central role of astrocyte-mediated OT signaling in the regulation of emotional states under normal and chronic pain conditions. Notably, neither the treatments nor the SNI procedure significantly affected the motor activity of animals in elevated plus maze or CPP tests (Extended Data Fig. 7).
Collectively, our findings demonstrate, from the local circuit to the behavioral levels, that OTR signaling through CeL astrocytes is a novel and important mechanism involved in emotional state regula-tion, under both normal and chronic pain conditions (Fig. 7i).
DiscussionWe demonstrate here that OTR signaling through astrocytes is crucial for the oxytocin-ergic modulation of the local CeA micro-circuit and its behavioral correlates. We further propose that this effect relies on a morphologically defined subpopulation of OTR+ astrocytes (Figs. 1 and 2) that convey their activation by OT to other astrocytes through gap junctional communication (Fig. 3), leading to an increase in activity in the overall CeL astrocyte network (Figs. 2 and 3). In turn, astrocytes increase the excitability of CeL inter-neurons by gating the activation of NMDARs (Figs. 4 and 5), likely through the release of d-serine, leading to an increase in GABAergic
inhibitory inputs into CeM neurons (Fig. 6). At the behavioral level, this OTR-mediated modulation of CeA astro-neuronal network promotes a positive emotional state, measured as clear anxiolytic and positive reinforcement effects (Fig. 7).
Mechanistically, our results reinforce previous demonstrations of a role of astrocytes in transforming neuromodulator signaling into a change on the gain of neuronal circuits, notably by (co)activating neuronal NMDAR20–22. Despite the high proportion of OTR+ neu-rons (up to 70%) compared to the limited number of OTR+ astro-cytes (~18%) in the CeL, the activation of OTRs in astrocytes was required to gate CeL neuron responses to OTR activation by allow-ing a sustained (co)activation of NMDARs. Other mechanisms are probably at play: OTR activation in CeL neurons might inhibit K+ leak current, as has been shown in olfactory neuronal cells29 and in spinal cord30. These mechanisms might act in synergy to induce an elevation in firing rates of CeL neurons by increasing the gain of excitatory inputs in these cells. Furthermore, similar mechanisms of astrocyte-to-neuron communication through neuronal NMDAR (co)activation have been proposed by other studies to favor a syn-chronous increase in excitability across an ensemble of neurons31,32. This would allow a synchronized and long-lasting switch in the gain of the CeA neuronal circuits, thereby amplifying the effect of OT on CeA outputs in both the spatial and temporal domains. In light of the predominantly non-synaptic mode of OT release from axons en passant, which could lead to CeL-restricted micro-volume transmis-sion of the neuropeptide3, it seems, then, plausible that astrocytes are required to relay and amplify OT signaling to CeL neurons. Another mechanism that was repeatedly found to be involved in neuromodu-lator signaling through astrocytes is the activation of purinergic sig-naling in neurons33,34. However, in the case of OT signaling within the CeA, purinergic signaling was not involved (Extended Data Fig. 5). It would, then, be interesting to test if astrocytes are important to OT signaling in other brain regions, and, if they are, if the same mecha-nisms of astrocyte-to-neuron communication are at stake.
We found that CeA astrocytes can be divided into two defined populations: OTR+ and OTR− astrocytes. OTR+ astrocytes are morphologically more complex and have more close contacts with neighboring OTR− astrocytes while being quite distant from their OTR+ counterparts, with which they have almost no contacts (Figs. 1 and 2). Thus, we hypothesize that these morphological peculiarities allow the propagation of OTR-evoked calcium transients (Fig. 2) to a much larger number of OTR− astrocytes through, at least partially, gap junctions (Fig. 3b,c). Therefore, only a few strategically posi-tioned OTR+ astrocytes are sufficient to result in a network-wide effect of OT release in the CeL, despite the relatively moderate
Fig. 7 | CeL astrocytes modulate CeA behavioral correlates of comfort and are required for their otR-mediated modulation. a,e, Experimental strategy for the specific expression of C1V1 in mice CeL astrocytes (a, AstrOpto) or the specific deletion of OTRs in mice CeL astrocytes (e, GFAP OTR KO). The treatments applied are color coded, as the legend key indicates. Control indicates a vehicle injection. b,f, Four weeks after the SNI surgery, mechanical pain threshold was assessed on the neuropathic paw before (Ctrl) and at different time points after either TGOT injection or C1V1 activation of CeL astrocytes (gray arrow) for sham (top) and SNI (bottom, gray box) animals. Rats (n): sham control n = 12, TGOT n = 11, C1V1 n = 6, SNI control n = 12, TGOT n = 10, C1V1 n = 10. Mice (n): sham WT n = 6, OTR cKO n = 8; SNI WT n = 5, OTR cKO n = 13. c,g, Anxiety levels were assessed through measurements of the time spent in the closed arms of the elevated plus maze after TGOT injections or C1V1 light-driven activation of CeL astrocytes for sham (top) and SNI (bottom, gray box). Rats (n): sham Veh n = 10, TGOT n = 8, C1V1 n = 9, SNI Veh n = 20, TGOT n = 9, C1V1 n = 7. Mice (n): sham WT Veh n = 7, WT TGOT n = 6, sham OTR cKO Veh n = 5, OTR cKO TGOT n = 7, SNI WT Veh n = 7, WT TGOT n = 8, SNI OTR cKO Veh n = 5, OTR cKO TGOT n = 7. d,h, CPP was assessed through measurements of the ∆ time spent in the paired chamber before and after pairing. Pairing was realized through TGOT injections or C1V1 light-driven activation of CeL astrocytes for sham (top) and SNI (bottom, gray box). Rats (n): sham Veh n = 13, TGOT n = 6, C1V1 n = 5, SNI Veh n = 10, TGOT n = 8, C1V1 n = 8. Mice (n): sham WT Veh n = 5, WT TGOT n = 8, sham OTR cKO Veh n = 5, OTR cKO TGOT n = 4, SNI WT Veh n = 5, WT TGOT n = 5, SNI OTR cKO Veh n = 4, OTR cKO TGOT n = 6. Data are expressed as averages across rats or mice plus s.e.m. (details and statistics in Supplementary Table 7). #P < 0.001, ##P < 0.01, Wilcoxon signed-rank test; *P < 0.05, **P < 0.01, ***P < 0.001, ANOVA or mixed-design ANOVA followed by post hoc Bonferroni test. Statistics are presented in Supplementary Table 7. i, OT-dependent cellular interactions in the CeA. We hypothesize that OT released from axons of PVN neurons within the CeL activates OTR+ astrocytes (red), which, consequently, spread their activation to neighboring OTR− astrocytes (green) through, at least partly, gap junctions. Subsequently, the CeL astrocytes release d-serine, which gates the activation of NMDAR on CeL interneurons, ultimately increasing their firing rate. This, in turn, inhibits CeM output projection neurons, resulting in anxiolysis and the promotion of a positive emotional state. ITR, inverted terminal repeat; WT, wild type.
NAtuRE NEuRoSCIENCE | VOL 24 | APRIL 2021 | 529–541 | www.nature.com/natureneuroscience538

ArticlesNaTUrE NEUrOScIENcE
number of OT fibers found in this nucleus2. By describing a new population of astrocytes, our work adds to the recent advances in describing molecular, morphological and functional heterogeneity
in astrocyte populations35,36 and opens up new perspectives into understanding how astrocyte subpopulations are functionally orga-nized and communicate inside CNS circuits.
a
e
i
PGFAP
ITR ITR
C1V1-mCherry
Wistar rat
OTR cKO mouse
PGFAP
ITR ITR
GFP-IRES-Cre
CeA
CeA
AAV
AAV
C1V1
TGOT
Control
TGOT in WT
Control
TGOT inGFAP OTR KO
OT
PVNOT
neuron
D-serine
CeLneuron
Gap junctionspreading
OTR+
astrocyte
OTR NMDAR
OTR–
astrocyte
CeMneuron
ComfortAnxiety
CeL CeM
SN
IM
echa
nica
l thr
esho
ld (
g)S
ham
Mec
hani
cal t
hres
hold
(g)
******
Ctr
l
0.3
h
3.5
h
24 h
****
20
40
60
80
100
** ***
** **
24 h
0
4
8
6
Ctr
l
0.3
h
2
Ctr
l
0.3
h
3.5
h
24 h
SN
IM
echa
nica
l thr
esho
ld (
g)
Tim
e in
pai
red
cham
ber
(Δs)
Tim
e in
pai
red
cham
ber
(Δs)
Tim
e in
clo
sed
arm
(%
)
Tim
e in
pai
red
cham
ber
(Δs)
Tim
e in
clo
sed
arm
(%
)
Sha
mM
echa
nica
l thr
esho
ld (
g) *
*
Tim
e in
pai
red
cham
ber
(Δs)
24 h
0
4
8
6
Ctr
l
0.3
h
2
Tim
e in
clo
sed
arm
(%
)
100
80
60
40
20
800
400
0
–400
300
200
100
0
300
200
100
0
800
400
0
–400
b c d
f g h
##
WT GFAPOTR KO
WT GFAPOTR KO
GFAPOTR KO
WT GFAPOTR KO
#
0
50
75
100
25
Tim
e in
clo
sed
arm
(%
)
0
50
75
100
25
–800
800
400
0
–400
–800
800
400
0
–400
0
0
*
NAtuRE NEuRoSCIENCE | VOL 24 | APRIL 2021 | 529–541 | www.nature.com/natureneuroscience 539

Articles NaTUrE NEUrOScIENcE
OT and its effects on brain circuits, and ultimately behavior, are under intense scrutiny, from fundamental research in animal models to behavioral and physiological studies in humans37,38. Among other roles, OT is considered a powerful anxiolytic pep-tide through its action in the human amygdala39. However, so far, it has been widely assumed that OT acts directly on neurons, despite the controversies regarding the cellular substrates of blood oxygenation level-dependent functional magnetic resonance imag-ing signals often used in human studies, with some results arguing for a major contribution of astrocyte activity to these signals40,41. Furthermore, many studies demonstrated that astrocytes or their invertebrate counterparts are key, if not primary, targets of neuro-modulators20–22,33,34,42 and that astrocytes might be the causal ele-ments behind shifts in brain state transitions42–44, a function usually attributed mainly to neuromodulator direct action on neurons. Neuromodulators are the targets of many, already available, treat-ments of psychiatric diseases using either small-molecule drugs or electrical stimulation protocols, such as deep brain45 or tran-scranial stimulations46, for which astrocytes also seem particularly involved45,46. Taken together, this indicates a need for a more global and systematic consideration of astrocyte roles in brain circuits, notably regarding the effect of neuromodulators and, in particular, OT. We think that this is especially relevant for the development of better therapeutics in the field of chronic pain, which imposes a massive burden to society, affecting ~20% of the global population47.
Indeed, considering that general anxiety and depression are fre-quent comorbidities of chronic pain48, our finding that the activa-tion of OT signaling in CeL astrocytes promotes a form of emotional comfort by alleviating anxious behavior and has positive reinforce-ment properties is promising: it demonstrates that activation of a particular astrocyte-mediated OTR pathway affects one of the most important aspects of the chronic pain sphere—the emotional one. This further highlights astrocytes as important cellular substrates of emotional regulation, in line with other studies (see ref. 49 and the references therein). In this context, targeting the OT system and/or astrocytes specifically, in the amygdala or other CNS regions, might lead to the development of new therapeutic avenues to improve patient well-being.
online contentAny methods, additional references, Nature Research report-ing summaries, source data, extended data, supplementary infor-mation, acknowledgements, peer review information; details of author contributions and competing interests; and statements of data and code availability are available at https://doi.org/10.1038/s41593-021-00800-0.
Received: 28 January 2020; Accepted: 13 January 2021; Published online: 15 February 2021
References 1. Lee, H.-J., Macbeth, A. H., Pagani, J. H. & Young, W. S. Oxytocin: the great
facilitator of life. Prog. Neurobiol. 88, 127–151 (2009). 2. Knobloch, H. S. et al. Evoked axonal oxytocin release in the central amygdala
attenuates fear response. Neuron 73, 553–566 (2012). 3. Chini, B., Verhage, M. & Grinevich, V. The action radius of oxytocin release
in the mammalian CNS: from single vesicles to behavior. Trends Pharmacol. Sci. 38, 982–991 (2017).
4. Mitre, M. et al. A distributed network for social cognition enriched for oxytocin receptors. J. Neurosci. 36, 2517–2535 (2016).
5. Yoshida, M. et al. Evidence that oxytocin exerts anxiolytic effects via oxytocin receptor expressed in serotonergic neurons in mice. J. Neurosci. 29, 2259–2271 (2009).
6. Theodosis, D. T. Oxytocin-secreting neurons: a physiological model of morphological neuronal and glial plasticity in the adult hypothalamus. Front. Neuroendocrinol. 23, 101–135 (2002).
7. Pacholko, A. G., Wotton, C. A. & Bekar, L. K. Astrocytes—the ultimate effectors of long-range neuromodulatory networks? Front. Cell. Neurosci. 14, 1–12 (2020).
8. Huber, D., Veinante, P. & Stoop, R. Vasopressin and oxytocin excite distinct neuronal populations in the central amygdala. Science 308, 245–248 (2005).
9. Viviani, D. et al. Oxytocin selectively gates fear responses through distinct outputs from the central amygdala. Science 333, 104–107 (2011).
10. Han, R. T. et al. Long-term isolation elicits depression and anxiety-related behaviors by reducing oxytocin-induced GABAergic transmission in central amygdala. Front. Mol. Neurosci. 11, 246 (2018).
11. Neugebauer, V., Li, W., Bird, G. C. & Han, J. S. The amygdala and persistent pain. Neuroscientist 10, 221–234 (2004).
12. Tye, K. M. et al. Amygdala circuitry mediating reversible and bidirectional control of anxiety. Nature 471, 358–362 (2011).
13. Ji, R.-R., Donnelly, C. R. & Nedergaard, M. Astrocytes in chronic pain and itch. Nat. Rev. Neurosci. 20, 667–685 (2019).
14. Poisbeau, P., Grinevich, V. & Charlet, A. Oxytocin signaling in pain: cellular, circuit, system, and behavioral levels. Curr. Top. Behav. Neurosci. 35, 193–211 (2018).
15. Martin-Fernandez, M. et al. Synapse-specific astrocyte gating of amygdala-related behavior. Nat. Neurosci. 20, 1540–1548 (2017).
16. Althammer, F. et al. Three-dimensional morphometric analysis reveals time-dependent structural changes in microglia and astrocytes in the central amygdala and hypothalamic paraventricular nucleus of heart failure rats. J. Neuroinflammation 17, 221 (2020).
17. Yizhar, O. et al. Neocortical excitation/inhibition balance in information processing and social dysfunction. Nature 477, 171–178 (2011).
18. Lee, H. J., Caldwell, H. K., Macbeth, A. H., Tolu, S. G. & Young, W. S. A conditional knockout mouse line of the oxytocin receptor. Endocrinology 149, 3256–3263 (2008).
19. Wallraff, A. et al. The impact of astrocytic gap junctional coupling on potassium buffering in the hippocampus. J. Neurosci. 26, 5438–5447 (2006).
20. Papouin, T., Dunphy, J. M., Tolman, M., Dineley, K. T. & Haydon, P. G. Septal cholinergic neuromodulation tunes the astrocyte-dependent gating of hippocampal NMDA receptors to wakefulness. Neuron 94, 840–854 (2017).
21. Robin, L. M. et al. Astroglial CB1 receptors determine synaptic D-serine availability to enable recognition memory. Neuron 98, 935–944 (2018).
22. Corkrum, M., Rothwell, P. E., Thomas, M. J., Kofuji, P. & Araque, A. Opioid-mediated astrocyte-neuron signaling in the nucleus accumbens. Cells 8, 586 (2019).
23. Li, Y. et al. Identity of endogenous NMDAR glycine site agonist in amygdala is determined by synaptic activity level. Nat. Commun. 4, 1760 (2013).
24. Decosterd, I. & Woolf, C. J. Spared nerve injury: an animal model of persistent peripheral neuropathic pain. Pain 87, 149–158 (2000).
25. Thompson, J. M. & Neugebauer, V. Amygdala plasticity and pain. Pain Res. Manag. 2017, 8296501 (2017).
26. Sieberg, C. B. et al. Neuropathic pain drives anxiety behavior in mice, results consistent with anxiety levels in diabetic neuropathy patients. Pain Rep. 3, e651 (2018).
27. László, K. et al. Positive reinforcing effect of oxytocin microinjection in the rat central nucleus of amygdala. Behav. Brain Res. 296, 279–285 (2016).
28. Goodin, B. R., Ness, T. J. & Robbins, M. T. Oxytocin - a multifunctional analgesic for chronic deep tissue pain. Curr. Pharm. Des. 21, 906–913 (2015).
29. Gravati, M. et al. Dual modulation of inward rectifier potassium currents in olfactory neuronal cells by promiscuous G protein coupling of the oxytocin receptor. J. Neurochem. 114, 1424–1435 (2010).
30. Breton, J.-D. et al. Oxytocin-induced antinociception in the spinal cord is mediated by a subpopulation of glutamatergic neurons in lamina I–II which amplify GABAergic inhibition. Mol. Pain 4, 19 (2008).
31. Angulo, M. C., Kozlov, A. S., Charpak, S. & Audinat, E. Glutamate released from glial cells synchronizes neuronal activity in the hippocampus. J. Neurosci. 24, 6920–6927 (2004).
32. Fellin, T. et al. Neuronal synchrony mediated by astrocytic glutamate through activation of extrasynaptic NMDA receptors. Neuron 43, 729–743 (2004).
33. Corkrum, M. et al. Dopamine-evoked synaptic regulation in the nucleus accumbens requires astrocyte activity. Neuron 105, 1036–1047.e5 (2020).
34. Ma, Z., Stork, T., Bergles, D. E. & Freeman, M. R. Neuromodulators signal through astrocytes to alter neural circuit activity and behaviour. Nature 539, 428–432 (2016).
35. Pestana, F., Edwards-Faret, G., Belgard, T. G., Martirosyan, A. & Holt, M. G. No longer underappreciated: the emerging concept of astrocyte heterogeneity in neuroscience. Brain Sci. 10, 1–21 (2020).
36. Khakh, B. S. & Deneen, B. The emerging nature of astrocyte diversity. Annu. Rev. Neurosci. 42, 187–207 (2019).
37. Grinevich, V. & Neumann, I. D. Brain oxytocin: how puzzle stones from animal studies translate into psychiatry. Mol. Psychiatry 26, 265–279 (2021).
38. Quintana, D. S. et al. Advances in the field of intranasal oxytocin research: lessons learned and future directions for clinical research. Mol. Psychiatry 26, 80–91 (2021).
NAtuRE NEuRoSCIENCE | VOL 24 | APRIL 2021 | 529–541 | www.nature.com/natureneuroscience540

ArticlesNaTUrE NEUrOScIENcE
39. Kirsch, P. et al. Oxytocin modulates neural circuitry for social cognition and fear in humans. J. Neurosci. 25, 11489–11493 (2005).
40. Takata, N. et al. Optogenetic astrocyte activation evokes BOLD fMRI response with oxygen consumption without neuronal activity modulation. Glia 66, 2013–2023 (2018).
41. Figley, C. R. & Stroman, P. W. The role(s) of astrocytes and astrocyte activity in neurometabolism, neurovascular coupling, and the production of functional neuroimaging signals. Eur. J. Neurosci. 33, 577–588 (2011).
42. Kastanenka, K. V. et al. A roadmap to integrate astrocytes into systems neuroscience. Glia 68, 5–26 (2019).
43. Poskanzer, K. E. & Yuste, R. Astrocytes regulate cortical state switching in vivo. Proc. Natl Acad. Sci. USA 2016, 1–10 (2016).
44. Kjaerby, C., Rasmussen, R., Andersen, M. & Nedergaard, M. Does global astrocytic calcium signaling participate in awake brain state transitions and neuronal circuit function? Neurochem. Res. 42, 1810–1822 (2017).
45. Fenoy, A. J., Goetz, L., Chabardès, S. & Xia, Y. Deep brain stimulation: are astrocytes a key driver behind the scene? CNS Neurosci. Ther. 20, 191–201 (2014).
46. Monai, H. & Hirase, H. Astrocytes as a target of transcranial direct current stimulation (tDCS) to treat depression. Neurosci. Res. 126, 15–21 (2018).
47. Mills, S. E. E., Nicolson, K. P. & Smith, B. H. Chronic pain: a review of its epidemiology and associated factors in population-based studies. Br. J. Anaesth. 123, e273–e283 (2019).
48. Woo, A. K. Depression and anxiety in pain. Rev. Pain 4, 8–12 (2010). 49. Oliveira, J. F., Sardinha, V. M., Guerra-Gomes, S., Araque, A. & Sousa, N. Do
stars govern our actions? Astrocyte involvement in rodent behavior. Trends Neurosci. 38, 535–549 (2015).
Publisher’s note Springer Nature remains neutral with regard to jurisdictional claims in published maps and institutional affiliations.
© The Author(s), under exclusive licence to Springer Nature America, Inc. 2021
NAtuRE NEuRoSCIENCE | VOL 24 | APRIL 2021 | 529–541 | www.nature.com/natureneuroscience 541

Articles NaTUrE NEUrOScIENcE
MethodsAnimals. Animals were housed under standard conditions with food and water available ad libitum and maintained on a 12-h light/dark cycle, and all experiments were conducted in accordance with European Union rules and approbation from the French Ministry of Research (01597.05). For ex vivo and in vivo experiments, male and female Wistar rats or C5BL/6 mice were used. Ex vivo experiments used animals between 18 and 25 d old, except in experiments where rAAVs were injected, in which case animals were between 2 and 6 months old at the time of sacrifice. In in vivo experiments, animals that were 2 months old at the time of the first surgery were used. In total, 398 rats and mice were used in this study.
Specific deletion of OTRs in CeL astrocytes. To specifically ablate OTRs in CeA astrocytes, transgenic cKO mice, in which loxP sites flank the OTR coding sequence18, received bilateral injections (280 nl) of rAAV-GFAP-GFP-IRES-Cre. After 4 weeks of expression of the viral proteins, mice were intracardially perfused with 1× PBS and 4% paraformaldehyde (PFA). Brain sections were used for FISH (OTR mRNA) and immunohistochemistry (GS) to verify the validity of the approach. Representative images and quantifications are provided in Fig. 2h and Extended Data Fig. 2g,h.
Specific deletion of Cx30 and Cx43 in astrocytes. To specifically impair gap junction coupling, we used Cx30−/−Cx43fl/fl:hGFAP-Cre mice (Cx30/Cx43 double KO), which were previously characterized19,50,51, with conditional deletion of Cx43 in astrocytes52 and additional deletion of Cx30 (ref. 53).
Cloning and production of rAAV vectors. The generation of rAAVs allowing for the specific expression of the protein of interest in OT cells was described in our previous work2. Briefly, the conserved promoter region of 2.6 kb was chosen using the software BLAT from UCSC (http://genome.ucsc.edu/cgi-bin/hgBlat), was amplified from BAC clone RP24-388N9 (RPCI-24 Mouse, BACPAC Resources, CHORI) and was subcloned into an rAAV2 backbone carrying an ampicillin resistance.
To construct the OTp-C1V1(t/t)-TS-mCherry AAV vector, we used previously cloned OTp-DIO-GFP-WRE plasmid2 equipped with the characterized 2.6-kb OT promoter2. In this plasmid, the DIO-GFP sequence was replaced by C1V1 (t/t)-TS-mCherry from the rAAV CaMKIIa-C1V1(t/t)-TS-mCherry (Addgene, plasmid no. 35500).
To generate GFAP-C1V1(t/t)-TS-mCherry AAV vector, we replaced the CamKIIa promoter from the rAAV CaMKIIa-C1V1(t/t)-TS-mCherry by the Gfa promoter from the pZac2.1 gfaABC1D-tdTomato (Addgene, plasmid no. 44332). The cell type specificity of the rAAV carrying the Gfa promoter was confirmed54. In analogy, the generation of the GFAP-GFP-IRES-Cre vector was achieved using pZac2.1 gfaABC1D-tdTomato (Addgene, plasmid no. 44332). First, the promoter was cloned into an rAAV2 backbone, and sticky ends were blunted with EcoR1 and Basrg1. Next, pAAV-CamKIIa-C1V1(t/t)-TS-mCherry was blunted using BamHI and BsrGI. Finally, the pBS-ires cre construct was used, and IRES-Cre was inserted into the GFAP-driven vector, resulting in the GFAP-GFP-IRES-Cre construct.
Production of chimeric virions (rAAV 1 and rAAV2) was described in ref. 2. Briefly, human embryonic kidney cells 293 (HEK293; Agilent no. 240073) were calcium phosphate transfected with the recombinant AAV2 plasmid and a three-helper system. rAAV genomic titers were determined with QuickTiter AAV Quantitation Kit (Cell Biolabs) and are ~1013 genomic copies per ml for all rAAV vectors used in this study.
Surgeries. Neuropathic pain model: SNI procedure. Animals were randomly separated in two groups to undergo either posterior left hindpaw SNI or sham procedure, with the right hindpaw untouched. Animals were anaesthetized using isoflurane at 1.5–2.5%. Incision was made at mid-thigh level using the femur as a landmark, and a section was made through the biceps femoris. The three peripheral branches (sural, common peroneal and tibial nerves) of the sciatic nerve were exposed. Both tibial and common peroneal nerves were ligated using a 5.0 silk suture and transected. The sural nerve was carefully preserved by avoiding any nerve stretch or nerve contact24. For animals undergoing sham surgery, the same procedure was performed, but nerves remained untouched. Animals were routinely observed daily for 7 d after surgery and daily tested by the experimenter (Extended Data Fig. 6a). Besides observing weight and social and individual behavior, the operated hindpaw was examined for signs of injury or autotomy. In case of autotomy or suffering, the animal was euthanized in respect of the ethical recommendations of the European Union. No analgesia was provided after the surgery to avoid interference with chronic pain mechanisms, and this is in accordance with our veterinary authorization. Suffering was minimized by careful handling and increased bedding.
Stereotaxic surgery: injection of rAAV vectors. Stereotaxic surgery was performed under deep ketamine–xylazine anesthesia, using the KOPF (model 955) stereotaxic system. For specific control of rat CeA astroglial cells, 200 nl of rAAV serotype 1/2 (GFAPp-C1V1(t/t)-mCherry, cloned from plasmid nos. 35500 and 44332, Addgene), was injected bilaterally at the coordinates corresponding to CeL: rostro-caudal: −2.7 mm, medio-lateral: 4.2 mm, dorso-ventral: −8.0 mm
(from Paxinos and Watson Atlas). For specific control of OT neurons, 200 nl of rAAV serotype 1/2 (OTp-C1V1(t/t)-mCherry or OTp-ChR2-mCherry) was injected bilaterally at the coordinates corresponding to each hypothalamic OT nuclei. PVN: rostro-caudal: −1.8 mm; medio-lateral: ±0.4 mm; dorso-ventral: −8.0 mm; SON: rostro-caudal: −1.4 mm; medio-lateral: ±1.6 mm; dorso-ventral: −9.0 mm; AN: rostro-caudal: −2 mm; medio-lateral: ±1.2 mm; dorso-ventral: −8.5 mm (from Paxinos and Watson Atlas). For specific deletion of OTR in mice CeL astrocytes, 280 nl of rAAV serotype 1/2 (GFAPp-GFP-IRES-Cre) was injected bilaterally at the coordinates corresponding to CeL: rostro-caudal: −1.4 mm, medio-lateral: ±2.6 mm, dorso-ventral: −4.3 mm (from Paxinos and Watson Atlas) in OTR cKO mice.
Stereotaxic surgery: intra-CeL cannulae. Cannulae implantation. Animals were bilaterally implanted with guide cannulae for direct intra-CeL infusions. As guide cannulae, we used C313G/Spc guide metallic cannulae (Plastics One) cut 5.8 mm below the pedestal. For this purpose, animals were deeply anesthetized with 4% isoflurane, and their heads were fixed in a stereotaxic frame. The skull was exposed, and two holes were drilled according to coordinates that were adapted from brain atlas (rats: 2.3 mm rostro-caudal, 4 mm lateral, 7.5 mm dorso-ventral relative to bregma; mice: 1.4 mm rostro-caudal, 2.6 mm lateral, 4.3 mm dorso-ventral relative to bregma) by comparing the typical bregma–lambda distance with the one measured in the experimental animal. Two screws were fixed to the caudal part of the skull to have an anchor point for the dental cement. Acrylic dental cement was finally used to fix the cannulae, and the skin was sutured. In case of long-lasting experiments (neuropathy-induced anxiety) with a cannula implantation at distance of the behavioral assay (>4 weeks), cannulae were sometimes lost or cloaked, and animals of concern were, therefore, excluded from testing.
Drug infusions. We used bilateral injections of 0.5 μl containing either vehicle (NaCl 0.9%) or OTR agonist TGOT (1 μM) dissolved in NaCl 0.9%. For this procedure, two injectors (cut to fit 5.8-mm guide cannulae protruding 2–2.5 mm beyond the lower end of the cannula in older animals and 1.8 mm in 3–4-week-old rats) were bilaterally lowered into the guide cannula and connected via polythene tubing to two Hamilton syringes that were placed in an infusion pump, and 0.5 μl of liquid was injected in each hemisphere over a 2-min period. After the injection procedure, the injectors were kept in place for an additional minute to allow a complete diffusion of liquid throughout the tissue. Rats were subsequently left in the home cage for 15 min to recover from the stress of the injection and then handled for mechanical pain threshold or anxiety assessment. Animals that received TGOT injections for the first experiment (mechanical sensitivity assessment) were switched to the vehicle-injected groups for the elevated plus maze experiment.
Stereotaxic surgery: intra-CeL optical fiber. Optical fiber implantation. Sham and rAAV-injected animals both underwent a single surgical procedure in which, after vector injection or no injection for sham, optical fibers designed to target the CeL were implanted and firmly maintained on the skull using dental cement. See ‘Cannulae implantation’ for the surgical procedure. Implantable optical fibers were homemade using optical fiber cut at appropriate length (FT200EMT, Thorlabs) and inserted and glued using epoxy-based glue in ferrules (CFLC230-10, Thorlabs).
Horizontal and coronal slices. Slice preparations. In all cases, animals were anaesthetized using ketamine (Imalgene 90 mg kg−1) and xylazine (Rompun, 10 mg kg−1) administered intraperitoneally. Intracardiac perfusion was then performed using one of the following artificial cerebrospinal fluid (aCSF) dissection solutions. For animals between 18 and 25 d old, an ice-cold sucrose-based dissection aCSF was used containing (in mM): sucrose (170), KCl (2.5), NaH2PO4 (1.25), NaHCO3 (15), MgSO4 (10), CaCl2 (0.5), HEPES (20), D-glucose (20), L-ascorbic acid (5), thiourea (2), sodium pyruvate (3), N-acetyl-L-cysteine (5) and kynurenic acid (2). For animals between 2 and 6 months old, an ice-cold NMDG-based aCSF was used containing (in mM): NMDG (93), KCl (2.5), NaH2PO4 (1.25), NaHCO3 (30), MgSO4 (10), CaCl2 (0.5), HEPES (20), D-glucose (25), L-ascorbic acid (5), thiourea (2), sodium pyruvate (3), N-acetyl-L-cysteine (10) and kynurenic acid (2). In both cases, pH was adjusted to 7.4 using either NaOH or HCl, this after bubbling in 95% O2/5% CO2 gas, bubbling which was maintained throughout the duration of use of the various aCSFs. Those aCSF formulae were based on the work in ref. 55. After decapitation, brain was swiftly removed in the same ice-cold dissection aCSFs as for intracardiac perfusion, and 350-µm-thick horizontal slices containing the CeA was obtained using a Leica VT1000S vibratome. For experiments in Extended Data Fig. 2a,b, coronal slices of the same thickness containing the PVN were used. Upon slicing, brain slices were hemisected and placed, for 1 h minimum before any experiments were conducted, in a holding chamber at room temperature containing normal aCSFs. For 2–6-month-old animals, slices were first let for 10 min in 35 °C NMDG aCSF before placing them in the holding chamber at room temperature. Normal aCSF, also used during all ex vivo experiments, is composed of (in mM): NaCl (124), KCl (2.5), NaH2PO4 (1.25), NaHCO3 (26), MgSO4 (2), CaCl2 (2), D-glucose (15), adjusted for pH values of 7.4 with HCL or NaOH and continuously bubbled in 95%
NAtuRE NEuRoSCIENCE | www.nature.com/natureneuroscience

ArticlesNaTUrE NEUrOScIENcE
O2/5% CO2 gas. All aCSFs were checked for osmolality and kept for values between 305 and 310 mOsm L−1. In electrophysiology or calcium imaging experiments, slices were transferred from the holding chamber to an immersion recording chamber and superfused at a rate of 2 ml min−1 with normal aCSFs, unless indicated otherwise.
Drug application. OTR agonists were bath applied through a 20-s-long pumping of agonist solution, corresponding to several times the volume of the recording chamber. Other drugs (antagonists and TTX) were applied for at least 20 min in the bath before performing any experiments. BAPTA (or BAPTA-free solution for controls) loading of CeL astrocytes was realized following56 protocol. Two distant CeL astrocytes per slice (label with SR101, 1 µM) were patched in whole-cell configuration, and voltage steps were applied (2 Hz, ∆40 mV) to help loading the BAPTA contained in the patch pipette (in mM): MgCl2 (1), NaCl (8), ATP Na2 (2) GTP Na2 (0.4) HEPES (10) and BAPTA (40), and osmolality was checked to be between 275 and 285 mOsm L−1. The whole-cell configuration was maintained during 45 min to allow BAPTA diffusion into the astrocyte network57.
Calcium imaging and identification of astrocytes. To identify astrocytes, SR101 (1 μM) was added to aCSF in a culture well, and slices were incubated for 20 min at 35 °C. The specificity of SR101 labeling to astrocytes of the CeL was verified through patch-clamp experiments, the results of which can be found in Extended Data Fig. 2c,d. The synthetic calcium indicator OGB1 or Rhod-2 was bulk loaded following an adapted version of the method described previously58, reaching final concentrations of 0.0025% (~20 μM) for calcium indicators, 0.002% for Cremophor EL, 0.01% for Pluronic F-127 and 0.5% for DMSO in aCSF and incubated for 45–60 min at 38 °C. Upon incubation time, slices were washed in aCSF for at least 1 h before any recording was performed. Astrocytes recorded for this study were those co-labeled in rats for SR101 and OGB1 and in mice for GFP and Rhod2. The spinning disk confocal microscope used to perform astrocyte calcium imaging was composed of a Zeiss Axio examiner microscope with a ×40 water immersion objective (numerical aperture of 1.0), mounted with a X-Light Confocal Unit–CRESTOPT spinning disk. Images were acquired at 2 Hz with either a Rolera em-c² emCCD or an optiMOS sCMOS camera (Qimaging). Cells within a confocal plane were illuminated for 100–150 ms for each wavelength (SR101 and Rhod-2: 575 nm, OGB1 and GFP: 475 nm) using a Spectra 7 LUMENCOR. The different hardware elements were synchronized through the MetaFluor 7.8.8.0 software (Molecular Devices). Astrocytic calcium levels were measured in hand-drawn regions of interest (ROIs) comprising the cell body plus, when visible, proximal processes. In all recordings, the Fiji rolling ball algorithm was used to increase the signal-to-noise ratio. Further offline data analysis was performed using a custom-written Python-based script available on editorial website. Intracellular calcium variation was estimated as changes in fluorescence signals. To take into account micro-movements of the specimen on long-duration recordings, the fluorescence values were also calculated for SR101 (or GFP) and subsequently subtracted to the ones of OGB1 (or Rhod2), except in the case of Fig. 2a–d, where astrocytes were identified through SR101 fluorescence after the recordings, to avoid unwanted stimulation of the C1V1 opsin. On this last case, recordings in which movements and drifts were visible were discarded. Then, a linear regression and a median filter were applied to each trace. Calcium transients were detected using the find_peaks function of the SciPy library. More precisely, fluorescence variation was identified as a calcium peak if its prominence exceeds the s.d. (or two times the s.d. for recordings acquired with the sCMOS camera) and if the maximum peak value surpasses 50 fluorescence units (or 3 units for sCMOS recordings). ROIs with zero calcium variations were excluded from the analysis. The remaining ROIs were considered as living astrocytes, and the number of peaks was quantified before and after the drug application. All data were normalized according to the duration of the recording, and astrocytes were labeled as ‘responsive’ when their AUC or their calcium transient frequency was increased by at least 20% after drug application. Because the time after stimulation is longer than the baseline (10 min versus 5 min), the probability of observing a spontaneous calcium peak is stronger after stimulation. To avoid this bias, astrocytes with only one calcium peak during the whole recording were not considered as responsive. Finally, all data were averaged across astrocytes per slice, and this result was used as the statistical unit. All data were expressed as ratio (baseline/drug effect)—a ratio of 1 meaning neither an increase nor a decrease of the measured parameter. For inter-ratio comparison, parametric or non-parametric (depending on data distribution) unpaired statistical tests were used. Fiji software was also used on SR101/OGB1 pictures to produce illustrative pictures. All calcium imaging experiments were conducted at controlled room temperature (26 °C), and cells with an unstable baseline were discarded.
Electrophysiology. Whole-cell patch-clamp recordings of CeL neurons, CeL astrocytes and CeM neurons were visually guided by infrared oblique light visualization of neurons and completed by SR101 fluorescence observation for astrocytes. Patch-clamp recordings were obtained with an Axon MultiClamp 700B Amplifier coupled to a Digidata 1440A Digitizer (Molecular Devices). Borosilicate glass electrodes (R = 3.5–7 MΩ) with inner filament (OD 1.5 mm, ID 0.86 mm; Sutter Instrument) were pulled using a horizontal flaming/brown micropipette puller (P97; Sutter Instrument). Recordings were filtered at 2 kHz, digitized at 40 kHz and stored with the pClamp 10 software suite (Molecular Devices). Analysis
of patch-clamp data was performed using Clampfit 10.7 (Molecular Devices) and Mini Analysis 6 software (Synaptosoft) in a semi-automated fashion (automatic detection of events with chosen parameters followed by a visual validation). Cells with an unstable baseline were discarded.
Whole-cell recording of CeL neurons. Recording pipettes were filled with an intracellular solution containing (in mM): KMeSO4 (125), CaCL2 (2), EGTA (1), HEPES (10), ATP Na2 (2) and GTP Na2 (0.3). The pH was adjusted to 7.3 with KOH, and osmolality was checked to be between 290 and 295 mOsm L−1, adjusted with sucrose if needed. For mEPSC recordings, neurons were recorded in voltage-clamp configuration and held at a membrane potential of −65 mV. For AP recordings, neurons were recorded in current-clamp configuration and held at I = 0. Series capacitances and resistances were compensated electronically throughout the experiments using the main amplifier. For mEPSC measurements in CeL neurons (Fig. 4), whole-cell recordings were conducted in an Mg2+-free aCSF, also containing biccuculin (10 µM) and TTX (1 µM) as in ref. 59. Average event frequencies per cell were calculated on 20-s windows, chosen for TGOT or photostimulation during maximal effect, as determined by the visually identified maximal slope of the cumulative plot of the number of events. CeL neurons were classified as TGOT responsive when the average event frequency was increased by at least 20% during 20 s after TGOT application when compared to baseline average frequency. Baseline and recovery frequencies were measured, respectively, at the beginning and end of each recording. All patch-clamp experiments were conducted at room temperature.
Biocytin filling of CeL astrocytes. In the lateral part of the CeA slices visualized with infrared differential contrast optics, astrocytes were identified by their morphological appearance revealed by SR101 and the absence of APs in response to depolarizing current injections. Cells were patched with pipettes filled with (in mM) 110 K-gluconate, 30 KCl, 4 ATP Na2, 10 phosphocreatine, 0.3 GTP Na2, 10 HEPES and 5 biocytin (pH 7.3; 310 mOsm). After obtaining whole-cell configuration, astrocytes were held at −80 mV, and typical filling time was 45 min. Then, the pipettes were carefully retracted, and slices were incubated for additional 20 min in the oxygenated aCSF before fixation. Only one cell was filled per slice. Slices with filled cells were immersion fixed at 4 °C for 5 d in 4% PFA-PBS solution. Next, the slices were flat embedded in 6% agar-PBS, and areas of interest were cut out of and re-embedded onto the agar block and vibratome cut into 80-µm-thick free-floating sections. Then, the sections were incubated with avidin conjugated to Alexa Fluor 488 (1:1,000) (Thermo Fisher Scientific) in 1% Triton-PBS at 4 °C, washed in PBS, mounted and cover slipped. The tissue was analyzed, and images were taken with a Leica TCS SP5 confocal microscope.
Whole-cell recording of CeM neurons. Pipettes were filled with an intracellular solution containing (in mM): KCl (150), HEPES (10), MgCl2 (4), CaCl2 (0.1), BAPTA (0.1), ATP Na2 (2) and GTP Na2 (0.3). pH was adjusted to 7.3 with KOH, and osmolality was checked to be between 290 and 295 mOsm L−1, adjusted with sucrose if needed. All cells were held at a membrane potential of −70 mV. Series capacitances and resistances were compensated electronically throughout the experiments using the main amplifier. Average event frequencies per cell were calculated on 20-s windows, chosen for TGOT or photostimulation during maximal effect, as determined by the visually identified maximal slope of the cumulative plot of the number of events. CeM neurons were classified as TGOT responsive when the average IPSC frequency was increased by at least 20% during 20 s after TGOT application when compared to baseline average frequency. Baseline and recovery frequencies were measured, respectively, at the beginning and end of each recording. All patch-clamp experiments were conducted at room temperature.
Immunohistochemistry and in situ hybridization. In situ hybridization for OTR mRNA in rat CeL. The probe for OTR mRNA was in vitro transcripted from a 902-bp fragment containing 133–1,034 bases of the rat OTR complementary DNA (cDNA) (NCBI Reference Sequence: NM_012871.3) subcloned into pSP73 Vector (Promega). The digoxigenin (DIG)-labeled anti-sense and sense RNA probe from the linearized oxtr cDNA template was synthesized using DIG RNA Labeling Kit (SP6/T7) (Roche Diagnostics). Sections containing two consecutive sections of the CeL (corresponding to bregma: 2.5) were processed for FISH. Rats were transcardially perfused with PBS, followed by 4% PFA. Brains were dissected out and post-fixed overnight in 4% PFA at 4 °C with gentle agitation. Then, 50-µm vibratome sections were cut, collected and fixed in 4% PFA at 4 °C overnight. The free-floating sections were washed in RNase-free PBS, immersed in 0.75% glycine in PBS, treated with 0.5 μg ml−1 of proteinase K for 30 min at 37 °C, acetylated with 0.25% acetic anhydride in 0.1 M triethanolamine and then hybridized with DIG-labeled RNA probe overnight at 65 °C. After RNase treatment and after intensive wash, the hybridized DIG-labeled probe was detected by incubation with Anti-Digoxigenin-POD (1:200, 11207733910, Roche Diagnostics) for 3 d at 4 °C. Signals were developed with the tyramid signal amplification method. Rhodamine-conjugated tyramide was synthesized by coupling NHS-Rhodamine (Pierce Biotechnology, Thermo Fisher Scientific) to Tyramine HCl (Sigma-Aldrich) in dimethylformamide with triethylamine. For the quantification of OTR
NAtuRE NEuRoSCIENCE | www.nature.com/natureneuroscience

Articles NaTUrE NEUrOScIENcE
mRNA-positive astrocytes, all confocal images were obtained using the same laser intensities and processed with the same brightness/contrast settings in Adobe Photoshop. Because the in situ signal for the OTR mRNA in astrocytes was weak, we first calculated the average intensity (signal intensity of all pixels divided by the total number of pixels) of the rhodamine-stained OTR mRNA signal for each individual section containing the CeL. Next, we calculated the s.d. for each individual confocal image based on the intensity of all pixels comprising the image. We defined the threshold for OTR mRNA-positive astrocytes: if more than 1/4 of all pixels comprising an astrocyte soma displayed a signal intensity exceeding the average background intensity by more than four times the s.d., the astrocytes were considered OTR mRNA positive.
Astrocyte markers. The aldehyde dehydrogenase 1 antibody is a commonly used marker for glial cells, including astrocytes. Therefore, we used the ALDH1L1 for immunohistochemistry in our initial experimental studies (Extended Data Figs. 1c and 4a). However, owing to inconsistencies in staining quality as a result of batch-dependent antibody properties, especially in combination with the OTR mRNA FISH, we decided to employ GS (Fig. 1). GS is a commonly used glial marker60 that stains astrocyte cell bodies, faint processes and even astrocytes not expressing GFAP. Using GS, we achieved consistent results in combination with our OTR mRNA FISH.
GS and ALDH1L1 co-localization with OTR mRNA in rat CeL. After development and washing steps, the sections were stained with antibodies against GS (mouse monoclonal, 1:500, ref: MAB302, Merck Milipore) and ALDH1L1 (rabbit polyclonal, 1:500, ref: ab87117, Abcam) in PBS and kept at 4 °C on a shaker in a dark room overnight. After intensive washing with PBS, sections were stained with the respective secondary antibodies, Alexa Fluor488 (goat anti-mouse, 1:1,000, ref: A11001, Life Technologies) and Alexa Fluor 680 (goat anti-mouse, 1:1,000, ref: A27042, Thermo Fisher Scientific) for 2 h at room temperature. After intensive washing with PBS, sections were mounted using Mowiol.
Double in situ hybridizations for OTR mRNA and GFAP mRNA in mice CeL. FISH in Extended Data Fig. 1d was performed on 25-μm cryostat-cut coronal sections prepared from fresh-frozen mouse brain (male C57BL/6J, P22). After extraction, brains were immediately frozen in Tissue-Tek O.C.T. compound and stored at −80 °C. FISH was performed according to the manufacturer’s instructions (Advanced Cell Diagnostics) for Fresh Frozen RNAscope Multiplex Fluorescent Assay. Treatment of amygdala-containing sections were adjusted with the three-plex negative control, and then co-expression of OTR and GS was examined using ACD-designed target probes as well as the nuclear stain DAPI. Single-plan images were collected with an upright laser scanning microscope (LSM-710, Carl Zeiss) using a ×40 objective, keeping acquisition parameters constant between control and probe-treated sections.
AAV-GFAP-C1V1(t/t)-mCherry specificity. After 3 weeks of vector expression in the brain, rats were transcardially perfused with 4% PFA solution. Tissue blocks containing CeA were dissected from the fixed brain and vibratome cut into 50-µm-thick free-floating sections. After several rinse steps, sampled sections were blocked with 5% NGS in PBS and incubated for 48 h at 4 °C with polyclonal rabbit anti-ALDH1L1 antibody (1:500, Abcam) in 1% Triton-PBS buffer, containing 0.1% NGS. Appropriate secondary antibody (Alexa Fluor 488-conjugated goat anti-rabbit (1:1,000, Life Technologies) was used for further antigen detection. Intrinsic mCherry fluorescence of vector-expressing cells was strong enough to detect them in the tissue without any additional antibody enhancement. The immunolabeled sections were mounted onto Superfrost slides, cover slipped with Mowiol, analyzed and documented using a Leica SP5 confocal microscope.
3D assessment of astrocyte complexity and interaction analysis using Imaris. For the 3D reconstruction of astrocytes, we took Z-stack images (50-µm depth, 1-µm steps, ×40 magnification) of CeL using a Zeiss LSM 780 confocal microscope (1,024 × 1,024 pixels, 16-bit depth, pixel size 0.63 microns, zoom 0.7). Raw CZI files were used for further analysis using Imaris software (version 9.31, Oxford Instruments). First, Imaris was used to reconstruct the astrocyte surface using the following custom settings: surfaces Detail 0.700 µm (smooth); thresholding Background subtraction (Local Contrast), diameter of largest Sphere, which fits into the object: 2.00; Color: base, diffusion transparency: 65%. After surface reconstruction, we used the filter function to remove unspecific background signals: Filter: Volume max – 400 µm3. It is important to note that these settings have to be adjusted for every new batch/immunohistochemistry staining to guarantee a reliable reconstruction. All astrocytes with incomplete somata (cut by the x, y or z plane) were manually removed and not included in further analysis. Fused astrocytes that were falsely recognized as one entity by the software were manually separated using the cut function or entirely removed from the sample if a separation was not feasible. The ‘filter/area function’ was used to remove small astrocytic segments that occurred during manual deletion. After deletion of all background signals, the ‘mask all’ function was used to create the final surface reconstruction. Next, the surface reconstruction was used as the template for the filament reconstruction using the following custom settings: detect new starting
points: largest Diameter 7.00 µm, seed points 0.300 µm; remove seed points around starting points: diameter of sphere regions: 15 µm. Seed points were corrected for (either placed in or removed from the center of the somata) manually if the Imaris algorithm placed them incorrectly. All surface and filament parameters were exported into separate Excel files and used for data analysis. All images used for analysis were taken with the same confocal settings (pinhole, laser intensity, digital gain and digital offset). Sholl analysis was performed using Imaris in the filament reconstruction mode, and individual datasets were exported into separate Excel files for further analysis (each individual sphere) per individual astrocyte. For the nearest neighbor and interaction analysis, we used the ‘Native Distance Measurements’ function as depicted in this video: https://imaris.oxinst.com/learning/view/article/imaris-9-5-native-distance-measurements. In brief, we reconstructed astrocytic surfaces based on the GFAP fluorescence and OTR mRNA signal. Next, we manually labeled OTR+ and OTR− astrocytes and performed the native distance measurement, allowing us to assess the shortest distance between GFAP-positive processes of different astrocytes. We defined ‘astrocytic interaction’ when GFAP-positive processes of two different astrocytes were no further than 1 µm apart. It is important to note that this method does not allow the discrimination of different astrocytic entities so that several close contacts (contacts being defined as a distance of less than 1 µm between GFAP-positive processes or endfeets from two different astrocytes) originating from the same astrocyte result in a higher number of total interactions. For the nearest neighbor analysis, we calculated the distance from the center of the soma to the nearest astrocyte neighbor using GS fluorescence and an artificially created sphere that was placed within the soma and measured the distance accordingly. Distribution plots and correlations, as well as all statistics, were performed using GraphPad Prism version 8.0.0 (GraphPad Software).
Optogenetics. Ex vivo. We opted for a ChR1/VChR1 chimera channel rhodopsin displaying a red-shifted absorption spectrum, referred to here as C1V1 (ref. 17). This choice was made over a classical channelrhodopsin-2 to avoid unwanted stimulation of OT axons while imaging our 488-nm light-sensitive calcium indicator (OGB1). Optogenetic green light stimulation of C1V1 in ex vivo experiments was performed using either the Spectra 7 LUMENCOR (λ542 nm) or light source X-Cite 110LED from Excelitas Technologies through a Cy3 filter, controlled via MetaFluor or Clampex-driven TTL pulses, respectively.
In vivo. Animals were habituated to the fixation of an optical fiber on the ferrule without light stimulation for 1 week before the experiment. In all cases, optical fibers were attached to the ferrules using an adapter (ADAF2, Thorlabs), and animals were let free to move in a typical home cage for the duration of the stimulation. Implanted optical fibers were connected to two lasers (LRS-0532-GFM-00100-03 LaserGlow 532-nm DPSS Laser System), and the output power was adjusted to correspond to 20–30 mW measured at the tip of 200-µm diameter fibers similar to the one implanted. Stimulation of 500-ms duration at a frequency of 0.5 Hz was given for 3 min.
Behavior. Mechanical sensitivity assessment. In experiments with rats, we used a calibrated forceps (Bioseb) previously developed in our laboratory to test the animal mechanical sensitivity61. Briefly, the habituated rat was loosely restrained with a towel masking the eyes to limit stress by environmental stimulations. The tips of the forceps were placed at each side of the paw and a graduate force applied. The pressure producing a withdrawal of the paw or, in some rare cases, vocalization was considered as the nociceptive threshold value. This manipulation was performed three times for each hindpaw, and the values were averaged as being the final nociceptive threshold value. In experiments with mice, we used von Frey filament tests. Mechanical allodynia (a symptom of neuropathic pain) was tested using von Frey hairs, and results were expressed in grams. Tests were performed during the morning starting at least 2 h after lights on. Mice were placed in clear Plexiglas boxes (7 cm × 9 cm × 7 cm) on an elevated mesh floor. Calibrated von Frey filaments (Bioseb) were applied to the plantar surface of each hindpaw until they just bent in a series of ascending forces up to the mechanical threshold. Filaments were tested five times per paw, and the paw withdrawal threshold was defined as the lower of two consecutive filaments for which three or more withdrawals out of the five trials were observed. Animals with cannulae/optic fiber issues were removed from the analysis.
Elevated plus maze. Following protocol from ref. 62, the arena is composed of four arms, two open (without walls) and two closed (with walls; rats 30 cm high; mice 15 cm high). Arms are 10 cm wide, 50 cm long and elevated 50 cm off the ground for rats and 5 cm wide, 30 cm long and elevated 40 cm off the ground for mice. Two lamps with intensity adjustable up to 50 W were positioned on the top of the maze, uniformly illuminating it. Animals were video tracked using a video-tracking system (Ethovision Pro 3.16, Noldus, and Anymaze, Stoelting). After each trial, the maze was cleaned with 70% ethanol and dried with a paper towel. Twenty minutes after intracerebral injections or directly after optical stimulation, the animal was let free at the center of the plus maze, facing the open arm opposite to where the experimenter is, and was able to freely explore the entire apparatus for 6 min. Total time and time spent in closed and open arms were recorded in seconds, and the percentage of time spent in closed arms was calculated as a measure of anxiety-like
NAtuRE NEuRoSCIENCE | www.nature.com/natureneuroscience

ArticlesNaTUrE NEUrOScIENcE
behavior. As internal control, the total distance travelled during the test period was quantified and compared among all different groups (Extended Data Fig. 7). Animals falling from the apparatus during the test, freezing more than 50% of the total time or with cannulae/optic fiber issues were removed from the analysis.
CPP. The device is composed of two opaque conditioning boxes (rats: 30 × 32 cm; mice: 22 × 22 cm) and one clear neutral box (30 × 20 cm) Animals were video tracked using a video-tracking system (Anymaze, Stoelting). After each trial, the device was cleaned with a disinfectant (Surfa’Safe, Anios Laboratory). Based on ref. 63, all animals underwent a 3-d habituation period during which they were able to freely explore the entire apparatus for 30 min. On day 3, behavior was recorded for 15 min to verify the absence of pre-conditioning chamber preference. The time spent in the different compartments was measured, and the paired compartment was chosen as the compartment in which rat spent less time during the third day of habituation. On day 4, animals were placed in the morning in one compartment for 15 min with no stimulation (unpaired box). Four hours later, the animals were placed for 15 min in the opposite box (paired box), and CeL astrocyte-expressing C1V1 vector was optogenetically stimulated (3 min–1 s light pulse at 0.5 Hz–λ542 nm) or TGOT micro-infused through intracerebral cannulae. On day 5, the animals were placed in the CPP box and allowed to freely explore the entire apparatus for 15 min. As internal control, the total distance travelled during the test period was quantified and compared among all different groups (Extended Data Fig. 7). Animals spending more than 80% of the total time in a single chamber before the conditioning, or with cannulae/optic fiber issues, were removed from the analysis.
Quantification and statistical analysis. Randomization and blinding. Randomization was used to assign cells and animals to experimental groups. All measurements were made using a machine and are not subject to operator bias. Data collection and analysis were not performed blinded to the conditions of the experiments.
Statistical analysis. No statistical methods were used to pre-determine sample sizes, but our sample sizes are similar to those reported in previous publications. All parametrical statistical tests presented in figure captions or the manuscript were performed following correct verification of the assumptions on the distribution of data, and, if not, non-parametric tests were used. Tests were performed using either GraphPad Prism software (version 8.0.0 for Windows) or the SciPy Python-based library64. All values, group compositions and statistical tests for each experiment and figure panel are detailed in Supplementary Tables 1–7.
Technical limitations. We acknowledge several technical limitations in our study, which are discussed in detail below.
mRNA detection. It is surprising to find that the loss of OTR expression in astrocytes results in a loss of function of OTR signaling in the CeA–CeM projection, especially considering the high proportion of OTR+ neurons (up to 70%) compared to the lower fraction of OTR+ astrocytes (18%) in the CeL. One methodological limitation here is that we remained limited to measuring mRNA levels through FISH and could not measure OTR expression at the protein level, notably due to the poor availability of reliable OTR antibodies. It is also possible that a comparison between the OTR mRNA content of astrocytes and neurons is biased; indeed, astrocytes have a lower total mRNA content than neurons, as publicly available databases of single-cell RNA sequencing indicate65,66. Interestingly, a similar discrepancy exists between low receptor levels observed in astrocytes compared to neurons, and, yet, a crucial functional relevance of the receptors of astrocytes in neuromodulation is also observed for another GPCR: the CB1 receptor (ref. 67 and references therein).
C1V1 red-shifted opsin to activate astrocytes. It has been recently demonstrated that the activation of such depolarizing channel rhodopsins in astrocytes or neurons can lead to a significant leak of potassium ions in the extracellular space, resulting in increased neuronal excitability68. However, we provide results in which we buffered the astrocytes’ intracellular calcium using BAPTA infusion before activating astrocytic C1V1 and found that it abolished its effects on CeA neurons (Figs. 4–6). Furthermore, we demonstrate that the AstrOpto effect on CeA neuronal circuit is dependent on NMDARs (Extended Data Fig. 5a). This indicates that the consequences of astrocytic C1V1 activation are dependent on the evoked astrocyte calcium signaling rather than on potassium leakage.
Bulk loading of organic calcium indicator dyes. It should also be noted that we used bulk loading of organic calcium indicator dyes. This means that we could not precisely measure cytosolic calcium changes in fine astrocyte processes69, which might have revealed more complex activities of astrocytes. We note that it has been proven that endogenous or exogenous (designer receptor exclusively activated by designer drug (DREADD) receptors) GPCR signaling in astrocytes produces a global increase in calcium in both the cell body and processes (ref. 67 and references therein).
Reporting Summary. Further information on research design is available in the Nature Research Reporting Summary linked to this article.
Data and code availabilityPython code (used for ex vivo calcium imaging data analysis) can be found in Supplementary Software. All data that support the findings of this study are available from the corresponding authors upon reasonable request.
References 50. Rouach, N., Koulakoff, A., Abudara, V., Willecke, K. & Giaume, C. Astroglial
metabolic networks sustain hippocampal synaptic transmission. Science 322, 1551–1555 (2008).
51. Pannasch, U. et al. Astroglial networks scale synaptic activity and plasticity. Proc. Natl Acad. Sci. USA 108, 8467–8472 (2011).
52. Theis, M. et al. Accelerated hippocampal spreading depression and enhanced locomotory activity in mice with astrocyte-directed inactivation of connexin43. J. Neurosci. 23, 766–776 (2003).
53. Teubner, B. et al. Connexin30 (Gjb6)-deficiency causes severe hearing impairment and lack of endocochlear potential. Hum. Mol. Genet. 12, 13–21 (2003).
54. Shigetomi, E. et al. Imaging calcium microdomains within entire astrocyte territories and endfeet with GCaMPs expressed using adeno-associated viruses. J. Gen. Physiol. 141, 633–647 (2013).
55. Ting, J. T. et al. Preparation of acute brain slices using an optimized N-methyl- D-glucamine protective recovery method. J. Vis. Exp. (132), 53825 (2018).
56. Serrano, A., Haddjeri, N., Lacaille, J., Robitaille, R. & Centre-ville, S. GABAergic network activation of glial cells underlies hippocampal heterosynaptic depression. J. Neurosci. 26, 5370–5382 (2006).
57. Jourdain, P. et al. Glutamate exocytosis from astrocytes controls synaptic strength. Nat. Neurosci. 10, 331–339 (2007).
58. Ikegaya, Y., Le Bon-Jego, M. & Yuste, R. Large-scale imaging of cortical network activity with calcium indicators. Neurosci. Res. 52, 132–138 (2005).
59. Shigetomi, E., Bowser, D. N., Sofroniew, M. V. & Khakh, B. S. Two forms of astrocyte calcium excitability have distinct effects on NMDA receptor-mediated slow inward currents in pyramidal neurons. J. Neurosci. 28, 6659–6663 (2008).
60. Anlauf, E. & Derouiche, A. Glutamine synthetase as an astrocytic marker: its cell type and vesicle localization. Front. Endocrinol. 4, 144 (2013).
61. Luis-Delgado, O. E. et al. Calibrated forceps: a sensitive and reliable tool for pain and analgesia studies. J. Pain 7, 32–39 (2006).
62. Walf, A. A. & Frye, C. A. The use of the elevated plus maze as an assay of anxiety-related behavior in rodents. Nat. Protoc. 2, 322–328 (2007).
63. King, T. et al. Unmasking the tonic-aversive state in neuropathic pain. Nat. Neurosci. 12, 1364–1366 (2009).
64. Virtanen, P. et al. SciPy 1.0: fundamental algorithms for scientific computing in Python. Nat. Methods 17, 261–272 (2020).
65. Zeisel, A. et al. Cell types in the mouse cortex and hippocampus revealed by single-cell RNA-seq. Science 347, 1138–1142 (2015).
66. Batiuk, M. Y. et al. Identification of region-specific astrocyte subtypes at single cell resolution. Nat. Commun. 11, 1220 (2020).
67. Kofuji, P. & Araque, A. G-protein-coupled receptors in astrocyte–neuron communication. Neuroscience https://doi.org/10.1016/j.neuroscience.2020.03.025 (2020).
68. Octeau, J. C. et al. Transient, consequential increases in extracellular potassium ions accompany channelrhodopsin2 excitation. Cell Rep. 27, 2249–2261 (2019).
69. Reeves, A. M. B., Shigetomi, E. & Khakh, B. S. Bulk loading of calcium indicator dyes to study astrocyte physiology: key limitations and improvements using morphological maps. J. Neurosci. 31, 9353–9358 (2011).
AcknowledgementsThis work was supported by the Centre National de la Recherche Scientifique contract UPR3212, the Université de Strasbourg contract UPR3212, IASP Early Career Research grant 2012, FP7 Career Integration grant 334455, Initiative of Excellence (IDEX) Attractiveness grant 2013, IDEX Interdisciplinary grant 2015, University of Strasbourg Institute for Advanced Study (USIAS) fellowship 2014-15, Foundation Fyssen research grant 2015, NARSAD Young Investigator grant 24821, ANR JCJC grant 19-CE16-0011-0 (to A.C.), ANR-DFG grant GR 3619/701 (to A.C. and V.G.), Alexander von Humboldt fellowship (to D.H.), Seed grant from DFG within the Collaborative Center SFB 1158 and Fyssen Foundation fellowship (to A.L.); DFG grants GR 3619/13-1, GR 3619/15-1 and GR 3619/16-1 (to V.G.); SFB 1158 (to C.P., J.S. and V.G.), SNSF-DFG grant GR 3619/8-1 (to R.S. and V.G.), the Fritz Thyssen Foundation (to V.G.), DFG Postdoctoral Fellowship AL 2466/1-1 (to F.A.), the Alexander von Humboldt Foundation (to D.H.), the Fyssen Foundation and PROCOP grant and SFB1158 seed grant for young scientists (to A.L.), post-doctoral fellowship from the Fund for Scientific Research Flanders (12V7519N) (to J.W.), Russian Science Foundation RSF (17-75-10061) and the subsidy allocated to the Kazan Federal University for the State Assignment, no. 0671-2020-0059 (to A.R.), the intramural research program of the NIMH (ZIAMH002498) (to W.S.Y.), National Institutes of Health grants R01NS094640 and R01HL090948, SFB/TRR 152 and ERC-CoG-772395 (to J.E.S.), the European Research Council (Consolidator Grant no. 683154) and the European Union’s Horizon 2020 Research and Innovation Program
NAtuRE NEuRoSCIENCE | www.nature.com/natureneuroscience
Articles NaTUrE NEUrOScIENcE
nerve injuries: P.I. and M.P.; Writing: A.B., A.C., D.K., F.A., J.W. and V.G.; Funding acquisition: A.C. and V.G.; Supervision: A.C. and V.G.; Project administration: A.C.
Competing interestsThe authors declare no competing interests.
Additional informationExtended data is available for this paper at https://doi.org/10.1038/s41593-021-00800-0.
Supplementary information The online version contains supplementary material available at https://doi.org/10.1038/s41593-021-00800-0.
Correspondence and requests for materials should be addressed to V.G. or A.C.
Peer review information Nature Neuroscience thanks Thomas Papouin, Gertrudis Perea, and the other, anonymous, reviewer(s) for their contribution to the peer review of this work.
Reprints and permissions information is available at www.nature.com/reprints.
(Marie Sklodowska-Curie Innovative Training Networks, grant no. 722053, EU-GliaPhD) (to N.R.). The authors thank V. Lelièvre for in situ hybridization advice; R. Goutagny for in vivo optogenetics assistance; F. Magara for anxiety behavior advice; B. Kurpiers and the Interdisciplinary Neurobehavioral Core Facility of Heidelberg University for experiments performed there; S. Reibel and the Chronobiotron UMS 3415 for all animal care; and T. Splettstoesser (www.scistyle.com) for help with the preparation of Fig. 7.
Author contributionsConceptualization: A.C.; Methodology: A.C., B.Boutrel, C.M.L., C.P., D.K., F.A., I.D., J.E.S., J.W., J.Y.C., N.R., P.D., P.P., R.S., V.G., W.S.Y. and YG; Analysis: A.C., B.Bellanger, B.B.J., C.M.L., D.K., F.A., H.S.K.B., J.W. and S.G.; In situ hybridization: D.H., F.A., H.S.K.B., H.W., J.S. and M.E.; Immunohistochemistry: A.L., D.H., F.A., J.W., M.E. and M.D.S.G.; Imaris analysis: F.A., M.K.K. and R.K.R.; Ex vivo patch-clamp electrophysiology: A.B., A.C., J.W., S.G., D.K., I.W., B.Bellanger and M.A.; Ex vivo calcium imaging: A.B., C.M.L., D.K. and J.W.; Astrocyte characterization: A.B., A.R., B.Bellanger, D.K., I.W., M.E. and S.G.; Behavior: A.C., B.B.J., D.K. and J.W.; Mice line validation: W.S.Y.; Viral vectors validation: D.B., L.B., M.D.S.G., M.E. and V.G.; Spared
NAtuRE NEuRoSCIENCE | www.nature.com/natureneuroscience

ArticlesNaTUrE NEUrOScIENcE
st CeL
CeM
OTR mRNAOTR R mRNAALDH1L1
CeM CeL
NeuN GS OTR mRNA
CeM CeL
GS OTR mRNA
CeM CeL
NeuN OTR mRNA
dc
a
OTR GFAPebor
Plrtc
evit ageN
merge + DAPIb
OTR
mR
NA
expr
essi
ng c
ells
(%)
OTR
mR
NA
expr
essi
ngA
LDH
1L1
posi
tive
cells
(%)
0
20
40
60
80
100
0
20
40
60
80
100
Neu
ron
Astro
cyte
Extended Data Fig. 1 | Validation of otR expression in CeL astrocytes using several astrocytic markers. a, Combination of FISH and IHC showing co-localization of GS (top left), NeuN (bottom left) and both markers (right) with OTR mRNA in rats. Scale bars are 100µm and 10µm. (n rats = 5, n slices = 20, n astrocytes = 1354, n neurons = 1254). b, proportion of OTR positive astrocytes and neurons in mice. n astrocytes = 897; n neurons = 688; n rats = 4 c, (top left) FISH overview for OTR mRNA (green), counterstained with polyclonal anti-ALDH1L1 antibody (red) in CeA. (bottom left) High magnification image of cells positive for both OTR mRNA and ALDH1L1 (double arrows); green arrows point OTR mRNA-positive cells; red arrows point ALDH1L1-positive cells. Scale bars: 400 (Top) and 50µm (Bottom). (Right) Quantification of ALDH1L1-positive cells positive for OTR mRNA. n astrocytes = 450; n rats = 4. d, RNAscope in situ hybridization showing GFAP (red) and OTR (green) expressing cells in mice CeA. Merged images include DAPI stain (blue); n = 3. (Bottom) Negative control probe targeting the bacterial gene DapB; n = 3. Scale bar is 10μm. st: stria terminalis. Data are expressed as mean across slices plus SEM and white circles represent individual cell data. (Statistics and numbers in Supplementary Table 1).
NAtuRE NEuRoSCIENCE | www.nature.com/natureneuroscience

Articles NaTUrE NEUrOScIENcE
avidinALEXA488NeuN
Astrocytes
Neurons
Cm
(pF
)0
200
Rm
(M
ohm
)
0
200
400
Res
ting
pote
ntia
l (m
V)
-100
-80
-60
-40
0
10
20
30
Ra
(Moh
m)
*** ***
***
50ms
20m
V
50ms
10m
V
SR101 OGB1
+ PGFAP-Cre
Control
Cont
rol
NeuNOTR mRNA
CeM
CeL
GSGFAPp-Cre-GFPCre
0
20
40
60
80
100
Effi
cien
cy (%
)
20 m
V
rAAV-OTp-C1V1(t/t)-mCherry(OxytOpto)
500 ms
500
pA
500 ms
PVNmCherry
20%
ΔF
100s
AU
C (n
orm
. to
base
line)
OxytOptoλ542nm 20s
10
8
6
4
2
0
Baseli
nepo
st sti
m
AUC
Calcium Transient
Baseline Post stimulation
Ratio =Xslice post stim
AU
C
2.103
1.103
0
Xslice
a b
c d e
f
hg
Xslice baseline
OTR
mR
NA
expr
essi
ng n
euro
ns (%
)
Values averagedacross cells per slice
0
20
40
60
80
100
Spe
cific
ity (%
)
+PGFA
P-Cre
0
20
40
60
80
100
Extended Data Fig. 2 | See next page for caption.
NAtuRE NEuRoSCIENCE | www.nature.com/natureneuroscience

ArticlesNaTUrE NEUrOScIENcE
Extended Data Fig. 2 | Validation of astrocyte-specific approaches. a, (left) C1V1-mCherry (OxyOpto) expressing oxytocin neuron of the PVN. Scale bar is 20µm; n = 11. (right) Schematic representation of the whole cell patch clamp of the OxytOpto-expressing cells of the PVN. b, (left) λ542nm light exposure (yellow line) induce a depolarizing current, (right) enabling precise spiking of OxytOpto-expressing cells. c, Typical confocal image of CeL astrocytes co-labeled with SR101 and OGB1; n = 46. Scale bar 20μm. d, (left) Pseudo-color pictures of an SR101 positive cell identified as an astrocyte compared to neurons identified under oblique infrared light, Scale bar 10μm. (Middle) Electrophysiological properties of patched SR101+ (red, n = 82) and SR101- cells (grey, n = 20). Medians, quartiles and whiskers can be found in Supplementary Table 2. (Right) Typical responses to 20pA current steps of a SR101+ (red) and a SR101- cells (black). e, CeL SR101 positive cell filled with biocytin through whole cell patch-clamp (green) lacks NeuN signal (Blue); n = 3. Scale bar 50 μm. f, Illustration of calcium imaging data analysis method. (left) Fluorescence traces were splited into a “baseline” and a “post-stimulation” trace. Calcium transients were detected according to a prominence threshold and their frequency was quantified before and after the drug application. All data were averaged across astrocytes per slice, and this results was used as statistical unit. All data were compared (before vs. after drug application) and the results were expressed in ratio (baseline/drug effect), a ratio of 1 meaning neither an increase nor a decrease of the measured parameter. ns = 7, na = 36. g, (top left) Immunohistochemical staining for glutamine synthase (GS; blue), Cre-GFP (green) and Cre recombinase (red). (bottom left) Overview of the CeA, displaying correct viral targeting of the CeL subdivision. (right) Quantification of efficiency and specificity of the transduction. Efficiency: Over 1001 GS positive cells, 561 were also GFP positive, indicating an efficiency of 56±4.9%. Specificity: we counted a total of n = 977 GFP-positive cells, 940 of which were positive for GS (96.2±2.1%). None of the GFP or Cre signals were detected in NeuN positive cells (0 out of n = 850, 4 mice, not shown). Finally, 99.82 ± 0.2% of GS-positive astrocytes containing GFP signal were Cre-positive (n = 1001). n mice = 4. Scale bars: 400 (Bottom) and 20µm (Top). h, Immunohistochemical analysis of OTR expression in NeuN-positive cells of the CeL revealed no difference in OTR levels between control and GFAP-Cre injected animals; 85.0 ± 1.6% (n = 688, n = 4 mice) and 86.7 ± 1.6% (n = 660, n = 4 mice) respectively. Scale bars: 20µm. Data in f-h are expressed as mean across slices plus SEM and white circles represent individual cell data. ***p < 0.001, two-sided Mann-Whitney U test. (Statistics and numbers in Supplementary Table 2).
NAtuRE NEuRoSCIENCE | www.nature.com/natureneuroscience
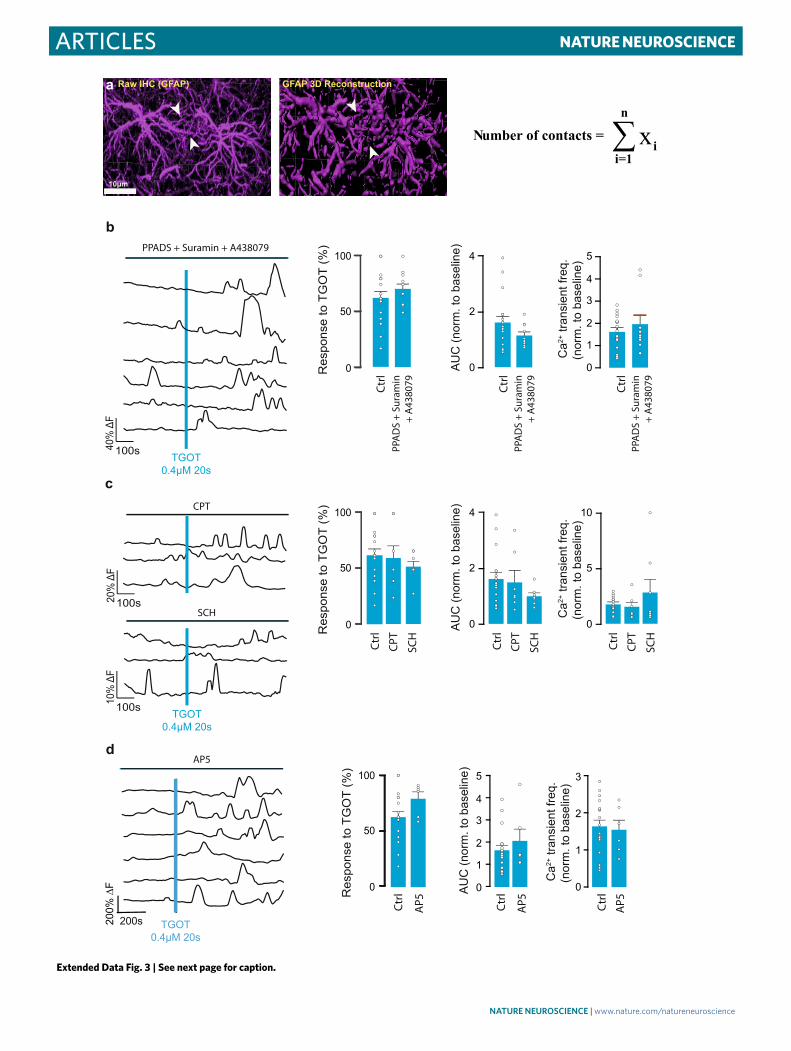
Articles NaTUrE NEUrOScIENcE
4
2
0
100
50
0
5
4
0
40%
ΔF
100s TGOT0.4μM 20s
b
100
50
0
3
1
TGOT0.4μM 20s
F∆%002 200s
d
PPADS + Suramin + A438079
AP5
4
2
0
100
50
0
10
5
0
10%
ΔF
100s TGOT0.4μM 20s
cCPT
SCH
20%
ΔF
100s
noitcurtsnoceRD3PAFG)PAFG(CHIwaR
10µm
Number of contacts = ∑x i
n
i=1
a
AP5
lrt C AP5
lrt C AP5
lrt C
AU
C (n
orm
. to
base
line)
Res
pons
e to
TG
OT
(%)
Ca2+
tran
sien
t fre
q.(n
orm
. to
base
line)
AU
C (n
orm
. to
base
line)
Res
pons
e to
TG
OT
(%)
Ca2+
tran
sien
t fre
q.(n
orm
. to
base
line)
AU
C (n
orm
. to
base
line)
Res
pons
e to
TG
OT
(%)
Ca2+
tran
sien
t fre
q.(n
orm
. to
base
line)
TPC
lrt C
HCS
TPC
lrt C
HCS
TPC
lrt C
HCS
lrt C
nimar uS
+S
DAPP
970834A
+
lrt C
lrt C
2
0
3
2
1
5
4
0
3
2
1
nimar uS
+S
DAPP
970834A
+
nimar uS
+S
DAPP
970834A
+
Extended Data Fig. 3 | See next page for caption.
NAtuRE NEuRoSCIENCE | www.nature.com/natureneuroscience
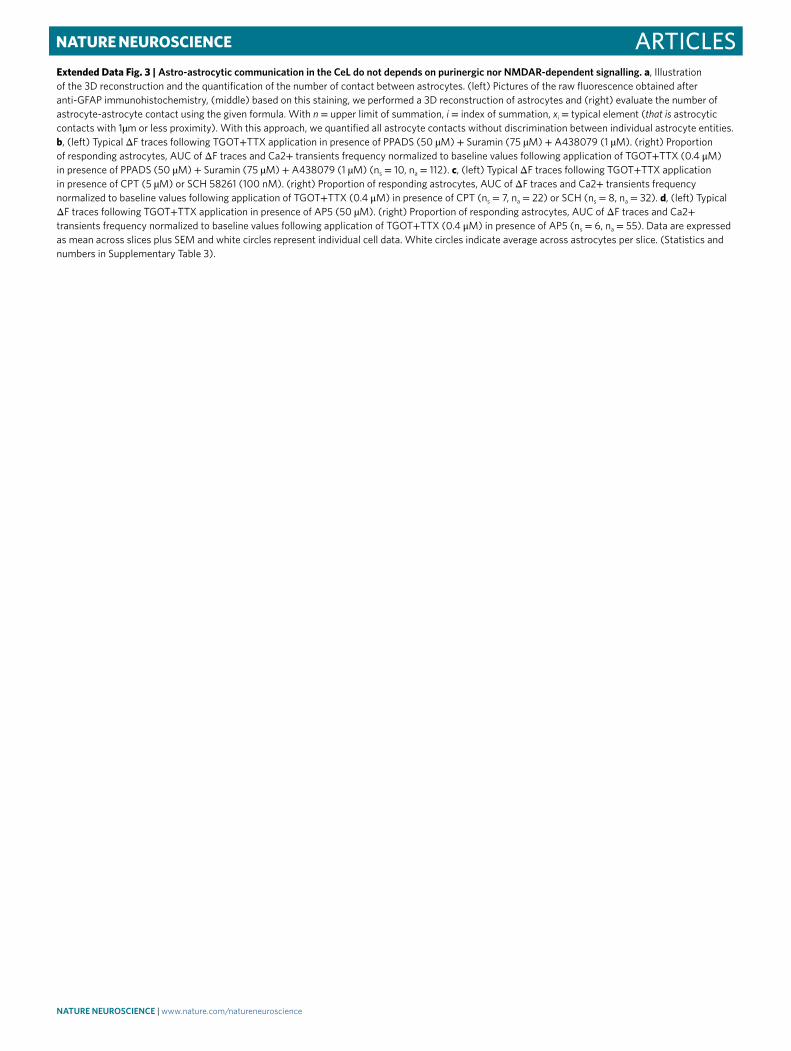
ArticlesNaTUrE NEUrOScIENcE
Extended Data Fig. 3 | Astro-astrocytic communication in the CeL do not depends on purinergic nor NMDAR-dependent signalling. a, Illustration of the 3D reconstruction and the quantification of the number of contact between astrocytes. (left) Pictures of the raw fluorescence obtained after anti-GFAP immunohistochemistry, (middle) based on this staining, we performed a 3D reconstruction of astrocytes and (right) evaluate the number of astrocyte-astrocyte contact using the given formula. With n = upper limit of summation, i = index of summation, xi = typical element (that is astrocytic contacts with 1µm or less proximity). With this approach, we quantified all astrocyte contacts without discrimination between individual astrocyte entities. b, (left) Typical ΔF traces following TGOT+TTX application in presence of PPADS (50 µM) + Suramin (75 µM) + A438079 (1 µM). (right) Proportion of responding astrocytes, AUC of ΔF traces and Ca2+ transients frequency normalized to baseline values following application of TGOT+TTX (0.4 μM) in presence of PPADS (50 µM) + Suramin (75 µM) + A438079 (1 µM) (ns = 10, na = 112). c, (left) Typical ΔF traces following TGOT+TTX application in presence of CPT (5 µM) or SCH 58261 (100 nM). (right) Proportion of responding astrocytes, AUC of ΔF traces and Ca2+ transients frequency normalized to baseline values following application of TGOT+TTX (0.4 μM) in presence of CPT (ns = 7, na = 22) or SCH (ns = 8, na = 32). d, (left) Typical ΔF traces following TGOT+TTX application in presence of AP5 (50 µM). (right) Proportion of responding astrocytes, AUC of ΔF traces and Ca2+ transients frequency normalized to baseline values following application of TGOT+TTX (0.4 μM) in presence of AP5 (ns = 6, na = 55). Data are expressed as mean across slices plus SEM and white circles represent individual cell data. White circles indicate average across astrocytes per slice. (Statistics and numbers in Supplementary Table 3).
NAtuRE NEuRoSCIENCE | www.nature.com/natureneuroscience

Articles NaTUrE NEUrOScIENcE
15
10
0
100
50
0
10
5
0
5
*** *** **
20%
∆F
200s
AstrOptoλ542nm 3min
5% ∆
F
200s0 Ca2+
aC
0+2
mCherry
ALDH1L1
0
20
40
60
80
100
Effi
cien
cy (%
)b
rAAV-GFAPp-C1V1(t/t)-mCherry(AstrOpto)
a
AU
C (n
orm
. to
base
line)
Res
pons
e to
Ast
rOpt
o (%
)
Ca2+
tran
sien
t fre
q.(n
orm
. to
base
line)
Ctrl a
C0
+2
Ctrl a
C0
+2
Ctrl
0
20
40
60
80
100
Spe
cific
ity (%
)
Extended Data Fig. 4 | Specific optogenetic stimulation of CeL astrocytes elicit calcium transients in a Ca2+-dependent manner. a, (left) Immunohistochemistry image shows CeL cells transfected with rAAV-Gfap-C1V1(t/t)-mCherry (AstrOpto) with co-labeling for ALDH1L1. White arrow shows one cell expanded in insets. Scale bars are 25 and 10 µm (insets). (right) Quantification of the efficiency and specificity of transduction of C1V1 in CeL astrocytes. PGFAP- C1V1-mCherry rAAV vector was injected into rat CeA (bilaterally, 200nl). Specificity: Over 1090 mCherry-positive cells, 98.8±0.7% were positive for ALDH1L1. None of the analyzed cells were positive for NeuN. Efficiency: Over 1090 ALDH1L1 positive cells, 62.3±3.5% were also mCherry positive. n = 4 rats. b, (left) Typical ΔF traces following AstrOpto activation. λ542nm (1s @ 0.5Hz during 3 minutes) with (top 3 traces) or without (bottom 3 traces) extracellular calcium. (right) Proportion of responding astrocytes, AUC of ΔF traces and Ca2+ transients frequency normalized to baseline values following AstrOpto stimulation with (ns = 12, na = 49) or without Ca2+ in the ACSF (ns = 12, na = 53). Data are expressed as mean across slices plus SEM. White circles indicate average across astrocytes per slice. **p<0.01, ***p<0.001, two-sided Mann-Whitney U test. (Statistics and numbers in Supplementary Table 4).
NAtuRE NEuRoSCIENCE | www.nature.com/natureneuroscience
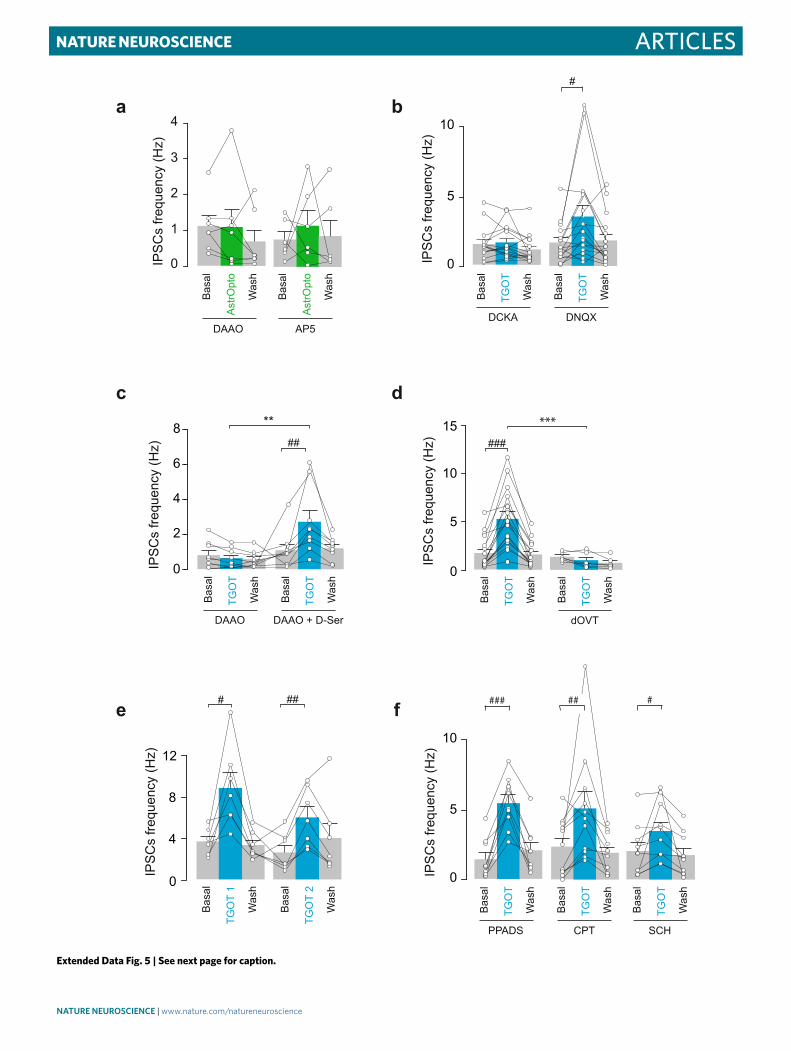
ArticlesNaTUrE NEUrOScIENcE
###f
5
0
10
IPS
Cs
frequ
ency
(Hz)
2
4
6
8
0IPS
Cs
frequ
ency
(Hz) ##
**
IPS
Cs
frequ
ency
(Hz)
d
0
5
10
15IP
SC
s fre
quen
cy (H
z) ###
12
8
4
0
***
IPS
Cs
frequ
ency
(Hz)
a
1
0
4
3
2
#
5
0
10
IPS
Cs
frequ
ency
(Hz)
b
e
c
### ##
DAAO AP5
Ast
rOpt
o
Bas
al
Was
h
Ast
rOpt
o
Bas
al
Was
h
DAAO DAAO + D-Ser
TGO
T
Bas
al
Was
h
TGO
T
Bas
al
Was
h
dOVT
TGO
T
Bas
al
Was
h
TGO
T
Bas
al
Was
h
TGO
T 1
Bas
al
Was
h
TGO
T 2
Bas
al
Was
hDCKA DNQX
TGO
T
Bas
al
Was
h
TGO
T
Bas
al
Was
h
PPADS CPT
TGO
T
Bas
al
Was
h
TGO
T
Bas
al
Was
h
SCH
TGO
T
Bas
al
Was
h
#
Extended Data Fig. 5 | See next page for caption.
NAtuRE NEuRoSCIENCE | www.nature.com/natureneuroscience

Articles NaTUrE NEUrOScIENcE
Extended Data Fig. 5 | Astro-neuronal communication depends on NMDAR but not purinergic transmission. Figure 5. a, DAAO (0.15 IU/ml, incubation time > 1h30; n = 7) and AP5 (50 µM; n = 6) prevent the effect of photoactivation of astrocytes (AstrOpto) on IPSC frequency in CeM neurons. b, Two consecutive TGOT application effects on IPSCs frequencies in CeM neurons after DAAO (0.15 U/ml, incubation time > 1h30) followed by D-Serine (20 min, 100 μM) incubation of the same cells (n = 7). c, dOVT (1 µM; n = 6) prevents the effect of TGOT on IPSCs frequencies in CeM neurons. d, Effect of double (20 min apart) application of TGOT on IPSCs frequencies in CeM (0.4 µM n = 7). e, Effect of DCKA (10 µM, n = 15) and DNQX (25 µM; n = 10) on TGOT-induced increase in IPSC frequency in CeM neurons. f, Purinergic antagonists do not prevent TGOT effect on IPSC frequency in CeM neurons. PPADS (50 µM; n = 9), CPT (5 µM; n = 11), SCH (100 nM; n = 10). Data are expressed as averages plus SEM and white circles represent individual cell data. #p < 0.05, ##p < 0.01, ###p < 0.001, Friedman and Dunn’s Multiple comparisons, **p < 0.01, ***p < 0.001, two-sided unpaired t-test or Mann-Whitney U test. (Statistics and numbers in Supplementary Table 5).
NAtuRE NEuRoSCIENCE | www.nature.com/natureneuroscience
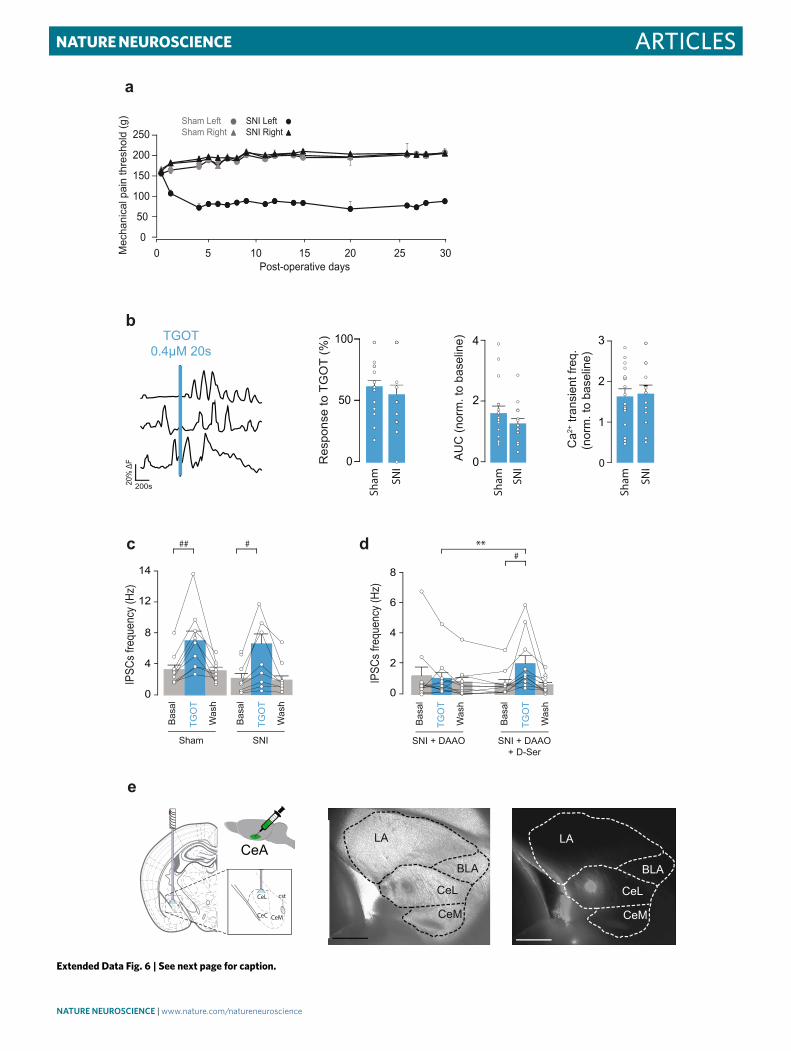
ArticlesNaTUrE NEUrOScIENcE
50
100
150
200
250M
echa
nica
l pai
n th
resh
old
(g)
00 5 10 15 20 25 30
Sham LeftSham Right
SNI LeftSNI Right
Post-operative days
a
0
4
8
12
IPSC
s fre
quen
cy (H
z)
###
4
2
0
100
50
0
3
2
0
20%
ΔF
200s
TGOT0.4μM 20s
0
2
4
6
8
IPSC
s fre
quen
cy (H
z)
**#
b
dc
e
14
cst
CeC
CeL
CeM
CeA
CeL
CeM
LA
AU
C (n
orm
. to
base
line)
Res
pons
e to
TG
OT
(%)
Ca2+
tran
sien
t fre
q.(n
orm
. to
base
line)
INS
Sham
INS
Sham
INS
Sham
Sham SNI
TGO
T
Bas
al
Was
h
TGO
T
Bas
al
Was
h
SNI + DAAO SNI + DAAO+ D-Ser
TGO
T
Bas
al
Was
h
TGO
T
Bas
al
Was
h
1
BLA
CeL
CeM
LA
BLA
Extended Data Fig. 6 | See next page for caption.
NAtuRE NEuRoSCIENCE | www.nature.com/natureneuroscience

Articles NaTUrE NEUrOScIENcE
Extended Data Fig. 6 | SNI procedure does not modify the effect of otR activation on CeL microcircuit activity. a, 30 days post surgeries time course of mechanical pain threshold evolution across sham (n = 23) and SNI (n = 22) rats. Data are expressed as mean across animals plus SEM. b, (left) Typical ΔF traces following TGOT+TTX application in SNI rats. (right) Proportion of responding astrocytes, AUC of ΔF traces and Ca2+ transients frequency normalized to baseline values following application of TGOT+TTX (0.4 μM) in sham (ns = 16, na = 74) or SNI (ns = 18 et na = 136) rats. Data are expressed as mean across slices plus SEM. White circles indicate average across astrocytes per slice. c, TGOT effect on CeM neurons IPSCs frequencies is unchanged between Sham (n = 9) or SNI (n = 9) rats. Data are expressed as average plus SEM and white circles represent individual cell data. d, Two consecutive TGOT application effects on IPSCs frequencies in CeM neurons after DAAO (0.15 U/ml, incubation time > 1h30) followed by D-Serine (20 min, 100 μM) incubation of the same cells from acute brain slices of SNI animals (n = 11). Data are expressed as averages plus SEM and white circles represent individual cell data. e, Verification of cannulae implantation sites. (left) Schematic representation of the stereotaxic injection viewed in a coronal slice; n rats = 67, n mice = 52. (middle, right) Infrared and fluorescence microscopy picture showing the injection site of fluorescent latex beads in the CeL on horizontal slices. Scale is 1mm. ** p<0.01, *** P<0.001, two-sided paired t-test or Wilcoxon test, #p<0.05 Friedman test followed by Dunn’s multiple comparison. (Statistics and numbers in Supplementary Table 6).
NAtuRE NEuRoSCIENCE | www.nature.com/natureneuroscience

ArticlesNaTUrE NEUrOScIENcE
C1V1TGOTControl
SNI
Mec
hani
cal t
hres
hold
(g)
24h
0
4
8
6
Ctr
l
0.3h
2
Contralateral paw
Sham
Mec
hani
cal t
hres
hold
(g)
24h
Ctrl
0.3h
0
4
8
6
2
Contralateral paw
SNI
Mec
hani
cal t
hres
hold
(g)
0.3hCtrl
3.5h 24h
050
100150
250300
200
Contralateral paw
Sham
Mec
hani
cal t
hres
hold
(g)
Ctrl
0.3h
3.5h 24
h
050
100150
250300
200
Contralateral pawa
e
cb
gf
PGFAP
RTIRTIC1V1-mCherry
Wistar rat
OTR-cKO mouse
PGFAP
ITR ITRGFP-IRES-Cre
CeA
CeA
AAV
AAV
Control
TGOT in WT
TGOT inGFAP OTR KO D
ista
nce
trave
lled
(m)
0
5
10
15
20
Dis
tanc
e tra
velle
d (m
)
0
20
40
60
Dis
tanc
e tra
velle
d (m
)
0
5
10
15
20
Dis
tanc
e tra
velle
d (m
)
0
20
40
60
Dis
tanc
e tra
velle
d (m
)
0
60
20
40
d
h
GFAPOTR KO
GFAPOTR KO
GFAPOTR KO
GFAPOTR KO
WT
WT
WT
WT
0
10
15
25
Dis
tanc
e tra
velle
d (m
)
5
0
10
15
20
Dis
tanc
e tra
velle
d (m
)
5
0
100
50
75
25
20
Extended Data Fig. 7 | See next page for caption.
NAtuRE NEuRoSCIENCE | www.nature.com/natureneuroscience

Articles NaTUrE NEUrOScIENcE
Extended Data Fig. 7 | Effects of CeL astrocytes and otR activities manipulations on locomotion and contralateral hindpaw sensitivity. a,e, Experimental strategy for the specific expression of C1V1 in mice CeL astrocytes (a, AstrOpto) or the specific deletion of OTRs in mice CeL astrocytes (e, GFAP OTR KO). The treatments applied are color coded as the legend key indicate. Control indicate a vehicle injection. b,f, Mechanical pain threshold was assessed on the non-injured paw of SNI (bottom, gray box) and its equivalent in Sham (top) groups. TGOT or its vehicle, or astrocytes light-evoked activation of C1V1, were administered in the CeL and mechanical pain threshold assessed again at different time points. Rats (n): Sham control n = 12, TGOT n = 10, C1V1 n = 6; SNI control n = 12, TGOT n = 10, C1V1, n = 9. Mice (n): Sham WT n = 6, OTR cKO n = 8; SNI WT n = 5, OTR cKO n = 13. c,g, Locomotion was assessed through measurement of the distance travelled during the length of the elevated plus maze experiment, after administration of the different treatments. Rats (n): Sham control n = 10, TGOT n = 8, C1V1 n = 9; SNI control n = 20, TGOT n = 9, C1V1, n = 7. Mice (n): Sham WT Veh n = 7, WT TGOT n = 6; Sham OTR cKO Veh n = 5, OTR cKO TGOT n = 7; SNI WT Veh n = 7, WT TGOT n = 8; SNI OTR cKO Veh n = 5, OTR cKO TGOT n = 7. d,h, Locomotion was assessed through measurement of the distance travelled during the time of the conditioned place preference experiment, after administration of the different treatments. Rats (n): Sham control n = 13, TGOT n = 6, C1V1 n = 5; SNI control n = 10, TGOT n = 8, C1V1, n = 8. Mice (n): Sham WT Veh n = 5, WT TGOT n = 8; Sham OTR cKO Veh n = 5, OTR cKO TGOT n = 4; SNI WT Veh n = 5, WT TGOT n = 5; SNI OTR cKO Veh n = 4, OTR cKO TGOT n = 6. Data are expressed as mean across animals plus SEM. (Animals number and Statistics in Supplementary Table 7).
NAtuRE NEuRoSCIENCE | www.nature.com/natureneuroscience

1
natu
re research | rep
ortin
g su
mm
aryA
pril 2
02
0
Corresponding author(s): Alexandre Charlet
Last updated by author(s): Dec 7, 2020
Reporting SummaryNature Research wishes to improve the reproducibility of the work that we publish. This form provides structure for consistency and transparency
in reporting. For further information on Nature Research policies, see our Editorial Policies and the Editorial Policy Checklist.
StatisticsFor all statistical analyses, confirm that the following items are present in the figure legend, table legend, main text, or Methods section.
n/a Confirmed
The exact sample size (n) for each experimental group/condition, given as a discrete number and unit of measurement
A statement on whether measurements were taken from distinct samples or whether the same sample was measured repeatedly
The statistical test(s) used AND whether they are one- or two-sided
Only common tests should be described solely by name; describe more complex techniques in the Methods section.
A description of all covariates tested
A description of any assumptions or corrections, such as tests of normality and adjustment for multiple comparisons
A full description of the statistical parameters including central tendency (e.g. means) or other basic estimates (e.g. regression coefficient)
AND variation (e.g. standard deviation) or associated estimates of uncertainty (e.g. confidence intervals)
For null hypothesis testing, the test statistic (e.g. F, t, r) with confidence intervals, effect sizes, degrees of freedom and P value noted
Give P values as exact values whenever suitable.
For Bayesian analysis, information on the choice of priors and Markov chain Monte Carlo settings
For hierarchical and complex designs, identification of the appropriate level for tests and full reporting of outcomes
Estimates of effect sizes (e.g. Cohen's d, Pearson's r), indicating how they were calculated
Our web collection on statistics for biologists contains articles on many of the points above.
Software and code
Policy information about availability of computer code
Data collection Electrophysiological data were recorded using Clampex 10.7; Calcium imaging data were recorded using MetaFluor 7.8.8.0; Behavioral video
acquisition were performed through Ethovision Pro 3.16 and Anymaze; Anatomical data were recorded using Imaris 9.31
Data analysis Electrophysiological data were analysed using Mini analysis 6.0; Calcium imaging data were analysed with Fiji 1.47v and Python 3.7.6;
Behavioral video analysis were performed through Ethovision Pro 3.16 and Anymaze; 3D reconstruction of astrocytes were performed using
Imaris 9.31; statistical analysis were performed using GraphPad Prism 6
For manuscripts utilizing custom algorithms or software that are central to the research but not yet described in published literature, software must be made available to editors and
reviewers. We strongly encourage code deposition in a community repository (e.g. GitHub). See the Nature Research guidelines for submitting code & software for further information.
Data
Policy information about availability of data
All manuscripts must include a data availability statement. This statement should provide the following information, where applicable:
- Accession codes, unique identifiers, or web links for publicly available datasets
- A list of figures that have associated raw data
- A description of any restrictions on data availability
Python code (used for ex vivo calcium-imaging data analysis) can be found in Supplementary Software. All data that support the findings of the present study are
available from the corresponding author upon request.

2
natu
re research | rep
ortin
g su
mm
aryA
pril 2
02
0
Field-specific reportingPlease select the one below that is the best fit for your research. If you are not sure, read the appropriate sections before making your selection.
Life sciences Behavioural & social sciences Ecological, evolutionary & environmental sciences
For a reference copy of the document with all sections, see nature.com/documents/nr-reporting-summary-flat.pdf
Life sciences study designAll studies must disclose on these points even when the disclosure is negative.
Sample size No statistical methods were used to pre-determine sample sizes but our sample sizes are similar to those reported in previous publications.
Data exclusions For CPP test: animals spending more than 80% of the total time in a single chamber before the conditioning, or with cannulae/optic fiber
issues, were removed from the analysis. For EPM test: Animals falling from the apparatus during the test, freezing more than 50% of the total
time, or with cannulae/optic fiber issues, were removed from the analysis. For mechanical sensitivity test: animals with cannulae/optic fiber
issues, were removed from the analysis.
Replication All experimental results were successfully reproduced at least 3 times. In addition, all statistical analysis were performed using the
experimental number and not the recording number (e.g. calcium imaging, statistical unit is the slice, not the cell).
Randomization All animals were allocated randomly to the experimental groups.
Blinding All analysis were conducted blindly and reproduced twice per two peoples at least.
Reporting for specific materials, systems and methodsWe require information from authors about some types of materials, experimental systems and methods used in many studies. Here, indicate whether each material,
system or method listed is relevant to your study. If you are not sure if a list item applies to your research, read the appropriate section before selecting a response.
Materials & experimental systems
n/a Involved in the study
Antibodies
Eukaryotic cell lines
Palaeontology and archaeology
Animals and other organisms
Human research participants
Clinical data
Dual use research of concern
Methods
n/a Involved in the study
ChIP-seq
Flow cytometry
MRI-based neuroimaging
Antibodies
Antibodies used Anti-GFAP, Abcam, ab-4674; anti-glutamine synthase, Merk Millipore, MAB302; Alexa 555 goat anti-chicken, Abcam, ab150170; Alexa
488 goat anti-rabbit, Abcam, ab150077; Anti-ALH1L1, Abcam, ab87117; Alexa 680 goat anti-rabbit, Abcam, ab175773; Anti-NeuN,
Abcam, ab175773; Anti-Cre antibody, Abcam, ab104225.
Validation All antibodies validations are available on the description files of the respective companies websites.
Eukaryotic cell lines
Policy information about cell lines
Cell line source(s) Human embryonic kidney (HEK) 293T cell line was purchased from Addgene, USA (catalog number #240073).
Authentication Cells authentication was done by microscopic inspection.
Mycoplasma contamination All cell lines were tested negative for mycoplasma contamination.
Commonly misidentified lines(See ICLAC register)
No commonly misindentified cell lines were used in this study.

3
natu
re research | rep
ortin
g su
mm
aryA
pril 2
02
0Animals and other organisms
Policy information about studies involving animals; ARRIVE guidelines recommended for reporting animal research
Laboratory animals Animals were housed under standard conditions with food and water available ad libitum and maintained on a 12-hour light/dark
cycle and all experiments were conducted in accordance with EU rules and approbation from French Ministry of Research
(01597.05). For ex vivo and in vivo experiments, both male and female Wistar rats or C5BL/6 mice were used. Ex vivo experiments
used animals between 18 and 25 days old, except in experiments where rAAVs were injected, in which case animals were between 2
and 6 months old at the time of sacrifice. In vivo experiments used 2-month-old animals at the time of the first surgery.
Specific deletion of OTRs in CeL astrocytes. To specifically ablate OTRs in CeA astrocytes, transgenic cKO mice, in which loxP sites
flank the OTR coding sequence18, received bilateral injections (280 nl) of rAAV-GFAP-GFP-IRES-Cre. Following four weeks of
expression of the viral proteins, mice were intracardially perfused with 1x PBS and 4% PFA. Brain sections were used for FISH (OTR
mRNA) and IHC (GS) to verify the validity of the approach. Representative images and quantifications are provided in Figure 2H,
Extended Data Fig. 2g-h.
Specific deletion of Cx30 and Cx43 in astrocytes. To specifically impaire gap-junctions coupling, we used Cx30-/-Cx43fl/fl:hGFAP-Cre
mice (Cx30/Cx43 double KO), which were previously characterized19,50,51, with conditional deletion of Cx43 in astrocytes52 and
additional deletion of Cx3053.
Wild animals No wild animals were used in this study
Field-collected samples No field collected samples were used in this study
Ethics oversight All the experiments and protocols were approved by both the French Ministry of Research.
Note that full information on the approval of the study protocol must also be provided in the manuscript.