Embed Size (px)
Citation preview
Astrochemistry during theformation of stars
Jes K. Jørgensen,1 Arnaud Belloche,2 andRobin T. Garrod3
1Niels Bohr Institute, University of Copenhagen, Copenhagen, Denmark; email:
[email protected] fur Radioastronomie, Bonn, Germany; email:
[email protected] of Chemistry and Astronomy, University of Virginia,
Charlottesville, Virginia, USA; email: [email protected]
Annu. Rev. Astron. Astrophys. 2020.
58:1–55
This article’s doi:
10.1146/((please add article doi))
Copyright c© 2020 by Annual Reviews.
All rights reserved
Keywords
astrochemistry, complex molecules, interstellar medium, interstellar
molecules, star formation, submillimeter astronomy
Abstract
Star-forming regions show a rich and varied chemistry, including the
presence of complex organic molecules – both in the cold gas distributed
on large scales, and in the hot regions close to young stars where proto-
planetary disks arise. Recent advances in observational techniques have
opened new possibilities for studying this chemistry. In particular, the
Atacama Large Millimeter/submillimeter Array (ALMA) has made it
possible to study astrochemistry down to Solar System size scales, while
also revealing molecules of increasing variety and complexity. In this
review, we discuss recent observations of the chemistry of star-forming
environments, with a particular focus on complex organic molecules,
taking context from the laboratory experiments and chemical models
that they have stimulated. The key takeaway points are:
• The physical evolution of individual sources plays a crucial role in
their inferred chemical signatures, and remains an important area
for observations and models to elucidate.
• Comparisons of the abundances measured toward different star-
forming environments (high-mass versus low-mass, Galactic center
versus Galactic disk) reveal a remarkable similarity, an indication
that the underlying chemistry is relatively independent of
variations in their physical conditions.
• Studies of molecular isotopologs in star-forming regions provide a
link with measurements in our own Solar System, and thus may
shed light on the chemical similarities and differences expected in
other planetary systems.
1
arX
iv:2
006.
0707
1v1
[as
tro-
ph.S
R]
12
Jun
2020

Contents
1. INTRODUCTION .. . . . . . . . . . . . . . . . . . . . . . . . . . . . . . . . . . . . . . . . . . . . . . . . . . . . . . . . . . . . . . . . . . . . . . . . . . . . . . . . . . . . . . . . . . . 21.1. Motivation. . . . . . . . . . . . . . . . . . . . . . . . . . . . . . . . . . . . . . . . . . . . . . . . . . . . . . . . . . . . . . . . . . . . . . . . . . . . . . . . . . . . . . . . . . . . . . . 21.2. Star formation and astrochemistry . . . . . . . . . . . . . . . . . . . . . . . . . . . . . . . . . . . . . . . . . . . . . . . . . . . . . . . . . . . . . . . . . . . . . 41.3. Outline of this paper . . . . . . . . . . . . . . . . . . . . . . . . . . . . . . . . . . . . . . . . . . . . . . . . . . . . . . . . . . . . . . . . . . . . . . . . . . . . . . . . . . . . 5
2. RECENT ADVANCES AND NEW CHALLENGES. . . . . . . . . . . . . . . . . . . . . . . . . . . . . . . . . . . . . . . . . . . . . . . . . . . . . . . . . . 52.1. Advances in observational techniques . . . . . . . . . . . . . . . . . . . . . . . . . . . . . . . . . . . . . . . . . . . . . . . . . . . . . . . . . . . . . . . . . . 52.2. Spectroscopic identifications of new species. . . . . . . . . . . . . . . . . . . . . . . . . . . . . . . . . . . . . . . . . . . . . . . . . . . . . . . . . . . . 102.3. Linking observations, chemical modeling, and laboratory experiments . . . . . . . . . . . . . . . . . . . . . . . . . . . . . . . . 13
3. CHEMICAL INVENTORIES IN REGIONS OF STAR FORMATION .. . . . . . . . . . . . . . . . . . . . . . . . . . . . . . . . . . . . . . 183.1. Recent salient results about molecular complexity . . . . . . . . . . . . . . . . . . . . . . . . . . . . . . . . . . . . . . . . . . . . . . . . . . . . . 183.2. Detections in the warm gas of hot cores and corinos . . . . . . . . . . . . . . . . . . . . . . . . . . . . . . . . . . . . . . . . . . . . . . . . . . 193.3. Low-density environments and starless/prestellar cores . . . . . . . . . . . . . . . . . . . . . . . . . . . . . . . . . . . . . . . . . . . . . . . . 203.4. Outflows . . . . . . . . . . . . . . . . . . . . . . . . . . . . . . . . . . . . . . . . . . . . . . . . . . . . . . . . . . . . . . . . . . . . . . . . . . . . . . . . . . . . . . . . . . . . . . . . . 213.5. External galaxies . . . . . . . . . . . . . . . . . . . . . . . . . . . . . . . . . . . . . . . . . . . . . . . . . . . . . . . . . . . . . . . . . . . . . . . . . . . . . . . . . . . . . . . . 22
4. CHEMICAL DIFFERENTIATION IN THE ENVIRONMENTS OF STAR FORMATION .. . . . . . . . . . . . . . . . . 224.1. Sgr B2(N): the impact of cosmic rays and an extended reservoir of COMs . . . . . . . . . . . . . . . . . . . . . . . . . . . 234.2. Orion KL: chemical impact of a past explosion . . . . . . . . . . . . . . . . . . . . . . . . . . . . . . . . . . . . . . . . . . . . . . . . . . . . . . . . 244.3. Chemical differentiation in other hot cores . . . . . . . . . . . . . . . . . . . . . . . . . . . . . . . . . . . . . . . . . . . . . . . . . . . . . . . . . . . . . 264.4. Spatial differentiation in IRAS 16293-2422 . . . . . . . . . . . . . . . . . . . . . . . . . . . . . . . . . . . . . . . . . . . . . . . . . . . . . . . . . . . . . 28
5. LINKING THE PHYSICAL AND CHEMICAL EVOLUTION OF PROTOSTARS. . . . . . . . . . . . . . . . . . . . . . . . . . 285.1. Chemical changes in the transitions from envelopes to disks . . . . . . . . . . . . . . . . . . . . . . . . . . . . . . . . . . . . . . . . . . 295.2. The physical/chemical structure of embedded disks . . . . . . . . . . . . . . . . . . . . . . . . . . . . . . . . . . . . . . . . . . . . . . . . . . . 305.3. Episodic accretion and snowlines in protostellar envelopes. . . . . . . . . . . . . . . . . . . . . . . . . . . . . . . . . . . . . . . . . . . . . 315.4. Summary . . . . . . . . . . . . . . . . . . . . . . . . . . . . . . . . . . . . . . . . . . . . . . . . . . . . . . . . . . . . . . . . . . . . . . . . . . . . . . . . . . . . . . . . . . . . . . . . 33
6. FRACTIONATION .. . . . . . . . . . . . . . . . . . . . . . . . . . . . . . . . . . . . . . . . . . . . . . . . . . . . . . . . . . . . . . . . . . . . . . . . . . . . . . . . . . . . . . . . . . 346.1. Water . . . . . . . . . . . . . . . . . . . . . . . . . . . . . . . . . . . . . . . . . . . . . . . . . . . . . . . . . . . . . . . . . . . . . . . . . . . . . . . . . . . . . . . . . . . . . . . . . . . . 356.2. Complex organics . . . . . . . . . . . . . . . . . . . . . . . . . . . . . . . . . . . . . . . . . . . . . . . . . . . . . . . . . . . . . . . . . . . . . . . . . . . . . . . . . . . . . . . 38
7. ORIGIN AND EVOLUTION OF CHEMICAL COMPLEXITY . . . . . . . . . . . . . . . . . . . . . . . . . . . . . . . . . . . . . . . . . . . . . . 407.1. Similarities and differences between IRAS16293B, Sgr B2(N2) and Comet 67P/C-G . . . . . . . . . . . . . . . . 407.2. A wider census of oxygen- and nitrogen-bearing species in star forming environments . . . . . . . . . . . . . . . 43
A. Molecular abundances . . . . . . . . . . . . . . . . . . . . . . . . . . . . . . . . . . . . . . . . . . . . . . . . . . . . . . . . . . . . . . . . . . . . . . . . . . . . . . . . . . . . . . . . 46
1. INTRODUCTION
1.1. Motivation
The environments in which young stars form show a rich and varied chemistry. In fact, most
of the molecules detected in the interstellar medium (ISM) to date have first been found in
these regions – whether in the cold starless/prestellar cores or in the warm gas surrounding
young stars of high or low masses. These species range all the way from simple di- and
tri-atomic neutral molecules, molecular radicals and ions to complex molecules. The latter,
some with ten atoms or more, include species containing long unsaturated chains of carbon
atoms as well as saturated organics that can be considered the starting points for eventual
prebiotic chemistry. The chemical networks describing the formation and destruction paths
for these different species are strongly dependent on the underlying physical evolution of the
star formation processes, such as the changes in density, temperature, and spectral shape
and intensity of irradiation.
2 Jørgensen et al.
Although molecules of varying degrees of complexity have also been detected in other
regions including the envelopes around evolved stars, photodissociation regions, well-
developed protoplanetary disks around Class II young stellar objects/T Tauri stars, and
even in distant galaxies, the chemistry in prestellar cores of molecular clouds and em-
bedded protostellar stages is critical. These stages provide key laboratories for molecular
astrophysics: through the high column densities characteristic of these regions we have by
far the most complete molecular inventories of those, including censuses of low-abundance
organics and their isotopologs. Also, these stages are likely pivotal for linking the birth
environments of young stars and the initial conditions in the emerging protoplanetary disks
in terms of both their physics and chemistry.
However, these sources also illustrate some of the major challenges in terms of under-
standing astrochemistry. In particular, recent observations with significant improvements
in sensitivity and spatial resolution have revealed that complex chemistry is taking place in
a wider range of the physical components of young protostars than considered previously
(Fig. 1). Understanding how the physical structure and evolution of young protostars in-
fluences the degree of molecular complexity that arises in their envelopes and disks, and
how this may further influence chemical composition during the later planet-forming stages,
remain some of the key challenges for astrochemistry.
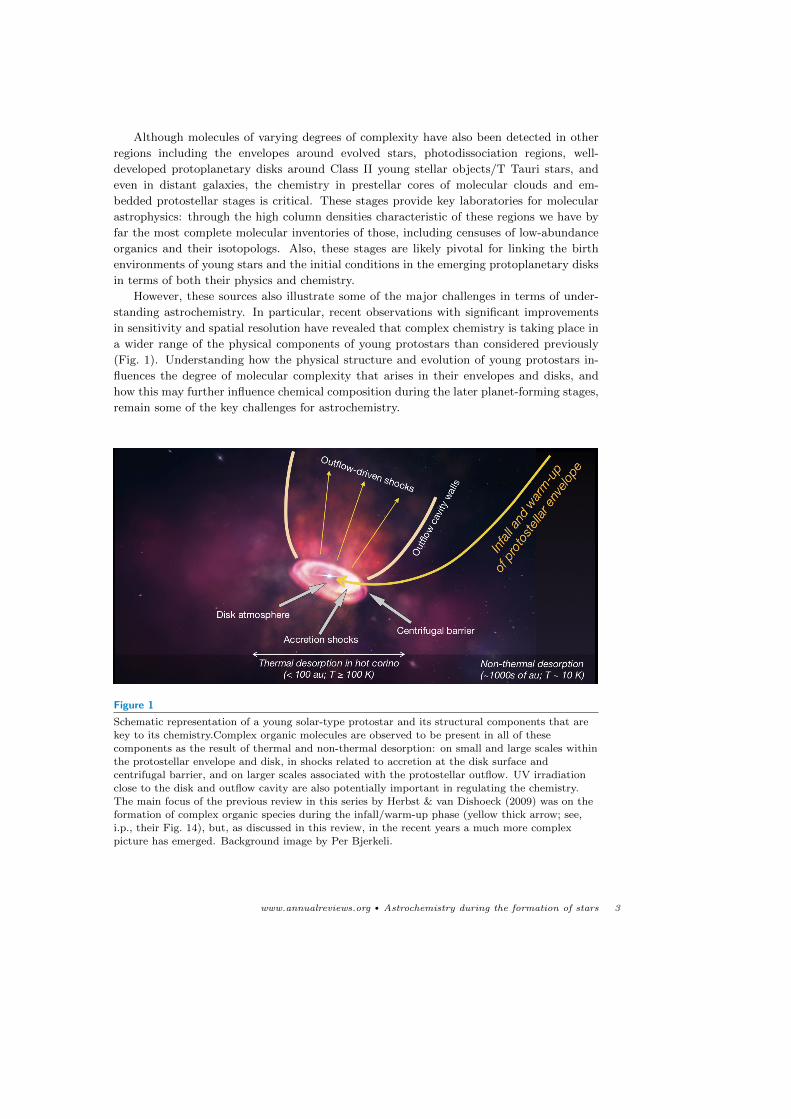
Figure 1
Schematic representation of a young solar-type protostar and its structural components that arekey to its chemistry.Complex organic molecules are observed to be present in all of these
components as the result of thermal and non-thermal desorption: on small and large scales within
the protostellar envelope and disk, in shocks related to accretion at the disk surface andcentrifugal barrier, and on larger scales associated with the protostellar outflow. UV irradiation
close to the disk and outflow cavity are also potentially important in regulating the chemistry.The main focus of the previous review in this series by Herbst & van Dishoeck (2009) was on the
formation of complex organic species during the infall/warm-up phase (yellow thick arrow; see,
i.p., their Fig. 14), but, as discussed in this review, in the recent years a much more complexpicture has emerged. Background image by Per Bjerkeli.
www.annualreviews.org • Astrochemistry during the formation of stars 3

1.2. Star formation and astrochemistry
The canonical scenario for the formation of a solar-type protostar starts at low temperatures
of ∼ 10 K at densities of 103 − 104 cm−3 with the formation of a dense prestellar core in
a giant molecular cloud. In the denser parts of such cores, gaseous molecules collide with
and stick to the surfaces of dust grains during their earliest stages and cold gas-phase
chemistry will lead to abundance enhancements of, e.g., deuterium-containing molecules
through fractionation. Star formation occurs when these cores collapse, leading to the
formation of an opaque (second) hydrostatic core. Further infall leads to the release of
gravitational potential energy heating the infalling envelope of dust and gas to temperatures
of tens or hundreds of K, while the densities increase to ∼ 108 − 109 cm−3 in the inner
∼100 au regions around the central protostar. As the temperatures increase above 100 K,
the water-rich ice mantles sublimate, injecting molecules into the gas phase – giving rise
to the so-called hot corino regions at high temperatures and densities, rich in saturated
complex organics. These are also the scales at which protoplanetary disks are expected
to arise owing to the conservation of angular momentum, a process that also leads to the
launching of outflows and jets. While the overall physical evolution for high-mass stars
through these stages is clearly more complex, many of the overall characteristics can be
identified, including the extended hot cores with elevated temperatures where complex
organics are present in some cases. Due to the high column densities of warm material,
many of the first detections of complex organic molecules (COMs)1 were made toward these
high-mass regions.
The topic of astrochemistry and its link to star formation has been the subject of
previous reviews in this journal.2 Van Dishoeck & Blake 1998 focused on the overall chemical
evolution of star forming regions that at the time had come within reach through advances
in (sub)millimeter wavelength single-dish telescopes, space-borne infrared telescopes, and
previous generations of millimeter-wavelength interferometers. These efforts underlined the
importance of molecular astrophysics as a tracer of the physical changes taking place during
the star formation process. This includes the freeze-out of molecules on the surfaces of dust
grains, the resulting grain-surface chemistry leading to more complex species, and eventually
the release of those into the gas phase during the collapse due to thermal desorption close to
young stars or in outflow driven shocks – or their incorporation into protoplanetary disks.
A decade later, dedicated observational efforts, laboratory studies, and sophisticated
gas-phase and grain-surface chemical models had shifted the focus from the relatively simple
species to the formation of COMs – the subject of the review by Herbst & van Dishoeck
(2009). Extensive observations of hot cores had provided the first unbiased surveys providing
1We keep the definition proposed by Herbst & van Dishoeck (2009) and widely used in the com-munity: a COM is a carbon-bearing molecule that has at least six atoms. Alternative names suchas large astronomical molecule (LAM) or interstellar complex organic molecule (iCOM) have beenproposed in the past decade but, as long as the context (astrochemistry, not biology or chemistry)is clear and the definition is stated, the term COM is adequate.
2In addition to the mentioned reviews from this journal, it is worth pointing out a numberof reviews from the past decade: Tielens (2013) described the physical and chemical processesgoverning the formation and evolution of molecules in the interstellar medium, Caselli & Ceccarelli(2012) and Ceccarelli et al. (2014) addressed the link between astrochemistry in star forming regionsand the Solar System, Boogert, Gerakines & Whittet (2015) discussed observations of ices, andvan Dishoeck et al. (2014) investigated the water trail through the star formation process. Areview on recent developments in mm/submm laboratory spectroscopy in support of observationalastrochemistry was presented by Widicus Weaver (2019).
4 Jørgensen et al.

complete censuses of the molecular line content of individual high-mass protostars covering
wide spectral ranges of the windows where the atmosphere is mostly transparent, as well
as systematic, more focused, inventories of networks of species toward groups of sources.
Targeted observations of low-mass protostars had started revealing the rich chemistries of
these sources as well – including the detections of saturated complex organics in the inner
envelopes of deeply embedded protostars as well as in shocks associated with their outflows.
Today, yet another decade later, gigantic steps forward have been taken due to the
systematic molecular studies at THz frequencies by the Herschel Space Observatory (Her-
schel), significant upgrades to many (sub)millimeter wavelength single-dish telescopes and
interferometers especially in terms of the receivers and correlators, and, in particular, the
advent of the Atacama Large Millimeter/submillimeter Array (ALMA) that has pushed
molecular astrophysics studies by orders of magnitude in sensitivity and spatial resolution.
1.3. Outline of this paper
In this review, we focus on the complex chemistry taking place from the point where star
formation is initiated by the formation of dense (prestellar) cores, through their collapse
to form young protostars and their circumstellar disks. We describe the opportunities and
challenges encountered with recent advances in observations, modeling, and laboratory ex-
periments (Sect. 2) and provide an overview of detections of complex molecules in different
environments (Sect. 3). This is followed by discussions of the importance of the physical
conditions on the chemistry reflecting both the non-homogeneous conditions in star forming
environments (Sect. 4) and the changes occurring during the formation and early evolution
of stars (Sect. 5). The final two sections focus on constraints on the formation of com-
plex organic molecules and the link between star forming environments and our own Solar
System. Specifically, we describe the insights that can be obtained by studies of isotopic
fractionation (Sect. 6) and by comparing systematic chemical inventories across samples
of sources to measurements from our own Solar System and the predictions from models
(Sect. 7).
2. RECENT ADVANCES AND NEW CHALLENGES
2.1. Advances in observational techniques
Significant advances within astrochemistry have been made over the past decade thanks to
new telescopes and improvements in instrumentation at existing facilities. The key features
offered by these facilities are (i) the improvement in the large instantaneous bandwidths
covered with high spectral resolution by individual instruments, (ii) the sensitivity offered
by large apertures and excellent observation sites, (iii) improved spatial resolution with,
in particular, combined array antennas, and (iv) coverage of high frequency windows in
the far-infrared with high spectral resolution using space-based telescopes such as Herschel
and the Stratospheric Observatory for Infrared Astronomy (SOFIA). Each of these aspects
provides new opportunities as well as challenges.
2.1.1. Increase of instantaneous bandwidth at many observational facilities. One of the
key aspects of Herschel and ALMA as well as upgrades of receivers and correlators on
facilities such as the Atacama Pathfinder EXperiment (APEX), the Institut de Radioas-
tronomie Millimetrique (IRAM) 30 m telescope, the NOrthern Extended Millimeter Array
www.annualreviews.org • Astrochemistry during the formation of stars 5

New facilities
The three main new facilities for studies of star forming regions that have started operations in the past
decade are:
• ALMA: 66 telescope array operating at submillimeter wavelengths. ALMA has
demonstrated its metier for high resolution, high sensitivity imaging of the distribu-
tion of molecules in star-forming regions both near and far (2011–).
• Herschel : 3.5 m space-based observatory operating at far-IR (THz) wavelengths.
Key contributions concern the presence of water and organics in star forming regions
(2009–2013).
• SOFIA: 2.5 m airborne telescope that gives access to far-IR windows not observable
from the ground, and in particular to important cooling lines of the ISM (2010–).
(NOEMA), and the Submillimeter Array (SMA), has been the increase in instantaneous
bandwidth obtainable while keeping a relatively high spectral resolution. This is particu-
larly important for performing unbiased spectral surveys covering large frequency ranges.
For example, the “Herschel observations of EXtra-Ordinary Sources (HEXOS)” survey of
Orion performed a spectral scan from 480 to 1907 GHz (with two small gaps) with 1.1 MHz
spectral resolution and identified more than 13,000 spectral lines, i.e., 10 lines per GHz
(Crockett et al. 2014). From ALMA the “Exploring Molecular Complexity with ALMA”
(EMoCA) survey of the high-mass star forming region Sgr B2(N) (Belloche et al. 2016)
and the “Protostellar Interferometric Line Survey” (PILS) of the nearby low-mass proto-
star IRAS 16293–2422 (Jørgensen et al. 2016) have been the main unbiased studies. The
high angular resolution of EMoCA revealed that the secondary hot core Sgr B2(N2), with
about 6500 lines detected above 7σ between 84 and 114 GHz (about 220 lines per GHz),
has narrow lines (∼ 5 km s−1) compared to the lines measured with single-dish telescopes
toward Sgr B2(N). This reduction in spectral confusion was decisive for the identification
of new species. The main component of PILS was a systematic survey of the 329–363 GHz
range of ALMA’s Band 7 at 0.25 km s−1 spectral resolution (see Fig. 2). With the narrow
lines (∼ 1 km s−1) at selected positions toward the protostellar system the line confusion
is reached at low levels and more than 10,000 lines above 5σ can be identified (about 300
lines per GHz).
The key advantage of the large bandwidth lies in the possibility for identifications of
new species as well as accurate modeling of line emission leading to robust derivations of
excitation temperatures and column densities. In particular, secure identifications of new
species need a high number of well-isolated lines that can be assigned and modeled (see
Sect. 2.2). Furthermore, with access to larger bandwidths, the range of energy levels and
line strengths covered by individual species provides highly accurate constraints on their
excitation. With of order 15–20 identified lines, the typical uncertainties on excitation
temperatures and column densities become less than 10–20% when local thermodynamic
equilibrium (LTE) can be assumed (e.g., Jørgensen et al. 2018). Laboratory astrophysics has
also benefited from these technical developments (see Widicus Weaver 2019, and references
therein). New spectrometers with large bandwidths are starting to be used in the laboratory
6 Jørgensen et al.
IRAS 16293–2422
IRAS16293A IRAS16293B
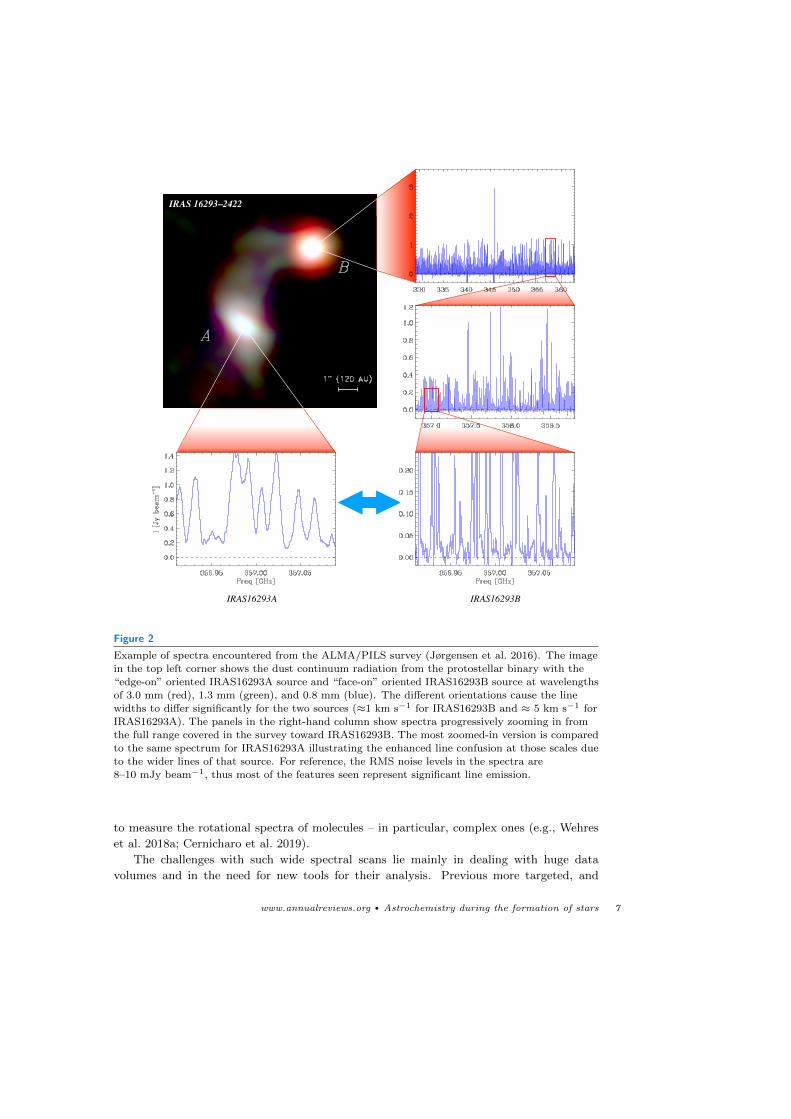
Figure 2
Example of spectra encountered from the ALMA/PILS survey (Jørgensen et al. 2016). The image
in the top left corner shows the dust continuum radiation from the protostellar binary with the“edge-on” oriented IRAS16293A source and “face-on” oriented IRAS16293B source at wavelengths
of 3.0 mm (red), 1.3 mm (green), and 0.8 mm (blue). The different orientations cause the line
widths to differ significantly for the two sources (≈1 km s−1 for IRAS16293B and ≈ 5 km s−1 forIRAS16293A). The panels in the right-hand column show spectra progressively zooming in from
the full range covered in the survey toward IRAS16293B. The most zoomed-in version is compared
to the same spectrum for IRAS16293A illustrating the enhanced line confusion at those scales dueto the wider lines of that source. For reference, the RMS noise levels in the spectra are
8–10 mJy beam−1, thus most of the features seen represent significant line emission.
to measure the rotational spectra of molecules – in particular, complex ones (e.g., Wehres
et al. 2018a; Cernicharo et al. 2019).
The challenges with such wide spectral scans lie mainly in dealing with huge data
volumes and in the need for new tools for their analysis. Previous more targeted, and
www.annualreviews.org • Astrochemistry during the formation of stars 7

lower sensitivity, studies typically only picked up (at most) some handfuls of lines of an
individual species. In those cases classical rotation diagram methods worked well, because
one could deal practically with separating and fitting individual lines. However, in the
larger, typically more confused, spectra, it is often more useful to fit the entire observed
spectrum using synthetic models (see Fig. 3 for examples). Such models predict the full
spectra under, e.g., the LTE assumption, taking into account optical depth of individual
lines specifically – and accounting for multiple molecular species at once, thus implicitly
sorting out chance alignments, line blends and, also importantly, testing for non-detections
(see also Sect. 2.2).
2.1.2. Improvements in sensitivity. Another important aspect of the telescope advances
with Herschel and ALMA has been the significant improvements in sensitivity, both due to
the increased collecting area compared to previous facilities as well as (for ALMA) the excel-
lent conditions on the telescope site. This improvement enables more statistical approaches
to astrochemical studies, whether in terms of the ranges of lines and species observed for
individual sources or in terms of targeting larger samples of sources. In particular, the
latter makes it possible to determine the degree to which variations in molecular emission
signatures for different sources are caused by the influence of, e.g., physical conditions (the
impact of the external radiation field, variations in cosmic-ray flux, degree of turbulence
etc.) on the resulting chemistry.
Moving into this new sensitivity regime also brings new challenges. One example is
that the line-confusion limit is now reached also for sources that were relatively line-poor in
shallower surveys. A spectrum has reached the confusion limit when emission from spectral
lines is detected in basically every single spectral channel (see, e.g., the 1.3 mm single-
dish spectra toward Sgr B2(N) of Belloche et al. 2013), implying that a longer integration
time with the same telescope would not bring any new information. This issue becomes
more severe at higher frequencies because the spectral line density of a mixture of COMs
is expected to be relatively uniform in frequency space. The linewidth in frequency space
is, however, increasing with frequency (in astronomical spectra the linewidth is expected
to be constant in velocity space) and therefore the likelihood of line overlaps, and thereby
confusion, in line-rich sources increases with frequency as well.
Reaching the confusion limit raises some practical problems: in particular if the observed
angular resolution is coarse compared to the kinematical structure of the source it becomes
difficult, if not impossible, to estimate the underlying continuum emission (see, e.g., bottom
left panel of Fig. 2). Rather than subtracting the continuum based on line-free channels
before performing Fourier transforms and cleaning of the interferometric data, one either
needs to take the continuum into account in the synthetic spectrum modeling or define
the continuum by fitting the flux distributions pixel-by-pixel in the imaged datacubes (see
Sanchez-Monge et al. 2018 and Jørgensen et al. 2016 for example methodologies). While
the former has the advantage of most closely resembling the actual data with minimum
tinkering, it is often impractical – in particular, if the spatial distribution of molecular line
emission is considered for line-rich sources.
Several strategies can be adopted to beat the spectral confusion limit in order to detect
species that have a low abundance or weak lines. Observations at higher angular resolution
can reveal regions with smaller velocity dispersion or separate sources that have different
systemic velocities and were blended in larger beams. This strategy led to significant ad-
vances for instance in Sgr B2(N) (Belloche et al. 2016, 2019) or IRAS 16293 (Jørgensen
8 Jørgensen et al.

Table 1 List of molecules mentioned in this review with more than three atoms.
Species Formula Species Formula
Acetaldehyde CH3CHO Glyoxal HC(O)CHO
Acetamide CH3C(O)NH2 Hydroxylamine NH2OH
Acetic acid CH3COOH Isocyanic acid HNCO
Acetone CH3C(O)CH3 Methane CH4
Ammonia NH3 Methanimine CH2NH
Benzene c-C6H6 Methanol CH3OH
Benzonitrile c-C6H5CN Methoxymethanol CH3OCH2OH
Butyl cyanide C4H9CN Methyl acetylene CH3CCH
Cyanoacetylene HC3N Methyl amine CH3NH2
Cyanodiacetylene HC5N Methyl chloride CH3Cl
Cyanoformaldehyde NCCHO Methyl cyanide CH3CN
Cyanomethanimine NHCHCN Methyl formate CH3OCHO
Cyanomethyl radical CH2CN Nitrous acid HONO
Cyclopropenone c-H2C3O Propanal C2H5CHO
Dimethyl ether CH3OCH3 Propanol C3H7OH
Ethanimine CH3CHNH Propenal C2H3CHO
Ethanol C2H5OH Propyl cyanide C3H7CN
Ethylene glycol (CH2OH)2 Propylene oxide c-CH(CH3)CH2O
Formaldehyde H2CO Quinoline C9H7N
Formamide NH2CHO Thioformaldehyde H2CS
Formic acid HCOOH Vinyl cyanide C2H3CN
Glycolaldehyde CH2(OH)CHO Urea NH2C(O)NH2
Glycolonitrile HOCH2CN
et al. 2016). Finding sources with intrinsically narrow linewidths is another promising av-
enue that is illustrated, for example, by the recent detection of methoxymethanol3 in the
hot core MM1 of NGC 6334I (McGuire et al. 2017).
Finally, going to lower frequency where the spectral confusion is less severe is another
option, provided that the emission lines are still strong enough to be detected. IRAM has
started to explore frequencies below 80 GHz (down to 70 GHz with NOEMA and 73 GHz
with the 30-m telescope), and Bands 1 and 2 of ALMA will be valuable in this respect in the
near future. COMs have been detected at even lower frequencies, for instance propanal and
benzonitrile with the GBT (Hollis et al. 2004a; McGuire et al. 2018). While confusion is not
(yet) an issue at these low frequencies, the difficulty lies in the excitation of the molecules
that does not follow LTE in the environments probed by these observations. Collision rate
coefficients are not available for many COMs, making a reliable estimate of their column
densities under such conditions a challenge. However, recent progress has been made in
this respect for, e.g., methyl formate and methanimine (Faure et al. 2014; Faure, Lique &
Remijan 2018).
2.1.3. Increased spatial resolution. ALMA has clearly pushed observations at submillimeter
wavelengths to a new regime with its high angular resolution and sensitivity providing
images of dust and gas with a resolution of 0.01′′, corresponding to few au scales in nearby
3See Table 1 for a list of the names and formulae for molecules discussed in this review.
www.annualreviews.org • Astrochemistry during the formation of stars 9

star forming regions. Even in ALMA’s intermediate baseline configurations, the achieved
angular resolution of≈0.1′′ represents an improvement by a factor 5–10 in angular resolution
compared to what is typically achieved at other facilities. Besides helping with issues such
as line confusion described above, the advantages of imaging at these spatial scales are
obvious: it makes it possible to look at the spatial coincidences and separations between
different species and thereby reveal their chemical relations and their link to the underlying
source physical structures.
One challenge encountered in high-resolution studies of low- and high-mass protostars
comes from the optical thickness of the observed line and continuum emission. Many
sources show unresolved continuum structures that become optically thick, in particular,
in the higher-frequency ALMA bands. The continuum optical thickness may, for example,
suppress the line emission on protostellar disk scales (e.g., Harsono et al. 2018). These
effects made it necessary for the PILS and ReMoCA surveys to focus on positions offset
from the main continuum peaks to derive reliable column densities.
2.2. Spectroscopic identifications of new species
There are a number of considerations to make when reporting detections of new species or
presenting derivations of their physical/chemical characteristics. This is becoming partic-
ularly important with the new sensitive observations, where line-rich spectra of individual
sources are often revealed serendipitously.
2.2.1. Considerations for new detections. While it may be uncontroversial to report the
detection of a common species toward sources belonging to a well-studied group, more
care needs to be taken with an exotic claim (such as a completely new species or the
detection of a species toward a type of region where it has not previously been seen). In
the former case, it is often sufficient just to note the rest frequency of the species from
common spectroscopic references, but in the latter case a range of transitions is required to
be measured independently. The number of transitions needed for a secure claim strongly
depends on the spectral line density (see Neill et al. 2012; Halfen et al. 2006).
For new detections, a number of other criteria should be fulfilled as well: the line widths
and local-standard-of-rest (LSR) velocities of all transitions of a given species have to be
consistent or, if they vary (for example, as a function of energy level), an explanation needs
to be provided (obviously an interesting scientific result in its own right). Likewise it is
critical to check that the column density and/or excitation temperature derived based on
the measured transitions do not predict other transitions to be present across the observed
spectral ranges where they are not seen, e.g., from lines of higher intrinsic strengths or
more favorable energy levels. Chance alignments from transitions of other (more common)
species should also be checked. In particular, in the ALMA era it is often found that
even fairly high energy levels of common organic molecules can be populated (including
rotational levels in vibrationally or torsionally excited states) that can lead to serious false
identifications. To fulfill all these criteria, especially in the case of hot cores or corinos, a
recommended approach is to fit a complete spectral survey with a synthetic spectrum that
accounts for all identified molecules rather than rely on simple independent Gaussian fits of
individual lines of a given species. The formalism behind such synthetic spectra is described
in Moller, Endres & Schilke (2017) and a number of publicly available tools are available
to calculate them (e.g., CASSIS, XCLASS, Weeds, and MADCUBA). Details about basic
10 Jørgensen et al.

radiative transfer equations and the derivation of column densities can be found in, e.g.,
Goldsmith & Langer (1999) and Mangum & Shirley (2015).
An often overlooked aspect is the impact of continuum emission on small scales: the
presence of high column densities of dust on small scales can introduce frequency-dependent
continuum opacity significantly altering the intensities of observed molecular transitions if
split over multiple bands. The strength of the continuum emission may also be such that
the corresponding “background” temperature terms in the equation of radiative transfer
cannot be neglected (see, e.g., Sect. 4.4 of Belloche et al. 2019). Also, these effects strongly
affect the use of traditional methods such as population diagrams that typically assume a
negligible amount of background radiation (see Goldsmith & Langer 1999, for details about
population diagrams).
Finally, the spectroscopic reference needs to be evaluated in terms of the ac-
curacy of the listed frequencies and any extrapolations from laboratory measure-
ments (see Fig. 3 and Sect. 2.2.3). We encourage astronomers to inspect the
documentation for individual species in the spectroscopic databases such as the
Cologne Database for Molecular Spectroscopy (CDMS; Muller et al. 2001, 2005) and
Jet Propulsion Laboratory’s database for molecular spectroscopy (JPL; Pickett et al. 1998)
and cite the relevant spectroscopic studies, and spectroscopists to make their measurements
and associated predictions as well as partition functions available in such databases in order
to increase the impact of their work in the astrochemical community.
2.2.2. Reporting physical properties. Both in the context of new detections, and when
reporting properties from line emission for other species, there is also a range of issues
that need to be considered and reported. Exact positions, beam sizes, and, in the case of
interferometric observations of extended structures, spatial sensitivity – in terms of (u, v)-
coverage – obviously belong to such critical information. For constraints on the column
densities of the emission, it is important to consider the source size in comparison to the
angular resolution of the observations. In mapping observations, this involves a comment
about the distribution of the material (i.e. whether it is Gaussian or homogeneous with
respect to the beam) and whether the column density is estimated from a single position
or pixel (where the measured flux density in janskys per beam can be translated into an
effective radiation temperature in kelvins) or whether an integration over a larger area is
adopted (where the beam-to-pixel size ratio also needs to be taken into account).
As mentioned above, when constructing a model for the excitation of a given molecule,
the important physical parameters besides the column density and excitation temperature
are the systemic velocity and line width. In particular, the latter – together with the
assumed extent – is important when considering possible optical depth effects. On the
scales routinely probed with ALMA, many lines of the main isotopologs (and in some cases
even less abundant isotopologs; Jørgensen et al. 2018) become optically thick. In those
cases, it is often possible to obtain apparently good fits in population diagrams, but if those
lines in reality are optically thick then no constraints are obtained on the actual column
densities. For such species it is therefore critical to seek additional constraints to confirm
which lines are optically thin – either by looking at rarer variants or studying transitions
with lower line strengths – when constraining their column densities.
It is also important to consider whether or not local thermodynamic equilibrium (LTE)
is a reasonable approximation, i.e., whether the densities of the main collision partners
(typically H2) in the region are sufficiently high that the excitation of a molecule is collision-
www.annualreviews.org • Astrochemistry during the formation of stars 11
dominated. In hot corinos and cores where the densities exceed 107–108 cm−3, LTE is often
achieved for most species and transitions of interest, but in more tenuous environments
(e.g., prestellar and translucent cores, outflow regions) this is not necessarily the case. It
is also worth keeping in mind that while LTE may work well at high frequencies (e.g., at
submillimeter wavelengths) for a given source, this may not be the case for the same source
at lower frequencies (e.g., centimeter wavelengths) if the observations trace more extended
emission. In the case of non-LTE excitation it becomes even more problematic to trust the
assignments of lines and thus claims of detections and properties of a given species. This
issue may outweigh the advantage that the line confusion at longer wavelengths may be
lower.
For species excited to temperatures of 100–150 K or above it is important to note
whether the partition function associated with a given spectroscopic entry includes the
vibrational contribution or whether it is purely rotational. In the latter case, vibrational
corrections need to be applied to derive the full column density of the molecule (see, e.g.,
Sect. 5 of Margules et al. 2017).
A final consideration is whether column densities or abundances are reported for the
modeled species. Abundances are very often referenced relative to the column density of
H2, as estimated from the dust continuum or CO gas-phase lines. However, such estimates
may be problematic (e.g., due to different spatial distributions of CO and the targeted
species) or highly model-dependent (e.g., the dust temperature and assumed dust opacity
law). Often it is helpful to focus on the relation between a given species and its possible
chemical precursor, but again here care must be taken that the choice of reference species
does not introduce spurious correlations, e.g., due to assumptions about the excitation or
the line optical thickness of the reference species.
2.2.3. The importance of laboratory spectroscopy. The identification of interstellar COMs
rely heavily on the accuracy of frequencies and line strengths derived from the analysis
of laboratory measurements (see review by Widicus Weaver 2019). The complexity of the
COM Hamiltonians due to, e.g., internal rotation, makes extrapolations beyond the range
of frequencies measured in the laboratory uncertain or even unreliable. With the new era
of sensitive spectral broadband datasets at submillimeter wavelengths, laboratory measure-
ments at high frequencies are becoming even more crucial. The spectroscopy community
has already begun to extend the spectral characterization of a number of COMs into the
submm domain (e.g., Wehres et al. 2018b; Kolesnikova et al. 2018; Motiyenko et al. 2019).
But even the extension of the spectroscopy of COMs from the cm range, investigated several
decades ago, to the mm range already represents significant progress (e.g., Cernicharo et al.
2016; Alonso et al. 2016; Martin-Drumel et al. 2019).
A more accurate characterization of the Hamiltonian of COMs with advanced modeling
codes is also critical: the identification of new interstellar COMs with low abundance re-
quires a good knowledge of the complete spectra of more abundant, known, COMs – that
is, not only their strongest lines, but also the weaker ones. The recent progress made with,
for example, C2H5OH (e.g., Muller et al. 2016a) or CH3C(O)CH3 (e.g., Ordu et al. 2019)
illustrates how critical this is (see Fig. 3). There is also a strong need to characterize the
rotational spectrum of COMs in their vibrationally excited states (e.g., Muller et al. 2016b;
Degli Esposti et al. 2017), and of their isotopologs (e.g., Margules et al. 2016; Zakharenko
et al. 2019), to advance the line identification of astronomical spectra.
12 Jørgensen et al.
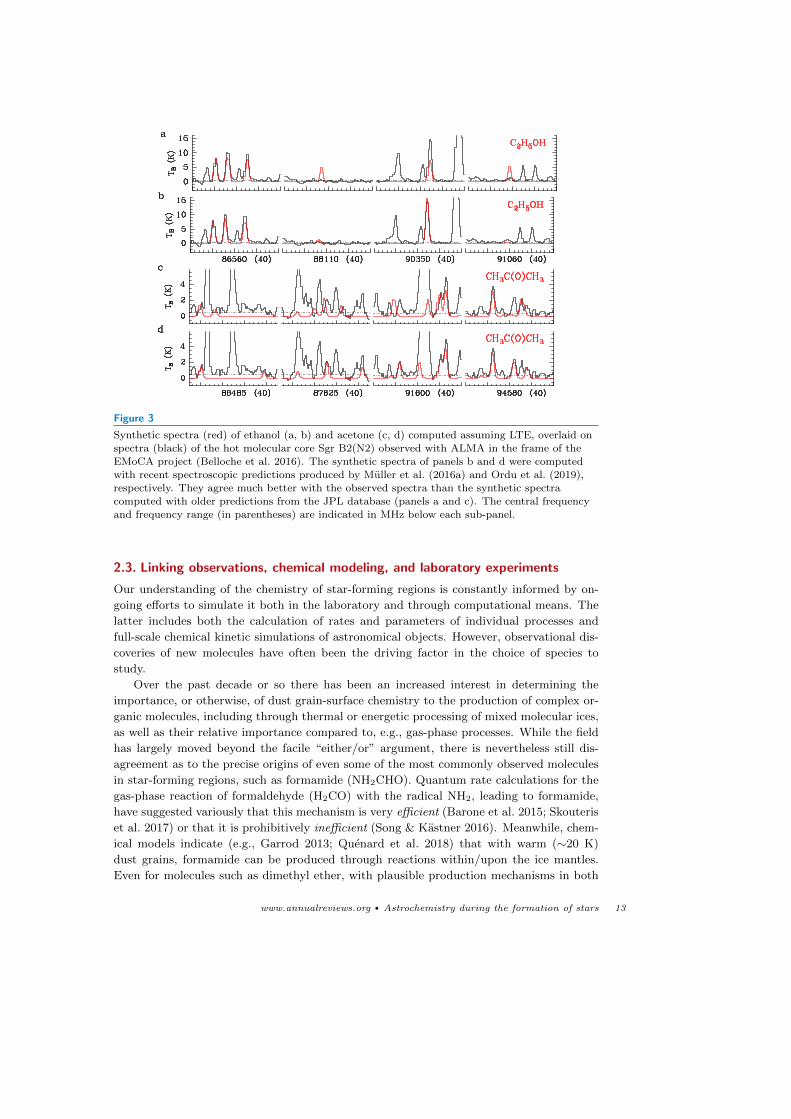
Figure 3
Synthetic spectra (red) of ethanol (a, b) and acetone (c, d) computed assuming LTE, overlaid on
spectra (black) of the hot molecular core Sgr B2(N2) observed with ALMA in the frame of theEMoCA project (Belloche et al. 2016). The synthetic spectra of panels b and d were computed
with recent spectroscopic predictions produced by Muller et al. (2016a) and Ordu et al. (2019),
respectively. They agree much better with the observed spectra than the synthetic spectracomputed with older predictions from the JPL database (panels a and c). The central frequency
and frequency range (in parentheses) are indicated in MHz below each sub-panel.
2.3. Linking observations, chemical modeling, and laboratory experiments
Our understanding of the chemistry of star-forming regions is constantly informed by on-
going efforts to simulate it both in the laboratory and through computational means. The
latter includes both the calculation of rates and parameters of individual processes and
full-scale chemical kinetic simulations of astronomical objects. However, observational dis-
coveries of new molecules have often been the driving factor in the choice of species to
study.
Over the past decade or so there has been an increased interest in determining the
importance, or otherwise, of dust grain-surface chemistry to the production of complex or-
ganic molecules, including through thermal or energetic processing of mixed molecular ices,
as well as their relative importance compared to, e.g., gas-phase processes. While the field
has largely moved beyond the facile “either/or” argument, there is nevertheless still dis-
agreement as to the precise origins of even some of the most commonly observed molecules
in star-forming regions, such as formamide (NH2CHO). Quantum rate calculations for the
gas-phase reaction of formaldehyde (H2CO) with the radical NH2, leading to formamide,
have suggested variously that this mechanism is very efficient (Barone et al. 2015; Skouteris
et al. 2017) or that it is prohibitively inefficient (Song & Kastner 2016). Meanwhile, chem-
ical models indicate (e.g., Garrod 2013; Quenard et al. 2018) that with warm (∼20 K)
dust grains, formamide can be produced through reactions within/upon the ice mantles.
Even for molecules such as dimethyl ether, with plausible production mechanisms in both
www.annualreviews.org • Astrochemistry during the formation of stars 13
the gas phase and on grains (see Fig. 4), the relative contributions may also be dependent
on the interaction of large-scale physical conditions like temperature with molecule-specific
microscopic quantities such as binding energies. Thus, it is likely that there is no blanket
description that applies equally well to all COMs, even within a single astronomical source.
The chemistry of star-forming regions may perhaps be best described as an intrinsically
well-coupled gas-grain chemical system. The recent push to explore the limits of both gas
and grain-surface/ice chemistry has led to the investigation of a number of new types of
reaction mechanisms, which may become standard parts of the toolbox for astrochemical
simulations of all kinds.
Radical: A molecularspecies that has an
unpaired
valence-shellelectron, making it
typically very
reactive.
2.3.1. Chemical modeling. Chemical kinetic models of star-forming regions calculate the
time-evolution of chemical abundances, as determined by a network of reactions and pro-
cesses and their rates. The main advances made in this field over the past decade involve
either the improvement or expansion of chemical networks, the detailed treatment of grain-
related chemistry, or the improvement of astrophysical inputs such as density, temperature,
and radiation fields.
Models of complex molecule production in star-forming regions have frequently con-
centrated on high-mass star-forming regions, i.e. hot cores. Since early models of hot-
core chemistry, such as that of Brown, Charnley & Millar (1988), some form of two-stage
physical model has been assumed. In those, the first stage involves the low-temperature
evolution and/or collapse of a molecular cloud core, with the second treating the hot-core
stage proper, with higher densities and temperatures. A major feature of the first stage
involves the build-up of molecular ice mantles on dust grains, composed primarily of sim-
ple hydrides such as H2O, NH3, and CH4, as well as CO, CO2, H2CO, and CH3OH. In
the second stage, these are ejected into the gas phase – either immediately, or gradually,
according to a time-dependent release as temperatures are ramped up to observed values
(Viti & Williams 1999). The thermal ejection of grain-mantle molecules is a major driver
of gas-phase chemistry, through both ion-molecule and neutral-neutral reactions (Charnley,
Tielens & Millar 1992).
2.3.2. Grain-surface chemical treatments. Models with some explicit treatment of grain-
surface chemistry are now fairly standard, due to the need to consider ice evolution. The
use of three-phase models (ice mantle, surface, and gas phase), based on the treatment by
Hasegawa & Herbst (1993), has also become more common. These models treat the upper
ice layer as a separate phase from the underlying bulk, which in some cases is treated as
being chemically active (Garrod 2013). Other models have considered multiple layers within
the bulk (Taquet, Charnley & Sipila 2014). In general, gas-grain models calculate grain-
surface abundances using the same so-called “rate equation” approach as is used for pure
gas-phase chemistry. This method ignores the inherently stochastic nature of the grain-
surface chemistry, and can lead to divergence from numerically-exact treatments. Vasyunin
& Herbst (2013a) successfully constructed a three-phase model that treats both gas and
grain chemistry accurately using a macroscopic Monte Carlo method, followed more recently
by Lu, Chang & Aikawa (2018). Rate-equation models can also be adapted to replicate
stochastic surface chemistry reasonably well, using the modified-rate method (Garrod 2008;
Garrod et al. 2009), although the method has not been widely adopted (Furuya et al. 2015).
Photolysis: Theprocess of
photodissociation of
molecules, andsubsequent
associated
mechanisms, causedby photons typically
at UV/Visiblewavelengths.
Radiolysis: The
ionization, andsubsequent
associated
processing, of atarget material
caused by the
impingement of anionizing particle.
Much modeling work over the past decade has involved the development of chemical
networks for the grain-surface production of COMs. Early grain chemistry networks (Tielens
14 Jørgensen et al.

& Hagen 1982) included mechanisms for the build-up of certain COMs by repetitive atomic
addition, as well as through reactions between radicals (Allen & Robinson 1977). Garrod
& Herbst (2006) presented a model of hot-core chemistry in which the surface mobility,
and thus the reactivity, of radicals on grain surfaces would be enhanced by including the
gradual warm-up of the gas and dust, which had previously been considered only in the
context of the desorption of grain-surface molecules (Viti & Williams 1999; Viti et al.
2004). In these models, radicals are produced largely as the result of photodissociation
(i.e. photolysis) of stable, solid-phase species such as methanol (CH3OH), caused by cosmic
ray-induced UV photons. Reactions between the radical products of methanol dissociation
become prominent at temperatures of 20–40 K resulting in the subsequent formation of
many COMs. Many of those linger on grain surfaces until temperatures upward of 100 K
are reached where they sublimate and become observable in the gas phase. The models
were expanded to include a larger network of radical reactions (Garrod, Widicus Weaver &
Herbst 2008) that was quite successful in providing a basic framework for the production
of many COMs, which has been extended over subsequent years to include newly-detected
species (Garrod et al. 2017; Muller et al. 2016a; Belloche et al. 2017), especially toward Sgr
B2(N).
Importantly for gas-grain models, uncertainties exist in the desorption energies (i.e.
binding energies) and diffusion barriers of many chemical species. The former control the
temperatures at which atoms or molecules may thermally desorb from the dust grains and
into the gas, while the latter determine the rates at which reactive species may migrate on
the grain surfaces through diffusion, allowing them to react (see also Cuppen et al. 2017).
In the case of radicals, both values are often poorly defined by experiment, due to these
reactive species’ short lifetimes. Some grain-surface reactions require a chemical activation
energy barrier to be overcome. Below ∼100 K, many such processes important to astro-
chemistry involve quantum tunneling of H atoms, however, the rates for barrier-mediated
reactions used in chemical networks are often poorly defined. Hydrogen addition to unsat-
urated COMs, which often involves an activation barrier, could be especially important to
interstellar abundances (Alvarez-Barcia et al. 2018; Krim et al. 2018).
The degree of diffusion that can occur within the bulk ice is also uncertain and could
indeed be minimal for species other than H and H2. Although such diffusion is technically
required in the models to allow radical photo-products to react within the bulk, new methods
are emerging to treat those reactions without mediation by diffusion, allowing COMs to be
formed even at very low temperatures (Garrod 2019), in line with experimental evidence
(e.g., Henderson & Gudipati 2015).
The strength of the radical-radical reaction process for COMs is affected both by the
warm-up timescale of the core, and by the rates of ice photodissociation, which scale with
the cosmic-ray ionization rate. These two physical inputs are somewhat degenerate in their
chemical effects. Recent models (e.g., Barger & Garrod 2020) indicate that short warm-up
timescales (on the order of 104 yr) and high cosmic-ray ionization rates (∼10−16 s−1) may
provide the best agreement with observations. Dedicated models of chemistry in individual
cores within Sgr B2(N) (Bonfand et al. 2019; Willis et al. 2019) support the latter finding.
Photodissociation rates of individual solid-phase molecules are also not well constrained by
laboratory data, although they are expected to be lower than equivalent gas-phase processes
by a factor of a few (Kalvans 2018).
Shingledecker et al. (2018) presented a gas-grain model of cosmic ray-induced radiolysis
of interstellar ice mantles. In the case of cosmic rays, the impinging particle (which may
www.annualreviews.org • Astrochemistry during the formation of stars 15

CH3OH + [CH3OH]H+ [CH3OCH3]H+ + H2OCosmic
ray
Energeticsecondary electrons
Dissociation(CH3OH)
Radicaladdition
CH3 + CH3O CH3OCH3
Cosmic-rayradiolysis
UVPhoto-dissociation
(CH3OH)
Radicaladdition
CH3 + CH3O CH3OCH3
UV photolysis
Warm grain/ice mantle Gas-phase chemistry Cold grain/ice mantle
UVPhoto-dissociation(CH3OH)
CH3 + CH3O CH3OCH3
UV
Photo-dissociation(CH3OH)
Surface diffusion
Surface diffusion
Diffusive surface radical chemistry
Thermal desorption
Radicaladdition
Surface diffusion
(H)
Adsorption from gas
(H) CH3 + CH3O CH3OCH3
Non-diffusivesurface radical
chemistry
Non-thermal desorption
Radiative association
CH3 + CH3O CH3OCH3 + hNon-thermal desorption
(CH3OH)
F, Cl, OH
+
+
Thermal desorption
(CH3OH)
+ +
CH3OH + H3+ [CH3OH]H+ + H2Thermal desorption
+Ion-molecule gas-phase chemistry
Non-thermal desorption+
Neutral gas-phase chemistry
Dimethyl ether(CH3OCH3)
production in starforming regions
Electronic recombination
e–
CH3OCH3 + H
Proton transfer
NH3
CH3OCH3 + NH4+
+
Radicaladdition
Figure 4
An illustrative selection of proposed pathways to the formation of the representative COMdimethyl ether, CH3OCH3, in star-forming regions, under either warm or cold conditions. Not all
possible pathways are shown. Each of the processes occurring on cold grains or within cold icemantles could also occur at higher temperatures, although with arguably lower significance. The
warm grains should be assumed to inherit much of the ice-mantle composition of the earlier, cold
dust grains. The cold UV-induced photolysis process implicitly assumes minimal thermal diffusionof dissociation products. The cosmic-ray radiolysis process could also involve “suprathermal”
dissociation products (not shown). UV photolysis and cosmic ray-induced radiolysis may occur
either within the ice mantles or on their surfaces. On the warm grains, surface diffusion of manyradicals is expected to be rapid, but diffusion rates within the ice mantles remain uncertain, and
could also depend on the presence of ice porosity. Gas-phase protonation of, e.g., methanol may
occur by reaction with multiple different molecular ions and not only H+3 . Electronic
recombination of protonated dimethyl ether, [CH3OCH3]H+, is expected to produce dimethyl
ether in no more than 7% of cases (see text), while proton transfer to ammonia (NH3) may bevery efficient.
be an electron, proton, or a heavier atomic nucleus) has far more energy than is required
to produce a single molecular ionization, and the resultant electron will also be capable of
producing further ionization events. The cascade of electrons produced by a single cosmic
ray results in dissociation, excitation, ionization, and recombination of species within the
ice. Shingledecker et al. considered this process as a means of forming COMs in quiescent
interstellar clouds (mostly through reactions between neutral product species, including
radicals), but the mechanism could also plausibly influence COM abundances in actively
star-forming cores (see also Sect. 2.3.4).
16 Jørgensen et al.
2.3.3. Gas-phase mechanisms. Gas-phase production mechanisms for COMs have long
been a part of the chemical networks, and the production of some relatively complex
species through ion-molecule gas-phase chemistry remains uncontroversial. For example,
for dimethyl ether, CH3OCH3 (Fig. 4), the gas-phase reaction of methanol with protonated
methanol (CH3OH+2 ) can lead to the formation of protonated dimethyl ether. This species
can recombine with an electron to produce dimethyl ether in up to 7% of cases, while the re-
mainder of recombinations should result in the fragmentation of the underlying C–O bonds
(Hamberg et al. 2010). Chemical models indicate that the large abundances of gas-phase
methanol, following grain-mantle ejection, could make this process effective enough to ex-
plain dimethyl ether observations in star-forming regions. However, for other molecules,
the inefficient conversion of protonated molecules to a stable, neutral COM via electronic
recombination presents a problem. The main gas-phase destruction mechanism for many
COMs will also be their protonation by small molecular ions, followed by destructive elec-
tronic recombination.
Taquet, Wirstrom & Charnley (2016) proposed a solution to this problem, citing the
reaction of protonated COMs with gas-phase NH3 (following its desorption) as a way to
remove a proton without destroying the underlying COM structure. They also suggest that
gas-phase mechanisms could produce a selection of COMs through ion-molecule chemistry,
with proton-transfer to ammonia being the terminal step. These authors further proposed
that the heating of grains as the result of episodic accretion events in low-mass sources
(see Sect. 5.3) could induce thermal desorption of molecules that would promote gas-phase
chemistry. The formation of methyl formate would proceed via the reaction of protonated
methanol with formic acid, leading to the trans-conformer of protonated methyl formate
(Neill et al. 2011). Further conversion to produce the commonly-observed cis-methyl for-
mate would be required, but the efficiency of the overall process under interstellar conditions
is not well constrained.
There has recently been renewed interest in neutral gas-phase reaction mechanisms for
COM production (prompted by the detection of cold COMs in prestellar cores), especially
those involving radicals. Such mechanisms include radiative association, a process by which
two species react to form a single product that is stabilized by the emission of a photon.
These reactions are inefficient for small-molecule production, but for larger products –
including COMs – the efficiency could be much greater. Calculations by Vuitton et al.
(2012) suggest radiative association is rapid for large hydrocarbon radicals. Vasyunin &
Herbst (2013b) found the radiative association reaction CH3 + CH3O → CH3OCH3 + hν
to be effective under prestellar core conditions. Rates for radiative association are generally
difficult to constrain in the laboratory, so detailed calculations will be required to confirm
the production efficiencies for specific COMs. Balucani, Ceccarelli & Taquet (2015) noted
further that the abstraction of a hydrogen atom from dimethyl ether by Cl and, to a lesser
extent, F atoms – followed by reaction of the resultant radical with an O atom – could
lead to the production of methyl formate itself. Skouteris et al. (2018) recently considered
similar processes beginning with ethanol to form glycolaldehyde, and acetic and formic acid.
Many of the above-mentioned reactive processes have been tested with chemical models
under only a limited set of physical conditions (centered mainly around cold, prestellar core
conditions) and are dependent on the efficient gas-phase production of radicals. However,
this neutral and radical chemistry provides an important new dimension to networks for
COM production and further investigation will be highly valuable.
www.annualreviews.org • Astrochemistry during the formation of stars 17

2.3.4. Laboratory experiments. The production of COMs through the irradiation of mixed
molecular ices has long been an important area of astrochemical research. The relative
influence of cosmic ray-induced ultraviolet/visible irradiation (i.e. photolysis) versus direct
cosmic-ray impingement (i.e. radiolysis) in interstellar COM production continues to be
debated. Complex organics typical of star-forming regions can be produced through either
scheme (Bennett et al. 2007, 2011; Oberg et al. 2009; Oberg 2016). However, the action
of “supra-thermal” (i.e. excited or kinetically energetic) species may play a larger role in
radiolysis, while COM production through photolysis would be closer to the radical-addition
mechanisms considered in many astrochemical models. Oberg et al. (2009) demonstrated
that a large range of observed COMs could be formed through photolysis of solid methanol,
with product abundances varying with temperature (20–70 K). More recently, Butscher
et al. (2016) showed that HCO radicals produced by formaldehyde photodissociation could
be stored in the ice at low temperatures, becoming more mobile and reactive as temperatures
increase. The relative orientations of the radicals during reaction may also be important
to the product ratios and reaction efficiencies (Bergner et al. 2016; Enrique-Romero et al.
2016; Butscher et al. 2017).
A major area of new ice-chemistry research involves the production of COMs at very
low temperatures without the need for diffusion of large radicals (thermally or otherwise),
nor with any initiating energetic process. Fedoseev et al. (2015) found that co-deposition
of H and CO at low temperatures could produce COMs, which they suggest occurs through
the production of glyoxal (HCOCHO) via HCO radical addition, which is subsequently
hydrogenated to produce glycolaldehyde and ethylene glycol. In this scheme, the low-
temperature chemistry that produces methanol by hydrogen addition would allow more
complex species to be formed in tandem. Reactions between HCO radicals would be the
result not of diffusive meetings, but rather their occasional production in close enough
proximity that little or no diffusion would be required. The HCO radical could also plausibly
react with CO itself, mediated by an activation energy barrier but with little need to diffuse.
Subsequent studies have highlighted cold pathways to other COMs, through deposition of
additional species (Fedoseev et al. 2016; Qasim et al. 2019; Dulieu et al. 2019). In this review,
we refer to such processes generically as non-diffusive, although they may indeed be initiated
by the diffusion of H atoms, which are mobile even at very low temperatures. It seems likely
that non-diffusive mechanisms could make a significant contribution to the COM content of
star-forming regions. However, methyl formate does not seem to be produced in sufficient
quantities to explain its interstellar abundance and photolysis may therefore still be required
(Chuang et al. 2016) if it originates in the solid phase. Astrochemical models have treated
non-diffusive reactions in the past on a case-by-case basis (Garrod & Pauly 2011), but new
models are beginning to include more general treatments for this cold chemistry (e.g., Jin
& Garrod 2020).
3. CHEMICAL INVENTORIES IN REGIONS OF STAR FORMATION
3.1. Recent salient results about molecular complexity
Between 2010 and 2019, 58 new species were detected in the ISM, at a rate exceeding
the approximately 4 new detections per year on average since 1968 (McGuire et al. 2018).
About 36% of those new detections were COMs, of which 71% were detected toward dark
clouds or star-forming regions, with the majority being highly saturated species. Since
2014, 6 out of 16, i.e. ∼40% of the new COM detections, were made with ALMA – a clear
18 Jørgensen et al.

demonstration of its capabilities for astrochemical studies. But large single-dish telescopes
still have a role to play, as illustrated by the detections of 9 new COMs with the GBT and
IRAM 30 m telescopes over the same period (4 and 5, respectively, for these telescopes).
Three of the new COM detections reported over the past five years have revealed the
wider complexity of the molecular structures produced by chemistry in star-forming regions.
The ALMA detection of the branched alkyl molecule iso-propyl cyanide toward the hot core
Sgr B2(N2) with an abundance only 2.5 times lower than that of its straight-chain structural
isomer normal-propyl cyanide has shown that branched molecules can easily form in the
ISM (Belloche et al. 2014). Astrochemical simulations subsequently showed that at the next
stage of complexity in the alkyl cyanide family (C4H9CN), some of the branched isomers
should even dominate over the straight-chain one (Garrod et al. 2017). This remains to be
verified observationally. The detection of a chiral molecule has also enlarged our inventory
of the types of molecular structures present in the ISM: McGuire et al. (2016) reported
the detection of propylene oxide in the extended, low-density region of the protocluster
Sgr B2(N) with the GBT and the Parkes telescope. These observations do not tell us if
propylene oxide has an enantiomeric excess in Sgr B2, as was found for some chiral molecules
in meteorites (see, e.g., Pizzarello & Groy 2011), but McGuire et al. (2016) discuss the
prospects for a measurement of this.. Finally, the identification of an aromatic COM in the
ISM was reported by McGuire et al. (2018) who detected benzonitrile toward the cold dense
core TMC-1 with the GBT. Apart from the fullerenes, this molecule is, with 13 atoms, the
largest molecule identified in the ISM so far. As those authors’ chemical models indicate, its
presence is likely connected to the chemistry of benzene. However, it is less clear whether
benzene itself should be formed predominantly through a “bottom-up” mechanism starting
from simpler species, or whether it represents the smaller end of a spectrum of PAHs that
are relatively long-lived and photo-stable.
Attempts to detect larger molecules such as butyl cyanide (15 atoms) or the heterocyclic
aromatic molecule quinoline (C9H7N, 17 atoms) have not been successful so far (Ordu et al.
2012; Garrod et al. 2017; Cordiner et al. 2017). Garrod et al. (2017) predicted an abundance
of butyl cyanide relative to propyl cyanide in Sgr B2(N) just below the detection limit of the
EMoCA survey, but a preliminary search for this molecule in the three times more sensitive
survey ReMoCA on the same source (Belloche et al. 2019) has not succeeded yet. Likewise,
no secure detection of propanol (12 atoms) has been achieved so far (Muller et al. 2016a;
Tercero et al. 2015; Qasim et al. 2019).
3.2. Detections in the warm gas of hot cores and corinos
Through efforts with ALMA, Herschel, and other millimeter/submillimeter facilities, signif-
icant advances have been made toward the collection of systematic molecular inventories for
a larger number of sources, including those that are generally less line-rich. For example,
many of the complex species previously only detected toward high-mass star forming regions
are now also seen toward solar-type protostars. These include molecules containing three
carbon atoms, such as acetone and propanal (Lykke et al. 2017), and species of prebiotic
interest such as glycolaldehyde (Jørgensen et al. 2012; Coutens et al. 2015; Taquet et al.
2015) and formamide (Kahane et al. 2013; Coutens et al. 2016).
At the current level there is no evidence that the degree of molecular complexity is
any less for low-mass hot corinos than their high-mass counterparts, although the former
typically have fainter lines. This is not to say that there are no differences between low-
www.annualreviews.org • Astrochemistry during the formation of stars 19

and high-mass star forming regions. There are significant non-detections in some regions:
for example, species such as methylamine, CH3NH2, and hydroxylamine, NH2OH, have
been sought due to their potential roles as precursors for amino acids. However, so far
only CH3NH2 has been detected in the ISM and only toward a few select regions such
as Sgr B2(N) (Kaifu et al. 1974), Orion KL (Pagani et al. 2017), G10.47+0.03 (Ohishi
et al. 2019), and NGC 6334 (Bøgelund et al. 2019b), but not in general toward high-mass
star forming regions or low-mass protostars (Ligterink, Tenenbaum & van Dishoeck 2015;
Ligterink et al. 2018a). No secure detection of NH2OH has been reported so far despite
dedicated searches toward high- (Pulliam, McGuire & Remijan 2012) and low-mass star
forming regions (McGuire et al. 2015; Ligterink et al. 2018a). An analysis of the PILS data
shows that the CH3NH2 upper limit, as well as the detection of methanimine (CH2NH), a
precursor species of CH3NH2, imply abundances with respect to methanol and formamide
more than an order of magnitude lower in IRAS16293B compared to Sgr B2(N) (Ligterink
et al. 2018a).
Conversely, the targeted studies of solar-type protostars have revealed the presence of
some species not previously seen toward high-mass star forming regions – for example,
the simple halogen-bearing organic methyl chloride (Fayolle et al. 2017), and nitrous acid
(Coutens et al. 2019). Due to high degrees of line confusion typically seen toward high-mass
star forming regions, it is not clear whether those species differ in abundance compared to
high-mass star forming regions, as the increased line confusion toward Sgr B2(N2) in the
EMoCA survey produces upper limits on the abundance of these two species comparable to
the inferred values in IRAS 16293B. Another recent example of a “first discovery” in low-
mass protostars is that of glycolonitrile. This species was detected in IRAS 16293B (Zeng
et al. 2019) but searches for it toward Sgr B2(N) have been unsuccessful so far, both in
single-dish surveys (Margules et al. 2017) and in the EMoCA and ReMoCA interferometric
surveys.
3.3. Low-density environments and starless/prestellar cores
Some particularly interesting observations of complex molecules and related species involve
detections toward cold starless or prestellar cores. While unsaturated carbon-chains have
long been known to be present toward such cores (TMC-1 and L134N being the most well-
studied examples), recent studies have also yielded detections of a number of saturated
COMs toward dense, low-mass prestellar cores such as L1689B in the Ophiuchus molecular
cloud region (Bacmann et al. 2012), L1544 in Taurus (Vastel et al. 2014; Jimenez-Serra
et al. 2016) and Barnard 5 in Perseus (Taquet et al. 2017), as well as their likely coun-
terparts for high-mass stars such as the infrared dark cloud IRDC028.34+0.06 (Vasyunina
et al. 2014) and the prestellar core candidate W43-MM1/6 (Molet et al. 2019). Detected
molecules include acetaldehyde, methyl formate, and dimethyl ether. Maps of the spatial
distributions of these species toward some of the cores (Bizzocchi et al. 2014; Soma et al.
2015) suggest that they are prevalent in regions offset from the center of the core as traced
by the submillimeter continuum radiation or infrared extinction.
The detections of COMs in absorption toward Sgr B2(N) also provide insight into the
chemistry of cold clouds. Some of these detections correspond to the large-scale envelope
of Sgr B2(N) itself, but a few COMs (CH3OH, CH3CN, CH3CHO, NH2CHO) were also
detected at velocities corresponding to translucent clouds along the line of sight, both in
the Scutum arm and in the Galactic center region (Corby 2016; Thiel et al. 2017, 2019). The
20 Jørgensen et al.

abundances of CH3CN, CH3CHO, and NH2CHO relative to methanol were found by Thiel
et al. (2017) to be similar to those derived for the same molecules detected in absorption in
the z = 0.89 spiral galaxy located in front of the quasar PKS 1830-211 (Muller et al. 2011,
2013). This suggests that the processes leading to chemical complexity in the translucent
parts of molecular clouds have remained similar since the universe was half its current age.
The detections of COMs in these cold regions emphasize two points: firstly, the forma-
tion of these highly-saturated organics cannot be dependent on the same warm, diffusive,
grain-surface chemistry that many models rely on to explain COMs in hot-core regions.
Secondly, if they originate on the grains, they must be released into the gas through some
non-thermal mechanism. Plausible theories include cosmic-ray sputtering of the ices, photo-
desorption by UV photons, and so-called “reactive desorption”, in which excited, newly-
formed molecules spontaneously desorb. However, neither of the latter two mechanisms
are found to be efficient for methanol in the laboratory (e.g., Bertin et al. 2016; Martın-
Domenech, Munoz Caro & Cruz-Dıaz 2016). The presence of COMs in translucent regions,
in which photo-destruction of those molecules by ambient interstellar UV photons would
be more significant, presents a greater problem. Formation of the COMs within transient
or unresolved structures (e.g., Garrod et al. 2005) could provide a possible explanation. An
alternative idea is that reactions of H and O atoms with the bare surfaces of carbonaceous
grains could be a source of COMs. Experiments have for example shown that formaldehyde
may be produced in this way (Potapov et al. 2017).
These new detections have reset the clock for COM formation to an even earlier stage
than previously thought. An important task for the future will be to determine to what
degree hot cores and corinos have inherited chemistry from their earlier evolutionary stages.
3.4. Outflows
The first discovery of COMs toward an outflow-related shock was made toward the chemi-
cally active outflow L1157-B1 (Arce et al. 2008). This region has since then been the target
of unbiased line surveys using the Nobeyama 45 m telescope (Yamaguchi et al. 2012), the
IRAM 30 m telescope (ASAI, Lefloch et al. 2017), and Herschel/HIFI (CHESS, e.g., Codella
et al. 2010, 2012; Benedettini et al. 2012). These surveys have led to a number of new detec-
tions in such shocked regions, including of phosphorhus mononitride (PN; Yamaguchi et al.
2011), as well as inventories of COMs there (Sugimura et al. 2011; Lefloch et al. 2017).
Beyond the L1157 outflow, the systematic inventories of complex organics beyond CH3OH
and CH3CN in outflow regions remain relatively sparse. Oberg et al. (2010, 2011) reported
the detections of COMs, including CH3OCHO, CH3CHO, and CH3OCH3, toward outflows
in the B1-b and SMM4-W regions with abundances of up to a few percent with respect to
methanol. With their relatively rich spectra, the shocks in the L1157 outflow have also been
the targets of a number of interferometric studies aimed at searching for chemical differen-
tiation between the various species either between the different shocks or within individual
ones (Fontani et al. 2014; Burkhardt et al. 2016; Codella et al. 2017). Such studies, as well
as ones for high-mass protostellar outflows (e.g., Palau et al. 2017), show great potential for
observations of chemistry in the time domain that can provide much needed constraints,
but naturally require good, independent constraints on the time progression of the shocks
as well as the physical changes they induce (e.g., Burkhardt et al. 2019).
www.annualreviews.org • Astrochemistry during the formation of stars 21

3.5. External galaxies
COMs have also been detected in external galaxies. In Sect. 3.3 we already mentioned
the detections reported in the z = 0.89 spiral galaxy in front of PKS 1830-211, with more
than 42 simple and complex molecules identified with ATCA and ALMA (Muller et al.
2014). Extragalactic detections of methanol, methyl cyanide, and methyl acetylene were
already reported three decades ago, in particular in the central regions of the starburst
galaxy NGC 253, with abundances similar to abundances in our Galaxy (Henkel et al.
1987; Mauersberger et al. 1991). More recently, hot cores have been reported in the Large
Magellanic Cloud (LMC). Shimonishi et al. (2016) identified a hot core toward the high-
mass young stellar object ST11 with ALMA on the basis of its compact size, high density,
and high temperature, but no COM was detected, with upper limits implying that methanol
is at least one order of magnitude less abundant than in Galactic hot cores. Further progress
was made by Sewi lo et al. (2018) who detected not only methanol but also dimethyl ether
and methyl formate toward two hot cores of N113, one of the most prominent star-forming
regions in the LMC. The abundances of those species were found to be similar to those
found in Galatic hot cores after accounting for the difference in metallicity. Methanol has
been detected at even lower metallicity, in a cold core of the Small Magellanic Cloud, with
an abundance, not corrected for metallicity, comparable to similar galactic cold sources,
which may suggest an enhanced production of methanol at low metallicity (Shimonishi
et al. 2018) although the implication is somewhat dependent on the assumptions about the
dust properties and temperatures used to derive the H2 column density (Sect. 2.2.2).
A limited number of gas-grain chemical models of Magellanic Cloud chemistry have
been published: Acharyya & Herbst (2018) present an example of a model of hot-core
chemistry in these environments. They found that the effects of varied physical conditions,
particularly the minimum dust temperature achieved, could be more influential than the
metallicity. Unfortunately, the relatively few detections of COMs so far in the Magellanic
Clouds do not place strong constraints on the chemical and physical processes at work.
4. CHEMICAL DIFFERENTIATION IN THE ENVIRONMENTS OF STARFORMATION
The environment of a star forming region can have a strong impact on its chemistry: the
temperature, cosmic-ray ionization rate, radiation field, and timescale of evolution all influ-
ence the rates at which molecules are created or destroyed, and possibly introduce chemical
differentiation. In turn, the chemical content of a source can be used to infer its phys-
ical properties and history. Good examples of these links are the two favorite hot-core
regions, the protocluster Sgr B2(N) in the Galactic Center (GC) region and the 20-times
more nearby Orion KL region. Both have been targets of broad spectral line surveys over
the past four decades to probe their COM content, but their physical characteristics may
in fact be very different. Furthermore, other regions of low- and high-mass star formation
are starting to show evidence of chemical differentiation through the increased sensitivity,
spectral coverage, and angular resolution of current observational facilities (see Sect. 2).
In this section we therefore focus on the observational relationships between the physical
structure in star forming environments and chemical differentiation.
22 Jørgensen et al.
4.1. Sgr B2(N): the impact of cosmic rays and an extended reservoir of COMs
The GC giant molecular cloud Sgr B2 shows a rich chemical diversity, related both to com-
pact hot cores and to more extended material where complex molecules are also present.
The fact that high-mass star formation is happening in Sgr B2 has been known for sev-
eral decades, with the detection of several dozen ultracompact HII regions indicating the
presence of a protocluster of young O and B stars (e.g., Gaume et al. 1995). Recently, a
large population of several hundred compact, high-density sources in a likely earlier stage
of evolution was unveiled with ALMA through their dust continuum emission, with a large
fraction of them being interpreted as tracing high-mass young stellar objects (Sanchez-
Monge et al. 2017; Ginsburg et al. 2018). In Sgr B2(N) in particular, three new hot cores
have been identified through their molecular line forests with ALMA (Bonfand et al. 2017);
all coincide with previously known Class II methanol masers (Caswell 1996), which are
exclusively associated with young high-mass stars (Minier et al. 2003; Xu et al. 2008).
While the global chemical composition of Sgr B2’s main sites of star formation,
Sgr B2(N) and Sgr B2(M), could be derived from single-dish observations (e.g., Belloche
et al. 2013; Neill et al. 2014), significant progress has been made thanks to ALMA’s high an-
gular resolution and sensitivity that allowed the chemical composition of the individual hot
cores of Sgr B2(N) to be determined and accurate column densities to be derived (Belloche
et al. 2016; Bonfand et al. 2017). Through models of the observed COM abundances of
Sgr B2(N)’s hot cores, Bonfand et al. (2019) found evidence for a cosmic-ray ionization rate
a factor 50 higher than the canonical value of 1.3×10⁻¹⁷ s−1 usually assumed for dense gas
in the galactic disk. This is in qualitative agreement with the higher cosmic-ray ionization
rate values found for the diffuse medium of the GC region compared to the diffuse medium
in the galactic disk (Indriolo et al. 2015; Le Petit et al. 2016).
Another interesting discussion concerns the thermal history of the region and its impact
on the formation of COMs. Dust temperatures measured with Herschel are higher in the
GC region compared to the galactic disk. Temperatures of 20–27 K were derived for Sgr
B2 (Guzman et al. 2015) but they may be affected by the feedback of its star formation.
A better proxy for the physical conditions that were prevalent during the earlier prestellar
phase in Sgr B2 may be G0.253+0.016, a GC molecular cloud with little on-going star
formation. Dust temperatures of 19–27 K were measured in this cloud (Longmore et al.
2012). Bonfand et al. (2019) showed that minimum temperatures above 20 K during the
collapse history of Sgr B2(N)’s hot cores would not be consistent with their current COM
abundances. Either this discrepancy implies that the Herschel maps are not sensitive to
the lowest temperatures at high densities or that our understanding of the formation of
COMs, and indeed ices of all kinds, in a region like Sgr B2 would have to be revised.
Specifically, the retention of CO ice on grains much above 20 K or so is unlikely, rendering
even methanol production a challenge, as it has no efficient gas-phase formation mechanism
(Garrod, Wakelam & Herbst 2007). This discussion may also have implications for more
local (low-mass) star forming regions where the presence of nearby high-mass stars may
cause the temperature floor to be elevated (e.g., Jørgensen et al. 2006).
A feature of Sgr B2 that has been known for nearly two decades but has become more
prominent in the past one is the presence of COMs distributed on large scales in the cloud,
in addition to the COMs present on small (arcsec) scales in the hot cores. GBT detections
of CH2(OH)CHO, C2H3CHO, C2H5CHO, (CH2OH)2, c-H2C3O, NH2CHO, CH3C(O)NH2,
NCCHO, CH3CHNH, and NHCHCN in absorption and/or emission with low excitation
temperatures is an indirect indication that these molecules are present at low densities and
www.annualreviews.org • Astrochemistry during the formation of stars 23

distributed over arcminute scales in Sgr B2 (Hollis et al. 2004a,b; Hollis 2005; Hollis et al.
2006a,b; Remijan et al. 2008; Loomis et al. 2013; Zaleski et al. 2013). Mapping observa-
tions confirm this with, for example, emission of CH3OH, CH3CN, CH3CCH, NH2CHO,
CH3CHO, and HC5N extending over several arcminutes in maps obtained with the Mopra
telescope at 3 and 7 mm (Jones et al. 2008, 2011) and absorption of CH2CN, CH3CHO,
and CH3CHNH detected with ATCA at 7 mm over the extent of the background free-free
continuum emission (∼10′′, Corby et al. 2015).
The connection between this low-density, colder emission and the hot cores remains
unclear. Recently, Li et al. (2017) reported a change in the relative abundances of
CH2(OH)CHO and (CH2OH)2 over scales of 15′ in Sgr B2 with the Shanghai Tianma 65 m
radio telescope with the [(CH2OH)2]/[CH2(OH)CHO] abundance ratio decreasing from the
extended, low-density region to the dense regions Sgr B2(N) and Sgr B2(M) where star
formation occurs. The recent detections of COMs in cold cores (Sect. 3.3) suggest that a
similar set of physical conditions could be producing such molecules in both environments,
although – if formed on dust grains – the mechanism of desorption could be quite differ-
ent. The action of shocks in galactic center environments could provide a more substantial
ejection of mantles into the gas (see, e.g., Requena-Torres et al. 2006). Recently, ALMA
observations revealed a network of filaments on scales of a few tenths of a parsec toward
Sgr B2(N) (Schworer et al. 2019). The kinematics of the filaments show evidence for mass
flows toward a central hub where the main hot core, Sgr B2(N1), is located and imply a
timescale of 60–300 kyr for the formation of this central hub. Further investigations of the
relation between these filaments and both the formation of the high-mass stars and the
chemistry in the extended and compact environments may shed more light on these issues.
4.2. Orion KL: chemical impact of a past explosion
Thanks to its short distance, Orion KL can be studied in greater detail than Sgr B2
and many signs of chemical differentiation have been seen within this source. For exam-
ple, resolved CARMA observations showed that cyanides peak at different locations from
other species such as CH3OCH3 and CH3OCHO (Friedel & Snyder 2008). A differentia-
tion between N-bearing COMs (cyanides and NH2CHO) and O-bearing COMs (alcohols,
CH3OCH3, and CH3OCHO) has also been inferred from differences in their excitation tem-
peratures from Herschel observations by Crockett et al. (2015), who found that the former
trace hotter gas (200–300 K) than the latter (100–150 K). However, the CH3C(O)CH3 emis-
sion detected with PdBI resembles more the cyanide emission than that of CH3OCH3 and
CH3OCHO (Peng et al. 2013; Feng et al. 2015), two COMs that were found to be strongly
spatially correlated (Brouillet et al. 2013). To complicate the situation even further, Favre
et al. (2017) demonstrated with ALMA that CH3COOH and (CH2OH)2 trace a more com-
pact region located closer to the hot core than other O-bearing COMs. Analyzing a larger
sample of O-bearing COMs detected with ALMA, Tercero et al. (2018) confirmed this result
and showed that there is in fact a more general spatial segregation between the COMs con-
taining a C-O-C structure and the COMs containing a C-OH bond, the former tracing the
compact ridge and the latter the hot core. Tercero et al. (2018) interpret this segregation
as resulting from the chemistry being dominated by different radicals in these two regions,
methoxy (CH3O·) in the former and hydroxymethyl (·CH2OH) in the latter. One caveat in
these discussions is that integrated intensity maps intended to trace a particular transition
of a given COM may be contaminated by emission from other species, due to the complex
24 Jørgensen et al.

velocity structure of the Orion KL region (Pagani et al. 2017). A more reliable method
would be to construct column density maps from LTE fits of the spectrum of each pixel
(e.g., using the VINE method; Calcutt et al. 2018b).
As already noted, some species show indications of temperatures across the region rang-
ing from about 100 K up to 300–450 K toward the cyanide peak at the northeastern part of
the hot core (Bell et al. 2014). Among the COM detections recently reported in Orion KL,
the detection of propyl cyanide is particularly interesting. Both the straight chain (n) and
the branched (i) isomers were detected with ALMA (Pagani et al. 2017). The authors
derived an abundance ratio of the n- and i-isomers that is similar to the one obtained by
Belloche et al. (2014) in Sgr B2, but varying by a factor of 3 (from 2 to 6) across the
region. These variations may reveal a non-uniform thermal history across the Orion KL
region (Pagani et al. 2017).
Still, significant evidence has emerged that mechanical rather than thermal processes
may strongly influence the chemistry of Orion KL. It has long been known that the region
shows a prominent wide-angle outflow with a peculiar structure of finger-like filaments in H2
emission (Taylor et al. 1984) possibly the result of an explosive event (Allen & Burton 1993).
A recent explanation for this explosion is that embedded radio and infrared sources within
the cloud were originally part of a multiple young stellar system that violently disintegrated
∼500 yr ago as a result of a close dynamical interaction, creating at the same time the wide-
angle outflow (e.g., Bally & Zinnecker 2005; Gomez et al. 2005; Zapata et al. 2009; Bally
et al. 2017; Luhman et al. 2017). The absence of a self-luminous submillimeter, radio, or
infrared source embedded in the hot molecular gas and the fact that there are no outflow
filamentary structures in the shadow of the hot core pointing away from the explosion center
led Zapata, Schmid-Burgk & Menten (2011) to suggest that Orion KL is not a typical hot
core with internal heating by a nascent star but a pre-existing dense structure that was
heated up from the outside by the gas that was accelerated by the explosion. An alternative
explanation (Goddi et al. 2011; Bell et al. 2014) is that the hot core is externally heated due
to interaction with the compact SiO outflow driven by source I (Plambeck et al. 2009). In
either case, the chemistry of the Orion KL “hot core” could thus be dominated by shocks
rather than thermal heating by embedded stars, which corroborates earlier suggestions that
the hot core is externally heated (e.g., Blake et al. 1996). The context of the explosion may
also shed new light on the structure of the Orion KL region: Pagani et al. (2017) argue that
the compact ridge, with its narrow velocity dispersion, is located in front of or behind the
rest of the region and has not been affected by the explosion yet.
A recent ALMA study by Pagani et al. (2019) presents an interesting case of probing
chemistry in a new way in relation to the explosive event. In addition to kinematic evidence
pointed out in their previous work (Pagani et al. 2017), elongations found in the channel
maps of various simple and complex molecules, which point back toward the explosion
center, are interpreted by the authors as the result of these molecules being dragged away
by the expanding gas that was pushed out by the explosion (see Fig. 5). The authors suggest
that molecules that do not show such elongations are quickly destroyed in the gas phase
after their release from the dust ice mantles, while those showing such elongations survive
longer. If this interpretation holds true, then the Orion KL region would turn out to be
a kind of time-of-flight experiment that would allow us to explore interstellar chemistry in
the time domain. This would be a major observational breakthrough.
www.annualreviews.org • Astrochemistry during the formation of stars 25

Figure 5
A selection of species seen at 9 km s−1 (color and black contours), compared to the 1.2 mm
continuum emission (white contours) towards the Orion KL region. The stellar objects BN, I, andn are indicated. Small red or white 5-pointed stars mark infrared peaks. The yellow arrows
starting from the explosion center (red eight-pointed star) suggest possible displacement of gas
linked to the explosive event, which occurred ∼500 years ago. The first row shows species withconspicuous displacements (from left to right: H2CO, CH3CN, HNCO) while the second row
shows species close to their production sites (from left to right: CH2NH, CH3OCH3, NH2CHO)
(adapted from Pagani et al. 2019).
4.3. Chemical differentiation in other hot cores
Another avenue to improve our understanding of the formation of COMs in high-mass star
forming regions, complementary to the detailed studies in Sgr B2 and Orion KL mentioned
above, is to target large samples of sources and compare their chemical compositions. Biss-
chop et al. (2007) found that the species (COMs or otherwise) that they detected with the
JCMT toward seven high-mass YSOs were divided into two groups, one tracing hot gas
(>100 K) and the other one cold gas (<100 K). Further studies of small (<10 sources)
samples of high-mass star forming regions targetting several COMs have been performed
(e.g., Calcutt et al. 2014; Suzuki et al. 2018; Taniguchi et al. 2018), but the lack of angular
resolution, the inhomogeneity of the spectral coverage, or the small number of investi-
gated COMs have prevented the emergence of a clear chemical pattern from these studies.
Hernandez-Hernandez et al. (2014) targeted 17 hot cores in CH3CN with the SMA and
found a correlation between the CH3CN abundance and its rotational temperature, which
they interpreted as evidence for a gas-phase formation of CH3CN. Oberg et al. (2014) ar-
gued that the observed increase of [CH3CN]/[CH3OH] with temperature could make this
ratio an evolutionary tracer of massive YSOs.
In addition to Orion KL, chemical differentiation between N- and O-bearing COMs has
26 Jørgensen et al.
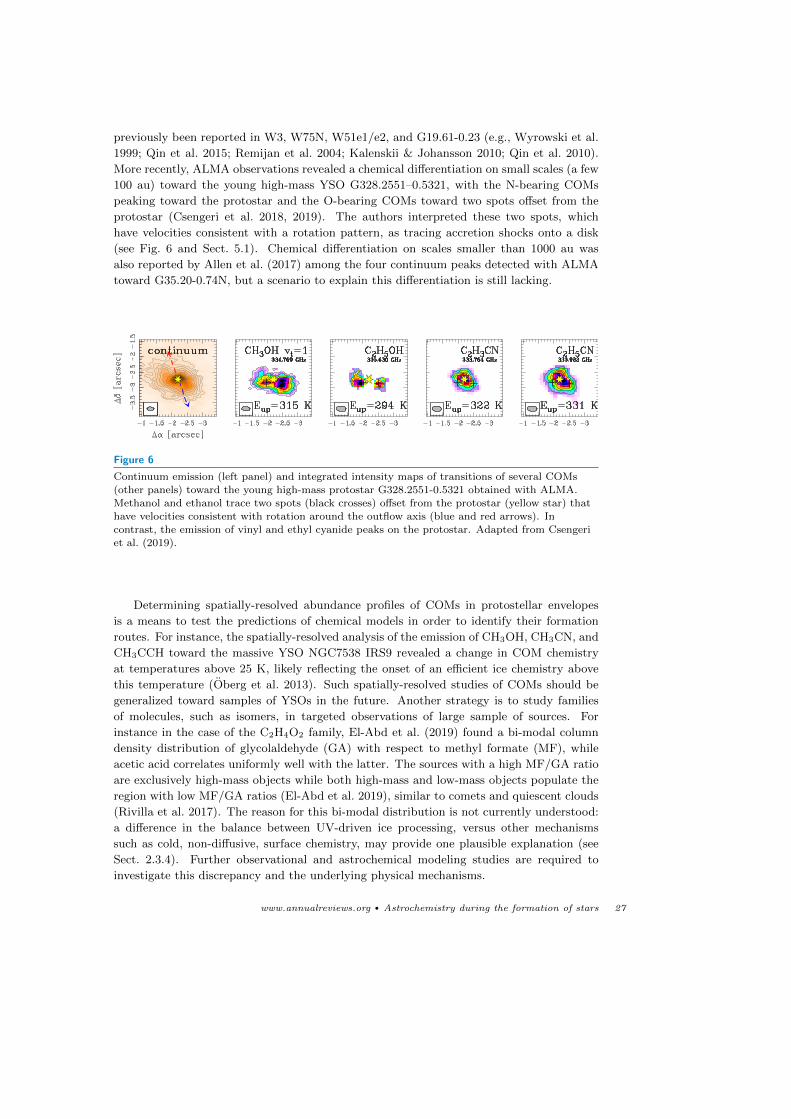
previously been reported in W3, W75N, W51e1/e2, and G19.61-0.23 (e.g., Wyrowski et al.
1999; Qin et al. 2015; Remijan et al. 2004; Kalenskii & Johansson 2010; Qin et al. 2010).
More recently, ALMA observations revealed a chemical differentiation on small scales (a few
100 au) toward the young high-mass YSO G328.2551–0.5321, with the N-bearing COMs
peaking toward the protostar and the O-bearing COMs toward two spots offset from the
protostar (Csengeri et al. 2018, 2019). The authors interpreted these two spots, which
have velocities consistent with a rotation pattern, as tracing accretion shocks onto a disk
(see Fig. 6 and Sect. 5.1). Chemical differentiation on scales smaller than 1000 au was
also reported by Allen et al. (2017) among the four continuum peaks detected with ALMA
toward G35.20-0.74N, but a scenario to explain this differentiation is still lacking.
Figure 6
Continuum emission (left panel) and integrated intensity maps of transitions of several COMs(other panels) toward the young high-mass protostar G328.2551-0.5321 obtained with ALMA.
Methanol and ethanol trace two spots (black crosses) offset from the protostar (yellow star) that
have velocities consistent with rotation around the outflow axis (blue and red arrows). Incontrast, the emission of vinyl and ethyl cyanide peaks on the protostar. Adapted from Csengeri
et al. (2019).
Determining spatially-resolved abundance profiles of COMs in protostellar envelopes
is a means to test the predictions of chemical models in order to identify their formation
routes. For instance, the spatially-resolved analysis of the emission of CH3OH, CH3CN, and
CH3CCH toward the massive YSO NGC7538 IRS9 revealed a change in COM chemistry
at temperatures above 25 K, likely reflecting the onset of an efficient ice chemistry above
this temperature (Oberg et al. 2013). Such spatially-resolved studies of COMs should be
generalized toward samples of YSOs in the future. Another strategy is to study families
of molecules, such as isomers, in targeted observations of large sample of sources. For
instance in the case of the C2H4O2 family, El-Abd et al. (2019) found a bi-modal column
density distribution of glycolaldehyde (GA) with respect to methyl formate (MF), while
acetic acid correlates uniformly well with the latter. The sources with a high MF/GA ratio
are exclusively high-mass objects while both high-mass and low-mass objects populate the
region with low MF/GA ratios (El-Abd et al. 2019), similar to comets and quiescent clouds
(Rivilla et al. 2017). The reason for this bi-modal distribution is not currently understood:
a difference in the balance between UV-driven ice processing, versus other mechanisms
such as cold, non-diffusive, surface chemistry, may provide one plausible explanation (see
Sect. 2.3.4). Further observational and astrochemical modeling studies are required to
investigate this discrepancy and the underlying physical mechanisms.
www.annualreviews.org • Astrochemistry during the formation of stars 27

4.4. Spatial differentiation in IRAS 16293-2422
Chemical differentiation can also be resolved in solar-type regions. Imaging observations
of IRAS 16293-2422 indicate some spatial differentiation between N- and O-bearing com-
plex organics (see Bisschop et al. 2008). However, also within these groups of different
complex organics, systematic differences can be seen toward one of the two components in
the system, IRAS16293A: toward this source a number of species, including HNCO, H2CO,
CH2(OH)CHO, (CH2OH)2, NH2CHO, CH3CHO, and C2H5OH show compact emission (in-
dependent of excitation level) while others show more extended emission (Manigand et al.
2020). This spatial differentiation seems to be related to the derived excitation temperature
of the species ranging from above 90 K to 180 K with the ones with higher excitation tem-
peratures showing more compact emission. Toward the other, lower luminosity, component
of the system, IRAS16293B, no significant spatial differentiation is resolved at 0.5′′ angular
resolution. However, variations in excitation temperatures are also seen on smaller scales
stretching over a somewhat larger range from about 100 to 300 K (Jørgensen et al. 2016)
with a few species (e.g., CH3OH, CH3OCHO) showing evidence for both an optically thick
foreground layer with temperatures of about 100 K, with the bulk of the optically thin
emission originating from molecules at the higher temperatures. A possible explanation for
the spatial differentiation and variations in excitation temperatures may lie in the binding
energies of the individual species in the ices causing this spatial stratification (Manigand
et al. 2020) as also suggested in connection with gas-grain chemical modeling of hot cores
(e.g., Garrod 2013).
5. LINKING THE PHYSICAL AND CHEMICAL EVOLUTION OFPROTOSTARS
Over the last decade significant work has been done on searching for and characterizing the
properties of disks around embedded protostars in their Class 0 and I stages. In particular,
with the advances in sensitivity and angular resolution by ALMA and other millimeter-wave
interferometers, it is found that Keplerian disks exist around a large number of Class I
protostars (e.g., Harsono et al. 2014; Yen et al. 2015a; Artur de la Villarmois et al. 2019)
and at least some Class 0 protostars (Tobin et al. 2012; Murillo et al. 2013; Lindberg et al.
2014; Yen et al. 2017), while counter-examples where no signs of Keplerian rotation are seen
down to ∼10 au scales certainly also exist (e.g., Yen et al. 2015b; Jacobsen et al. 2019).
These high resolution observations have brought forward the close link between the
physical structure and evolution of young stars and their disks and their astrochemistry.
In particular, the youngest circumstellar disks serve as an interesting conduit between the
COMs observed in the warm gas (Sect. 3.2) and the initial conditions for its later, pro-
toplanetary, evolution. However, on the scales of the protostellar envelopes where the
temperatures increase above 100 K due to heating by the central protostar and complex
organics sublimate from ices, the physics due to the presence of the disks become highly
non-trivial (see also Fig. 1). Also, the degree by which the chemistry may be altered, or
even completely reset, as material is accreted to the disk, remains unclear. In this section,
we discuss recent results concerning the link between the physical and chemical evolution
of embedded protostars with particular focus on the formation of disks and accretion.
28 Jørgensen et al.

5.1. Chemical changes in the transitions from envelopes to disks
From a theoretical physical point of view the formation of a circumstellar disk is thought
to be associated with the presence of accretion shocks where material enters the newly
formed disk (e.g., Cassen & Moosman 1981; Neufeld & Hollenbach 1994). Besides their
potential for resetting the chemistry, such shocks may also affect the cosmic-ray ionization
rate both on small scales around individual protostars and on larger scales in more clustered
environments (Gaches & Offner 2018).
Based on Spitzer Space Telescope observations of water lines toward the Class 0 protostar
NGC 1333-IRAS4B, Watson et al. (2007) suggested that the water vapor had its origin in the
warm and dense gas possibly related to an accretion shock due to infall from the protostellar
envelope onto a very young disk. However, images of the infrared lines from Herschel and
Spitzer show that the water line emission is in fact related to the outflow to the south
(Herczeg et al. 2012). This is in contrast to narrow, i.e., non-shocked, line emission of
the H182 O isotopolog that peaks toward the embedded protostar itself (Jørgensen & van
Dishoeck 2010b).
Using ALMA, Sakai et al. (2014) found kinematical evidence of a distinct component,
the so-called “centrifugal barrier”, in a region of about 100 au separated from the Class 0
protostar L1527 and surrounding its Keplerian disk. Sakai et al. (2014) showed that SO and
other sulfur-containing species were enhanced at this location and argued that this was a
result of sublimation of grain mantles due to a weak accretion shock. Subsequent studies of
other protostars show similar kinematical features, although in different molecular tracers
(e.g., Sakai et al. 2016; Oya et al. 2016, 2017). In an ALMA survey of a sample of protostars
from the Ophiuchus star-forming region, Artur de la Villarmois et al. (2018, 2019) detected
warm (Eup ≈ 200 K) SO2 lines toward five of the more luminous sources. The lines were
found to be wide and, in some cases, showed velocity gradients perpendicular to the outflow
direction, a possible indication that the emission is related to shocks toward the surfaces
of the emerging disks – although the compact nature of the emission made it impossible to
rule out, for example, an outflow/jet origin.
Indications of accretion shocks at the envelope-disk interface have also been suggested
for high-mass protostars. In high angular resolution ALMA observations of a massive
protostar associated with the massive clump G328.2551–0.5321, Csengeri et al. (2018) found
evidence for CH3OH emission spots spatially offset from the central unresolved continuum
emission associated with the protostar (see Sect. 4.3 and Fig. 6). Based on the distinct
kinematics of the CH3OH emission compared to the outflow traced by lines of SiO and
SO2, Csengeri et al. argued that the CH3OH peaks are associated with accretion shocks
at the centrifugal barrier while a transition of HC3N in its first vibrationally excited state
shows more compact emission, possibly tracing the properties of the accretion disks around
more massive protostars.
However, significant work still needs to be done to establish an internally consistent
picture of the different kinematical and chemical components of protostars as illustrated
by different interpretations of similar observations of individual sources. For example, Oya
et al. (2016) argued that CH3OH and other COMs were present at the centrifugal barrier
toward IRAS16293A as a result of either a weak accretion shock or protostellar heating, in
contrast to H2CS that also traces the disk on smaller scales. Van ’t Hoff et al. 2020 on the
other hand found that multiple spatially-resolved H2CS transitions were consistent with
the temperature in a passively heated envelope down to small scales overlapping with the
emission from some of the complex organics.
www.annualreviews.org • Astrochemistry during the formation of stars 29

Another example is offered by the Class 0 protostar, L483, for which unsaturated carbon-
chain species are present on large, single-dish, scales (e.g., Sakai et al. 2009; Agundez et al.
2008, 2019), while saturated COMs are present on small, interferometric, scales (Oya et al.
2017; Jacobsen et al. 2019). Based on the kinematical model of CS emission, Oya et al.
(2017) argued that the centrifugal barrier in this source is at radii of 30–200 au with
COM and SO emission possibly tracing an unresolved Keplerian disk within this. However,
Jacobsen et al. (2019) demonstrated that the emission from CS and the COMs both show
similar kinematical signatures consistent with material infalling under the conservation of
angular momentum down to radii of 10–15 au rather than Keplerian rotation.
5.2. The physical/chemical structure of embedded disks
For protostars with established Keplerian disks, other interesting questions arise concerning
their physical structures: does the distribution of molecules in the gas and ices in these disks
reflect those around more evolved (T Tauri) stars where significant freeze-out appears in
the mid-plane, or does the active accretion change the physical structures, for example by
increasing the disk temperatures that are critical for the resulting chemistry? Through
radiative transfer modeling of gas-phase lines observed with the SMA toward two Class I
protostars with well-established disks, Brinch & Jørgensen (2013) found the former to be
the case: relatively simple models for T Tauri disks could be applied to those sources with
simple chemistry dictated by the amount of shielding, in turn determining in what fraction
of the disk CO is frozen out. A counter-example is offered by the disk around the more
deeply embedded protostar L1527: by comparing ALMA data to detailed radiative transfer
models, van ’t Hoff et al. (2018b) showed that even in the mid-plane of this disk, the
temperature is above 20 K out to radii of at least 75 au, thereby causing CO to be in the
gas phase in the bulk of the disk.
The exact distribution and location of complex organics around Class I protostellar
sources also remains puzzling. Toward the protostars in the ALMA Ophiuchus survey
by Artur de la Villarmois et al. (2019), no significant emission from lines in the promi-
nent CH3OH 7k–6k branch was seen toward the locations of the protostars. These results
demonstrate that the warm regions of the disk where gas-phase CH3OH can be present (or
where weak shocks could act) must be relatively limited in extent and that the envelopes
surrounding these disks must have relatively low column densities of material in their inner
warm regions. In the standard picture of rotating collapse of a protostellar core and disk
formation, the latter would be a natural consequence with the envelope density profile flat-
tening out on small scales where the disk emerges. A simple prediction would consequently
be that the presence of complex organics in the envelopes on small scales and the presence
of extended Keplerian disks should be anti-correlated.
Recently Lee et al. (2017, 2019a) presented an in-depth analysis of the HH 212 proto-
stellar system in the L1630 cloud of Orion. The system shows a characteristic morphology
with an edge-on dust lane with emission from COMs distributed parallel to the dust lane
– but offset above and below it. The complex organics show signs of a velocity gradient in
the elongated direction, indicative of rotating motions (the region of the disk where Kep-
lerian motions would be present is only marginally resolved). These features led Lee et al.
(2017) to suggest that these species are present in the “atmosphere” of the disk and either
formed in the cold regions at large scales and sublimated at high temperatures in the disk
atmospheres – or alternatively formed through rapid gas-phase reactions there.
30 Jørgensen et al.

Another example of differentiation between dust continuum and line emission is seen
toward the Class I protostar TMC1A. Through ALMA long-baseline observations of that
source, Harsono et al. (2018) demonstrated that the emission of CO isotopologs (13CO and
C18O) was clearly offset from the central location of the protostar and resolved dust contin-
uum emission. Through detailed line radiative transfer modeling, Harsono et al. show that
this differentiation in TMC1A best can be explained by the existence of large (millimeter-
sized) grains causing the dust to become optically thick and thus blocking the emission of
the gas lines. Due to the high column densities traced by ALMA in its long baseline con-
figurations, some care must be taken when interpreting the spatial differentiation between
species and dust emission on these scales due to the high continuum optical depth even in
the absence of large grains such as those inferred by Harsono et al. (see Sect. 2.1.3).
5.3. Episodic accretion and snowlines in protostellar envelopes
The emergence of disks around embedded protostars may also have profound implications
on the overall physical evolution of the infalling material from the protostellar envelopes.
If disks around the embedded protostars are comparable in mass to those around more
evolved T Tauri stars as is suggested by dust continuum observations (e.g., Tychoniec et al.
2018; Jørgensen et al. 2009), these disks may easily undergo periods of instability causing
the accretion onto the central stars, and consequently their luminosities, to be non-steady
(episodic) – thereby also causing the temperatures in the ambient disk and envelope heated
by the central protostar to vary. Observationally, there is photometric evidence, both
statistically (see Audard et al. 2014, Dunham et al. 2014 and references therein) as well as
for individual protostars (e.g., Safron et al. 2015), that such luminosity variations indeed
take place.
From a chemical point of view, temporal changes in the temperatures are naturally very
important. For example, an (episodic) increase in luminosity for a given protostar will cause
the regions where specific molecules sublimate from the surfaces of grains to become more
extended compared to sources in a more quiescent phase of steady accretion (e.g., Lee 2007;
Visser & Bergin 2012; Visser, Bergin & Jørgensen 2015; Rab et al. 2017, and Fig. 7). As the
time-scale for the subsequent freeze-out may be long (inversely proportional to the density)
compared to the duration of such bursts, those extended regions of sublimated molecules
may persist for significant periods of time even after the protostar has returned to its
quiescent phase. Thus, observations of the molecular signatures of embedded protostars
may provide an “archeological” view of their recent evolution. Episodic accretion events
may also be reflected in the observed ice and dust features of the protostars. For example,
the existence of pure CO2 ices observed in the mid-infrared spectra of protostars is an
indication that some thermal processing and subsequent freeze-out has taken place at some
point during the preceding evolution (e.g., Ehrenfreund et al. 1997; Gerakines et al. 1999),
possibly due to previous accretion bursts (e.g., Kim et al. 2012; Poteet et al. 2013). Taquet,
Wirstrom & Charnley (2016) demonstrated that the cyclic sublimation and freeze-out of the
icy mantles, could lead to the build-up of appreciable amounts of complex organic species
in the inner envelopes of protostars.
Observationally, these suggestions can be tested by measuring the extents of primary
species directly sublimating from grains or secondary species either produced or destroyed
subsequently in the gas phase (Fig. 7). Studies of the images of the C18O emission toward
protostars observed with the SMA (Jørgensen et al. 2015; Frimann et al. 2017) show evidence
www.annualreviews.org • Astrochemistry during the formation of stars 31
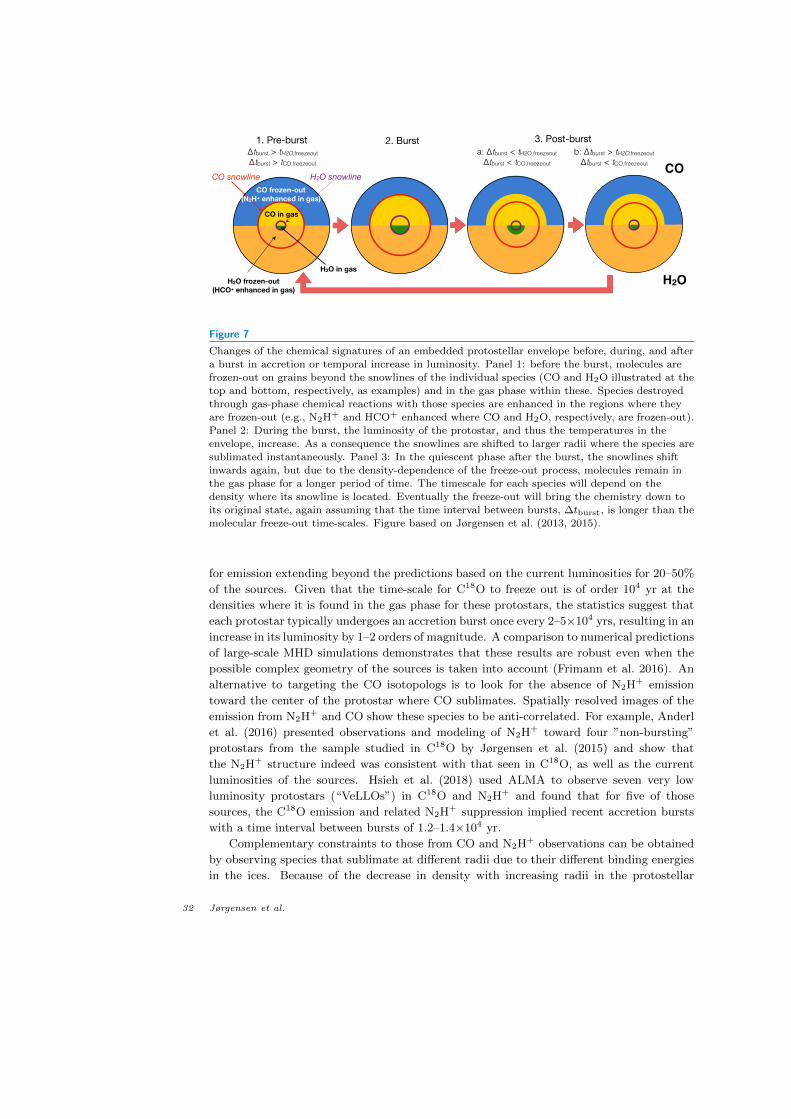
1. Pre-burst 2. Burst 3. Post-burst
CO snowline
H2O in gasH2O frozen-out
(HCO+ enhanced in gas)
H2O snowlineCO frozen-out
(N2H+ enhanced in gas)
a: Δtburst < tH2O,freezeoutΔtburst < tCO,freezeout
b: Δtburst > tH2O,freezeout Δtburst < tCO,freezeout
Δtburst > tH2O,freezeout Δtburst > tCO,freezeout
CO in gas
CO
H2O
Figure 7
Changes of the chemical signatures of an embedded protostellar envelope before, during, and after
a burst in accretion or temporal increase in luminosity. Panel 1: before the burst, molecules arefrozen-out on grains beyond the snowlines of the individual species (CO and H2O illustrated at the
top and bottom, respectively, as examples) and in the gas phase within these. Species destroyed
through gas-phase chemical reactions with those species are enhanced in the regions where theyare frozen-out (e.g., N2H+ and HCO+ enhanced where CO and H2O, respectively, are frozen-out).
Panel 2: During the burst, the luminosity of the protostar, and thus the temperatures in the
envelope, increase. As a consequence the snowlines are shifted to larger radii where the species aresublimated instantaneously. Panel 3: In the quiescent phase after the burst, the snowlines shift
inwards again, but due to the density-dependence of the freeze-out process, molecules remain inthe gas phase for a longer period of time. The timescale for each species will depend on the
density where its snowline is located. Eventually the freeze-out will bring the chemistry down to
its original state, again assuming that the time interval between bursts, ∆tburst, is longer than themolecular freeze-out time-scales. Figure based on Jørgensen et al. (2013, 2015).
for emission extending beyond the predictions based on the current luminosities for 20–50%
of the sources. Given that the time-scale for C18O to freeze out is of order 104 yr at the
densities where it is found in the gas phase for these protostars, the statistics suggest that
each protostar typically undergoes an accretion burst once every 2–5×10⁴ yrs, resulting in an
increase in its luminosity by 1–2 orders of magnitude. A comparison to numerical predictions
of large-scale MHD simulations demonstrates that these results are robust even when the
possible complex geometry of the sources is taken into account (Frimann et al. 2016). An
alternative to targeting the CO isotopologs is to look for the absence of N2H+ emission
toward the center of the protostar where CO sublimates. Spatially resolved images of the
emission from N2H+ and CO show these species to be anti-correlated. For example, Anderl
et al. (2016) presented observations and modeling of N2H+ toward four ”non-bursting”
protostars from the sample studied in C18O by Jørgensen et al. (2015) and show that
the N2H+ structure indeed was consistent with that seen in C18O, as well as the current
luminosities of the sources. Hsieh et al. (2018) used ALMA to observe seven very low
luminosity protostars (“VeLLOs”) in C18O and N2H+ and found that for five of those
sources, the C18O emission and related N2H+ suppression implied recent accretion bursts
with a time interval between bursts of 1.2–1.4×10⁴ yr.
Complementary constraints to those from CO and N2H+ observations can be obtained
by observing species that sublimate at different radii due to their different binding energies
in the ices. Because of the decrease in density with increasing radii in the protostellar
32 Jørgensen et al.

envelopes, this would cause the freeze-out time-scale for such species to differ from those
of CO, thus providing complementary information concerning the frequencies and magni-
tudes of the bursts. A particularly interesting example is that of H2O, which sublimates at
much smaller scales of the protostellar envelope where the temperature exceeds 90–100 K,
compared to the 20–30 K of CO, and consequently freezes out much more quickly again.
Water is difficult to image using millimeter wavelength interferometers due to Earth’s atmo-
sphere, but species such as HCO+ is suppressed by the presence of H2O, in a similar way as
N2H+ is by CO, and can thus be used as indirect tracers (Visser, Bergin & Jørgensen 2015,
and Fig. 7). Indeed, images of the H182 O and H13CO+ isotopologs of these species toward
the Class 0 protostars NGC 1333-IRAS2A (van ’t Hoff et al. 2018a) and IRAS 15398-3359
(Jørgensen et al. 2013; Bjerkeli et al. 2016) show similar anti-correlations to those of CO
and N2H+, but on much smaller scales. The extent of this HCO+ suppression toward
IRAS 15398-3359 (Jørgensen et al. 2013) implies that the protostar has undergone a re-
cent burst but only within the previous 100–1000 yr. High angular resolution images of
the CO outflow from this source show the presence of bullet-like structures also supporting
the interpretation of ejection events on ∼100 yr time-scales (Bjerkeli, Jørgensen & Brinch
2016). Another example is the FU Orionis object V883 Ori for which an increased lumi-
nosity moved the water snowline outwards and led to large column densities of methanol
and other COMs over extended regions where they are observable with ALMA (van ’t Hoff
et al. 2018c; Lee et al. 2019b).
Hsieh et al. (2019) performed a statistical survey of N2H+ and HCO+ using ALMA
toward 39 Class 0 and I protostars from the Perseus molecular cloud. Almost all sources in
their sample show evidence for post-burst signatures in N2H+ while the number of sources
with post-burst signatures in HCO+ decreases from the Class 0 to I stages. These differ-
ences suggest that the time intervals between bursts increase from 2400 yr in the Class 0
stage to 8000 yr in the Class I stage. An explanation for this evolution could be that the
accretion bursts are results of instabilities in disks that are more likely to occur in the
earliest protostellar stages.
5.4. Summary
The above discussions raise a number of outstanding questions concerning the physical
and chemical structure of embedded disks and their formation and evolution. Are the
pictures of accretion shocks and episodic accretion generally applicable? To what degree
do these cause the chemistry to be reset or lead to differing chemistries with new molecules
formed? How are COMs distributed around embedded protostars – and do they point to
one physical origin, or perhaps several different ones connected to those shown in Fig. 1?
What role does grain growth play in the chemical evolution as well as the interpretation
of line emission and chemistry on small scales? These discussions are still suffering from
a lack of unbiased datasets that are comparable in terms of the observed molecular line
tracers. The obvious next step will therefore be to expand the observed number of sources
and species systematically – and establish generally applicable models that can account for
the differences between low- and high-mass protostars and, importantly, make predictive
statements.
www.annualreviews.org • Astrochemistry during the formation of stars 33

Isotopolog and Isotopomer
Isotopologs refer to molecules that only differ in their isotopic composition. Isotopologs can have one or
more atoms substituted by isotopes, occasionally referred to as singly-, doubly-, etc. substituted variants.
Isotopomers, or isotopic isomers, are species that consist of the same number of each isotopic atom, but the
positions of those atoms within the molecule differ.
As examples, CH2DOH, CH3OD, 13CH3OH, and CH183 OH are singly-substituted isotopologs of methanol,
CH3OH. Of these, CH2DOH and CH3OD are isotopomers where the D-isotope is substituted on either the
CH3 or OH functional group.
6. FRACTIONATION
One of the important tools to study the physics and chemistry of the ISM is to target less
abundant isotopologs of specific species. This may be a useful way of finding transitions
that, while optically thick for the main isotopolog, may be optically thin for the rarer
isotopolog due to its lower column density. However, from an astrochemical point of view,
it is also well established that for many molecular species in the ISM, the isotope ratios (e.g.,
D/H, 12C/13C, or 14N/15N) measured as column density ratios between their isotopologs,
differ significantly from the elemental abundances representative for the local conditions in
their ambient interstellar medium. These variations, referred to as isotopic fractionation,
can either be enhancements or depletions of the rarer isotopologs compared to the local ISM
isotopic ratio and range numerically from a factor of few differences for the heavier elements,
such as carbon and nitrogen, to enhancements of several orders of magnitude for deuterium.
In the Solar System, significant variations are also seen in the isotopic compositions in
different bodies and materials. As these variations are thought to reflect processes that
took place during the earliest stages of the Solar System, a detailed understanding of the
different physical and chemical processes behind isotopic fractionation may shed light on
its origin and relation to star and planet formation as we observe it now (see sidebar title
Isotopolog and Isotopomer).
A range of processes can lead to isotopic fractionation in the ISM. For common species
such as CO and N2, the high abundance of the main isotopologs, and thus opacity at the
frequencies of their transitions, causes these species to be self-shielded against photodissoci-
ation, while their rarer isotopologs may be photodissociated over larger columns. As a result
of this isotope-selective photodissociation (see, e.g., Visser, van Dishoeck & Black (2009) for
the case of CO and Heays et al. (2014) for N2), the molecular carrier becomes depleted in the
rarer isotopic variant as the depth or extinction increases (12CO becomes more abundant
than 13CO compared to the 12C/13C ratio, 14N2 more abundant than 15N14N compared to
the 14N/15N ratio etc.) while the atomic gas becomes enriched in the rarer isotope (13C, 15N
etc.). Depending on the exact chemical networks both the molecular and atomic isotopic
signatures may be carried over to other gaseous species and possibly solids (e.g., Lyons &
Young 2005; Furuya & Aikawa 2018). The efficiency of these processes naturally depends
on the strength and spectral shape of the incoming radiation as well as physical conditions
in the environment, e.g., the distribution of material and shielding by grains.
Deeper in the cloud, chemical fractionation may play a more prominent role. A classical
34 Jørgensen et al.
example is the balance between H and D through the isotope exchange reaction:
H+3 + HD ↔ H2D+ + H2. (1)
At the low temperatures of prestellar cores, the exothermicity of this reaction causes the
deuterium of HD to be driven toward H2D+, which thus becomes increasingly abundant
relative to H+3 . As H+
3 is one of the key ingredients for many gas-phase chemical networks in
the ISM, its enhanced deuteration can then be carried to a number of other common species,
such as HCO+ and N2H+ enhancing the abundance of their deuterated isotopologs. The
above reaction also has an important role in determining the D/H ratios for species formed
on grain surfaces: the main source of atomic H or D in star forming regions is through
dissociative recombination of H+3 or H2D+ with electrons. Thus, the over-abundance of
H2D+ leads to an enhanced atomic D/H ratio in the gas at low temperatures, which can
be transferred to molecules formed on grains through hydrogenation of neutral species
(Tielens 1983). The effectiveness of these deuteration processes depends on a number of
factors, including the temperature, the freeze-out of species such as CO, that acts as the
main destroyer of H+3 and H2D+, and the ortho-to-para ratios of the species in Eq. 1 (e.g.,
Sipila, Caselli & Harju 2015).
In this section, we discuss the origin of isotopic fractionation as it occurs in connection
to the process of star formation. The intent is not to provide a comprehensive review of all
observational and modeling efforts. Rather we highlight a few key points with particular
emphasis on how measurements of the relative abundances of different isotopologs can be
used to trace the link between complex species and water in star forming environments and
the Solar System.
6.1. Water
Perhaps, the most well-known discussion of fractionation in regions of star formation and
the link to the Solar System concerns the origin of Earth’s water and its deuterium isotopic
composition compared to Solar System bodies and star forming regions. It has long been
known that the D/H ratio in Earth’s oceans of 1.5×10⁻⁴ (e.g., Robert, Gautier & Dubrulle
2000) is enhanced compared to the cosmic D/H ratio of 1.5− 2.0× 10⁻⁵ (e.g., Linsky 2003;
Prodanovic, Steigman & Fields 2010). Furthermore, a number of other Solar System bodies
including comets (e.g., Lis et al. 2013) and meteorites (e.g., Alexander et al. 2012) are also
known to show enhanced D/H ratios. While a lot of emphasis has been put on understanding
the delivery of water to Earth through comparisons of the D/H ratios between these bodies,
e.g., whether water was brought to Earth through cometary or meteoritic impacts, another
relevant question from a star-formation astrochemical point of view is when water was
formed and how much processing occurred before it ended up as ices in the protoplanetary
disk. Through detailed models of the water deuterium chemistry, Cleeves et al. (2014) and
Furuya et al. (2017) found that the formation of deuterated water is inefficient in the disk
itself, but rather inherited without significant alteration from the earlier prestellar stages.
These results highlight the importance of the prestellar chemistry for the origin of water –
both in our own Solar System as well as other planetary systems.
Knowledge about the water deuteration in star forming regions comes largely from gas-
phase observations at far-infrared and (sub)millimeter wavelengths. In general, the column
densities of water ice are large toward pre- and protostellar cores and the ice solid-state
features can readily be studied at infrared wavelengths. However, the corresponding solid-
www.annualreviews.org • Astrochemistry during the formation of stars 35

state features of deuterated water, HDO, are difficult to disentangle due to sensitivity and
overlap with more prominent species (e.g., Dartois et al. 2003) and only tentative detections
have been reported toward solar-type protostars (Aikawa et al. 2012).
With, in particular, its HIFI instrument, Herschel provided significant insight into the
distribution of gaseous water around solar-type protostars. Those observations demon-
strated that small amounts of water are present in the gas phase at large scales of proto-
stellar envelopes (Coutens et al. 2012; Mottram et al. 2013) as well as cold prestellar cores
(Caselli et al. 2010), a result of cosmic rays causing the water to photodesorb off the grains
(Caselli et al. 2012). The abundance of water in the gas phase remains low, but still the
column densities are high enough that HDO emission from the same regions could be esti-
mated for a few sources. In those regions, the HDO/H2O ratio is determined by gas-phase
chemistry at low temperatures and was found to range from ∼1% to 20% (Coutens et al.
2012, 2013; Liu et al. 2011).
Deriving the D/H ratios of water ices sublimating in the warm regions close to the
central protostar using single-dish and Herschel measurements is more problematic: these
regions are heavily diluted in the large beams of such observations and the interpretation
therefore heavily depends on radiative transfer models of the emission, which in turn are
complicated due to the separation of the multiple (unconstrained) physical components
within the beam and the fact that both the dust and some prominent lines become optically
thick on small scales (e.g., Visser et al. 2013). Alternatively, interferometric studies of lines
of less abundant isotopologs make it possible to zoom in and constrain the column densities
of water on comparable scales where the emitting regions are relatively homogeneous in
terms of their physics and the densities high enough that LTE is a reasonable approximation
(see discussions in Taquet et al. 2013; Persson et al. 2014). In this manner, estimates of
the HDO/H2O ratios have been derived for the typical Class 0 hot corinos with values of
order 0.1% (e.g., Jørgensen & van Dishoeck 2010a; Persson, Jørgensen & van Dishoeck 2013;
Persson et al. 2014; Taquet et al. 2013), i.e., more than an order of magnitude below those
found on larger scales and more in line with the highest numbers found for Oort family
comets in our own Solar System.
The differences between the D/H ratios in the cold gas in the outer envelope and in
the warm gas on small scales can be successfully modeled in different manners. Either the
increased D/H ratio on large scales is caused by photodesorption, predominantly acting on
the outermost layers of ice mantles that are formed latest and therefore most deuterium
rich (Taquet, Charnley & Sipila 2014), or by continued gas-phase deuteration of water once
desorbed (Furuya, van Dishoeck & Aikawa 2016).
The same models must also explain measured differences in the deuteration between
the singly and doubly-deuterated variants of water, i.e., the HDO/H2O and D2O/HDO
abundance ratios specifically. Statistically, the former ratio should be four times higher
than the latter, since there are two indistinguishable variants of singly-deuterated water
depending on which H-atom is substituted. However, direct interferometric measurements
show that the D2O/HDO ratio is in fact higher than the HDO/H2O ratio by a factor of 7
(Coutens et al. 2014) – i.e., D2O is more than an order of magnitude more abundant than
HDO with respect to what should be expected from the HDO/H2O ratio and the statistics
mentioned above. In the models by Furuya, van Dishoeck & Aikawa (2016), the higher
D2O/HDO ratio can be explained if water ice forms throughout the evolution of the dense
prestellar cores, from the earliest more tenuous stages where the D/H ratio is low to the
later stages where CO freeze-out and a drop in the ortho-to-para ratio of H2 causes the
36 Jørgensen et al.

10−4
10−3
10−2
[HD
O]/
[H2O
]
IRA
S4A
-NW
IRA
S2A
IRA
S4B
IRA
S16293-2422
BH
R71-IR
S1
B335
L483
Comets
Oor
tClo
ud
Jupt
erFa
mily
Protostars
ClusteredPersson+2014
IsolatedJensen+2019
10−4
10−3
(D/H
) x
Earth (SMOW)
Figure 8
Measurements of the HDO/H2O abundance (left axis) and D/H ratio corrected for statistics (i.e.when taking into account the number of equivalent hydrogen atoms; right axis) toward Oort
Cloud and Jupiter Family comets as well as protostars formed in clustered and more isolated
regions. The two groups of protostars show a difference in the HDO/H2O ratios by a factor 2–4with the ratios for the protostars from the more clustered regions closer to those of the comets.
These differences may reflect the conditions in the parental environments of the protostars and
provide a diagnostic for the environments in which the Sun was formed. Figure based on Jensenet al. (2019) and references therein.
deuteration to be more efficient. In this scenario, the bulk of the (non-deuterated) water
forms early in this evolution, while the deuterated species (HDO and D2O) are formed in
the dense stages and their relative abundances thus reflect the higher D/H ratios there.
While studies of water’s D/H ratios show interesting potential for studies of its formation
under different conditions, it should be cautioned that the samples are still relatively small.
A few studies have started addressing, e.g., the temporal and environmental variations. For
example, toward the Class I protostar SVS13b Codella et al. (2016) derive limits to the
HDO/H2O comparable to that of the Class 0 protostars, which again could be taken as
an argument in favor of the water formation and deuteration during the prestellar phases
and little processing happening during the evolution of the protostars themselves. An
example of the potential environmental dependence is seen in recent measurements by
Jensen et al. (2019) of the HDO/H2O ratios toward three protostars located in more isolated
cores (Fig. 8). The HDO/H2O ratios for those sources are remarkably consistent and higher
by factors 2–4 compared to those for the “classical” hot corinos located in more clustered
regions. These differences could reflect the physics in the environment from which they
arise, with the more isolated cores forming in colder environments and/or evolving more
slowly through those. However, to fully disentangle these effects, it is clearly necessary to
expand the samples of well-studied sources to other regions and compare to other tracers
of the (temporal) protostellar chemical evolution.
www.annualreviews.org • Astrochemistry during the formation of stars 37

6.2. Complex organics
The characterization of the isotopic ratios of COMs also provides important insight into
the astrochemistry in star forming regions. The good relative calibration across the ALMA
bands, and the number of transitions any COM isotopolog typically shows in these regions,
makes it possible to derive the relative abundances and thus levels of fractionation with high
accuracy if the isotopologs co-exist in the high-density environment where LTE applies.
The first interstellar detections of deuterated methanol were obtained toward the
Orion KL region with the IRAM 30 m telescope for both CH3OD and CH2DOH (Mauers-
berger et al. 1988; Jacq et al. 1993). The deuterium fractionation of methanol as traced
more recently with PdBI and Herschel is 0.5–0.6% toward the compact ridge and lower than
0.4% toward the hot core (Peng et al. 2012; Neill et al. 2013). Deuterated methyl formate
was also first detected in the ISM toward Orion KL with the 30 m telescope, CH3OCDO
only tentatively but CH2DOCHO robustly, both with a deuterium fractionation of ∼4%
with some variations across the region (Margules et al. 2010; Coudert et al. 2013). The
different deuteration levels of methanol and methyl formate may indicate that the former
was formed at earlier stages than the latter.
A systematic study of the deuteration of COMs in Sgr B2(N2) was performed with the
EMoCA survey (Belloche et al. 2016). The low level of deuteration found for a few COMs
in Sgr B2(N2) compared to Orion KL and other high-mass protostellar objects surveyed
in methanol by Fontani et al. (2015a) was interpreted as resulting either from the higher
prestellar-phase temperatures that seem to characterize the Galactic center region, or from
a lower elemental abundance of deuterium itself in the Galactic center region due to stellar
processing, as was argued in the past on the basis of measurements performed with smaller
molecules on larger scales, albeit with large uncertainties (Jacq et al. 1999; Lubowich et al.
2000; Polehampton et al. 2002). Measurements toward the hot cores NGC6334I (Bøgelund
et al. 2018) and NGC 7538-IRS1 (Ospina-Zamudio et al. 2019), both located in the Galactic
disk, found low values similar to Sgr B2(N2), which supports the temperature interpretation
for Sgr B2 rather than that of astration.
Compared to the high-mass star forming regions, the degree of deuteration is much
higher toward low-mass protostars such as IRAS 16293-2422 as witnessed by early mea-
surements (van Dishoeck et al. 1995) as well as detections of doubly and triply deuterated
variants of species such as CH3OH (e.g., Parise et al. 2002, 2004) using single-dish tele-
scopes. Toward the two main components of this source, the PILS survey has provided
systematic inventories of the D/H ratios as well as some estimates of 12C/13C ratios for
COMs (Jørgensen et al. 2016, 2018; Coutens et al. 2016; Calcutt et al. 2018b; Manigand
et al. 2020). For some species the D/H ratios can be as high as 5–8%, which translate to
the abundance of the deuterated isotopologs relative to the main isotopologs in some cases
being as high as 20% due to statistics (see also discussion of water above). In fact, in the
context of PILS, most deuterated isotopologs of two-carbon-containing COMs for which
spectroscopy is available have been identified.
Interestingly, some variations are seen in the deuteration between different species
toward the B component of IRAS 16293-2422. Toward that source a range of the two
carbon-atom containing species including CH2OHCHO (Jørgensen et al. 2016), CH3CHO,
CH3OCHO, CH3OCH3, and C2H5OH (Jørgensen et al. 2018), all show ratios of 4–8%, while
many of the smaller/simpler molecules, H2CO (Persson et al. 2018), CH3OH (Jørgensen
et al. 2018), CH3CN (Calcutt et al. 2018b) and the S-bearing species (Drozdovskaya et al.
2018) show lower ratios of ≈2%. Toward the other source, IRAS16293A, the deutera-
38 Jørgensen et al.
tion is similarly high for some species but because of larger uncertainties no clear trend
is discernible (Manigand et al. 2020). One possible explanation for this heterogeneity ob-
served toward IRAS16293B, and possibly also causing the differences between CH3OH and
CH3OCHO toward Orion mentioned earlier, could be that the former group of species are
formed later in the evolution of the protostellar core and inherit the D/H ratio then.
The 12C/13C ratios may also carry information. The spectral surveys performed toward
Sgr B2(N) led to the determination of the 12C/13C isotopic ratio for a number of COMs.
The EMoCA survey toward Sgr B2(N2) yields values of 20–21 for CH3CN, C2H3CN, and
HC3N (Belloche et al. 2016) and 25–27 for CH3OH, C2H5OH, and NH2CHO (Muller et al.
2016a; Belloche et al. 2017), with uncertainties likely not higher than 10–15%. A ratio of 32
was derived from the singly 13C-substituted isotopologs of C2H5CN, which is surprisingly
high compared to the other cyanides, all the more so as the ratio derived from the singly
and doubly 13C-substituted isotopologs of C2H5CN is 26 (Margules et al. 2016). The origin
of this difference is still unclear. 12C/13C ratios were also derived from H2CS, CH3CCH,
NH2CHO, and C2H5CN toward Sgr B2(N) by Halfen, Woolf & Ziurys (2017) with their
single-dish ARO survey. They obtained values ranging from 15 to 33 with uncertainties on
the order of 30%, with an average value of 24±9, consistent with the range of values derived
from EMoCA. In IRAS16293B, some indications were seen for differences in the 12C/13C
ratio for a few of the species with higher D/H ratios, which, again, may reflect fractionation
triggered by FUV irradiation by the embedded protostar (Jørgensen et al. 2018).
Other important information about the formation of these organics may come from
possible differences in the isotope ratios for different functional groups in individual COMs.
Favre et al. (2014) studied the two 13C isotopologs of methyl formate in Orion KL with
ALMA and found no significant fractionation difference between the two variants. A similar
conclusion was reached based on the EMoCA measurements of the 12C/13C ratios mentioned
above. Toward IRAS16293B, most of the complex organics do not show variations in their
D/H ratios after accounting for the statistics when there are multiple hydrogen atoms
(Jørgensen et al. 2016, 2018). This again suggests a homogeneous time of formation during
the cold phase for each individual species at which point the D/H ratio is inherited, while
exchange reactions later in the warm gas play a smaller role. There is one exception to this
trend, namely CH3CHO, for which the CHO-group shows a higher D/H ratio than the CH3-
group when corrected for statistics (Coudert et al. 2019; Manigand et al. 2020). Whether the
D/H ratio for this species could be influenced by other (e.g., gas-phase) processes remains
an open question.
It has been suggested that the CH2DOH/CH3OD ratio could vary between regions
of low- and high-mass star formation (e.g., Ospina-Zamudio et al. 2019, and references
therein), ranging from about unity toward Orion (or even lower toward NGC6334I, see
Bøgelund et al. 2018), over ratios of close to the statistical value of 3 toward high-mass
protostars, to much higher ratios claimed toward low-mass star forming regions. However,
there are known issues with the predicted line intensities of CH2DOH that may have caused
the column density estimates to be off in some cases. Also, in particular, the higher ratios for
low-mass sources have suffered from problems due to extended emission seen in single-dish
beams as well as optical thickness of a range of the brighter CH2DOH transitions. Recent
estimates for the warm gas toward solar-type protostars are consistent with the statistical
ratios (Jørgensen et al. 2018; Taquet et al. 2019). Consequently, while the estimates toward
Orion indicate a CH2DOH/CH3OD ratio below the statistical value, which may reflect the
physical structure of the region, the conclusion that there is a dichotomy between low- and
www.annualreviews.org • Astrochemistry during the formation of stars 39

high-mass star forming regions in terms of the CH2DOH/CH3OD ratios is not robust at
this point.
A final puzzle is posed by the detections of doubly-deuterated variants of a range of
species on small scales toward IRAS16293B, including H2CO (Persson et al. 2018), CH3CN
(Calcutt et al. 2018b), and CH3OCHO (Manigand et al. 2019). As seen for water, the D/H
ratios derived from the ratios of the column densities for the doubly- and singly-deuterated
isotopologs are significantly higher by factors of 5–10 than those derived from the singly-
and non-deuterated isotopologs once corrected for statistics. However, if these species are
all formed in the later stages through hydrogenation of CO-rich ices, this difference can, in
contrast to water, not be attributed to differences in formation times between the various
isotopologs. An alternative mechanism could be abstraction and substitution reactions, but
as noted above those will to be equally efficient for different functional groups of a given
molecule (see discussion in Manigand et al. 2019).
7. ORIGIN AND EVOLUTION OF CHEMICAL COMPLEXITY
As described throughout this review, one of the ultimate goals of astrochemistry is to
understand the degree of chemical complexity that can arise before and during the star
formation process and how much, if any, of this complexity may be inherited by emerging
(proto)planetary systems in general. With the wide diversity of environments in which
complex organic molecules are now detected (Sects. 3 and 4) and their intricate link to
the physical evolution of individual sources (Sect. 5), a key question is to what degree the
chemistry varies. With the systematic inventories of molecular species becoming available
for objects in different evolutionary stages and environments, some clues to answering these
questions may be obtained by comparing them. Held together with detailed comparison of
the isotopic compositions (Sect. 6), the hope is that such measurements will help us to place
the origin of our own Solar System and its chemistry in a more general star (and planet)
formation context. In this section we pick-up this thread in a discussion of similarities
and differences among measured abundances of complex organic molecules toward different
types of environments related to star formation, recent cometary values, and predictions
from chemical models.
7.1. Similarities and differences between IRAS16293B, Sgr B2(N2) and Comet67P/C-G
An example of such a comparison between the PILS IRAS16293B results and measurements
toward Comet 67P/C-G obtained from the ROSINA instrument on Rosetta is presented by
Drozdovskaya et al. (2019). Their results show a correlation between the protostellar and
cometary measurements of the abundances of the CHO-, N-, and S-bearing species when
estimated relative to CH3OH, CH3CN, and CH3SH, although with some scatter. For the
CHO- and N-bearing species it further appears that the cometary relative abundances are
slightly enhanced compared to the protostellar ones. Drozdovskaya et al. (2019) concluded
that the volatiles present at the earliest stages of the protostellar evolution are inherited by
the cometary bodies, but also that some additional degree of processing could have occurred
during the protoplanetary disk stage leading to further production of more complex species.
Obviously, a relevant question in this comparison is how representative IRAS16293B
is for the environment of the protosun – and, more generally, how much variation is seen
40 Jørgensen et al.
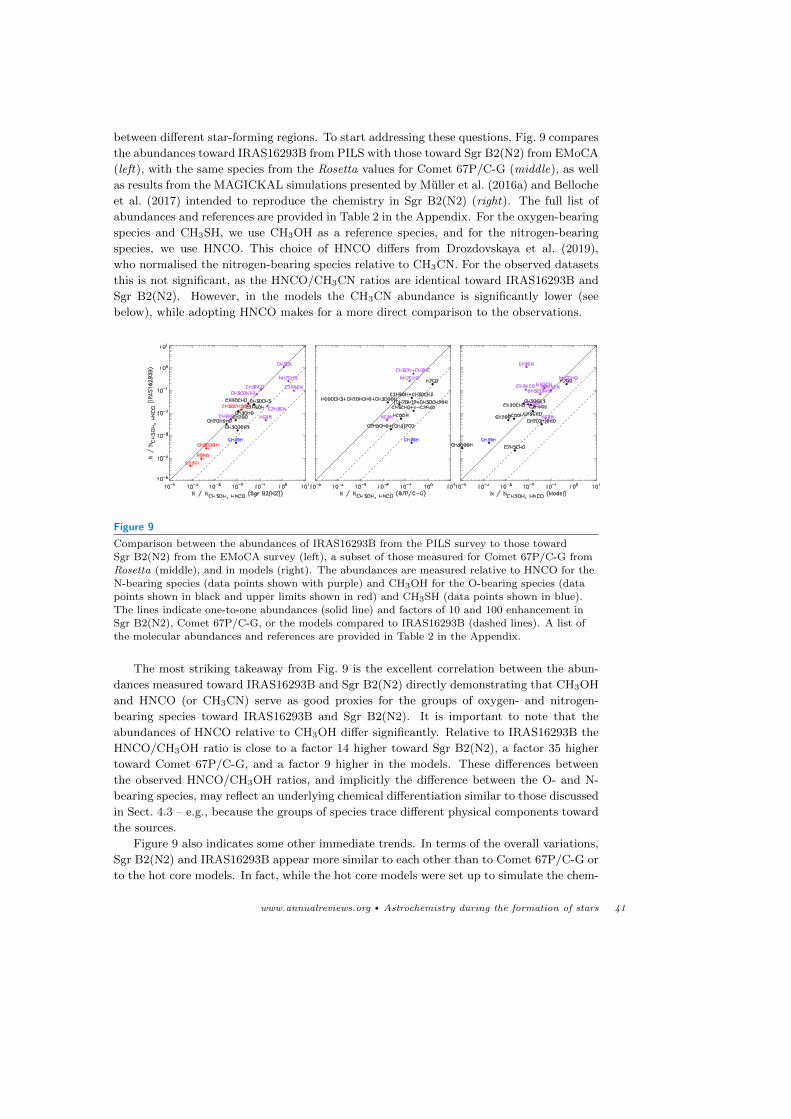
between different star-forming regions. To start addressing these questions, Fig. 9 compares
the abundances toward IRAS16293B from PILS with those toward Sgr B2(N2) from EMoCA
(left), with the same species from the Rosetta values for Comet 67P/C-G (middle), as well
as results from the MAGICKAL simulations presented by Muller et al. (2016a) and Belloche
et al. (2017) intended to reproduce the chemistry in Sgr B2(N2) (right). The full list of
abundances and references are provided in Table 2 in the Appendix. For the oxygen-bearing
species and CH3SH, we use CH3OH as a reference species, and for the nitrogen-bearing
species, we use HNCO. This choice of HNCO differs from Drozdovskaya et al. (2019),
who normalised the nitrogen-bearing species relative to CH3CN. For the observed datasets
this is not significant, as the HNCO/CH3CN ratios are identical toward IRAS16293B and
Sgr B2(N2). However, in the models the CH3CN abundance is significantly lower (see
below), while adopting HNCO makes for a more direct comparison to the observations.
Figure 9
Comparison between the abundances of IRAS16293B from the PILS survey to those toward
Sgr B2(N2) from the EMoCA survey (left), a subset of those measured for Comet 67P/C-G fromRosetta (middle), and in models (right). The abundances are measured relative to HNCO for the
N-bearing species (data points shown with purple) and CH3OH for the O-bearing species (data
points shown in black and upper limits shown in red) and CH3SH (data points shown in blue).The lines indicate one-to-one abundances (solid line) and factors of 10 and 100 enhancement in
Sgr B2(N2), Comet 67P/C-G, or the models compared to IRAS16293B (dashed lines). A list of
the molecular abundances and references are provided in Table 2 in the Appendix.
The most striking takeaway from Fig. 9 is the excellent correlation between the abun-
dances measured toward IRAS16293B and Sgr B2(N2) directly demonstrating that CH3OH
and HNCO (or CH3CN) serve as good proxies for the groups of oxygen- and nitrogen-
bearing species toward IRAS16293B and Sgr B2(N2). It is important to note that the
abundances of HNCO relative to CH3OH differ significantly. Relative to IRAS16293B the
HNCO/CH3OH ratio is close to a factor 14 higher toward Sgr B2(N2), a factor 35 higher
toward Comet 67P/C-G, and a factor 9 higher in the models. These differences between
the observed HNCO/CH3OH ratios, and implicitly the difference between the O- and N-
bearing species, may reflect an underlying chemical differentiation similar to those discussed
in Sect. 4.3 – e.g., because the groups of species trace different physical components toward
the sources.
Figure 9 also indicates some other immediate trends. In terms of the overall variations,
Sgr B2(N2) and IRAS16293B appear more similar to each other than to Comet 67P/C-G or
to the hot core models. In fact, while the hot core models were set up to simulate the chem-
www.annualreviews.org • Astrochemistry during the formation of stars 41

istry of Sgr B2(N2), they are actually in slightly better overall agreement with the abun-
dances observed toward IRAS16293B once the differences between the O- and N-bearing
species are taken out through the normalisations with CH3OH and HNCO. Specifically, the
abundances are in general slightly lower in the models compared to IRAS16293B, whereas
the abundances toward Sgr B2(N2), with very few exceptions, are slightly higher than those
toward IRAS16293B, although only in a few cases by more than an order of magnitude.
Aside from NH2CHO and the three nitrile group-bearing species, HC3N, C2H3CN,
and C2H5CN, the nitrogen-bearing species appear to agree well between Sgr B2(N2) and
IRAS16293B. The fact that the C2HXCN species are similarly elevated toward Sgr B2(N2)
over IRAS16293B perhaps indicates that all three of these species are behaving in concert
through some shared chemistry or common dependence on physical conditions. In the case
of C2H3CN and C2H5CN, their similar behavior across sources may be at least partially
explained by the chemical models, which suggest that gas-phase C2H3CN is a direct (and
major) product of the destruction of gas-phase C2H5CN (see Garrod et al. 2017). Several
competing theories have been offered as to the production mechanism for NH2CHO in hot
cores/corinos (see Sect. 2.3), including both gas and grain-surface processes. If indeed all
of those suggested processes were operative, rather than one single, dominant process, then
discrepancies between sources should perhaps be expected, if not easily explained.
In the chemical models (Fig. 9, right), abundances of most N-bearing species are lower
than values from the observations and cometary measurements. It is possible that some of
this general discrepancy relates to the use of a ratio against HNCO, if this molecule is not
well reproduced by the models. However, the modeled abundance of CH3CN is especially
divergent from the observed value, falling as many as two orders of magnitude short. The
models with which we compare here suggest that much of the gas-phase CH3CN is formed
through gas-phase chemistry at high temperatures and densities, although the dominance of
this process would require a sufficient time period under such conditions. Other recent mod-
els (Bonfand et al. 2019) that use an alternative, and more detailed, physical description in
conjunction with an updated binding energy for CH3CN indicate a grain-surface origin for
this molecule. The abundance of CH3CN may therefore be especially sensitive to physical
conditions and evolutionary timescales in individual sources, thus requiring a more accurate
physical treatment in the chemical models to determine the origins of this molecule. Deeper
integration of gas-grain chemical modeling treatments with magneto-hydrodynamical sim-
ulations of the star-formation process would be of great benefit to distinguishing between
formation mechanisms for key molecules such as this, especially in the case where observa-
tions and models diverge by more than an order of magnitude.
The O-bearing species appear even more closely correlated between IRAS16293B and
Sgr B2(N2) than the N-bearing species with, in particular, a number of the CHO species in
almost 1-to-1 agreement. Comparing the O- and N-bearing species between IRAS16293B
and Comet 67P/C-G, the opposite appears to be the case, with better agreement for the N-
bearing species while the O-bearing species are somewhat more abundant toward the comet
as also noted by Drozdovskaya et al. (2019). The models reproduce the column densities for
the O-bearing species within about an order of magnitude but with larger scatter compared
to the observational datasets. Overall, CH3SH does not show any systematic trends, but a
comparison to CH3OH is perhaps not the most obvious for that species.
42 Jørgensen et al.

7.2. A wider census of oxygen- and nitrogen-bearing species in star formingenvironments
Similar comparisons can also be made for a wider set of sources of different types for which
smaller inventories are present in the literature. Figure 10 shows the abundances of the
common O-bearing species (relative to CH3OH; left) and N-bearing species (relative to
HNCO; right) toward a range of sources. Tentative correlations are also seen here with
abundances in agreement for the O-bearing species in most cases within a factor of about
3–5. A few outliers are seen, but no source or species systematically stands out. For
the N-bearing species slightly more scatter is seen and there is no clear sign of an overall
correlation compared to Sgr B2(N2). The exception to this is the ratio between NH2CHO
and HNCO which shows a relatively constant abundance of HNCO of about 20% compared
to NH2CHO – except for Sgr B2(N2) where NH2CHO is close to a factor 2 more abundant
than HNCO. The former value is in agreement with empirical correlations between the two
species previously reported (e.g., Bisschop et al. 2007; Mendoza et al. 2014; Lopez-Sepulcre
et al. 2015). This correlation has previously been taken as evidence for the formation of
NH2CHO through the addition of H atoms to solid-phase HNCO. However, experimental
evidence suggests that at least the final step in this process does not proceed with any
efficiency, instead re-forming HNCO (Noble et al. 2015), although other work (Haupa,
Tarczay & Lee 2019) indicates that inter-conversion of HNCO and NH2CHO through the
addition of H is indeed possible. A direct chemical relationship, via ice chemistry, between
these two molecules therefore remains somewhat uncertain, although this does not rule
out that similar chemical conditions would promote independent production of both. For
example, Ligterink et al. (2018b) suggest that both molecules could form contemporaneously
in the ices through radical addition.
Furthermore, some astrochemical models suggest that much of the observable gas-phase
HNCO could be a product of the destruction of larger molecules, such as urea, NH2CONH2,
through ion-molecule chemistry (Garrod, Widicus Weaver & Herbst 2008; Tideswell et al.
2010). In this scenario, any HNCO released directly from the grains is destroyed in the gas
phase much earlier on, at lower temperatures. If NH2CONH2 itself, a known interstellar
molecule (Belloche et al. 2019), is predominantly a product of NH2CHO, then a case for
a direct chemical link between HNCO and NH2CHO may be made. On the other hand,
HNCO and NH2CHO may simply be good independent indicators of the overall C, N, and
O abundances available to the chemistry. Indeed, models by Quenard et al. (2018) indicate
that these two molecules are linked through their similar response to temperature, not a
direct chemical link. Correlations between chemically-related molecules, therefore, should
not necessarily be taken to indicate a causal relationship in their interstellar production.
Clearly much work needs to be done to confirm the trends outlined above – in particular,
the relatively small scatter in abundances for many COMs in Sgr B2(N2) vs. IRAS16293B,
as well as the overall agreements across different types of sources. If confirmed, this trend
could have important implications, i.e., that the conditions where the complex organics
form are relatively homogeneous. A speculation could be that this reflects that many of
the complex species form in the colder environments with the subsequent evolution (e.g.,
heating of gas and dust in low- vs. high-mass star forming regions or in shocks) playing a
smaller role. In that case, the small scatter would provide a better defined target for models
and laboratory experiments to shoot for. The possible direct detection of solid-phase COMs
more complex than methanol in cold regions could also be highly valuable in confirming
such a picture and also help addressing the link, if any, between the COMs observed in the
www.annualreviews.org • Astrochemistry during the formation of stars 43

Figure 10
Comparison between the abundances of O- (left) and N-bearing species (right) toward Sgr B2(N2)
(Muller et al. 2016a; Belloche et al. 2016, 2017; Bonfand et al. 2019, and A. Belloche priv. comm.)on the X-axis and a range of sources in the literature on the Y-axis (see legend on the right-hand
side): the low-mass protostellar hot corinos IRAS16293B (Jørgensen et al. 2018; Calcutt et al.
2018b) and NGC 1333-IRAS4A2 (Lopez-Sepulcre et al. 2017), the possible disk atmospheretoward the low-mass protostar HH212 (Lee et al. 2019a), the shocked region B1 in the L1157
outflow, the other hot cores in Sgr B2(N), N3, N4, and N5 (Bonfand et al. 2019, and priv.
comm.), the high-mass star forming region NGC6334I (Zernickel et al. 2012), the Orion compactridge (Crockett et al. 2014) and the high-mass protostar AFGL 4176 (Bøgelund et al. 2019a). The
low- and high-mass sources are shown with plus-signs and crosses, respectively, and the two shocks(Orion and L1157-B1) with diamonds. The abundances of the O-bearing species are measured as
their column densities relative to those of CH3OH while the N-bearing species are measured
relative to HNCO. The three diagonal lines in each panel indicate equal abundances (solid) andabundances factors 3 above or below those in Sgr B2(N2) (dashed).
gas phase toward cold prestellar cores and those in hot cores and corinos.
Further, while strong similarities are seen between IRAS16293B and Sgr B2(N2) those
still differ from the Comet 67P/C-G measurements. The agreement between, e.g., the
IRAS16293B and AFGL4176 column densities (Fig. 10), suggests that this trend may apply
more generally. If confirmed through future systematic chemical inventories, this would
further emphasise that chemical processing must have taken place between the protostellar
and cometary stages. Accounting for this will likely be critical to address the relative
importance of the earliest stages of star formation on any eventual chemical diversity in
protoplanetary disks and (exo)planetary systems.
SUMMARY POINTS
1. Complex organic molecules are detected in a wide range of environments ranging
44 Jørgensen et al.

from cold gas in prestellar cores to the warm gas on Solar System scales close to
individual protostars (Sect. 3).
2. The recent detections of aromatic, branched, and chiral molecules have revealed a
wider range of complexity in the molecular structures available to the chemistry of
star-forming regions and, by implication, to the earliest stages of protostellar and
protoplanetary disk evolution (Sect. 3.1).
3. From a theoretical/modeling perspective, the specific formation mechanisms for
individual species are still open for discussion with both grain-surface/ice and gas-
phase processes providing possible formation pathways (Sect. 2.3).
4. Spatial differentiation between individual molecules and groups of species are seen
toward some regions, which may reflect their physical structure or evolution, and/or
more microphysical effects such as variations in binding energies (Sect. 4).
5. The importance of the detailed physical evolution of protostars on their resulting
chemistry is complex, with processes such as disk formation, accretion shocks, and
episodic accretion – as well as shock events such as those seen in the Orion KL
region – all potentially affecting the degree of chemical processing on a source-by-
source basis (Sect. 5). However, the importance of these effects on the end-result,
e.g., in terms of the relative abundances of COMs, remains to be quantified.
6. The degree of fractionation varies between different types of regions, for example
with the enhanced deuteration of water and complex organics in low- versus high-
mass star-forming regions. Systematic variations are also seen in the fractionation
between groups of molecules, perhaps reflecting the conditions under which they
form (Sect. 6).
7. Comparisons between the relative abundances of groups of molecules show promise
for providing empirical insights into the origin of chemical complexity and the link
to the Solar System. Specifically an excellent agreement between the abundances
measured toward two significantly different regions, namely the low-mass protostar
IRAS16293B and the Galactic center/high-mass star-forming region Sgr B2(N2),
may suggest that interstellar complex chemistry is relatively robust to environmen-
tal effects (Sect. 7). Such correlations also set well-defined targets for future work
on chemical modeling and laboratory experiments.
FUTURE ISSUES
1. The presence of complex organic molecules toward cold regions highlights the im-
portance of understanding the composition of dust-grain ice mantles (Sect. 3.3). A
key task for upcoming observations with the James Webb Space Telescope (JWST)
will be to reveal the composition of these ices in terms of complex organic molecules.
Those observations will thereby help to define the link between the ice chemistry
and the large gas-phase inventories established through observations at longer wave-
lengths.
2. Both from a physical and chemical point of view, there is significant work to do
in comparing the predictions of numerical (magneto)hydrodynamical models to the
molecular signatures observed toward protostars, as well as understanding, for ex-
www.annualreviews.org • Astrochemistry during the formation of stars 45
ample, the processes leading to the formation of disks and accretion through the
evolution of protostars. Deeper integration of detailed chemical models with hydro-
dynamical simulations, to account for the chemical effects of more realistic treat-
ments of physical evolution, would go some way to disentangling inaccuracies in the
chemical treatments from the uncertainties associated purely with source structure.
3. Significant work needs to be done on expanding the large molecular inventory sur-
veys to wider samples of sources in a systematic way. This is recognised as one
of the key scientific goals of the ALMA Development Roadmap (Carpenter et al.
2018). Such upgrades will enable comparisons similar to those of Fig. 9 to many
more sources in diverse environments and stages of evolution.
4. Moving forward with the characterization of the degree of molecular complexity
in the gas phase of star forming regions will require sensitive surveys that can
go beyond the confusion limit reached today. Solutions may be to target lower
frequencies, e.g., with ALMA and NOEMA below 80 GHz or with ngVLA – or to
perform high angular resolution observations to further resolve regions with narrow
linewidths.
5. The high angular resolution achievable with ALMA may allow astrochemical studies
in the time domain such as proposed in connection with studies of COMs in the
Orion KL region and outflows (Sects. 3.4 and 4.2). If indeed possible, this would
be an interesting avenue to explore further.
DISCLOSURE STATEMENT
The authors are not aware of any affiliations, memberships, funding, or financial holdings
that might be perceived as affecting the objectivity of this review.
ACKNOWLEDGMENTS
We are grateful to Yuri Aikawa, Geoff Blake, Paola Caselli, Eric Herbst, Niels Ligterink,
Laurent Margules and Ewine van Dishoeck for reading and providing comments about the
manuscript. Also, we thank Per Bjerkeli, Timea Csengeri, Sigurd Jensen and Laurent Pa-
gani for providing material used in some of the figures. JKJ acknowledges support by the
European Research Council (ERC) under the European Union’s Horizon 2020 research
and innovation programme through ERC Consolidator Grant “S4F” (grant agreement
No 646908). AB acknowledges support by the Deutsche Forschungsgemeinschaft (DFG)
through the collaborative research grant SFB 956 (project ID 184018867), sub-project B3.
RTG acknowledges support from the NASA Astrophysics Research and Analysis program
(grant NNX15AG07G), the NASA Emerging Worlds program (grant NNX17AE23G), and
the NASA Astrophysics Theory Program (grant 80NSSCI8K0558).
A. Molecular abundances
LITERATURE CITED
Acharyya K, Herbst E. 2018. ApJ 859:51
46 Jørgensen et al.

Table 2 Abundances relative to CH3OH used in Fig. 9 from measurements toward
IRAS16293B, SgrB2(N2) and Comet 67P/C-G as well as predicted by models.
Species IRAS16293Ba Sgr B2(N2)b Model predictionsc Comet 67P/C-Gd
(PILS) (EMoCA)
CH3OH 1.0 1.0 1.0 1.0
H2CO 0.19 . . . 0.48 1.5
C2H5OH 0.023 0.050 0.0130.19e
CH3OCH3 0.024 0.055 0.0096
CH3OCHO 0.026 0.030 0.0059
0.016eCH2OHCHO 0.0034 0.0033∗ 0.038
CH3COOH 0.00028 <0.0005∗ 1.2e-05
CH3CHO 0.012 0.011 0.0150.22e
c-C2H4O 0.00054 . . . . . .
CH3OCH2OH 0.014 <0.017∗ 0.00440.052e
(CH2OH)2 0.0099f . . . . . .
CH3COCH3 0.0017 0.010 . . .0.022e
C2H5CHO 0.00022 . . . . . .
NH2CHO 0.0010 0.088 0.020 0.019
CH3CN 0.004 0.055 0.000280.028e
CH3NC 2.0e-05 0.00025 . . .
HNCO 0.0037 0.050 0.034 0.13
HC3N 1.8e-05 0.0088 0.0024 0.0019
CH3SH 0.00048 0.0085 0.00018 0.18
CH3NCO 0.00040 0.0055 0.00026 . . .
C2H5CN 0.00036 0.16 0.0033 . . .
C2H3CN 7.4e-05 0.011 0.00056 . . .
CH3CONH2 0.00025 0.0035 0.0011 . . .
HONO 9.0e-05 <0.00030∗ . . . . . .
CH2CO 0.0048 0.0083∗ 0.0013 . . .aMeasurements toward IRAS16293B in connection with the PILS program (Jørgensen et al. 2016, 2018;
Coutens et al. 2016, 2019; Lykke et al. 2017; Calcutt et al. 2018b,a; Ligterink et al. 2017; Drozdovskaya
et al. 2018; Persson et al. 2018; Manigand et al. 2020), see also summary by Drozdovskaya et al. (2019).bMeasurements toward Sgr B2(N2) in connection with the EMoCA program (Belloche et al. 2016, 2017;
Muller et al. 2016a; Bonfand et al. 2019; Ordu et al. 2019; Willis et al. 2019). New measurements pre-
sented here for the first time (Belloche, priv. comm) indicated with a “∗ c”Results from the MAGICKAL
simulations presented by Muller et al. (2016a) and Belloche et al. (2017). dMeasurements from ROSINA
instrument presented by Drozdovskaya et al. (2019). eSpecies indistinguishable in the ROSINA spectrom-
eter measurements of Comet 67P/C-G. fRefers to total abundance of the two lowest state conformers,
aGg′ and gGg′, of ethylene glycol, (CH2OH)2.
Agundez M, Cernicharo J, Guelin M, Gerin M, McCarthy MC, Thaddeus P. 2008. A&A 478:L19–
L22
Agundez M, Marcelino N, Cernicharo J, Roueff E, Tafalla M. 2019. A&A 625:A147
Aikawa Y, Wakelam V, Hersant F, Garrod RT, Herbst E. 2012. ApJ 760:40
Alexander CMO, Bowden R, Fogel ML, Howard KT, Herd CDK, Nittler LR. 2012. Science 337:721
Allen DA, Burton MG. 1993. Nature 363:54–56
Allen M, Robinson GW. 1977. ApJ 212:396–415
Allen V, van der Tak FFS, Sanchez-Monge A, Cesaroni R, Beltran MT. 2017. A&A 603:A133
Alonso ER, Kolesnikova L, Tercero B, Cabezas C, Alonso JL, et al. 2016. ApJ 832:42
Alvarez-Barcia S, Russ P, Kastner J, Lamberts T. 2018. MNRAS 479:2007–2015
Anderl S, Maret S, Cabrit S, Belloche A, Maury AJ, et al. 2016. A&A 591:A3
www.annualreviews.org • Astrochemistry during the formation of stars 47

Arce HG, Santiago-Garcıa J, Jørgensen JK, Tafalla M, Bachiller R. 2008. ApJ 681:L21–L24
Artur de la Villarmois E, Jørgensen JK, Kristensen LE, Bergin EA, Harsono D, et al. 2019. A&A
626:A71
Artur de la Villarmois E, Kristensen LE, Jørgensen JK, Bergin EA, Brinch C, et al. 2018. A&A
614:A26
Audard M, Abraham P, Dunham MM, Green JD, Grosso N, et al. 2014. Episodic Accretion in Young
Stars. In Protostars and Planets VI, eds. H Beuther, RS Klessen, CP Dullemond, T Henning
Bacmann A, Taquet V, Faure A, Kahane C, Ceccarelli C. 2012. A&A 541:L12
Bally J, Ginsburg A, Arce H, Eisner J, Youngblood A, et al. 2017. ApJ 837:60
Bally J, Zinnecker H. 2005. AJ 129:2281–2293
Balucani N, Ceccarelli C, Taquet V. 2015. MNRAS 449:L16–L20
Barger CJ, Garrod RT. 2020. ApJ 888:38
Barone V, Latouche C, Skouteris D, Vazart F, Balucani N, et al. 2015. MNRAS 453:L31–L35
Bell TA, Cernicharo J, Viti S, Marcelino N, Palau A, et al. 2014. A&A 564:A114
Belloche A, Garrod RT, Muller HSP, Menten KM. 2014. Science 345:1584–1587
Belloche A, Garrod RT, Muller HSP, Menten KM, Medvedev I, et al. 2019. A&A 628:A10
Belloche A, Meshcheryakov AA, Garrod RT, Ilyushin VV, Alekseev EA, et al. 2017. A&A 601:A49
Belloche A, Muller HSP, Garrod RT, Menten KM. 2016. A&A 587:A91
Belloche A, Muller HSP, Menten KM, Schilke P, Comito C. 2013. A&A 559:A47
Benedettini M, Busquet G, Lefloch B, Codella C, Cabrit S, et al. 2012. A&A 539:L3
Bennett CJ, Chen SH, Sun BJ, Chang AHH, Kaiser RI. 2007. ApJ 660:1588–1608
Bennett CJ, Hama T, Kim YS, Kawasaki M, Kaiser RI. 2011. ApJ 727:27
Bergner JB, Oberg KI, Rajappan M, Fayolle EC. 2016. ApJ 829:85
Bertin M, Romanzin C, Doronin M, Philippe L, Jeseck P, et al. 2016. ApJ 817:L12
Bisschop SE, Jørgensen JK, Bourke TL, Bottinelli S, van Dishoeck EF. 2008. A&A 488:959–968
Bisschop SE, Jørgensen JK, van Dishoeck EF, de Wachter EBM. 2007. A&A 465:913–929
Bizzocchi L, Caselli P, Spezzano S, Leonardo E. 2014. A&A 569:A27
Bjerkeli P, Jørgensen JK, Bergin EA, Frimann S, Harsono D, et al. 2016. A&A 595:A39
Bjerkeli P, Jørgensen JK, Brinch C. 2016. A&A 587:A145
Blake GA, Mundy LG, Carlstrom JE, Padin S, Scott SL, et al. 1996. ApJ 472:L49
Bøgelund EG, Barr AG, Taquet V, Ligterink NFW, Persson MV, et al. 2019a. A&A 628:A2
Bøgelund EG, McGuire BA, Hogerheijde MR, van Dishoeck EF, Ligterink NFW. 2019b. A&A
624:A82
Bøgelund EG, McGuire BA, Ligterink NFW, Taquet V, Brogan CL, et al. 2018. A&A 615:A88
Bonfand M, Belloche A, Garrod RT, Menten KM, Willis E, et al. 2019. A&A 628:A27
Bonfand M, Belloche A, Menten KM, Garrod RT, Muller HSP. 2017. A&A 604:A60
Boogert ACA, Gerakines PA, Whittet DCB. 2015. ARA&A 53:541–581
Brinch C, Jørgensen JK. 2013. A&A 559:A82
Brouillet N, Despois D, Baudry A, Peng TC, Favre C, et al. 2013. A&A 550:A46
Brown PD, Charnley SB, Millar TJ. 1988. MNRAS 231:409–417
Burkhardt AM, Dollhopf NM, Corby JF, Carroll PB, Shingledecker CN, et al. 2016. ApJ 827:21
Burkhardt AM, Shingledecker CN, Le Gal R, McGuire BA, Remijan AJ, Herbst E. 2019. ApJ
881:32
Butscher T, Duvernay F, Danger G, Chiavassa T. 2016. A&A 593:A60
Butscher T, Duvernay F, Rimola A, Segado-Centellas M, Chiavassa T. 2017. Physical Chemistry
Chemical Physics (Incorporating Faraday Transactions) 19:2857–2866
Calcutt H, Fiechter MR, Willis ER, Muller HSP, Garrod RT, et al. 2018a. A&A 617:A95
Calcutt H, Jørgensen JK, Muller HSP, Kristensen LE, Coutens A, et al. 2018b. A&A 616:A90
Calcutt H, Viti S, Codella C, Beltran MT, Fontani F, Woods PM. 2014. MNRAS 443:3157–3173
Carpenter J, Iono D, Testi L, Whyborn N, Wootten A, Evans N. 2018. The ALMA Devel-
opment Roadmap (https://almaobservatory.org/wp-content/uploads/2018/07/20180712-alma-
48 Jørgensen et al.

development-roadmap.pdf)
Caselli P, Ceccarelli C. 2012. A&A Rev 20:56
Caselli P, Keto E, Bergin EA, Tafalla M, Aikawa Y, et al. 2012. ApJ 759:L37
Caselli P, Keto E, Pagani L, Aikawa Y, Yıldız UA, et al. 2010. A&A 521:L29
Cassen P, Moosman A. 1981. Icarus 48:353–376
Caswell JL. 1996. MNRAS 283:606–612
Ceccarelli C, Caselli P, Bockelee-Morvan D, Mousis O, Pizzarello S, et al. 2014. Deuterium Frac-
tionation: The Ariadne’s Thread from the Precollapse Phase to Meteorites and Comets Today.
In Protostars and Planets VI, eds. H Beuther, RS Klessen, CP Dullemond, T Henning
Cernicharo J, Gallego JD, Lopez-Perez JA, Tercero F, Tanarro I, et al. 2019. A&A 626:A34
Cernicharo J, Kisiel Z, Tercero B, Kolesnikova L, Medvedev IR, et al. 2016. A&A 587:L4
Charnley SB, Tielens AGGM, Millar TJ. 1992. ApJ 399:L71
Chuang KJ, Fedoseev G, Ioppolo S, van Dishoeck EF, Linnartz H. 2016. MNRAS 455:1702–1712
Cleeves LI, Bergin EA, Alexander CMOD, Du F, Graninger D, et al. 2014. Science 345:1590–1593
Codella C, Ceccarelli C, Bianchi E, Podio L, Bachiller R, et al. 2016. MNRAS 462:L75–L79
Codella C, Ceccarelli C, Caselli P, Balucani N, Barone V, et al. 2017. A&A 605:L3
Codella C, Ceccarelli C, Lefloch B, Fontani F, Busquet G, et al. 2012. ApJ 757:L9
Codella C, Lefloch B, Ceccarelli C, Cernicharo J, Caux E, et al. 2010. A&A 518:L112
Corby J. 2016. Astrochemistry in The Age of Broadband Radio Astronomy. Ph.D. thesis, University
of Virginia
Corby JF, Jones PA, Cunningham MR, Menten KM, Belloche A, et al. 2015. MNRAS 452:3969–
3993
Cordiner MA, Charnley SB, Kisiel Z, McGuire BA, Kuan YJ. 2017. ApJ 850:187
Coudert LH, Drouin BJ, Tercero B, Cernicharo J, Guillemin JC, et al. 2013. ApJ 779:119
Coudert LH, Margules L, Vastel C, Motiyenko R, Caux E, Guillemin JC. 2019. A&A 624:A70
Coutens A, Jørgensen JK, Persson MV, van Dishoeck EF, Vastel C, Taquet V. 2014. ApJ 792:L5
Coutens A, Jørgensen JK, van der Wiel MHD, Muller HSP, Lykke JM, et al. 2016. A&A 590:L6
Coutens A, Ligterink NFW, Loison JC, Wakelam V, Calcutt H, et al. 2019. A&A 623:L13
Coutens A, Persson MV, Jørgensen JK, Wampfler SF, Lykke JM. 2015. A&A 576:A5
Coutens A, Vastel C, Caux E, Ceccarelli C, Bottinelli S, et al. 2012. A&A 539:A132
Coutens A, Vastel C, Cazaux S, Bottinelli S, Caux E, et al. 2013. A&A 553:A75
Crockett NR, Bergin EA, Neill JL, Favre C, Blake GA, et al. 2015. ApJ 806:239
Crockett NR, Bergin EA, Neill JL, Favre C, Schilke P, et al. 2014. ApJ 787:112
Csengeri T, Belloche A, Bontemps S, Wyrowski F, Menten KM, Bouscasse L. 2019. A&A 632:A57
Csengeri T, Bontemps S, Wyrowski F, Belloche A, Menten KM, et al. 2018. A&A 617:A89
Cuppen HM, Walsh C, Lamberts T, Semenov D, Garrod RT, et al. 2017. Space Science Reviews
212:1–58
Dartois E, Thi W, Geballe TR, Deboffle D, d’Hendecourt L, van Dishoeck E. 2003. A&A 399:1009–
1020
Degli Esposti C, Dore L, Melosso M, Kobayashi K, Fujita C, Ozeki H. 2017. ApJS 230:26
Drozdovskaya MN, van Dishoeck EF, Jørgensen JK, Calmonte U, van der Wiel MHD, et al. 2018.
MNRAS 476:4949–4964
Drozdovskaya MN, van Dishoeck EF, Rubin M, Jørgensen JK, Altwegg K. 2019. MNRAS 490:50–79
Dulieu F, Nguyen T, Congiu E, Baouche S, Taquet V. 2019. MNRAS 484:L119–L123
Dunham MM, Stutz AM, Allen LE, Evans N. J. I, Fischer WJ, et al. 2014. The Evolution of
Protostars: Insights from Ten Years of Infrared Surveys with Spitzer and Herschel. In Protostars
and Planets VI, eds. H Beuther, RS Klessen, CP Dullemond, T Henning
Ehrenfreund P, Boogert ACA, Gerakines PA, Tielens AGGM, van Dishoeck EF. 1997. A&A 328:649–
669
El-Abd SJ, Brogan CL, Hunter TR, Willis ER, Garrod RT, McGuire BA. 2019. ApJ 883:129
Enrique-Romero J, Rimola A, Ceccarelli C, Balucani N. 2016. MNRAS 459:L6–L10
www.annualreviews.org • Astrochemistry during the formation of stars 49

Faure A, Lique F, Remijan AJ. 2018. The Journal of Physical Chemistry Letters 9:3199–3204
Faure A, Remijan AJ, Szalewicz K, Wiesenfeld L. 2014. ApJ 783:72
Favre C, Carvajal M, Field D, Jørgensen JK, Bisschop SE, et al. 2014. ApJS 215:25
Favre C, Pagani L, Goldsmith PF, Bergin EA, Carvajal M, et al. 2017. A&A 604:L2
Fayolle EC, Oberg KI, Jørgensen JK, Altwegg K, Calcutt H, et al. 2017. Nature Astronomy 1:703–
708
Fedoseev G, Chuang KJ, van Dishoeck EF, Ioppolo S, Linnartz H. 2016. MNRAS 460:4297–4309
Fedoseev G, Cuppen HM, Ioppolo S, Lamberts T, Linnartz H. 2015. MNRAS 448:1288–1297
Feng S, Beuther H, Henning T, Semenov D, Palau A, Mills EAC. 2015. A&A 581:A71
Fontani F, Busquet G, Palau A, Caselli P, Sanchez-Monge A, et al. 2015a. A&A 575:A87
Fontani F, Codella C, Ceccarelli C, Lefloch B, Viti S, Benedettini M. 2014. ApJ 788:L43
Friedel DN, Snyder LE. 2008. ApJ 672:962–973
Frimann S, Jørgensen JK, Dunham MM, Bourke TL, Kristensen LE, et al. 2017. A&A 602:A120
Frimann S, Jørgensen JK, Padoan P, Haugbølle T. 2016. A&A 587:A60
Furuya K, Aikawa Y. 2018. ApJ 857:105
Furuya K, Aikawa Y, Hincelin U, Hassel GE, Bergin EA, et al. 2015. A&A 584:A124
Furuya K, Drozdovskaya MN, Visser R, van Dishoeck EF, Walsh C, et al. 2017. A&A 599:A40
Furuya K, van Dishoeck EF, Aikawa Y. 2016. A&A 586:A127
Gaches BAL, Offner SSR. 2018. ApJ 861:87
Garrod RT. 2008. A&A 491:239–251
Garrod RT. 2013. ApJ 765:60
Garrod RT. 2019. ApJ 884:69
Garrod RT, Belloche A, Muller HSP, Menten KM. 2017. A&A 601:A48
Garrod RT, Herbst E. 2006. A&A 457:927–936
Garrod RT, Pauly T. 2011. ApJ 735:15
Garrod RT, Vasyunin AI, Semenov DA, Wiebe DS, Henning T. 2009. ApJ 700:L43–L46
Garrod RT, Wakelam V, Herbst E. 2007. A&A 467:1103–1115
Garrod RT, Widicus Weaver SL, Herbst E. 2008. ApJ 682:283–302
Garrod RT, Williams DA, Hartquist TW, Rawlings JMC, Viti S. 2005. MNRAS 356:654–664
Gaume RA, Claussen MJ, de Pree CG, Goss WM, Mehringer DM. 1995. ApJ 449:663
Gerakines PA, Whittet DCB, Ehrenfreund P, Boogert ACA, Tielens AGGM, et al. 1999. ApJ
522:357–377
Ginsburg A, Bally J, Barnes A, Bastian N, Battersby C, et al. 2018. ApJ 853:171
Goddi C, Greenhill LJ, Humphreys EML, Chandler CJ, Matthews LD. 2011. ApJ 739:L13
Goldsmith PF, Langer WD. 1999. ApJ 517:209–225
Gomez L, RodrIguez LF, Loinard L, Lizano S, Poveda A, Allen C. 2005. ApJ 635:1166–1172
Guzman AE, Sanhueza P, Contreras Y, Smith HA, Jackson JM, et al. 2015. ApJ 815:130
Halfen DT, Apponi AJ, Woolf N, Polt R, Ziurys LM. 2006. ApJ 639:237–245
Halfen DT, Woolf NJ, Ziurys LM. 2017. ApJ 845:158
Hamberg M, Osterdahl F, Thomas RD, Zhaunerchyk V, Vigren E, et al. 2010. A&A 514:A83
Harsono D, Bjerkeli P, van der Wiel MHD, Ramsey JP, Maud LT, et al. 2018. Nature Astronomy
2:646–651
Harsono D, Jørgensen JK, van Dishoeck EF, Hogerheijde MR, Bruderer S, et al. 2014. A&A 562:A77
Hasegawa TI, Herbst E. 1993. MNRAS 263:589
Haupa KA, Tarczay G, Lee YP. 2019. J. Am. Chem. Soc. 141:11614–11620
Heays AN, Visser R, Gredel R, Ubachs W, Lewis BR, et al. 2014. A&A 562:A61
Henderson BL, Gudipati MS. 2015. ApJ 800:66
Henkel C, Jacq T, Mauersberger R, Menten KM, Steppe H. 1987. A&A 188:L1–L4
Herbst E, van Dishoeck EF. 2009. ARA&A 47:427–480
Herczeg GJ, Karska A, Bruderer S, Kristensen LE, van Dishoeck EF, et al. 2012. A&A 540:A84
Hernandez-Hernandez V, Zapata L, Kurtz S, Garay G. 2014. ApJ 786:38
50 Jørgensen et al.
Hollis JM. 2005. Complex Molecules and the GBT: Is Isomerism the Key? In Astrochemistry:
Recent Successes and Current Challenges, eds. DC Lis, GA Blake, E Herbst, vol. 231 of IAU
Symposium
Hollis JM, Jewell PR, Lovas FJ, Remijan A. 2004b. ApJ 613:L45–L48
Hollis JM, Jewell PR, Lovas FJ, Remijan A, Møllendal H. 2004a. ApJ 610:L21–L24
Hollis JM, Lovas FJ, Remijan AJ, Jewell PR, Ilyushin VV, Kleiner I. 2006b. ApJ 643:L25–L28
Hollis JM, Remijan AJ, Jewell PR, Lovas FJ. 2006a. ApJ 642:933–939
Hsieh TH, Murillo NM, Belloche A, Hirano N, Walsh C, et al. 2018. ApJ 854:15
Hsieh TH, Murillo NM, Belloche A, Hirano N, Walsh C, et al. 2019. ApJ 884:149
Indriolo N, Neufeld DA, Gerin M, Schilke P, Benz AO, et al. 2015. ApJ 800:40
Jacobsen SK, Jørgensen JK, Di Francesco J, Evans NJI, Choi M, Lee JE. 2019. A&A 629
Jacq T, Baudry A, Walmsley CM, Caselli P. 1999. A&A 347:957–966
Jacq T, Walmsley CM, Mauersberger R, Anderson T, Herbst E, De Lucia FC. 1993. A&A 271:276
Jensen SS, Jørgensen JK, Kristensen LE, Furuya K, Coutens A, et al. 2019. A&A 631:A25
Jimenez-Serra I, Vasyunin AI, Caselli P, Marcelino N, Billot N, et al. 2016. ApJ 830:L6
Jin M, Garrod RT. 2020. ApJ submitted
Jones PA, Burton MG, Cunningham MR, Menten KM, Schilke P, et al. 2008. MNRAS 386:117–137
Jones PA, Burton MG, Tothill NFH, Cunningham MR. 2011. MNRAS 411:2293–2310
Jørgensen JK, Favre C, Bisschop SE, Bourke TL, van Dishoeck EF, Schmalzl M. 2012. ApJ 757:L4
Jørgensen JK, Johnstone D, van Dishoeck EF, Doty SD. 2006. A&A 449:609–619
Jørgensen JK, Muller HSP, Calcutt H, Coutens A, Drozdovskaya MN, et al. 2018. A&A 620:A170
Jørgensen JK, van der Wiel MHD, Coutens A, Lykke JM, Muller HSP, et al. 2016. A&A 595:A117
Jørgensen JK, van Dishoeck EF. 2010a. ApJ 725:L172–L175
Jørgensen JK, van Dishoeck EF. 2010b. ApJ 710:L72–L76
Jørgensen JK, van Dishoeck EF, Visser R, Bourke TL, Wilner DJ, et al. 2009. A&A 507:861–879
Jørgensen JK, Visser R, Sakai N, Bergin EA, Brinch C, et al. 2013. ApJ 779:L22
Jørgensen JK, Visser R, Williams JP, Bergin EA. 2015. A&A 579:A23
Kahane C, Ceccarelli C, Faure A, Caux E. 2013. ApJ 763:L38
Kaifu N, Morimoto M, Nagane K, Akabane K, Iguchi T, Takagi K. 1974. ApJ 191:L135–L137
Kalenskii SV, Johansson LEB. 2010. Astronomy Reports 54:1084–1104
Kalvans J. 2018. MNRAS 478:2753–2765
Kim HJ, Evans II NJ, Dunham MM, Lee JE, Pontoppidan KM. 2012. ApJ 758:38
Kolesnikova L, Tercero B, Alonso ER, Guillemin JC, Cernicharo J, Alonso JL. 2018. A&A 609:A24
Krim L, Jonusas M, Guillemin JC, Yanez M, Lamsabhi AM. 2018. Phys. Chem. Chem. Phys.
20:19971
Le Petit F, Ruaud M, Bron E, Godard B, Roueff E, et al. 2016. A&A 585:A105
Lee CF, Codella C, Li ZY, Liu SY. 2019a. ApJ 876:63
Lee CF, Li ZY, Ho PTP, Hirano N, Zhang Q, Shang H. 2017. ApJ 843:27
Lee JE. 2007. Journal of Korean Astronomical Society 40:83–89
Lee JE, Lee S, Baek G, Aikawa Y, Cieza L, et al. 2019b. Nature Astronomy 3:314–319
Lefloch B, Ceccarelli C, Codella C, Favre C, Podio L, et al. 2017. MNRAS 469:L73–L77
Li J, Shen Z, Wang J, Chen X, Li D, et al. 2017. ApJ 849:115
Ligterink NFW, Calcutt H, Coutens A, Kristensen LE, Bourke TL, et al. 2018a. A&A 619:A28
Ligterink NFW, Coutens A, Kofman V, Muller HSP, Garrod RT, et al. 2017. MNRAS 469:2219–
2229
Ligterink NFW, Tenenbaum ED, van Dishoeck EF. 2015. A&A 576:A35
Ligterink NFW, Terwisscha van Scheltinga J, Taquet V, Jørgensen JK, Cazaux S, et al. 2018b.
MNRAS 480:3628–3643
Lindberg JE, Jørgensen JK, Brinch C, Haugbølle T, Bergin EA, et al. 2014. A&A 566:A74
Linsky JL. 2003. Space Science Reviews 106:49–60
Lis DC, Biver N, Bockelee-Morvan D, Hartogh P, Bergin EA, et al. 2013. ApJ 774:L3
www.annualreviews.org • Astrochemistry during the formation of stars 51

Liu F, Parise B, Kristensen L, Visser R, van Dishoeck EF, Gusten R. 2011. A&A 527:A19
Longmore SN, Rathborne J, Bastian N, Alves J, Ascenso J, et al. 2012. ApJ 746:117
Loomis RA, Zaleski DP, Steber AL, Neill JL, Muckle MT, et al. 2013. ApJ 765:L9
Lopez-Sepulcre A, Jaber AA, Mendoza E, Lefloch B, Ceccarelli C, et al. 2015. MNRAS 449:2438–
2458
Lopez-Sepulcre A, Sakai N, Neri R, Imai M, Oya Y, et al. 2017. A&A 606:A121
Lu Y, Chang Q, Aikawa Y. 2018. ApJ 869:165
Lubowich DA, Pasachoff JM, Balonek TJ, Millar TJ, Tremonti C, et al. 2000. Nature 405:1025–1027
Luhman KL, Robberto M, Tan JC, Andersen M, Giulia Ubeira Gabellini M, et al. 2017. ApJ 838:L3
Lykke JM, Coutens A, Jørgensen JK, van der Wiel MHD, Garrod RT, et al. 2017. A&A 597:A53
Lyons JR, Young ED. 2005. Nature 435:317–320
Mangum JG, Shirley YL. 2015. PASP 127:266
Manigand S, Calcutt H, Jørgensen JK, Taquet V, Muller HSP, et al. 2019. A&A 623:A69
Manigand S, Jørgensen JK, Calcutt H, Muller HSP, Ligterink NFW, et al. 2020. A&A 635:A48
Margules L, Belloche A, Muller HSP, Motiyenko RA, Guillemin JC, et al. 2016. A&A 590:A93
Margules L, Huet TR, Demaison J, Carvajal M, Kleiner I, et al. 2010. ApJ 714:1120–1132
Margules L, McGuire BA, Senent ML, Motiyenko RA, Remijan A, Guillemin JC. 2017. A&A
601:A50
Martın-Domenech R, Munoz Caro GM, Cruz-Dıaz GA. 2016. A&A 589:A107
Martin-Drumel MA, Lee KLK, Belloche A, Zingsheim O, Thorwirth S, et al. 2019. A&A 623:A167
Mauersberger R, Henkel C, Jacq T, Walmsley CM. 1988. A&A 194:L1–L4
Mauersberger R, Henkel C, Walmsley CM, Sage LJ, Wiklind T. 1991. A&A 247:307
McGuire BA, Burkhardt AM, Kalenskii S, Shingledecker CN, Remijan AJ, et al. 2018. Science
359:202–205
McGuire BA, Carroll PB, Dollhopf NM, Crockett NR, Corby JF, et al. 2015. ApJ 812:76
McGuire BA, Carroll PB, Loomis RA, Finneran IA, Jewell PR, et al. 2016. Science 352:1449–1452
McGuire BA, Shingledecker CN, Willis ER, Burkhardt AM, El-Abd S, et al. 2017. ApJ 851:L46
Mendoza E, Lefloch B, Lopez-Sepulcre A, Ceccarelli C, Codella C, et al. 2014. MNRAS 445:151–161
Minier V, Ellingsen SP, Norris RP, Booth RS. 2003. A&A 403:1095–1100
Molet J, Brouillet N, Nony T, Gusdorf A, Motte F, et al. 2019. A&A 626:A132
Moller T, Endres C, Schilke P. 2017. A&A 598:A7
Motiyenko RA, Armieieva IA, Margules L, Alekseev EA, Guillemin JC. 2019. A&A 623:A162
Mottram JC, van Dishoeck EF, Schmalzl M, Kristensen LE, Visser R, et al. 2013. A&A 558:A126
Muller HSP, Belloche A, Xu LH, Lees RM, Garrod RT, et al. 2016a. A&A 587:A92
Muller HSP, Schloder F, Stutzki J, Winnewisser G. 2005. Journal of Molecular Structure 742:215–
227
Muller HSP, Thorwirth S, Roth DA, Winnewisser G. 2001. A&A 370:L49–L52
Muller HSP, Walters A, Wehres N, Belloche A, Wilkins OH, et al. 2016b. A&A 595:A87
Muller S, Beelen A, Black JH, Curran SJ, Horellou C, et al. 2013. A&A 551:A109
Muller S, Beelen A, Guelin M, Aalto S, Black JH, et al. 2011. A&A 535:A103
Muller S, Combes F, Guelin M, Gerin M, Aalto S, et al. 2014. A&A 566:A112
Murillo NM, Lai SP, Bruderer S, Harsono D, van Dishoeck EF. 2013. A&A 560:A103
Neill JL, Bergin EA, Lis DC, Schilke P, Crockett NR, et al. 2014. ApJ 789:8
Neill JL, Crockett NR, Bergin EA, Pearson JC, Xu LH. 2013. ApJ 777:85
Neill JL, Muckle MT, Zaleski DP, Steber AL, Pate BH, et al. 2012. ApJ 755:153
Neill JL, Steber AL, Muckle MT, Zaleski DP, Lattanzi V, et al. 2011. Journal of Physical Chemistry
A 115:6472–6480
Neufeld DA, Hollenbach DJ. 1994. ApJ 428:170–185
Noble JA, Theule P, Congiu E, Dulieu F, Bonnin M, et al. 2015. A&A 576:A91
Oberg KI. 2016. Chemical Reviews 116:9631–9663
Oberg KI, Boamah MD, Fayolle EC, Garrod RT, Cyganowski CJ, van der Tak F. 2013. ApJ 771:95
52 Jørgensen et al.
Oberg KI, Bottinelli S, Jørgensen JK, van Dishoeck EF. 2010. ApJ 716:825–834
Oberg KI, Fayolle EC, Reiter JB, Cyganowski C. 2014. Faraday Discussions 168:81–101
Oberg KI, Garrod RT, van Dishoeck EF, Linnartz H. 2009. A&A 504:891–913
Oberg KI, van der Marel N, Kristensen LE, van Dishoeck EF. 2011. ApJ 740:14
Ohishi M, Suzuki T, Hirota T, Saito M, Kaifu N. 2019. PASJ 71:86
Ordu MH, Muller HSP, Walters A, Nunez M, Lewen F, et al. 2012. A&A 541:A121
Ordu MH, Zingsheim O, Belloche A, Lewen F, Garrod RT, et al. 2019. A&A 629:A72
Ospina-Zamudio J, Favre C, Kounkel M, Xu LH, Neill J, et al. 2019. A&A 627:A80
Oya Y, Sakai N, Lopez-Sepulcre A, Watanabe Y, Ceccarelli C, et al. 2016. ApJ 824:88
Oya Y, Sakai N, Watanabe Y, Higuchi AE, Hirota T, et al. 2017. ApJ 837:174
Pagani L, Bergin E, Goldsmith PF, Melnick G, Snell R, Favre C. 2019. A&A 624:L5
Pagani L, Favre C, Goldsmith PF, Bergin EA, Snell R, Melnick G. 2017. A&A 604:A32
Palau A, Walsh C, Sanchez-Monge A, Girart JM, Cesaroni R, et al. 2017. MNRAS 467:2723–2752
Parise B, Castets A, Herbst E, Caux E, Ceccarelli C, et al. 2004. A&A 416:159–163
Parise B, Ceccarelli C, Tielens AGGM, Herbst E, Lefloch B, et al. 2002. A&A 393:L49–L53
Peng TC, Despois D, Brouillet N, Baudry A, Favre C, et al. 2013. A&A 554:A78
Peng TC, Despois D, Brouillet N, Parise B, Baudry A. 2012. A&A 543:A152
Persson MV, Jørgensen JK, Muller HSP, Coutens A, van Dishoeck EF, et al. 2018. A&A 610:A54
Persson MV, Jørgensen JK, van Dishoeck EF. 2013. A&A 549:L3
Persson MV, Jørgensen JK, van Dishoeck EF, Harsono D. 2014. A&A 563:A74
Pickett HM, Poynter IRL, Cohen EA, Delitsky ML, Pearson JC, Muller HSP. 1998.
J. Quant. Spec. Radiat. Transf. 60:883–890
Pizzarello S, Groy TL. 2011. Geochim. Cosmochim. Acta 75:645–656
Plambeck RL, Wright MCH, Friedel DN, Widicus Weaver SL, Bolatto AD, et al. 2009. ApJ 704:L25–
L28
Polehampton ET, Baluteau JP, Ceccarelli C, Swinyard BM, Caux E. 2002. A&A 388:L44–L47
Potapov A, Jager C, Henning T, Jonusas M, Krim L. 2017. ApJ 846:131
Poteet CA, Pontoppidan KM, Megeath ST, Watson DM, Isokoski K, et al. 2013. ApJ 766:117
Prodanovic T, Steigman G, Fields BD. 2010. MNRAS 406:1108–1115
Pulliam RL, McGuire BA, Remijan AJ. 2012. ApJ 751:1
Qasim D, Fedoseev G, Chuang KJ, Taquet V, Lamberts T, et al. 2019. A&A 627:A1
Qin SL, Schilke P, Wu J, Wu Y, Liu T, et al. 2015. ApJ 803:39
Qin SL, Wu Y, Huang M, Zhao G, Li D, et al. 2010. ApJ 711:399–416
Quenard D, Jimenez-Serra I, Viti S, Holdship J, Coutens A. 2018. MNRAS 474:2796–2812
Rab C, Elbakyan V, Vorobyov E, Gudel M, Dionatos O, et al. 2017. A&A 604:A15
Remijan A, Shiao YS, Friedel DN, Meier DS, Snyder LE. 2004. ApJ 617:384–398
Remijan AJ, Hollis JM, Lovas FJ, Stork WD, Jewell PR, Meier DS. 2008. ApJ 675:L85
Requena-Torres MA, Martın-Pintado J, Rodrıguez-Franco A, Martın S, Rodrıguez-Fernandez NJ,
de Vicente P. 2006. A&A 455:971–985
Rivilla VM, Beltran MT, Cesaroni R, Fontani F, Codella C, Zhang Q. 2017. A&A 598:A59
Robert F, Gautier D, Dubrulle B. 2000. Space Science Reviews 92:201–224
Safron EJ, Fischer WJ, Megeath ST, Furlan E, Stutz AM, et al. 2015. ApJ 800:L5
Sakai N, Oya Y, Lopez-Sepulcre A, Watanabe Y, Sakai T, et al. 2016. ApJ 820:L34
Sakai N, Sakai T, Hirota T, Burton M, Yamamoto S. 2009. ApJ 697:769–786
Sakai N, Sakai T, Hirota T, Watanabe Y, Ceccarelli C, et al. 2014. Nature 507:78–80
Sanchez-Monge A, Schilke P, Ginsburg A, Cesaroni R, Schmiedeke A. 2018. A&A 609:A101
Sanchez-Monge A, Schilke P, Schmiedeke A, Ginsburg A, Cesaroni R, et al. 2017. A&A 604:A6
Schworer A, Sanchez-Monge A, Schilke P, Moller T, Ginsburg A, et al. 2019. A&A 628:A6
Sewi lo M, Indebetouw R, Charnley SB, Zahorecz S, Oliveira JM, et al. 2018. ApJ 853:L19
Shimonishi T, Onaka T, Kawamura A, Aikawa Y. 2016. ApJ 827:72
Shimonishi T, Watanabe Y, Nishimura Y, Aikawa Y, Yamamoto S, et al. 2018. ApJ 862:102
www.annualreviews.org • Astrochemistry during the formation of stars 53

Shingledecker CN, Tennis J, Le Gal R, Herbst E. 2018. ApJ 861:20
Sipila O, Caselli P, Harju J. 2015. A&A 578:A55
Skouteris D, Balucani N, Ceccarelli C, Vazart F, Puzzarini C, et al. 2018. ApJ 854:135
Skouteris D, Vazart F, Ceccarelli C, Balucani N, Puzzarini C, Barone V. 2017. MNRAS 468:L1–L5
Soma T, Sakai N, Watanabe Y, Yamamoto S. 2015. ApJ 802:74
Song L, Kastner J. 2016. Physical Chemistry Chemical Physics (Incorporating Faraday Transac-
tions) 18:29278–29285
Sugimura M, Yamaguchi T, Sakai T, Umemoto T, Sakai N, et al. 2011. PASJ 63:459–472
Suzuki T, Ohishi M, Saito M, Hirota T, Majumdar L, Wakelam V. 2018. ApJS 237:3
Taniguchi K, Saito M, Majumdar L, Shimoikura T, Dobashi K, et al. 2018. ApJ 866:150
Taquet V, Bianchi E, Codella C, Persson MV, Ceccarelli C, et al. 2019. A&A 632:A19
Taquet V, Charnley SB, Sipila O. 2014. ApJ 791:1
Taquet V, Lopez-Sepulcre A, Ceccarelli C, Neri R, Kahane C, Charnley SB. 2015. ApJ 804:81
Taquet V, Lopez-Sepulcre A, Ceccarelli C, Neri R, Kahane C, et al. 2013. ApJ 768:L29
Taquet V, Wirstrom ES, Charnley SB. 2016. ApJ 821:46
Taquet V, Wirstrom ES, Charnley SB, Faure A, Lopez-Sepulcre A, Persson CM. 2017. A&A 607:A20
Taylor KNR, Storey JWV, Sandell G, Williams PM, Zealey WJ. 1984. Nature 311:236–237
Tercero B, Cernicharo J, Lopez A, Brouillet N, Kolesnikova L, et al. 2015. A&A 582:L1
Tercero B, Cuadrado S, Lopez A, Brouillet N, Despois D, Cernicharo J. 2018. A&A 620:L6
Thiel V, Belloche A, Menten KM, Garrod RT, Muller HSP. 2017. A&A 605:L6
Thiel V, Belloche A, Menten KM, Giannetti A, Wiesemeyer H, et al. 2019. A&A 623:A68
Tideswell DM, Fuller GA, Millar TJ, Markwick AJ. 2010. A&A 510:A85
Tielens AGGM. 1983. A&A 119:177–184
Tielens AGGM. 2013. Reviews of Modern Physics 85:1021–1081
Tielens AGGM, Hagen W. 1982. A&A 114:245–260
Tobin JJ, Hartmann L, Chiang HF, Wilner DJ, Looney LW, et al. 2012. Nature 492:83–85
Tychoniec L, Tobin JJ, Karska A, Chand ler C, Dunham MM, et al. 2018. ApJS 238:19
van Dishoeck EF, Bergin EA, Lis DC, Lunine JI. 2014. Protostars and Planets VI :835–858
van Dishoeck EF, Blake GA. 1998. ARA&A 36:317–368
van Dishoeck EF, Blake GA, Jansen DJ, Groesbeck TD. 1995. ApJ 447:760
van ’t Hoff MLR, Persson MV, Harsono D, Taquet V, Jørgensen JK, et al. 2018a. A&A 613:A29
van ’t Hoff MLR, Tobin JJ, Harsono D, van Dishoeck EF. 2018b. A&A 615:A83
van ’t Hoff MLR, Tobin JJ, Trapman L, Harsono D, Sheehan PD, et al. 2018c. ApJ 864:L23
van’t Hoff MLR, van Dishoeck EF, Jørgensen JK, Calcutt H. 2020. A&A 633:A7
Vastel C, Ceccarelli C, Lefloch B, Bachiller R. 2014. ApJ 795:L2
Vasyunin AI, Herbst E. 2013a. ApJ 762:86
Vasyunin AI, Herbst E. 2013b. ApJ 769:34
Vasyunina T, Vasyunin AI, Herbst E, Linz H, Voronkov M, et al. 2014. ApJ 780:85
Visser R, Bergin EA. 2012. ApJ 754:L18
Visser R, Bergin EA, Jørgensen JK. 2015. A&A 577:A102
Visser R, Jørgensen JK, Kristensen LE, van Dishoeck EF, Bergin EA. 2013. ApJ 769:19
Visser R, van Dishoeck EF, Black JH. 2009. A&A 503:323–343
Viti S, Collings MP, Dever JW, McCoustra MRS, Williams DA. 2004. MNRAS 354:1141–1145
Viti S, Williams DA. 1999. MNRAS 305:755–762
Vuitton V, Yelle RV, Lavvas P, Klippenstein SJ. 2012. ApJ 744:11
Watson DM, Bohac CJ, Hull C, Forrest WJ, Furlan E, et al. 2007. Nature 448:1026–1028
Wehres N, Hermanns M, Wilkins OH, Borisov K, Lewen F, et al. 2018b. A&A 615:A140
Wehres N, Maßen J, Borisov K, Schmidt B, Lewen F, et al. 2018a. Physical Chemistry Chemical
Physics (Incorporating Faraday Transactions) 20:5530–5544
Widicus Weaver SL. 2019. ARA&A 57:79–112
Willis ER, Garrod RT, Belloche A, Muller HSP, Barger CJ, et al. 2019. A&A
54 Jørgensen et al.

Wyrowski F, Schilke P, Walmsley CM, Menten KM. 1999. ApJ 514:L43–L46
Xu Y, Li JJ, Hachisuka K, Pandian JD, Menten KM, Henkel C. 2008. A&A 485:729–734
Yamaguchi T, Takano S, Sakai N, Sakai T, Liu SY, et al. 2011. PASJ 63:L37–L41
Yamaguchi T, Takano S, Watanabe Y, Sakai N, Sakai T, et al. 2012. PASJ 64:105
Yen HW, Koch PM, Takakuwa S, Ho PTP, Ohashi N, Tang YW. 2015a. ApJ 799:193
Yen HW, Koch PM, Takakuwa S, Krasnopolsky R, Ohashi N, Aso Y. 2017. ApJ 834:178
Yen HW, Takakuwa S, Koch PM, Aso Y, Koyamatsu S, et al. 2015b. ApJ 812:129
Zakharenko O, Lewen F, Ilyushin VV, Drozdovskaya MN, Jørgensen JK, et al. 2019. A&A 621:A114
Zaleski DP, Seifert NA, Steber AL, Muckle MT, Loomis RA, et al. 2013. ApJ 765:L10
Zapata LA, Schmid-Burgk J, Ho PTP, Rodrıguez LF, Menten KM. 2009. ApJ 704:L45–L48
Zapata LA, Schmid-Burgk J, Menten KM. 2011. A&A 529:A24
Zeng S, Quenard D, Jimenez-Serra I, Martın-Pintado J, Rivilla VM, et al. 2019. MNRAS 484:L43–
L48
Zernickel A, Schilke P, Schmiedeke A, Lis DC, Brogan CL, et al. 2012. A&A 546:A87
www.annualreviews.org • Astrochemistry during the formation of stars 55
![Astrophysics & Astrochemistry Cavity Ring Down Spectroscopy talks... · 2006-11-01 · Astrophysics & Astrochemistry Cavity Ring Down Spectroscopy Harold Linnartz [linnartz@strw.leidenuniv.nl]](https://img.dokumen.tips/doc/110x75/5f3787bfc85dfc7806100012/astrophysics-astrochemistry-cavity-ring-down-talks-2006-11-01-astrophysics.jpg)