Embed Size (px)
Citation preview

Second International Symposium on Marine Propulsors smp’11, Hamburg, Germany, June 2011
Propeller Loads of Large Commercial Vessels at Crash Stop
J.W. Hur, H. Lee, B.J. Chang1
1Hyundai Heavy Industries, Co., Ltd., Ulsan, Korea
ABSTRACT
Propeller failure would occur at crash stop due to obscure
reasons and become a dispute between propeller makers
and ship owners. Hence, the study on the hydrodynamic
propeller loads at crash stop is conducted in order to
evaluate the structural safety of the propeller.
For the large commercial vessels, the torques of propeller
shaft are measured at crash stop in the sea trial and
compared with results of the Wageningen B-series charts
and the commercial CFD code. The compared results
show that the hydrodynamic loads are fluctuated at initial
reverse rotation of the propeller but that the stresses on
the blade at initial reverse rotation are lower than at
maximum reverse rotation.
Based on these comparison results, the CFD methodology
with the quasi-steady assumption is suggested to evaluate
the structural safety of the propeller blade in initial design
stage.
Keywords
Propeller, Crash stop, CFD
1 INTRODUCTION
The crash stop astern is used to avoid navigating
emergencies, such as collision and ground. During the
astern condition, the propeller rotates reversely while ship
still moves forward. In addition, hydrodynamic loads on
propeller are changed dramatically due to the rapid
change of propeller rotating direction. Hence, at crash
stop astern, structural safety against the propeller failure
could be significant.
During the crash stop astern, the direction of the inflow
on the propeller blade is varied with change of the
propeller RPM and the ship speed, as shown in Figure 1.
From normal operation condition (A) to final astern
condition (E) before ship stopping, the inflow direction is
changed and the roles of leading edge and trailing edge
are reversed. Furthermore, since the induced flow by the
propeller is in opposite direction of the inflow, the large
vortex ring is generated due to the strong interaction
between both flows.
Figure 1: Inflow on blade section
To accurately predict hydrodynamic loads at crash stop
condition, an expensive computation cost is required.
Jang et al (2010) studied crash back of marine propulsors
using Large Eddy Simulation (LES). Chang et al (2008)
performed LES and structural analysis.
Black et al (2009) measured flow field during a crash
back using particle image velocimetry. The propeller
operated in the crash back range is tested, and in addition,
structural analysis results are conducted. The maximum
value at crash back is about 2 times higher than the mean
root strain.
In general, the structural safety should be evaluated in the
design stage, and therefore cheaper methodologies to
analyze hydrodynamic loads are more applicable. Hence,
in this study, although Reynolds-Averaged Navier Stokes
equation (RANS) is not suitable to predict high fluctuated
hydrodynamic loads especially in the large vortical flow,
the procedures to evaluate the structural safety of the
propeller blade at the crash stop, based on RANS, are
suggested after studying the data measured in ship trials
and comparing with results of Wageningen B-Series
chart.
To understand the characteristics of the hydrodynamic
loads at crash stop astern and to determine the calculation
conditions for the CFD application, from data measured
in sea trial, Fast Fourier Transform (FFT) and wavelet
analysis are performed.
Normal Operation (A)
Free Wheeling (B) ~ (C)Astern (C) ~ (D)
Astern (E)
* Solid Line : Flow Direction
Dash Line : Force Dircetion

2 SUBJECT SHIP AND CRASH STOP SITUATION
First of all, 20,000 m3 LPG Carrier is selected as the
subject ship to understand the hydrodynamic
characteristics at the crash stop. The main particulars of
the subject ship are shown in Table 1.
Ballast draft condition
Length between
perpendiculars [m] 147.00
Breadth [m] 25.50
Draft (Fwd.) [m] 5.21
Draft (Aft.) [m] 6.74
Number 1
Diameter [m] 5.7
Number of blades 4
Mean Pitch Ratio 0.7545
Tip Skew 20.83
Total Skew 24.50
Direction of rotation RIGHT-HAND
Section type NACA
Table 1: Main particulars of subject ship
The revolution of propeller is obtained by tachometer and
the shaft torque is measured by a torque gauge with
sampling rate 2.56 kHz. In parallel, ship speed is
measured by speed log.
Figure 2 shows the fluctuation of the stress measured
through torque gauge data on propeller shaft, according to
the change of the revolution. Figure 3 shows change of
the propeller revolution and ship speed synchronously.
Figure 2: Measured stress data on propeller shaft
As shown in these figures, the ship is in transition state 1)
as soon as the engine stops. Then, the free wheel state 2)
continues for a while to avoid excessive loads on the shaft
and engine. When engine RPM reaches below a critical
level generally defined by the engine maker, the propeller
starts reverse rotation and the revolution would be
fluctuated in transition state 3). Then relatively constant
revolution continues in full astern 4). In general, the
durations of each state depend on engine power and ship
size.
Figure 3: Measured astern RPM and ship speed
3 FREQUENCY ANALYSIS OF SEA TRIAL
RESULTS
The characteristics of highly fluctuated stress measuring
the torque shown in Figure 2 are studied using signal
analysis techniques. First, FFT analysis is conducted on
the data. As shown in Figure 4, the amplitude around 4
Hz is significant. To verify the change of above
characteristics according to change of the state, the Morlet
wavelet transformation is applied. As shown in Figure 5,
the component around 4Hz is dominant around t = 50 and
320 sec., regardless of direction of propeller revolution,
and this component is concluded to be independent on
hydrodynamic loads. And the propeller revolution of each
time is about 60 RPM and -60 RPM respectively. Thus,
the vibration about 4Hz component is induced by
structural vibration.
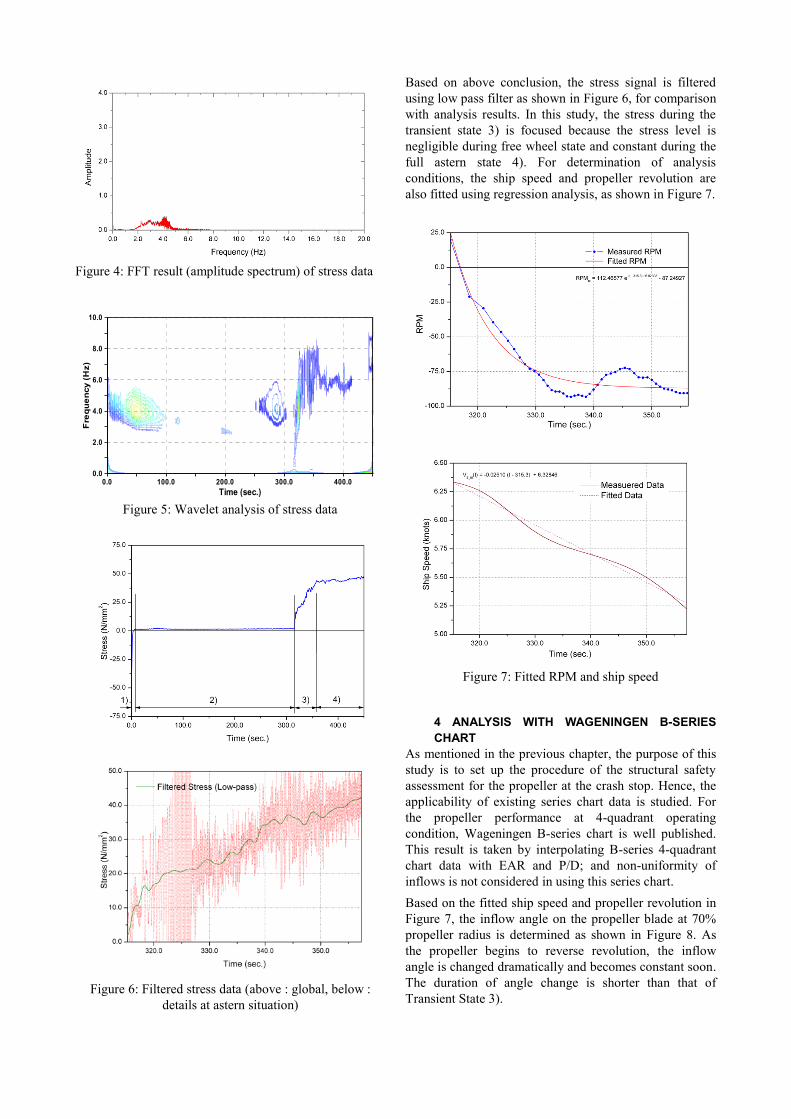
Figure 4: FFT result (amplitude spectrum) of stress data
Figure 5: Wavelet analysis of stress data
Figure 6: Filtered stress data (above : global, below :
details at astern situation)
Based on above conclusion, the stress signal is filtered
using low pass filter as shown in Figure 6, for comparison
with analysis results. In this study, the stress during the
transient state 3) is focused because the stress level is
negligible during free wheel state and constant during the
full astern state 4). For determination of analysis
conditions, the ship speed and propeller revolution are
also fitted using regression analysis, as shown in Figure 7.
Figure 7: Fitted RPM and ship speed
4 ANALYSIS WITH WAGENINGEN B-SERIES
CHART
As mentioned in the previous chapter, the purpose of this
study is to set up the procedure of the structural safety
assessment for the propeller at the crash stop. Hence, the
applicability of existing series chart data is studied. For
the propeller performance at 4-quadrant operating
condition, Wageningen B-series chart is well published.
This result is taken by interpolating B-series 4-quadrant
chart data with EAR and P/D; and non-uniformity of
inflows is not considered in using this series chart.
Based on the fitted ship speed and propeller revolution in
Figure 7, the inflow angle on the propeller blade at 70%
propeller radius is determined as shown in Figure 8. As
the propeller begins to reverse revolution, the inflow
angle is changed dramatically and becomes constant soon.
The duration of angle change is shorter than that of
Transient State 3).
Time (sec.)
Fre
qu
en
cy
(Hz)
0.0 100.0 200.0 300.0 400.00.0
2.0
4.0
6.0
8.0
10.0
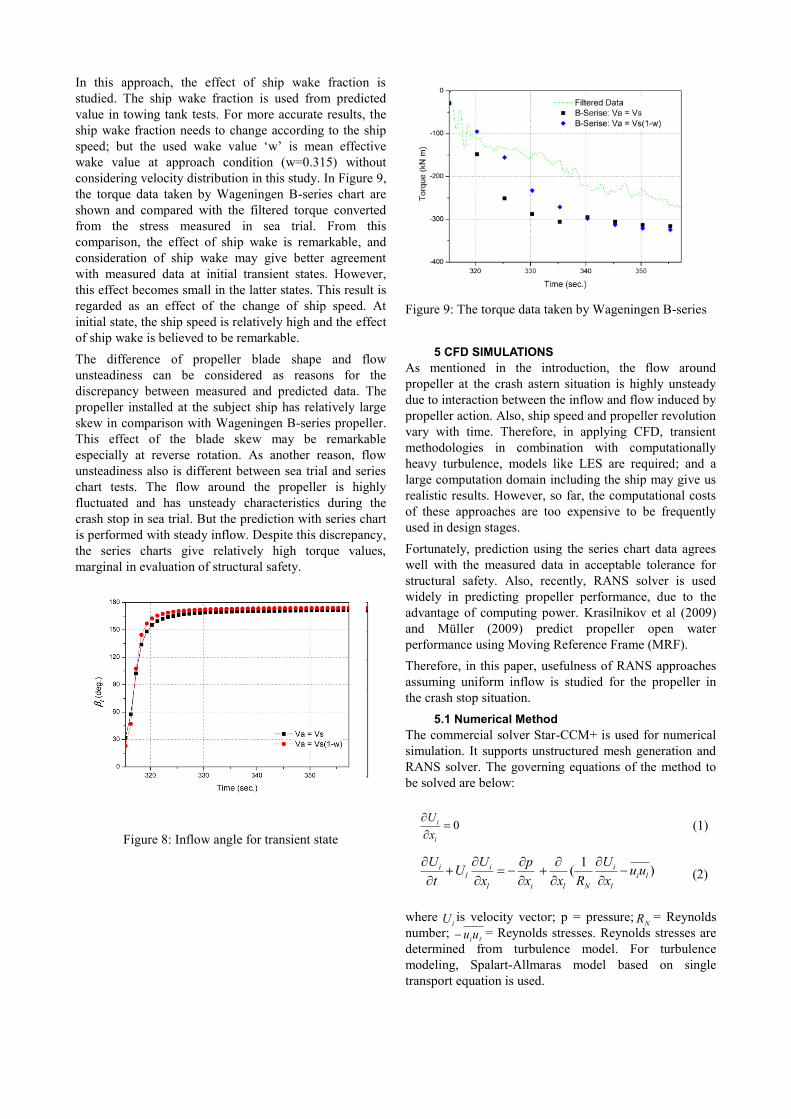
In this approach, the effect of ship wake fraction is
studied. The ship wake fraction is used from predicted
value in towing tank tests. For more accurate results, the
ship wake fraction needs to change according to the ship
speed; but the used wake value ‘w’ is mean effective
wake value at approach condition (w=0.315) without
considering velocity distribution in this study. In Figure 9,
the torque data taken by Wageningen B-series chart are
shown and compared with the filtered torque converted
from the stress measured in sea trial. From this
comparison, the effect of ship wake is remarkable, and
consideration of ship wake may give better agreement
with measured data at initial transient states. However,
this effect becomes small in the latter states. This result is
regarded as an effect of the change of ship speed. At
initial state, the ship speed is relatively high and the effect
of ship wake is believed to be remarkable.
The difference of propeller blade shape and flow
unsteadiness can be considered as reasons for the
discrepancy between measured and predicted data. The
propeller installed at the subject ship has relatively large
skew in comparison with Wageningen B-series propeller.
This effect of the blade skew may be remarkable
especially at reverse rotation. As another reason, flow
unsteadiness also is different between sea trial and series
chart tests. The flow around the propeller is highly
fluctuated and has unsteady characteristics during the
crash stop in sea trial. But the prediction with series chart
is performed with steady inflow. Despite this discrepancy,
the series charts give relatively high torque values,
marginal in evaluation of structural safety.
Figure 8: Inflow angle for transient state
Figure 9: The torque data taken by Wageningen B-series
5 CFD SIMULATIONS
As mentioned in the introduction, the flow around
propeller at the crash astern situation is highly unsteady
due to interaction between the inflow and flow induced by
propeller action. Also, ship speed and propeller revolution
vary with time. Therefore, in applying CFD, transient
methodologies in combination with computationally
heavy turbulence, models like LES are required; and a
large computation domain including the ship may give us
realistic results. However, so far, the computational costs
of these approaches are too expensive to be frequently
used in design stages.
Fortunately, prediction using the series chart data agrees
well with the measured data in acceptable tolerance for
structural safety. Also, recently, RANS solver is used
widely in predicting propeller performance, due to the
advantage of computing power. Krasilnikov et al (2009)
and Müller (2009) predict propeller open water
performance using Moving Reference Frame (MRF).
Therefore, in this paper, usefulness of RANS approaches
assuming uniform inflow is studied for the propeller in
the crash stop situation.
5.1 Numerical Method
The commercial solver Star-CCM+ is used for numerical
simulation. It supports unstructured mesh generation and
RANS solver. The governing equations of the method to
be solved are below:
(1)
(2)
where iU is velocity vector; p = pressure;
NR = Reynolds
number; uui = Reynolds stresses. Reynolds stresses are
determined from turbulence model. For turbulence
modeling, Spalart-Allmaras model based on single
transport equation is used.
0i
i
U
x
1( )i i i
l i l
l i l N l
U U UpU u u
t x x x R x

5.2 Grid and Boundary Conditions
Computational domain and boundary conditions are
shown in Figure 10. The computational domain has (360
degrees)/(number of blade) section, due to the periodicity
in the circumferential direction. It is consisted of the
propeller and shaft. Assuming that operation condition is
the uniform inflow, numerical simulation is conducted in
MRF model. The computational domain was defined of
propeller diameter D. The computational domain regions
are: the length of inlet and outlet region 7.5D, radius of
domain 5D.
Figure 10: Computational domain and boundary
conditions
Velocity inlet boundary condition is specified in front of
propeller. At radial and lateral direction, pressure outlet
boundary condition is specified. Periodic boundary
condition is specified at circumferential direction.
Computational grid for simulation is meshed by
polyhedral. For more accurate solutions, prism mesh is
adopted to grid at surface of propeller. Surface mesh
pattern is shown in Figure 11. The size of domain and
mesh fineness is determined after checking the effect on
the simulated results. Table 2 shows information of grid.
Table 2 Information of computation grid
5.3 Results
The analysis of propeller open water test is performed for
subject propeller. The difference between calculated KT,
KQ and model test results is slightly in the overall rage of
the advance ratio as shown at Figure 12.
Figure 12 Propeller Open Test
The crash stop astern simulation is conducted in 2 ways.
One is steady analysis, another is unsteady (transient)
analysis. Through filtering the sea trial results, the
operating conditions are determined for the propeller
RPM and ship speed, which is specified to be a function
of time in transient analysis. For each analysis, the effect
of ship wake fraction is studied like series chart
application. The calculated torque is compared with the
measured torque in Figure 13 and the corresponding
thrust is shown in Figure 14.
After propeller started to reverse, torque of propeller has
peak point about 5-10 sec later. The torque of propeller is
gradually increased and is seem to reach at full astern.
The effect of ship wake fraction is remarkable even in the
latter state as well as the initial state. In initial state,
consideration of ship wake fraction relatively agrees well
with the measured data, but shows large discrepancy at
the latter state. It is due to the change of ship speed as
mentioned in previous chapter. Steady analysis does not
represent the detailed peak level of torque, but overall
trend of the steady analysis is similar to that of transient
analysis.
Figure 11: Computational grid for CFD calculation
Number of mesh at
Blade part 139,545
Number of mesh at
Domain part 118,118
Total Number of mesh 257,663
Min. grid spacing 0.001 D
J
Kt,
10K
q,
0 0.2 0.4 0.6 0.80
0.1
0.2
0.3
0.4
0.5
0.6
0.7
EXP
CFD

Figure 13: Torque data taken by CFD
Figure 14: Thrust data taken by CFD
(a) (b) (c) (d)
Figure 15: Stream line and axial velocity contour at 0.7
r/R (t=315.3 + 5 sec.: (a) steady, (b) transient, t=315.3
+40 sec.: (c) steady, (d) transient)
To verify the discrepancy between steady and transient
analysis, the flow patterns around blade are compared.
Figure 15 shows the stream line around the propeller
blade at 0.7r/R at initial reverse rotation and full astern of
the propeller. As mentioned in the introduction, the
difference of direction between inflow and induced flow
makes large vortex ring including propeller. The vortex
ring is simulated at each methodology but the size of
vortex, which is affect the torque of propeller, is different
according to analysis methodology.
(a) t = 315.3 + 0.0 sec
(b) t = 315.3 + 5.0 sec
(c) t = 315.3 + 10.0 sec
(d) t = 315.3 + 20.0 sec
(e) t = 315.3 + 40.0 sec
Figure 16: -Cp for steady condition (left: back side, right:
face side)

(a) t = 315.3 + 0.0 sec
(b) t = 315.3 + 5.0 sec
(c) t = 315.3 + 40.0 sec
Figure 17: -Cp for transient condition (left: back side,
right: face side)
As mentioned above, the stream line at 0.7r/R shows the
effect of magnitude of simulated vortex. The magnitude
of simulated vortex for steady analysis is larger than that
of transient analysis. These differences of vortex
magnitude affect the stream line around the propeller and
change the propeller angle of attack as shown in Figures
15 (a) and (b). By comparing the results of sea trial and
analysis, steady analysis seems to be under-predicted at
initial reverse rotation of the propeller. Figure 15 (c) and
(d) show the stream line around the propeller blade at
0.7r/R at full astern. The difference of the magnitude of
simulated vortex between steady and transient analysis is
smaller than initial reverse rotation because the vortex for
steady and transient analysis is fully developed at full
astern condition. Thus, the difference of the propeller
angle of attack between steady and transient analysis at
full astern condition is slight. As per these results, the
steady analysis is efficient and gives good agreement for
full astern, while the transient analysis is consumed large
computing time.
Pressure distributions on blade surface of steady and
transient analysis are shown in Figures 16 and 17. Figures
16 and 17 show that the role of leading edge and trailing
edge are exchanged. It can be seen the -Cp difference
between steady and transient analysis at 315.3 + 5.0 sec,
which is at initial reverse rotation of the propeller. On the
other hand, pressure distributions of steady and transient
analysis are similar at 315.3 + 40.0 sec, which is full
astern condition, as like stream line.
Structural analysis can be performed by using these
results. Since hydrodynamic loads on propeller blade at
full astern condition are higher than the loads at initial
reverse rotation, the numerical simulation at full astern
condition is significant in the point of view of structural
analysis. For these reasons, the steady analysis at full
astern is more appropriate to the evaluation of structural
analysis.
6 CONCLUSIONS
In this study, the prediction of loads on the propeller at
crash stop is performed in order to evaluate the structural
safety of the propeller. The prediction is conducted by
using Wageningen B-series chart and CFD. To determine
operation conditions for crash stop, the sea trial result is
analyzed by FFT and wavelet analysis. From these
results, the ship speed and propeller RPM are also
modeled by using regression analysis for operation
conditions.
The prediction which uses the Wageningen B-series chart
data corresponds with the measured data at an acceptable
level for structural safety, in spite of the difference of
propeller blade shape and flow steadiness. But structural
evaluation cannot be performed by the results of series
chart since this application cannot predict the distribution
of pressure on the propeller blade.
Hence, CFD is used for the prediction of the loads acting
on the propeller. The numerical simulation is performed
at the crash stop through RANS solver for steady and
transient analysis. It can be seen that the difference
between steady and transient simulation is large at initial
reverse rotation, but it is reduced at full astern condition.
In regard to this characteristic, the steady analysis cannot
simulate the detailed peak level of torque, but transient
analysis can. Since the stresses on the propeller blade at
the full astern condition are higher than at initial reverse
rotation, numerical simulation at full astern is significant
in structural analysis. The steady analysis at full astern is
more useful methodology than transient analysis, because
consumed computing time for steady analysis is shorter
than transient analysis.
The results of the simulation for both steady and transient
analyses at full astern are in good agreement with the sea
trial results. Through comparing sea trial results and CFD
results, it is suggested to evaluate the structural analysis
of the propeller at initial design stage with the steady
analysis at full astern condition.
REFERENCES
Black, S. & Swithenbank, S. (2009). ‘Analysis of
Crashback Forces Compared with Experimental
Results’. First International Symposium on Marine
Propulsors, Trondheim, Norway.

Chang, P. A., Ebert, M., Young, Y.L., Liu, Z., Mahesh,
K., Jang, H. & Shearer, M. (2008). ‘Propeller Forces
and Structural Response due to Crashback’. 27th
Symposium on Naval Hydrodynamic, Seoul, Korea.
Daubechies, I. (1988). ‘Orthonormal bases of compactly
supported wavelets’. Commun. on Pure and Appl.
Math. 41, pp. 909-996.
IMO. (2002). ‘Standard for Ship Manoeuvrability’. IMO
Resolution MSC 137(76).
Jang, H. & Mahesh, K. (2010). ‘Large Eddy Simulation
of Marine Propulsors in Crashback’. 28th Symposium
on Naval Hydrodynamic, Pasadena, California.
Krasilnikov, V., Sun, J. & Halse, K. H. (2009). ‘CFD
investigation in scale effect on propellers with
different magnitude of skew in turbulent flow’. First
international symposium on marine propulsors,
Trondheim, Norway.
Müller, S-B., Moustafa, A-M. & Hibert, G. (2009). ‘Scale
effects on propellers for large container vessels’. First
international symposium on marine propulsors,
Trondheim, Norway.
Newland, D. E. (1993). An introduction to random
vibrations, spectral & wavelet analysis. Addison
Wesley Longman Limited.