Embed Size (px)
Citation preview

Associations Between Psychosocial Factors
and Intrauterine Growth Retardation
Sharon Durousseau MD, MPH
California Department of Health Services
Maternal Child Health Branch

Intrauterine Growth Retardation
• Intrauterine growth retardation (IUGR)
– Babies born too small for gestational age
• Over 10,000 full-term infants with IUGR born in California annually
• Increased risk for death and disability
• Long-term effects

Incidence Rate of IUGR, CA 1992-1999
0
1
2
3
1992 1993 1994 1995 1996 1997 1998 1999
Year
per
100
live
bir
ths

Incidence of IUGR by Race/Ethnicity, CA 1999
2
4.1
1.7
2.8
1.3
0
1
2
3
4
5
White/Other AfricanAmerican
AmericanIndian/Alaskan
Native
Asian/PacificIslander
Hispanic
per
100
live
birt
hs

Psychosocial Factors and IUGR?
• Risk factors include
– Smoking
– Poor nutrition– Prior pregnancy history
• Stress and social factors might affect fetal growth

Study objectives
• Can we identify women at risk by the psychosocial profile?
• Can social support programs affect IUGR rates?

Maternal Infant Health Assessment
• Annual population-based survey • Includes mothers with singleton live
births • Surveys maternal behaviors and
conditions before, during, and after pregnancy

All live births in California Feb. to May 1999
165,898
Sampling Design

All live births in California Feb. to May 1999
165,898
Sampling Design
Excluded:-Mothers aged <15 yrs-Infants adopted-Mothers deceased-Incomplete contact information

All live births in California Feb. to May 1999
Eligible Population
165,898
156,514
Sampling Design
Excluded:-Mothers aged <15 yrs-Infants adopted-Mothers deceased-Incomplete contact information

All live births in California Feb. to May 1999
Stratified by race/ethnicity,region and education
Eligible Population
165,898
156,514
4,967
Sampling Design
Excluded:-Mothers aged <15 yrs-Infants adopted-Mothers deceased-Incomplete contact information
Random sample strata

All live births in California Feb. to May 1999
Stratified by race/ethnicity,region and education
70.1% response
Eligible Population
165,898
156,514
4,967
3,483
Sampling Design
Excluded:-Mothers aged <15 yrs-Infants adopted-Mothers deceased-Incomplete contact information
Random sample strata

IUGR Case Definition
• A case defined as a mother of a term infant ( >37 weeks gestational age) weighing < 2500 grams at birth
• All other term infants were non-cases

Cases and Non-cases
3,127 mothers ofterm infants
3,483

Cases and Non-cases716 preterm excluded
3,127 mothers ofterm infants
3,483

73 cases 3,054 non-cases
Cases and Non-cases716 preterm excluded
3,127 mothers ofterm infants
3,483
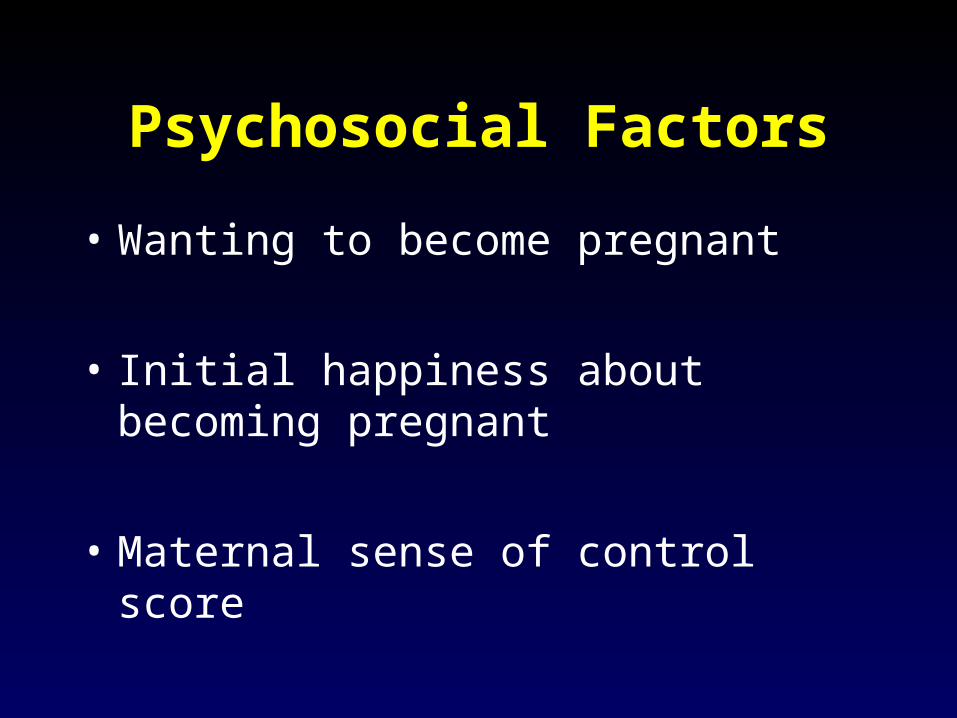
Psychosocial Factors
• Wanting to become pregnant
• Initial happiness about becoming pregnant
• Maternal sense of control score

Statistical Methods• Univariate Analysis with SPSS/SUDAAN
• Logistic regression controlling for
Race/ethnicity Maternal age
Prior low birthweight Smoking status
Education Marital status
Poverty• Data weighted to reflect state population• Tested for interaction

IUGR Risk Factors
Crude OR 95% CI
< 19 years old 2.4 (1.3, 4.5)> 19 years (ref)
African-American 3.1 (1.6 , 6.2)Native American 3.7 (0.5, 29.2)Asian/Pacific Islander 2.9 (1.3, 6.3)Hispanic 1.4 (0.7, 2.6)White/Other (ref)

IUGR Risk Factors
Crude OR 95% CI
< 12 Years education 1.7 (1.01, 2.9)
Unmarried 1.7 (1.05, 2.9)
Medicaid 1.8 (1.04, 2.9)
Income < federal poverty level 2.4 (1.4, 4.1)

IUGR Risk Factors
Crude OR 95% CI
Prior Low Birth Weight Infant 12.7 (5.6,28.8)Underweight prior to pregnancy 2.4 (1.3, 4.2)
Smoked during pregnancy 1.7 (0.9, 3.3)
Alcohol use during pregnancy 0.8 (0.4, 1.6)
No first trimester Prenatal Care 0.9 (0.4, 1.9)

Univariate Analysis: Wanting to Become Pregnant
1.9
0
0.5
1
1.5
2
2.5
3
3.5
4
Wanted now or later (ref) Did not want/unsure
Cru
de
Od
ds
Rat
io

Univariate Analysis: Happiness About Becoming Pregnant
11.3
1.6
3.2
0123456789
Very happy(ref)
Somewhathappy
Somewhatunhappy
Very Unhappy
Cru
de O
dds
Rat
io

Univariate Analysis: Maternal Sense of Control Scores
1.91.1
0
1
2
3
4
5
6
7
8
High (ref) Medium Low
Cru
de O
dds
Rat
io

Multivariate Analysis
OR 95% CI
Did not want/Unsure 2.2 (0.8, 6.7)
Very unhappy 1.5 (0.2, 9.5)
Low control score 1.3 (0.2, 9.2)

Strengths and Weaknesses
• Strengths– Population based sample– Diverse population
• Weaknesses– Retrospective, possible recall bias– Limited detail– Possible low power

Conclusions
• Psychosocial factors associated with IUGR include– Not wanting/being unsure about becoming
pregnant – Being unhappy about becoming pregnant
• After adjusting for other variables, these factors are not statistically significant.

Implications
• Assessing maternal feelings toward pregnancy not sufficient to identify women at risk for having infant with IUGR
• Consider other risk factors
• More focused or prospective study might be needed to explore relationship further

Acknowledgements
• Gilberto Chavez
• Don Taylor
• Kristen Marchi
• Paula Braveman
• Rhonda Sarnoff
• Andrea Winquist

Pregnancy Wantedness
• “ Thinking back to just before you got pregnant, how did you feel about getting pregnant? ”
• I wanted to get pregnant then.• I wanted to get pregnant later.• I did not want to get pregnant then or
in the future.• I wasn’t sure what I wanted.

Initial Happiness About Becoming Pregnant
• How did you feel when you found out you really were pregnant ?– Very happy– Somewhat happy– Somewhat unhappy– Very unhappy

Maternal Sense of Control
• Aggregate score from series of seven questions
• “ How much do you agree with each of the following statements ? ” – Sample questions:
• “ I have little control over the things that happen to me.”
• “ What happens to me in the future mostly depends on me.”

Power Calculations
• Sample sizes needs to detect 50% difference for each variable ( = 0.05 and = .20)– wantedness 1,088– happiness 4,702– control score 7,738
• Power calculation done in EPI 6.0.


![Early intrauterine development of mixed giant … · Early intrauterine development of mixed giant ... but with intrauterine death at 29 weeks [5]. Fetal . Early intrauterine development](https://img.dokumen.tips/doc/110x75/5b63022f7f8b9ade588b8aac/early-intrauterine-development-of-mixed-giant-early-intrauterine-development.jpg)