Embed Size (px)
Citation preview

Association Rule Mining in Type-2 Diabetes Risk Prediction
Gyorgy J. SimonDept. of Health Sciences Research
Mayo Clinic
SHARPn Summit 2012

Outline
• Introduction• Modeling Diabetes Risk– Association Rule Mining
• Results– Diabetes Disease Network Reconstruction– Diabetes Risk Prediction
• Applicability to SHARP

Diabetes• In the US, 25.8 million people (8% of the population) suffer from Diabetes
Mellitus– Type 2 Diabetes Mellitus (DM)
• DM leads to significant medical complications• Effective preventive treatments exist
– Identifying subpopulations at risk is important• Pre-Diabetes (PreDM) is a condition that precedes DM
– fasting glucose 100-125• Identify sets of risk factors that significantly increase the risk of
developing diabetes in a pre-diabetic population– Risk factors:
• Co-morbid diseases: obesity, cardiac-, vascular conditions• Vitals, lab test results, medications, co-morbid conditions
• 85k Mayo Patients 1999-2004 with research consent

Design
1/1/1999 12/31/2004
Normal84,708
DM424
PreDM23,828
Normal44,156
DM19,013
Normal43,809
PreDM21,826
2,002
347
16,664
7/2010
Study Period Follow-Up

Data
• Follow-up Time (FUT): Time since PreDM Dx• Co-morbidities: before elevated glucose measurement
– hypertension, hyperlipidemia, obesity, various cardiac and vascular diseases
• Age and Follow-up time (FUT) are predictive of DM– They are not modifiable, we need to compensate for them
• Goal is different from high-throughput phenotyping– None of the patients have the disease– Predict the risk that patients progress to DM
PID Co-morbidities Glucose Age FUT DMOB HTN …
001 Y Y 110 55 1.8 Y
002 115 19 2.5 N
… … …

Outline
• Introduction• Modeling Diabetes Risk– Association Rule Mining
• Results– Diabetes Disease Network Reconstruction– Diabetes Risk Prediction
• Applicability to SHARP

Computational ModelAge Sex
UnknownDisease
Mechanism
bmi TobaccohdlHTN
glucose
DM Dx
statin… … …
… …
Level 1Unmodifiable“nuisance”factors
Level 2Clinicalfactors of interest
Level 3Glucose“definition”of DM
We have to adjust for level 1 factorsbefore we can assess the effect oflevel 2 factors !
GoalFind sets of clinical factors (level 2) that are associated with elevated risk of DM

Modeling Approaches1. Logistic regression / Survival Analysis
– No ability to discover interactions
2. Decision Trees/RandomForest/Gradient-boosted Trees– Greedy approach to discover interaction– No ability to compensate for age and follow-up time (FUT)
3. Association Rule Mining (ARM)– Specifically designed to discover interactions– No ability to compensate for age and FUT
Regression Analysis + Association Rule MiningRemove the effect of age gender and FUT
Find association between the risk factors and the DM risk not explained by age and FUT
Simon et al. AMIA 2011

PID DM Age FUT
001 Y 55 1.8
002 N 19 2.5
… …
R1 Co-morbidities
Obese HTN …
Y Y
E1 Expected Number of DM incidents based on age and sex only
O Observed Number of DM incidents
R1 = O – E1
1st Phase Residual
1st Phase 2nd Phase
R2 Glucose
103
112
…
E2 Expected Number of DM incidents based on co-morbidities only (after adjusting for age and sex)
3rd Phase
R2 = O–(E1+E2) = R1-E2
2nd Phase Residual
E3 Expected Number of DM incidents based on glucose (after adjusting for everything else)
E = E1 + E2 + E3
Final Prediction
Overview
Regression modeling•Survival model or•Logistic regression
Association Rule Mining

Association Rule Mining• Origins from sales data• Items (columns): co-morbid conditions• Transactions (rows): patients• Itemsets: sets of co-morbid conditions• Goal: find all itemsets (sets of conditions)
that frequently co-occur in patients.– One of those conditions should be DM.
• Support: # of transactions the itemset I appeared in– Support({OB, HTN, IHD})=3
• Frequent: an itemset I is frequent, if support(I)>minsup
Patient OB HTN IHD … DM
001 Y Y Y Y
002 Y Y Y Y
003 Y Y
004 Y
005 Y Y Y
X: infrequent

Distributional Association Rule MiningDistributional Association Rules associate an itemset with a continuous outcome.
PID A B C D … R
01 Y Y Y Y .40
02 Y Y Y .38
03 Y Y Y Y .39
04 Y Y Y .41
05 Y Y .00
06 Y Y .01
07 Y .02
08 Y .00
0 0.15 0.3 0.4502468
1012
0 0.15 0.3 0.450123456
Application to DiabetesFind all sets I of co-morbid conditions, such that the distribution of risk R is significantly different between the patient population having I and without I
Simon et al, KDD 2011aFr
eque
ncy
Freq
uenc
y
R
R

Why Association Rule Mining?Challenge Solution
Interactions Designed to discover associations
Missing data Asymmetry in items• Absence of item does not mean that
the risk factor was not present
Clinical question Directly extracts sets of risk factors
Allows for differences in modeling for prediction and for disease mechanism discovery
Computational Efficiency Efficient algorithms exist

Outline
• Introduction• Modeling Diabetes Risk– Association Rule Mining
• Results– Diabetes Disease Network Reconstruction– 4.5-yr DM Risk Prediction
• Applicability to SHARP

Diabetes Disease Network Reconstruction
• Metabolic Syndrome: DM + cardiac/vascular diseases• Use Association Rule Mining to map out the
relationships between DM and other metabolic syndrome diseases– Also measure their effect on DM progression risk
• Predictors: Age, sex, FUT; co-morbid disease Dx• 1st Phase model is survival model• 2nd Phase ARM

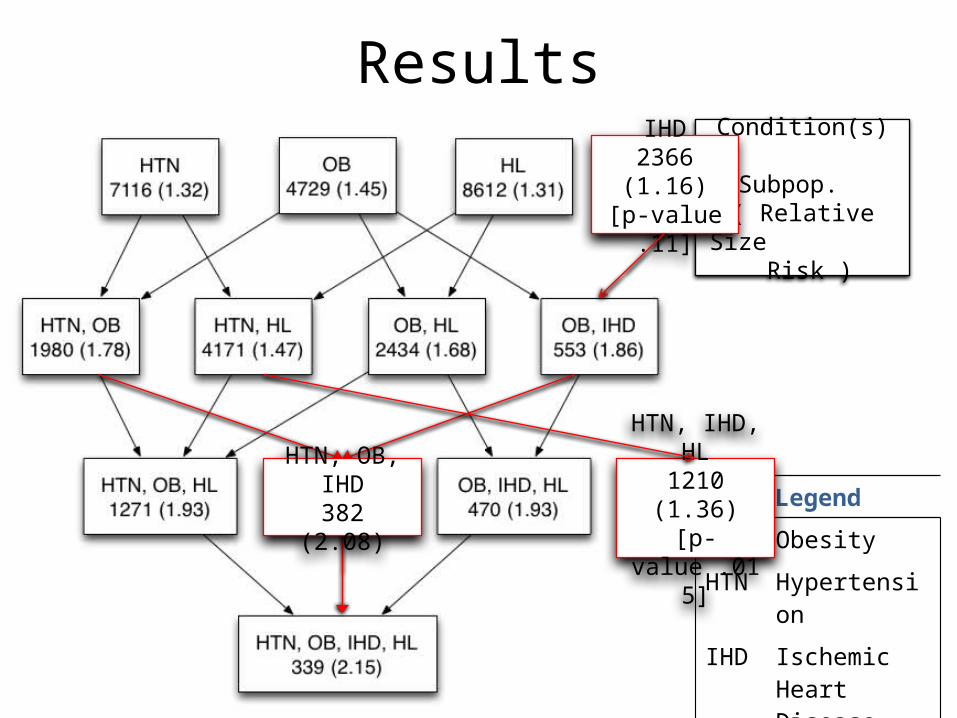
Results
Sup Cases P-value RR Itemset
7116 819 2.0e-7 1.32 HTN
4729 560 1.7e-8 1.45 OB
8612 964 2.6e-8 1.31 HL
1980 291 1.9e-9 1.78 HTN,OB
4171 534 1.5e-8 1.47 HTN,HL
553 85 8.3e-4 1.86 OB,IHD
2434 335 4.3e-9 1.68 OB,HL
382 66 7.7e-4 2.08 HTN,OB,IHD
1271 204 2.8e-8 1.93 HTN,OB,HL
470 76 7.2e-4 1.93 OB,IHD,HL
339 61 6.1e-4 2.15 HTN,OB,IHD,HL
• Interpretation: Patients with HTN,OB,IHD and HL have age and FUT adjusted 2.15 RR of DM.
• Effect of age- and FUT adjustment– The entire PreDM population has
8.04% chance of DM.– Without age and FUT
adjustment, the above population has 61/339=17.9%
– With age and FUT adjustment, 1-(1-.084)2.15=17.2%
Legend
OB Obesity
HTN Hypertension
IHD Ischemic Heart Disease
HL Hyperlipidemia
• 37 Distributional Association Rules were discovered
• 11 are significant. (Poisson test; Bonferroni adjusted 5%)
Results
Legend
OB Obesity
HTN Hypertension
IHD Ischemic Heart Disease
HL Hyperlipidemia
Condition(s)
Subpop. ( RelativeSize Risk )
IHD2366 (1.16)
[p-value .11]
HTN, OB, IHD382 (2.08)
HTN, IHD, HL1210 (1.36)
[p-value .015]

Outline
• Introduction• Modeling Diabetes Risk– Association Rule Mining
• Results– Diabetes disease network re-construction– 4.5-yr DM risk prediction
• Applicability to SHARP

DM Progression Risk Prediction
• Predicting the probability of progression to DM within 4.5 years
• Predictors: age, sex, co-morbid Dx, laboratory results and medication orders
• 1st Phase: spline logistic regression to adjust for age and sex
• 2nd Phase: ARM• 3rd Phase: linear regression using glucose

Machine Learned Indices• Comparison to machine
learning methods– Gradient Boosted Trees (GBM)
• 10,000 trees
– Linear Model (LM)– Random Forest (RF)
• 275-325 trees
– Association Rule Mining (ARM)• 100 rules
• 10-fold CV repeated 50 times• Same predictive performance
but more interpretable model
C-st
atisti
c

Traditional Indices
• Performance similar to San Antonio (Refit)• ARM readily provides a justification as to why the risk is
high• Proposed method places the patient on a path in the
diabetes network

Clinical Validation• Work in progress…
• Apply the rules to both normo-glycemic and Pre-DM patients
• Each point is a rule• Patterns similar for
lower-risk subpopulations
• For high-RR rules, risk of DM is higher for Pre-DM patients

Outline
• Introduction• Modeling Diabetes Risk– Association Rule Mining
• Results– Interpretability– Predictive Performance
• Applicability to SHARP

High-Throughput Phenotyping (HTP)
• We can use the Association Rules as a HTP algorithm– Discover the rules with ARM– Validate the rules with an expert clinician
High-throughput Phenotyping DM Risk Assessment
Does the patient currently have DM?
Will the patient progress to DM in 4.5 yrs? - Interventions are possible
Binary decision (DM or not) Probability of diabetes - Prob. can be dichotomized
into DM/no DM

AcknowledgmentPeter W. Li, PhDHealth Sciences Research, Mayo Clinic, MN
Pedro J. Caraballo, MDInternal Medicine, Mayo Clinic, MN
M. Regina Castro, MDDivision of Endocrinology and Metabolism, Mayo Clinic, MN
Terry M. Therneau, PhDHealth Sciences Research, Mayo Clinic, MN
Vipin Kumar, PhDDepartment of Computer Science, University of Minnesota

ReferencesVemuri P, Simon G, Kantarci K, Whitwell J, Senjem M, Przybelski S, Gunter J, Josephs K, Knopman D, Boeve B, Ferman T, Dickson D, Parisi J, Petersen R and Jack C. Antemortem differential diagnosis of dementia pathology using structural MRI: Differential-STAND. NeuroImage, 2010.
Caraballo P, Li P, Simon G. Use of Association Rule-mining to Assess Diabetes Risk in Patients with Impaired Fasting Glucose, AMIA, 2011.
Simon G, Kumar V, Li P. A Simple statistical model and association rule filtering. In Proc. ACM International Conference on Data Mining and Knowledge Discovery (KDD), 2011.
Simon G. Li P, Jack C, Vemuri P. Understanding Atrophy Trajectories in Alzheimer’s Disease Using Association Rules on MRI images. In Proc. ACM International Conference on Data Mining and Knowledge Discovery (KDD), 2011.