Embed Size (px)
Citation preview
Original Investigation | Genetics and Genomics
Association of Leukocyte Telomere Length With Mortality Among AdultParticipants in 3 Longitudinal StudiesKonstantin G. Arbeev, PhD; Simon Verhulst, PhD; Troels Steenstrup, PhD; Jeremy D. Kark, MD, MPH, PhD; Olivia Bagley, BS; Charles Kooperberg, PhD;Alexander P. Reiner, MD, MSc; Shih-Jen Hwang, PhD, MHS, MPH; Daniel Levy, MD; Annette L. Fitzpatrick, PhD; Kaare Christensen, MD, PhD, DMSc;Anatoliy I. Yashin, PhD, ScD; Abraham Aviv, MD
Abstract
IMPORTANCE Leukocyte telomere length (LTL) is a trait associated with risk of cardiovasculardisease and cancer, the 2 major disease categories that largely define longevity in the United States.However, it remains unclear whether LTL is associated with the human life span.
OBJECTIVE To examine whether LTL is associated with the life span of contemporary humans.
DESIGN, SETTING, AND PARTICIPANTS This cohort study included 3259 adults of Europeanancestry from the Cardiovascular Health Study (CHS), Framingham Heart Study (FHS), and Women’sHealth Initiative (WHI). Leukocyte telomere length was measured in 1992 and 1997 in the CHS, from1995 to 1998 in the FHS, and from 1993 to 1998 in the WHI. Data analysis was conducted fromFebruary 2017 to December 2019.
MAIN OUTCOMES AND MEASURES Death and LTL, measured by Southern blots of the terminalrestriction fragments, were the main outcomes. Cause of death was adjudicated by end pointcommittees.
RESULTS The analyzed sample included 3259 participants (2342 [71.9%] women), with a median(range) age of 69.0 (50.0-98.0) years at blood collection. The median (range) follow-up until deathwas 10.9 (0.2-23.0) years in CHS, 19.7 (3.4-23.0) years in FHS, and 16.6 (0.5-20.0) years in WHI.During follow-up, there were 1525 deaths (482 [31.6%] of cardiovascular disease; 373 [24.5%] ofcancer, and 670 [43.9%] of other or unknown causes). Short LTL, expressed in residual LTL, wasassociated with increased mortality risk. Overall, the hazard ratio for all-cause mortality for a1-kilobase decrease in LTL was 1.34 (95% CI, 1.21-1.47). This association was stronger for noncancercauses of death (cardiovascular death: hazard ratio, 1.28; 95% CI, 1.08-1.52; cancer: hazard ratio, 1.13;95% CI, 0.93-1.36; and other causes: hazard ratio, 1.53; 95% CI, 1.32-1.77).
CONCLUSIONS AND RELEVANCE The results of this study indicate that LTL is associated with anatural life span limit in contemporary humans.
JAMA Network Open. 2020;3(2):e200023. doi:10.1001/jamanetworkopen.2020.0023
Introduction
The debate on the natural life span limit in humans has focused on demographic trends1-5 rather thanon biological factors that set a ceiling for life span. We hypothesized that leukocyte telomere length(LTL) might be a biological driver of life span because LTL is associated with increased mortalityamong older individuals6-10 and converging evidence infers a causal role of LTL in aging-relateddiseases that often result in death.11-15
Key PointsQuestion Is leukocyte telomere length
associated with the natural life span of
contemporary humans?
Findings This cohort study included
3259 participants from 3 longitudinal
studies, of whom 1525 died during the
follow-up period. Leukocyte telomere
length–associated mortality from
noncancer causes increased as
participants aged, approaching their age
at death.
Meaning These data suggest that
leukocyte telomere length is associated
with a life span limit among
contemporary humans.
+ Supplemental content
Author affiliations and article information arelisted at the end of this article.
Open Access. This is an open access article distributed under the terms of the CC-BY License.
JAMA Network Open. 2020;3(2):e200023. doi:10.1001/jamanetworkopen.2020.0023 (Reprinted) February 26, 2020 1/12
Downloaded From: https://jamanetwork.com/ on 11/15/2021
The view that LTL plays a causal role in aging-related diseases draws on the following findings.First, LTL variation across individuals as well as some underlying determinants of LTL variation,including high heritability and sex, are similar in newborns and adults.16 Second, individuals whoenter adult life with short or long LTL are likely to have short or long LTL, respectively, throughouttheir remaining life course.17,18 Therefore, having comparatively short or long LTL is principallydetermined early in life, typically decades before disease onset and mortality. Third, genome-wideassociation studies have identified LTL-associated single-nucleotide polymorphisms mapped toseveral regions that harbor telomere maintenance genes.11,19,20 These single-nucleotidepolymorphisms have been used to develop genetic risk scores that show an inverse association ofLTL with cardiovascular disease (CVD)11-13,21 and direct associations with some cancers.12,14,15,21 Suchgenetic findings largely exclude reverse causality, ie, that CVD might shorten LTL or some cancersmight lengthen LTL. Jointly, these findings suggest that LTL is likely causal for CVD and some cancers,perhaps increasing the mortality risk that arises from these diseases. In addition, based on empiricaland theoretical considerations, our previous work showed that a subset of the general populationmay reach a critically short LTL, a so-called telomeric brink, at an age younger than life expectancy,which denotes a high risk of death in the near term.22 The questions are whether LTL is associatedwith the life span of some individuals and which diseases (ie, CVD, cancer, and other causes [OCs])might influence such an association. To this end, we leveraged LTL and mortality data from 3longitudinal studies in the United States.
Methods
SampleParticipants of European ancestry with LTL measurements from the Cardiovascular Health Study(CHS),23 the Framingham Heart Study (FHS),24 and the Women’s Health Initiative (WHI)25 wereincluded (eTable 1 in the Supplement). Self-reported race/ethnicity in CHS and WHI was used toselect the subsample of participants of European ancestry in these studies. Participants in FHS arealmost exclusively self-reported to be of European ancestry. In CHS, LTL was measured in years 5 and10 (ie, 1992 and 1997); in FHS, at exam 6 (ie, 1995-1998); and in WHI, at exam 1 (ie, 1993-1998). Novariables used in the analyses (ie, sex, age at LTL measurement, age at death or censoring, indicatorsof death events, or LTL) had missing values. Cause of death was adjudicated by end point committeesof the respective studies. The CHS used historical data on morbidities, hospitalizations, andmedications along with medical records (ie, most recent hospitalization) and proxy interviewers (ie,to ascertain circumstances). These data were sent to the Morbidity and Mortality Committees, whichwere made up of study physicians from each site, to adjudicate cause of death. The FHS collecteddetailed information on underlying causes of death (ie, from cardiovascular causes, cancer, othernoncardiovascular or noncancer causes, or unknown), performing a comprehensive review of allavailable medical records by a physician-review, panel-based adjudication process establisheddecades ago. In WHI, mortality events were identified using annual mailings and follow-up (ie, proxyquestionnaires, returned mailings) and National Death Index searches. Cause of death wasascertained from death certificates and National Death Index searches by a committee of physicianadjudicators.
This study was approved by institutional review board of Rutgers University, the StateUniversity of New Jersey. The study performed secondary analyses. No new data were collectedfrom study participants in the course of working on this article. In the original studies, DNA wascollected from participants who provided informed consent for genetic research. Study procedures,including obtaining informed consent from study participants, are described in respectivepublications.23-25 This report follows the Strengthening the Reporting of Observational Studies inEpidemiology (STROBE) reporting guideline for cohort studies. Data for this study were analyzed fromFebruary 2017 to December 2019.
JAMA Network Open | Genetics and Genomics Association of Leukocyte Telomere Length With Mortality Among Adults
JAMA Network Open. 2020;3(2):e200023. doi:10.1001/jamanetworkopen.2020.0023 (Reprinted) February 26, 2020 2/12
Downloaded From: https://jamanetwork.com/ on 11/15/2021
LTL MeasurementsMeasurements were performed at a baseline examination by Southern blot of the terminal restrictionfragments.26 The interassay coefficients of variation were 2.4%, 1.5%, and 2.0% for the FHS, CHS,and WHI, respectively. In the CHS, 963 individuals had LTL measurements from blood samplesobtained in year 5. Among those, 612 (63.6%) had a second measurement in year 10. In the analysesreported in this paper, we used the second LTL measurement for the latter group and the first (andonly) LTL measurement for the remaining 351 individuals in the analyzed CHS sample. We alsoperformed sensitivity analyses including only the 612 individuals with 2 LTL measurements. Theseshowed qualitatively similar results; therefore, they are not reported here.
Statistical AnalysisWe used t tests for comparisons between the LTL of women and men as well as between the LTL ofthose who died and those who were alive at the end of follow-up. For the former, we used the age-and study-adjusted LTL computed as follows: we regressed LTL on age and study (ie, as a categoricalvariable with 3 levels, 1 for each study) and added residuals from this regression to the mean LTLacross all individuals in the sample. For the latter, we added the residual LTL (rLTL) to the mean LTLacross all individuals in the sample. The rLTL was computed as the residuals from linear regressions ofLTL on age, fitted separately among women and men in each of the 3 studies. We also fitted theregressions with quadratic terms for age, but these were nonsignificant in all cases; therefore, weproceeded with the linear model. The same values (with added mean LTL in the entire sample) wereused in computations of LTL for individuals who died from cancer and noncancerous causes andthose alive at the end of follow-up. We also computed the Pearson correlation coefficient betweenage at blood draw and sex- and study-adjusted LTL (calculated as the residuals from the regression ofLTL on sex and the study variable, added to the mean LTL across all individuals in the sample).
We fitted Cox proportional hazards models using follow-up data on mortality in the combinedsample. Time since blood draw was used as the time variable. The most parsimonious model includedsex and rLTL as covariates. We used 2 flexible specifications to include age in the model: 1 with anatural spline basis for age and another with age included as a linear term, stratified by baseline age,thus allowing for different baseline hazards in each age strata. Both methods showed similar resultsfor the association of rLTL with mortality. In this article, we report results for the model with splines.The results for the second approach appear in eTable 3, eTable 5, eTable 10, eFigure 1, eFigure 2,eFigures 5 to 7, and eFigure 9 in the Supplement. For technical details and a description of sensitivityanalyses, see the eAppendix in the Supplement.
We analyzed data on cause-specific mortality in the competing risks context using the cause-specific hazards functions approach.27 We used the same model specifications as in the all-causemortality analyses and estimated respective regression parameters for different cause-specifichazards functions (ie, CVD, OC, and cancer). We report results for the model with splines in theResults section; the results for the second approach appear in eTable 3, eTable 5, eTables 11 to 13,eFigure 1, eFigure 2, eFigure 7, and eFigure 9 in the Supplement. For technical details and descriptionof sensitivity analyses, see the eAppendix in the Supplement.
Statistical analyses with the Cox proportional hazards models and the competing risks modelswere performed in R version 3.6.1 using the survival package (R Project for Statistical Computing).Figures were prepared in MATLAB R2019a (MathWorks) and in R version 3.6.1. Statistical significancewas set at P < .05, and all tests were 2-tailed.
Results
The initial sample consisted of 3434 individuals (2439 [68.4%] women and 995 [31.6%] men) ofEuropean ancestry, with median (range) age at blood collection of 68.0 (33.0-98.0) years, median(range) age at death of 83.0 (51.0-105.0) years, and a mean (SD) follow-up period of 15.2 (5.4) years(eTable 1 in the Supplement). The median (range) follow-up periods for death events were 10.9
JAMA Network Open | Genetics and Genomics Association of Leukocyte Telomere Length With Mortality Among Adults
JAMA Network Open. 2020;3(2):e200023. doi:10.1001/jamanetworkopen.2020.0023 (Reprinted) February 26, 2020 3/12
Downloaded From: https://jamanetwork.com/ on 11/15/2021
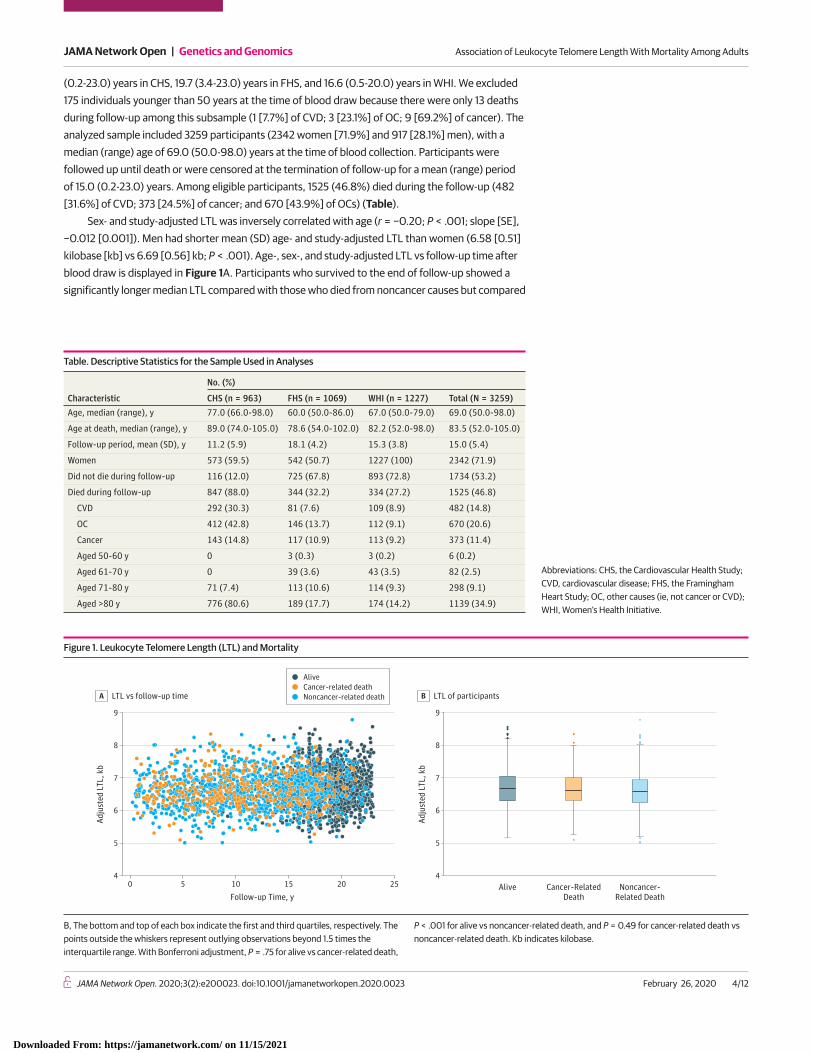
(0.2-23.0) years in CHS, 19.7 (3.4-23.0) years in FHS, and 16.6 (0.5-20.0) years in WHI. We excluded175 individuals younger than 50 years at the time of blood draw because there were only 13 deathsduring follow-up among this subsample (1 [7.7%] of CVD; 3 [23.1%] of OC; 9 [69.2%] of cancer). Theanalyzed sample included 3259 participants (2342 women [71.9%] and 917 [28.1%] men), with amedian (range) age of 69.0 (50.0-98.0) years at the time of blood collection. Participants werefollowed up until death or were censored at the termination of follow-up for a mean (range) periodof 15.0 (0.2-23.0) years. Among eligible participants, 1525 (46.8%) died during the follow-up (482[31.6%] of CVD; 373 [24.5%] of cancer; and 670 [43.9%] of OCs) (Table).
Sex- and study-adjusted LTL was inversely correlated with age (r = −0.20; P < .001; slope [SE],−0.012 [0.001]). Men had shorter mean (SD) age- and study-adjusted LTL than women (6.58 [0.51]kilobase [kb] vs 6.69 [0.56] kb; P < .001). Age-, sex-, and study-adjusted LTL vs follow-up time afterblood draw is displayed in Figure 1A. Participants who survived to the end of follow-up showed asignificantly longer median LTL compared with those who died from noncancer causes but compared
Table. Descriptive Statistics for the Sample Used in Analyses
Characteristic
No. (%)
CHS (n = 963) FHS (n = 1069) WHI (n = 1227) Total (N = 3259)Age, median (range), y 77.0 (66.0-98.0) 60.0 (50.0-86.0) 67.0 (50.0-79.0) 69.0 (50.0-98.0)
Age at death, median (range), y 89.0 (74.0-105.0) 78.6 (54.0-102.0) 82.2 (52.0-98.0) 83.5 (52.0-105.0)
Follow-up period, mean (SD), y 11.2 (5.9) 18.1 (4.2) 15.3 (3.8) 15.0 (5.4)
Women 573 (59.5) 542 (50.7) 1227 (100) 2342 (71.9)
Did not die during follow-up 116 (12.0) 725 (67.8) 893 (72.8) 1734 (53.2)
Died during follow-up 847 (88.0) 344 (32.2) 334 (27.2) 1525 (46.8)
CVD 292 (30.3) 81 (7.6) 109 (8.9) 482 (14.8)
OC 412 (42.8) 146 (13.7) 112 (9.1) 670 (20.6)
Cancer 143 (14.8) 117 (10.9) 113 (9.2) 373 (11.4)
Aged 50-60 y 0 3 (0.3) 3 (0.2) 6 (0.2)
Aged 61-70 y 0 39 (3.6) 43 (3.5) 82 (2.5)
Aged 71-80 y 71 (7.4) 113 (10.6) 114 (9.3) 298 (9.1)
Aged >80 y 776 (80.6) 189 (17.7) 174 (14.2) 1139 (34.9)
Abbreviations: CHS, the Cardiovascular Health Study;CVD, cardiovascular disease; FHS, the FraminghamHeart Study; OC, other causes (ie, not cancer or CVD);WHI, Women’s Health Initiative.
Figure 1. Leukocyte Telomere Length (LTL) and Mortality
9
8
7
6
5
4
Adju
sted
LTL
, kb
Follow-up Time, y
LTL vs follow-up timeA
250 5 10 15 20
9
8
7
6
5
4
Adju
sted
LTL
, kb
LTL of participantsB
Noncancer-Related Death
Alive Cancer-RelatedDeath
AliveCancer-related deathNoncancer-related death
B, The bottom and top of each box indicate the first and third quartiles, respectively. Thepoints outside the whiskers represent outlying observations beyond 1.5 times theinterquartile range. With Bonferroni adjustment, P = .75 for alive vs cancer-related death,
P < .001 for alive vs noncancer-related death, and P = 0.49 for cancer-related death vsnoncancer-related death. Kb indicates kilobase.
JAMA Network Open | Genetics and Genomics Association of Leukocyte Telomere Length With Mortality Among Adults
JAMA Network Open. 2020;3(2):e200023. doi:10.1001/jamanetworkopen.2020.0023 (Reprinted) February 26, 2020 4/12
Downloaded From: https://jamanetwork.com/ on 11/15/2021

with those who died from cancer (alive: 6.69 kb; 95% CI, 6.66-6.72 kb; cancer-related death: 6.61 kb;95% CI, 6.55-6.67 kb; noncancer-related death: 6.59 kb; 95% CI, 6.56-6.62 kb) (Figure 1B).
Figure 2 displays the hazards of death from all causes, CVD, OCs, and cancer among individualsof different ages and with different values of rLTL, scaled to an individual aged 50 years with theexpected (ie, mean) value of LTL for that age (ie, rLTL of 0). Figure 3 shows the respective hazardsof death from different causes at specific ages for different values of rLTLs. At age 60 years, HRswere higher for an individual with −1.0 kb rLTL compared with an individual with 0 kb rLTL (all-causemortality: 3.8 [95% CI, 3.2-4.6] vs 2.9 [95% CI, 2.4-3.4]; CVD mortality: 5.1 [95% CI, 3.5-7.3] vs 4.0[95% CI, 2.9-5.5]; OC mortality: 7.1 [95% CI, 5.1-9.7] vs 4.6 [95% CI, 3.5-6.1]). At age 80 years, HRswere higher for an individual with −1.0 kb rLTL compared with an individual with 0 kb rLTL (all-causemortality: 57.7 [95% CI, 43.5-76.7] vs 43.2 [95% CI, 33.2-56.2]; CVD mortality: 125.5 [95% CI, 69.6-226.3] vs 98.3 [95% CI, 56.2-171.9]; OC mortality: 192.6 [95% CI, 115.5-321.3] vs 125.9 [95% CI, 77.5-204.4]) (eTables 6-8 in the Supplement).
However, we observed minimal association of LTL with cancer mortality (Figure 2D; eTable 9 inthe Supplement). At age 60 years, an individual with 0 kb rLTL had an HR of 1.5 (95% CI, 1.2-2.0),while an individual with −1.0 kb rLTL had an HR of 1.7 (95% CI, 1.3-2.4). At age 80 years, an individualwith 0 kb rLTL had an HR of 7.0 (95% CI, 4.6-10.4), while an individual with −1.0 kb rLTL had an HRof 7.8 (95% CI, 5.0-12.4).
Figure 2. Hazard Ratios for All-Cause and Cause-Specific Mortality for Different Residual Leukocyte Telomere Lengths (LTLs)
200
150
100
50
0
Haz
ard
Ratio
Age, y
All-cause mortalityA
Residual LTL 0 kb
Residual LTL -1.5 kbResidual LTL -1.0 kbResidual LTL -0.5 kb
Residual LTL 0.5 kbResidual LTL 1.0 kbResidual LTL 1.5 kb
9050 55 60 65 70 75 80 85
400
500
300
200
100
0
Haz
ard
Ratio
Age, y
CVD mortalityB
9050 55 60 65 70 75 80 85
1000
800
600
400
200
0
Haz
ard
Ratio
Age, y
OC mortalityC
9050 55 60 65 70 75 80 85
12
14
6
10
8
4
2
0
Haz
ard
Ratio
Age, y
Cancer mortalityD
9050 55 60 65 70 75 80 85
Hazard ratios for individuals of different ages and with different residual LTLs werescaled to an individual aged 50 years with the mean LTL value for that age (ie, residualLTL of 0). Lines are truncated at the age corresponding to the 99th percentile of thedistribution of ages at blood draw in the sample. When using flexible spline modeling, the
SEs of the curves are largest in the tails of the distribution, which may explain why thecurves for cancer mortality (D) turn downwards. The graphs in this figure are the pointestimates and ignore uncertainty. However, a continued increase of the curves for highages cannot be ruled out based on the model fit. Kb indicates kilobase.
JAMA Network Open | Genetics and Genomics Association of Leukocyte Telomere Length With Mortality Among Adults
JAMA Network Open. 2020;3(2):e200023. doi:10.1001/jamanetworkopen.2020.0023 (Reprinted) February 26, 2020 5/12
Downloaded From: https://jamanetwork.com/ on 11/15/2021
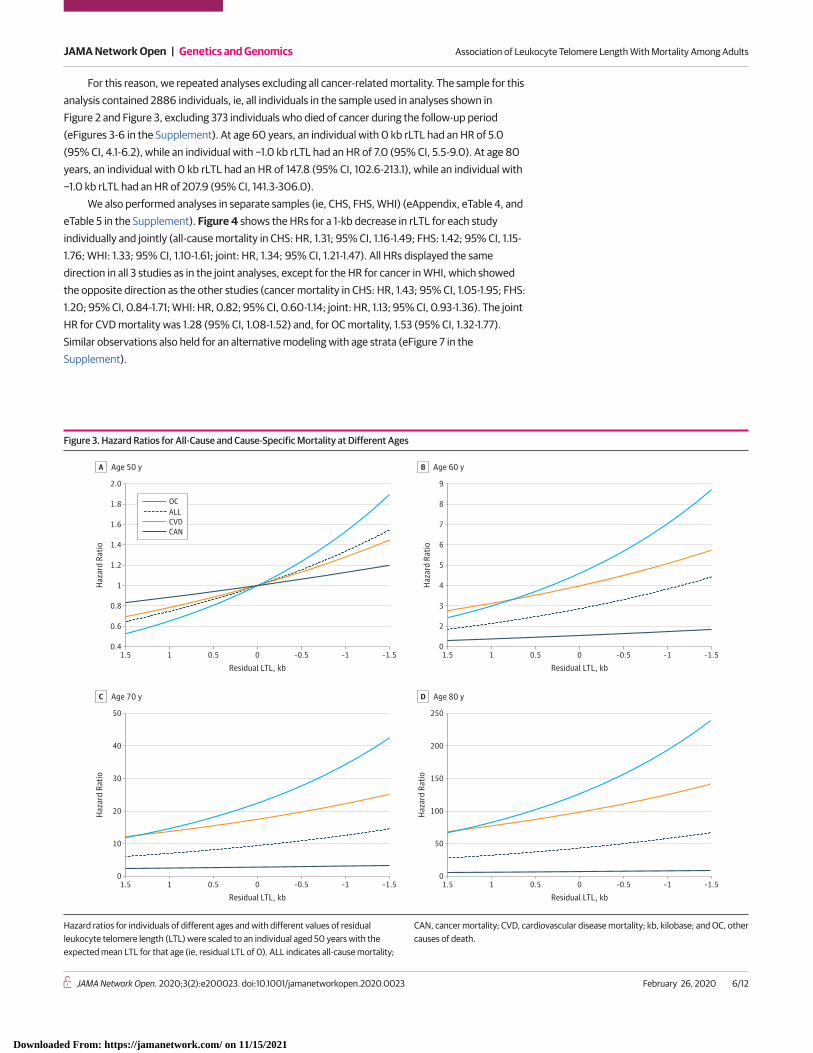
For this reason, we repeated analyses excluding all cancer-related mortality. The sample for thisanalysis contained 2886 individuals, ie, all individuals in the sample used in analyses shown inFigure 2 and Figure 3, excluding 373 individuals who died of cancer during the follow-up period(eFigures 3-6 in the Supplement). At age 60 years, an individual with 0 kb rLTL had an HR of 5.0(95% CI, 4.1-6.2), while an individual with −1.0 kb rLTL had an HR of 7.0 (95% CI, 5.5-9.0). At age 80years, an individual with 0 kb rLTL had an HR of 147.8 (95% CI, 102.6-213.1), while an individual with−1.0 kb rLTL had an HR of 207.9 (95% CI, 141.3-306.0).
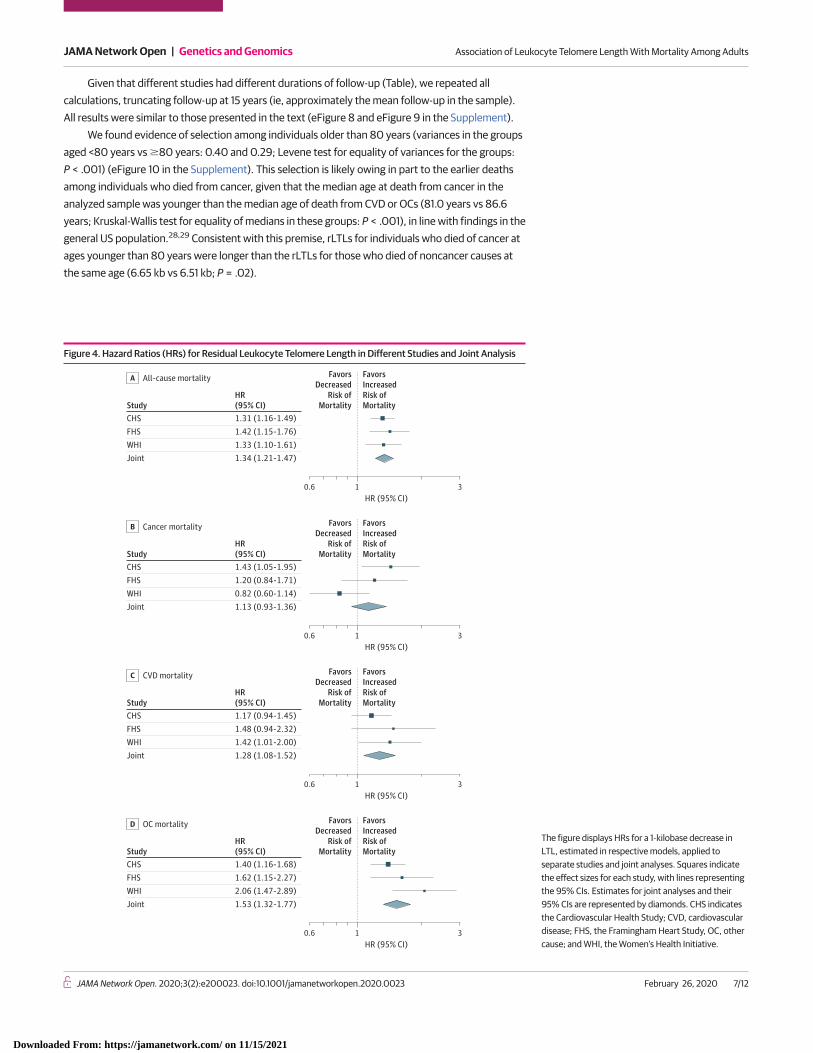
We also performed analyses in separate samples (ie, CHS, FHS, WHI) (eAppendix, eTable 4, andeTable 5 in the Supplement). Figure 4 shows the HRs for a 1-kb decrease in rLTL for each studyindividually and jointly (all-cause mortality in CHS: HR, 1.31; 95% CI, 1.16-1.49; FHS: 1.42; 95% CI, 1.15-1.76; WHI: 1.33; 95% CI, 1.10-1.61; joint: HR, 1.34; 95% CI, 1.21-1.47). All HRs displayed the samedirection in all 3 studies as in the joint analyses, except for the HR for cancer in WHI, which showedthe opposite direction as the other studies (cancer mortality in CHS: HR, 1.43; 95% CI, 1.05-1.95; FHS:1.20; 95% CI, 0.84-1.71; WHI: HR, 0.82; 95% CI, 0.60-1.14; joint: HR, 1.13; 95% CI, 0.93-1.36). The jointHR for CVD mortality was 1.28 (95% CI, 1.08-1.52) and, for OC mortality, 1.53 (95% CI, 1.32-1.77).Similar observations also held for an alternative modeling with age strata (eFigure 7 in theSupplement).
Figure 3. Hazard Ratios for All-Cause and Cause-Specific Mortality at Different Ages
Haz
ard
Ratio
Age 50 yA
Residual LTL, kb–1.51.5 1 0.5 0 –0.5 –1
Residual LTL, kb–1.51.5 1 0.5 0 –0.5 –1
5
6
8
7
9
4
3
2
0
Haz
ard
Ratio
Age 60 yB
Residual LTL, kb–1.51.5 1 0.5 0 –0.5 –1
Residual LTL, kb–1.51.5 1 0.5 0 –0.5 –1
50
40
30
20
10
0
2.0
1.4
1.8
1.6
1.2
1
0.8
0.6
0.4
Haz
ard
Ratio
Age 70 yC
250
150
200
100
50
0
Haz
ard
Ratio
Age 80 yD
CAN
OCALLCVD
Hazard ratios for individuals of different ages and with different values of residualleukocyte telomere length (LTL) were scaled to an individual aged 50 years with theexpected mean LTL for that age (ie, residual LTL of 0). ALL indicates all-cause mortality;
CAN, cancer mortality; CVD, cardiovascular disease mortality; kb, kilobase; and OC, othercauses of death.
JAMA Network Open | Genetics and Genomics Association of Leukocyte Telomere Length With Mortality Among Adults
JAMA Network Open. 2020;3(2):e200023. doi:10.1001/jamanetworkopen.2020.0023 (Reprinted) February 26, 2020 6/12
Downloaded From: https://jamanetwork.com/ on 11/15/2021
Given that different studies had different durations of follow-up (Table), we repeated allcalculations, truncating follow-up at 15 years (ie, approximately the mean follow-up in the sample).All results were similar to those presented in the text (eFigure 8 and eFigure 9 in the Supplement).
We found evidence of selection among individuals older than 80 years (variances in the groupsaged <80 years vs �80 years: 0.40 and 0.29; Levene test for equality of variances for the groups:P < .001) (eFigure 10 in the Supplement). This selection is likely owing in part to the earlier deathsamong individuals who died from cancer, given that the median age at death from cancer in theanalyzed sample was younger than the median age of death from CVD or OCs (81.0 years vs 86.6years; Kruskal-Wallis test for equality of medians in these groups: P < .001), in line with findings in thegeneral US population.28,29 Consistent with this premise, rLTLs for individuals who died of cancer atages younger than 80 years were longer than the rLTLs for those who died of noncancer causes atthe same age (6.65 kb vs 6.51 kb; P = .02).
Figure 4. Hazard Ratios (HRs) for Residual Leukocyte Telomere Length in Different Studies and Joint Analysis
StudyHR(95% CI)
Joint 1.34 (1.21-1.47)
CHS 1.31 (1.16-1.49)FHS 1.42 (1.15-1.76)WHI 1.33 (1.10-1.61)
All-cause mortalityA
FavorsDecreased
Risk ofMortality
FavorsIncreasedRisk ofMortality
0.6 31HR (95% CI)
StudyHR(95% CI)
Joint 1.13 (0.93-1.36)
CHS 1.43 (1.05-1.95)FHS 1.20 (0.84-1.71)WHI 0.82 (0.60-1.14)
Cancer mortalityB
0.6 31HR (95% CI)
FavorsDecreased
Risk ofMortality
FavorsIncreasedRisk ofMortality
0.6 31HR (95% CI)
FavorsDecreased
Risk ofMortality
FavorsIncreasedRisk ofMortality
0.6 31HR (95% CI)
FavorsDecreased
Risk ofMortality
FavorsIncreasedRisk ofMortality
StudyHR(95% CI)
Joint 1.28 (1.08-1.52)
CHS 1.17 (0.94-1.45)FHS 1.48 (0.94-2.32)WHI 1.42 (1.01-2.00)
CVD mortalityC
StudyHR(95% CI)
Joint 1.53 (1.32-1.77)
CHS 1.40 (1.16-1.68)FHS 1.62 (1.15-2.27)WHI 2.06 (1.47-2.89)
OC mortalityD
The figure displays HRs for a 1-kilobase decrease inLTL, estimated in respective models, applied toseparate studies and joint analyses. Squares indicatethe effect sizes for each study, with lines representingthe 95% CIs. Estimates for joint analyses and their95% CIs are represented by diamonds. CHS indicatesthe Cardiovascular Health Study; CVD, cardiovasculardisease; FHS, the Framingham Heart Study, OC, othercause; and WHI, the Women’s Health Initiative.
JAMA Network Open | Genetics and Genomics Association of Leukocyte Telomere Length With Mortality Among Adults
JAMA Network Open. 2020;3(2):e200023. doi:10.1001/jamanetworkopen.2020.0023 (Reprinted) February 26, 2020 7/12
Downloaded From: https://jamanetwork.com/ on 11/15/2021
Models in which age was included as a linear term, stratified by baseline age, allowed fordifferent baseline hazards in each age strata. These had similar results as the main analysis(eAppendix, eTables 2-5, eFigure 1, and eFigure 2 in the Supplement).
Discussion
The debate among demographers on the natural life span limit in humans detracts from a morepersistent question about biological factors that may determine such a limit. The potential roles ofthese factors must be considered in the context of specific causes of death. This study showed thatshort LTL was associated with increased mortality risk as individuals approached the upper boundaryof their longevity, a phenomenon principally associated with mortality from noncancer causes.
In absolute terms, the HRs associated with short LTL rapidly escalated as an individual’s ageapproached 90 years. Simply stated, an LTL-associated increased mortality risk from 100 to 150 in anindividual approaching the upper boundary of the human life span is not akin to an LTL-associatedincreased mortality risk from 1.0 to 1.5 at a much younger age. Ultimately, the estimates from themodels (ie, parameters or corresponding HRs) translate to the estimates of survival probabilities (orprobabilities of death) for individuals with different rLTLs at different ages. At younger ages, themortality risk is low (ie, the survival probabilities are close to 1) such that the resulting change insurvival probabilities would not be substantial. However, at older ages, the mortality risk is muchhigher by itself (ie, the survival probabilities are small and approach 0 as age increases). This meansthat survival chances associated with shorter LTLs among older individuals are dramatically lower forthe same relative increase in the risk of death as at younger ages. While an individual with an rLTL of0 kb at age 85 years might have a small but still noticeable survival probability, for an individual aged85 years with shorter rLTL (eg, −1 kb), such probability might become considerably smaller. Thisconcept might hold not only for LTL but also for other aging-related phenotypes, whose presumedassociation with survival probability increases in absolute terms as individuals approach theboundary of the human life span.
Given common misclassifications of cause of death based on death certificates,30,31 accuratedetermination of the cause of death was critical for our conclusion that LTL was more stronglyassociated with death from noncancer causes than death from cancer. That said, death among theolder individuals, even when carefully adjudicated, is often not a consequence of a single disease. Forinstance, stroke or myocardial infarction may occur in different clinical settings among individualswho have multiple health problems (eg, frailty, loss of ambulation due to a fall, diabetes, dementia,infection, etc) that collectively contribute to the individual’s death. Regardless of these specificcircumstances, it is clear that having comparatively short LTL was associated with increased mortalityrisk from noncancer causes (ie, CVD and OCs).
Regarding the minimal association of LTL with cancer mortality, we note that, whereascomparatively long LTL32-34 and alleles associated with a long LTL12,14,15 have been reported to beassociated with increased risk of several cancers, short LTL has been reported to be associated withdiminished survival among patients with some but not all cancers.35-38 Hence, the association of LTLwith cancer mortality is complex and contextual; it may reflect opposing telomere-related elementsthat modify cancer risk, outcome of cancer treatment, and survival.
LimitationsThis study has limitations. Our findings are based on individuals of European ancestry who reside inthe United States. These results therefore need replication in other groups and geographic locations,given that there is some evidence that the association of LTL with mortality might be influenced byethnicity.25 In addition, our analyses did not adjust for key risk factors that are associated withmortality risk (eg, hypertension, dyslipidemia, diabetes, smoking, obesity) or for comorbidities thatmay have been present at baseline and also contributed to mortality (eg, CVD and cancer).
JAMA Network Open | Genetics and Genomics Association of Leukocyte Telomere Length With Mortality Among Adults
JAMA Network Open. 2020;3(2):e200023. doi:10.1001/jamanetworkopen.2020.0023 (Reprinted) February 26, 2020 8/12
Downloaded From: https://jamanetwork.com/ on 11/15/2021
Conclusions
In this study, comparatively short LTL was associated with an increased risk of dying from noncancercauses in absolute terms among individuals as they approached the upper boundary of humanlongevity. Further research is needed to assess whether a causal relationship exists and to determinethe contribution of LTL to the natural life span limit in contemporary humans.
ARTICLE INFORMATIONAccepted for Publication: December 19, 2019.
Published: February 26, 2020. doi:10.1001/jamanetworkopen.2020.0023
Open Access: This is an open access article distributed under the terms of the CC-BY License. © 2020 Arbeev KGet al. JAMA Network Open.
Corresponding Author: Konstantin G. Arbeev, PhD, Biodemography of Aging Research Unit, Social ScienceResearch Institute, Duke University, 2024 W Main St, Durham, NC 27705 ([email protected]).
Author Affiliations: Biodemography of Aging Research Unit, Social Science Research Institute, Duke University,Durham, North Carolina (Arbeev, Bagley, Yashin); Groningen Institute for Evolutionary Life Sciences, University ofGroningen, the Netherlands (Verhulst); Epidemiology, Biostatistics, and Biodemography, Institute of Public Health,University of South Denmark, Odense, Denmark (Steenstrup); Epidemiology Unit, Hebrew University–HadassahSchool of Public Health and Community Medicine, Jerusalem, Israel (Kark); Division of Public Health Sciences, FredHutchinson Cancer Research Center, Seattle, Washington (Kooperberg, Reiner); Department of Epidemiology,University of Washington, Seattle (Reiner, Fitzpatrick); Population Sciences Branch, National Heart, Lung, andBlood Institute, National Institutes of Health, Bethesda, Maryland (Hwang, Levy); The Framingham Heart Study,Framingham, Massachusetts (Hwang, Levy); Department of Clinical Genetics, Odense University Hospital, Odense,Denmark (Christensen); Danish Aging Research Center, University of Southern Denmark, Odense, Denmark(Christensen); Center of Human Development and Aging, New Jersey Medical School, Rutgers, The StateUniversity of New Jersey, Newark (Aviv).
Author Contributions: Dr Arbeev and Ms Bagley had full access to all of the data in the study and takeresponsibility for the integrity of the data and the accuracy of the data analysis.
Concept and design: Arbeev, Kark, Reiner, Christensen, Aviv.
Acquisition, analysis, or interpretation of data: All authors.
Drafting of the manuscript: Arbeev, Verhulst, Kark, Bagley, Aviv.
Critical revision of the manuscript for important intellectual content: Arbeev, Steenstrup, Kark, Kooperberg, Reiner,Hwang, Levy, Fitzpatrick, Christensen, Yashin, Aviv.
Statistical analysis: Arbeev, Verhulst, Steenstrup, Bagley, Hwang, Christensen.
Obtained funding: Fitzpatrick, Yashin, Aviv.
Administrative, technical, or material support: Yashin, Aviv.
Supervision: Arbeev, Aviv.
Conflict of Interest Disclosures: Drs Hwang and Levy reported being employees of the National Heart, Lung, andBlood Institute and that their research is supported by its Division of Intramural Research. Dr Fitzpatrick reportedreceiving grants from National Institutes of Health during the conduct of the study. Dr Yashin reported receivinggrants from the National Institutes of Health during the conduct of the study. Dr Aviv reported receiving grantsfrom National Institutes of Health during the conduct of the study. No other disclosures were reported.
Funding/Support: This work was supported in part by contract N01-HC-25195 from the National Heart, Lung, andBlood Institute for the Framingham Heart Study. The Cardiovascular Health Study research was supported bycontracts HHSN268201200036C, HHSN268200800007C, HHSN268201800001C, N01HC55222,N01HC85079, N01HC85080, N01HC85081, N01HC85082, N01HC85083, and N01HC85086 and grantsU01HL080295 and U01HL130114 from the National Heart, Lung, and Blood Institute, with additional contributionsfrom the National Institute of Neurological Disorders and Stroke. Additional support was provided by grantR01AG023629 from the National Institute on Aging. The Women’s Health Initiative program is funded throughcontracts HHSN268201600018C, HHSN268201600001C, HHSN268201600002C, HHSN268201600003C,and HHSN268201600004C from the National Heart, Lung, and Blood Institute. Drs Arbeev and Yashin and MsBagley were partially supported by grant P01AG043352 from the National Institutes of Health. Dr Aviv wassupported by grants R01HL116446, R01HD071180, and R01HL13840 from the National Institutes of Health and
JAMA Network Open | Genetics and Genomics Association of Leukocyte Telomere Length With Mortality Among Adults
JAMA Network Open. 2020;3(2):e200023. doi:10.1001/jamanetworkopen.2020.0023 (Reprinted) February 26, 2020 9/12
Downloaded From: https://jamanetwork.com/ on 11/15/2021
grants 262700 and 262043 from the Norwegian Institute of Public Health. Drs Fitzpatrick and Aviv weresupported by R01 HL80698 from the National Institutes of Health.
Role of the Funder/Sponsor: The funders had no role in the design and conduct of the study; collection,management, analysis, and interpretation of the data; preparation, review, or approval of the manuscript; anddecision to submit the manuscript for publication.
Disclaimer: The views expressed in this article are those of the authors and do not necessarily represent the viewsof the National Heart, Lung, and Blood Institute; the National Institutes of Health; or the US Department of Healthand Human Services.
Additional Contributions: A full list of principal Cardiovascular Health Study investigators and institutions can befound at https://chs-nhlbi.org/. A full list of Women’s Health Initiative investigators who contributed to Women’s HealthInitiative science can be found at https://www.whi.org/researchers/SitePages/Principal%20Investigators.aspx.
Additional Information: We dedicate this article to Jeremy D. Kark, MD, MPH—the epitome of a clinicalresearcher—who inspired his colleagues and students in his uncompromised quest for the truth. Jeremy sadly diedwhile working on this study.
REFERENCES1. Olshansky SJ, Carnes BA, Désesquelles A. Demography: prospects for human longevity. Science. 2001;291(5508):1491-1492. doi:10.1126/science.291.5508.1491
2. Dong X, Milholland B, Vijg J. Evidence for a limit to human lifespan. Nature. 2016;538(7624):257-259. doi:10.1038/nature19793
3. Lenart A, Vaupel JW. Questionable evidence for a limit to human lifespan. Nature. 2017;546(7660):E13-E14.doi:10.1038/nature22790
4. Rozing MP, Kirkwood TBL, Westendorp RGJ. Is there evidence for a limit to human lifespan? Nature. 2017;546(7660):E11-E12. doi:10.1038/nature22788
5. Barbi E, Lagona F, Marsili M, Vaupel JW, Wachter KW. The plateau of human mortality: demography of longevitypioneers. Science. 2018;360(6396):1459-1461. doi:10.1126/science.aat3119
6. Bakaysa SL, Mucci LA, Slagboom PE, et al. Telomere length predicts survival independent of genetic influences.Aging Cell. 2007;6(6):769-774. doi:10.1111/j.1474-9726.2007.00340.x
7. Kimura M, Hjelmborg JV, Gardner JP, et al. Telomere length and mortality: a study of leukocytes in elderlyDanish twins. Am J Epidemiol. 2008;167(7):799-806. doi:10.1093/aje/kwm380
8. Deelen J, Beekman M, Codd V, et al. Leukocyte telomere length associates with prospective mortalityindependent of immune-related parameters and known genetic markers. Int J Epidemiol. 2014;43(3):878-886.doi:10.1093/ije/dyt267
9. Needham BL, Rehkopf D, Adler N, et al. Leukocyte telomere length and mortality in the National Health andNutrition Examination Survey, 1999-2002. Epidemiology. 2015;26(4):528-535. doi:10.1097/EDE.0000000000000299
10. Mons U, Müezzinler A, Schöttker B, et al. Leukocyte telomere length and all-cause, cardiovascular disease, andcancer mortality: results from individual-participant-data meta-analysis of 2 large prospective cohort studies. AmJ Epidemiol. 2017;185(12):1317-1326. doi:10.1093/aje/kww210
11. Codd V, Nelson CP, Albrecht E, et al; CARDIoGRAM consortium. Identification of seven loci affecting meantelomere length and their association with disease. Nat Genet. 2013;45(4):422-427, e1-e2. doi:10.1038/ng.2528
12. Haycock PC, Burgess S, Nounu A, et al; Telomeres Mendelian Randomization Collaboration. Associationbetween telomere length and risk of cancer and non-neoplastic diseases: a mendelian randomization study. JAMAOncol. 2017;3(5):636-651. doi:10.1001/jamaoncol.2016.5945
13. Zhan Y, Karlsson IK, Karlsson R, et al. Exploring the causal pathway from telomere length to coronary heartdisease: a network mendelian randomization study. Circ Res. 2017;121(3):214-219. doi:10.1161/CIRCRESAHA.116.310517
14. Iles MM, Bishop DT, Taylor JC, et al; AMFS Investigators; IBD investigators; QMEGA and QTWIN Investigators;SDH Study Group; GenoMEL Consortium. The effect on melanoma risk of genes previously associated withtelomere length. J Natl Cancer Inst. 2014;106(10):dju267. doi:10.1093/jnci/dju267
15. Machiela MJ, Lan Q, Slager SL, et al. Genetically predicted longer telomere length is associated with increasedrisk of B-cell lymphoma subtypes. Hum Mol Genet. 2016;25(8):1663-1676. doi:10.1093/hmg/ddw027
16. Factor-Litvak P, Susser E, Kezios K, et al. Leukocyte telomere length in newborns: implications for the role oftelomeres in human disease. Pediatrics. 2016;137(4):e20153927. doi:10.1542/peds.2015-3927
JAMA Network Open | Genetics and Genomics Association of Leukocyte Telomere Length With Mortality Among Adults
JAMA Network Open. 2020;3(2):e200023. doi:10.1001/jamanetworkopen.2020.0023 (Reprinted) February 26, 2020 10/12
Downloaded From: https://jamanetwork.com/ on 11/15/2021
17. Benetos A, Kark JD, Susser E, et al. Tracking and fixed ranking of leukocyte telomere length across the adult lifecourse. Aging Cell. 2013;12(4):615-621. doi:10.1111/acel.12086
18. Daniali L, Benetos A, Susser E, et al. Telomeres shorten at equivalent rates in somatic tissues of adults. NatCommun. 2013;4:1597. doi:10.1038/ncomms2602
19. Mangino M, Hwang SJ, Spector TD, et al. Genome-wide meta-analysis points to CTC1 and ZNF676 as genesregulating telomere homeostasis in humans. Hum Mol Genet. 2012;21(24):5385-5394. doi:10.1093/hmg/dds382
20. Levy D, Neuhausen SL, Hunt SC, et al. Genome-wide association identifies OBFC1 as a locus involved in humanleukocyte telomere biology. Proc Natl Acad Sci U S A. 2010;107(20):9293-9298. doi:10.1073/pnas.0911494107
21. Kuo C-L, Pilling LC, Kuchel GA, Ferrucci L, Melzer D. Telomere length and aging-related outcomes in humans:a mendelian randomization study in 261,000 older participants. Aging Cell. 2019;18(6):e13017. doi:10.1111/acel.13017
22. Steenstrup T, Kark JD, Verhulst S, et al. Telomeres and the natural lifespan limit in humans. Aging (Albany NY).2017;9(4):1130-1142. doi:10.18632/aging.101216
23. Fitzpatrick AL, Kronmal RA, Gardner JP, et al. Leukocyte telomere length and cardiovascular disease in thecardiovascular health study. Am J Epidemiol. 2007;165(1):14-21. doi:10.1093/aje/kwj346
24. O’Donnell CJ, Demissie S, Kimura M, et al. Leukocyte telomere length and carotid artery intimal medialthickness: the Framingham Heart Study. Arterioscler Thromb Vasc Biol. 2008;28(6):1165-1171. doi:10.1161/ATVBAHA.107.154849
25. Carty CL, Kooperberg C, Liu J, et al. Leukocyte telomere length and risks of incident coronary heart disease andmortality in a racially diverse population of postmenopausal women. Arterioscler Thromb Vasc Biol. 2015;35(10):2225-2231. doi:10.1161/ATVBAHA.115.305838
26. Kimura M, Stone RC, Hunt SC, et al. Measurement of telomere length by the Southern blot analysis of terminalrestriction fragment lengths. Nat Protoc. 2010;5(9):1596-1607. doi:10.1038/nprot.2010.124
27. Prentice RL, Kalbfleisch JD, Peterson AV Jr, Flournoy N, Farewell VT, Breslow NE. The analysis of failure timesin the presence of competing risks. Biometrics. 1978;34(4):541-554. doi:10.2307/2530374
28. Fuster V, Kelly BB, eds. Promoting Cardiovascular Health in the Developing World: A Critical Challenge toAchieve Global Health. Washington, DC: National Academies Press; 2010.
29. Noone AM, Howlader N, Krapcho M, et al. SEER Cancer Statistics Review, 1975-2015. https://seer.cancer.gov/archive/csr/1975_2015. Accessed January 22, 2020.
30. McGivern L, Shulman L, Carney JK, Shapiro S, Bundock E. Death certification errors and the effect on mortalitystatistics. Public Health Rep. 2017;132(6):669-675. doi:10.1177/0033354917736514
31. Mieno MN, Tanaka N, Arai T, et al. Accuracy of death certificates and assessment of factors for misclassificationof underlying cause of death. J Epidemiol. 2016;26(4):191-198. doi:10.2188/jea.JE20150010
32. Seow WJ, Cawthon RM, Purdue MP, et al. Telomere length in white blood cell DNA and lung cancer: a pooledanalysis of three prospective cohorts. Cancer Res. 2014;74(15):4090-4098. doi:10.1158/0008-5472.CAN-14-0459
33. Julin B, Shui I, Heaphy CM, et al. Circulating leukocyte telomere length and risk of overall and aggressiveprostate cancer. Br J Cancer. 2015;112(4):769-776. doi:10.1038/bjc.2014.640
34. Caini S, Raimondi S, Johansson H, et al. Telomere length and the risk of cutaneous melanoma andnon-melanoma skin cancer: a review of the literature and meta-analysis. J Dermatol Sci. 2015;80(3):168-174. doi:10.1016/j.jdermsci.2015.08.003
35. Arons E, Zhou H, Edelman DC, et al. Impact of telomere length on survival in classic and variant hairy cellleukemia. Leuk Res. 2015;39(12):1360-1366. doi:10.1016/j.leukres.2015.09.015
36. Russo A, Modica F, Guarrera S, et al. Shorter leukocyte telomere length is independently associated with poorsurvival in patients with bladder cancer. Cancer Epidemiol Biomarkers Prev. 2014;23(11):2439-2446. doi:10.1158/1055-9965.EPI-14-0228
37. Callahan CL, Schwartz K, Ruterbusch JJ, et al. Leukocyte telomere length and renal cell carcinoma survival intwo studies. Br J Cancer. 2017;117(5):752-755. doi:10.1038/bjc.2017.237
38. Wang W, Zheng L, Zhou N, et al. Meta-analysis of associations between telomere length and colorectal cancersurvival from observational studies. Oncotarget. 2017;8(37):62500-62507. doi:10.18632/oncotarget.20055
SUPPLEMENT.eAppendix. Technical DetailseTable 1. Descriptive Statistics for the Original Sample
JAMA Network Open | Genetics and Genomics Association of Leukocyte Telomere Length With Mortality Among Adults
JAMA Network Open. 2020;3(2):e200023. doi:10.1001/jamanetworkopen.2020.0023 (Reprinted) February 26, 2020 11/12
Downloaded From: https://jamanetwork.com/ on 11/15/2021
eTable 2. Results of Analyses of All-Cause and Cause-Specific Mortality in the Combined Sample of 3 Studies (CHS,FHS, WHI) Using the Model With Splines for AgeeTable 3. Results of Analyses of All-Cause and Cause-Specific Mortality in the Combined Sample of 3 Studies (CHS,FHS, WHI) Using the Model With Stratified Baseline Hazards for Age GroupseTable 4. Results of Analyses of All-Cause and Cause-Specific Mortality in Separate Samples (CHS, FHS, WHI) Usingthe Model With Splines for AgeeTable 5. Results of Analyses of All-Cause and Cause-Specific Mortality in Separate Samples (CHS, FHS, WHI) Usingthe Model With Stratified Baseline Hazards for Age GroupseTable 6. Hazard Ratios for All-Cause Mortality for Different Ages and Residual Leukocyte Telomere Length (rLTL)Computed From the Cox Model With Splines for AgeeTable 7. Hazard Ratios for Cardiovascular Disease Mortality for Different Ages and Residual Leukocyte TelomereLength (rLTL) Computed From the Cox Model With Splines for AgeeTable 8. Hazard Ratios for Other Causes Mortality for Different Ages and Residual Leukocyte Telomere Length(rLTL) Computed From the Cox Model With Splines for AgeeTable 9. Hazard Ratios for Cancer Mortality for Different Ages and Residual Leukocyte Telomere Length (rLTL)Computed From the Cox Model With Splines for AgeeTable 10. Hazard Ratios for All-Cause Mortality for Different Ages and Residual Leukocyte Telomere Length (rLTL)Computed From the Cox Model With Stratified Baseline Hazards for Age GroupseTable 11. Hazard Ratios for Cardiovascular Disease Mortality for Different Ages and Residual Leukocyte TelomereLength (rLTL) Computed From the Cox Model With Stratified Baseline Hazards for Age GroupseTable 12. Hazard Ratios for Other Causes Mortality for Different Ages and Residual Leukocyte Telomere Length(rLTL) Computed From the Cox Model With Stratified Baseline Hazards for Age GroupseTable 13. Hazard Ratios for Cancer Mortality for Different Ages and Residual Leukocyte Telomere Length (rLTL)Computed From the Cox Model With Stratified Baseline Hazards for Age GroupseFigure 1. Hazard Ratios for All-Cause and Cause-Specific Mortality for Different Residual Leukocyte TelomereLengthseFigure 2. Hazard Ratios for All-Cause and Cause-Specific Mortality at Different AgeseFigure 3. Hazard Ratios for Noncancer Mortality for Different Ages and Values of Residual Leukocyte TelomereLengtheFigure 4. Hazard Ratios at Different Ages for Noncancer Mortality in the Model with Splines for AgeeFigure 5. Hazard Ratios for Noncancer Mortality for Different Ages and Values of Residual Leukocyte TelomereLengtheFigure 6. Hazard Ratios at Different Ages for Noncancer Mortality in the Model With Stratified Baseline HazardseFigure 7. Hazard Ratios for Residual Leukocyte Telomere Length in Different Studies and Joint Analysis in theModel With Stratified Baseline HazardseFigure 8. Hazard Ratios for Residual Leukocyte Telomere Length in Different Studies and Joint Analysis WithTruncated Follow-up in the Model With SplineseFigure 9. Hazard Ratios for Residual Leukocyte Telomere Length in Different Studies and Joint Analysis WithTruncated Follow-up in the Model With Stratified Baseline HazardseFigure 10. Density Plots of Leukocyte Telomere Length for Different Age Groups
JAMA Network Open | Genetics and Genomics Association of Leukocyte Telomere Length With Mortality Among Adults
JAMA Network Open. 2020;3(2):e200023. doi:10.1001/jamanetworkopen.2020.0023 (Reprinted) February 26, 2020 12/12
Downloaded From: https://jamanetwork.com/ on 11/15/2021


![Telomere length, vitamin B12 and mortality in persons undergoing … · 2019. 9. 16. · 7083 AGING. INTRODUCTION . Short telomeres [1–3] and hyperhomocysteinemia (HHCY) [4, 5],](https://img.dokumen.tips/doc/110x75/60c26ced6fd3eb4ea76f9d9e/telomere-length-vitamin-b12-and-mortality-in-persons-undergoing-2019-9-16.jpg)