Embed Size (px)
Citation preview

©FUNPEC-RP www.funpecrp.com.brGenetics and Molecular Research 12 (4): 4768-4779 (2013)
Association of insulin growth factor-1 receptor gene polymorphisms with genetic susceptibility to idiopathic short stature
Y. Yang1, H. Huang1,W. Wang2, L. Yang1, L.L. Xie1 and W. Huang3
1Department of Endocrinology, Jiangxi Province Children’s Hospital, Nanchang Jiangxi, China 2Department of Pediatrics, Ruijin Hospital,Shanghai Jiaotong University School of Medicine, Shanghai, China3Key Laboratory of Health and Disease Genomics,Chinese National Human Genome Center at Shanghai, Shanghai, China
Corresponding author: Y. YangE-mail: [email protected]
Genet. Mol. Res. 12 (4): 4768-4779 (2013)Received April 26, 2013Accepted August 19, 2013Published October 18, 2013DOI http://dx.doi.org/10.4238/2013.October.18.14
ABSTRACT. The association between single nucleotide polymorphisms (SNPs) in the insulin-like growth factor-1 receptor (IGF-1R) gene and susceptibility to idiopathic short stature (ISS) was investigated. Seven hundred and twelve Chinese children clinically diagnosed with ISS and 575 normal individuals were recruited between 2008 and 2011, and their SNPs were genotyped. Preliminary screening revealed that the rs1976667 and rs2684788 loci were significantly associated with genetic susceptibility to ISS (P = 0.03636 and P = 0.01352, respectively). Stratification by sex revealed that in males, different genotypes at the rs1976667 locus were significantly associated with genetic susceptibility to ISS (P = 0.047), showing G dominant inheritance (P = 0.018). The G allele at the rs2684788 locus was significantly associated with genetic susceptibility to ISS (P = 0.016), showing G dominant inheritance (P < 0.001). In females, different genotypes at the rs1976667 locus were
4769
©FUNPEC-RP www.funpecrp.com.brGenetics and Molecular Research 12 (4): 4768-4779 (2013)
IGF-1R gene polymorphisms and idiopathic short stature
significantly associated with genetic susceptibility to ISS (P = 0.011), showing G dominant inheritance (P = 0.005). Different genotypes at the rs2684788 locus, the G allele, and the G recessive mode of inheritance were all significantly associated with genetic susceptibility to ISS (P < 0.005). The genotypes at the rs1976667 locus in the female ISS group were significantly correlated to IGF-1 standard deviation integral value (SDS) (P = 0.006). The rs1976667 and rs2684788 loci of the human IGF-1R gene are likely associated with different genetic susceptibilities to ISS in males and females. Different clinical phenotypes of ISS may be associated with SNPs of IGF-1R.
Key words: Idiopathic short stature; Single nucleotide polymorphisms; IGF-1 receptor; Genetic susceptibility
INTRODUCTION
Idiopathic short stature (ISS) refers to the case when a child’s height is less than two standard deviations (-2SD) of the mean height of normal children of the same age and sex. ISS excludes cases of short stature arising from systemic disease, endocrine factors, nutrition, chromosomal abnormalities, small for gestational age (SGA) infant, and other diseases leading to short stature. The incidence of ISS accounts for 60-80% of short stature (Cohen et al., 2008; Rosenbloom, 2009), and is a common disease. ISS is not considered a clinical diagnosis, but is a descriptive classification that includes miscellaneous short stature cases whose causes are not yet clear. ISS can be divided into familial short stature and non-familial short stature (including developmental delay of adolescence) according to parental height (Cohen et al., 2008).
The growth hormone-insulin-like growth factor-1 axis (GH-IGF-1 axis) plays a sig-nificant role in the pathogenesis of ISS. Any regulation abnormality along the axis is likely to be related to ISS (Savage et al., 2010; Wit et al., 2011). Insulin-like growth factor-1 receptor (IGF-1R) is the effector molecule that regulates the cascade reaction of hormone receptors in the axis. IGF-1 must combine with IGF-1R before activating target tissues to play a role in regulating growth and development (Backeljauw et al., 2010).
The aims of this study were to explore the ISS mechanism from the molecular genetic perspective of the GH-IGF-1 axis, to screen single nucleotide polymorphism (SNP) loci related to ISS genetic susceptibility, to analyze the relationships between SNPs of the IGF-1R gene and ISS genetic susceptibility, and to determine the correlation of IGF-1R with the following ISS clinical parameters: height (Ht) standard deviation integral value (SDS), SDS of weight, body mass index (BMI), IGF-1 SDS, IGF-binding protein 3 (BP3) SDS, and target height (TH) SDS.
MATERIAL AND METHODS
Subjects
The case-control study design was adopted in this experiment. A total of 1290 samples were analyzed, which were obtained from unrelated individuals of the southern Chinese Han population.

4770
©FUNPEC-RP www.funpecrp.com.brGenetics and Molecular Research 12 (4): 4768-4779 (2013)
Y. Yang et al.
Case group
Seven hundred twelve children who were clinically diagnosed with ISS at 3 hospitals between 2008 and 2011 were recruited for the study, including 486 males and 226 females. The mean age of boys was 9.82 ± 3.37 years and that of girls was 9.20 ± 3.06 years. None of the children had yet entered puberty, and the heights of their parents were all within the normal range. Familial short stature and physical developmental delay of adolescence was excluded for all subjects. The inclusion criteria (Wit et al., 2008) were as follows: i) height less than 2 SD of the mean height of children of the same age and sex (Li et al., 2009), ii) at least one GH peak value >7 ng/mL in the GH provocation test, iii) normal routine blood, thyroid function, liver, and kidney function, iv) birth weight and length within the normal range, and v) no other inherited metabolic diseases, chromosomal abnormalities, congenital skeletal abnormalities, or chronic diseases.
Control group
Five hundred and seventy-five normal patients who came for medical examinations between 2008 and 2009 were recruited as control subjects, including 289 males and 286 fe-males. The mean height of males was 173.75 ± 5.62 cm, the maximum height was 180.0 cm, and the minimum height was 161.0 cm. The mean height of females was 162.31 ± 4.32 cm, and the maximum and minimum heights were 173.0 cm and 151.0 cm, respectively. The inclusion criteria were as follows: i) height within ± 2 SDs of the mean height of the normal population of the same sex and ii) BMI within the normal range.
Data pretreatment
Height, IGF-1, and IGF-binding protein 3 (BP3) (Xu et al., 2013) were measured, and genetic height was used as the reference unit to calculate the SDS. The corrected mid-parental height (CMH) method was used to calculate the genetic TH, which is the average height of parents plus 6.5 cm for male children and the average height of parents minus 6.5 cm for female children (Tanner et al., 1970), and the SDS of TH = (actual TH - the mean adult height)/ stan-dard deviation of adult height (Li et al., 2009). Yip’s bone age (BA) scoring system, which is an improvement of the Tanner-Whitehouse (TW) method according to characteristics of Chinese people, was used to assess BA, which was assessed by experienced professionals. The lag of BA by more than 1 year was defined as BA delay, which was denoted by actual age minus BA.
Research materials
The main instruments used were the desktop centrifuge 5415D (Eppendorf), the Nanodrop nucleic acid protein analyzer, and related reagents required by the ND1000NA and Snapshot platforms.
Genomic DNA extraction
Two milliliters fasting venous blood was drawn from the ISS and control group sub-

4771
©FUNPEC-RP www.funpecrp.com.brGenetics and Molecular Research 12 (4): 4768-4779 (2013)
IGF-1R gene polymorphisms and idiopathic short stature
jects, EDTA-2K anti-coagulated, and genomic DNA was extracted according to the routine phenol chloroform-isoamyl alcohol method, which was stored at -20°C until use.
Screening for alternate gene SNP loci
According to the tag SNP strategy of linkage disequilibrium, maximal coverage of all SNP loci can be achieved through genotyping a small tag SNP. The tag SNP loci were selected according to the subset SNP frequency of Han Chinese in Beijing, China (CHB) available in the HapMap databank and NCBI. Finally, the following 46 optimized tag SNP loci were selected: rs4966007, rs4966010, rs1574213, rs1319859, rs1976667, rs4966015, rs907813, rs11857366, rs4966017, rs932071, rs4965430, rs7183706, rs2175800, rs7183655, rs11855223, rs8041224, rs8037855, rs907801, rs12908948, rs3759908, rs6598554, rs7181123, rs8030473, rs2684761, rs4246340, rs1398873, rs1879612, rs8030950, rs12594847, rs2684781, rs1521480, rs11630259, rs12593291, rs4966038, rs2684811, rs2715416, rs7168671, rs2139924, rs2272037, rs7169544, rs4966039, rs3784604, rs2684808, rs3743262, rs2002880, and rs2684788. The linkage disequi-librium coefficient (r2) was > 0.8, and the minor allele frequency (MAF) was > 0.05.
SNP loci genotyping
The Snapshot technology platform (Applied Biosystems) was adopted to conduct the SNP loci genotyping. After designing primers of different lengths, the Snapshot reaction was performed targeting different mutational sites. The products were treated by electrophoresis sep-arating, were detected with five-color fluorescence, and analyzed with GeneMapper (Table 1).
Locus Allele Upstream primer Downstream primer PCR product SNP probe
rs2684788 A/G 5ꞌ-GGTGGGTTGGT 5ꞌ-CCGGGGATCTTA 336 bp 5ꞌ-TTTTTTTTTGTAGGTG CCAGTAAAA-3ꞌ AGGTCATT-3ꞌ ACCCCTTGGAATAA-3ꞌrs1976667 A/G 5ꞌ-CCCATATGAAC 5ꞌ-CCAGGGACCT 286 bp 5ꞌ-TTTTTTTTTTTTTTTTTTTTCT GTCCTTGCT-3ꞌ GCTGTAGAAC-3ꞌ ACTCCAAGGCAAAGCAAA-3ꞌ
Table 1. Design of primer.
The Snapshot polymerase chain reaction (PCR) cycle conditions were: 96°C for 10 s, followed by 25 cycles of 96°C for 10 s, 50°C (53°C) for 5 s, and 60°C for 30 s, and finally 60°C for 30 s and reducing to 4°C. The total volume of PCR amplification was 5 μL containing 1.3 μL dH20, 1.2 μL Pooled Primers, 2 μL Pooled PCR Products, and 0.5 μL Reaction Mix. The SNP sequencing results of rs1976667 and rs2684788 were analyzed using GeneMap-per4.0 software.
Statistical analysis
The chi-squared test or the Armitage trend test was used to analyze differences be-tween the control and ISS groups in SNP genotypes of the IGF-1R gene, alleles, and dominant and recessive modes. The Student t-test or the rank sum test was adopted to analyze the rela-tionship between genotype and clinical parameters. Statistically significant differences were indicated when P < 0.05. All analyses were performed with SPSS17.0.

4772
©FUNPEC-RP www.funpecrp.com.brGenetics and Molecular Research 12 (4): 4768-4779 (2013)
Y. Yang et al.
RESULTS
SNP locus genotyping
The SNP sequencing results at the rs1976667 and rs2684788 loci of the IGF-1R gene were analyzed using GeneMapper4.0 and are shown in Figures 1 and 2.
Figure 1. G/A, A/A, and G/G genotype results for different samples at the rs1976667 locus of the IGF-1R gene.
Figure 2. G/A, A/A, and G/G genotype results for different samples at the rs2684788 locus of the IGF-1R gene.

4773
©FUNPEC-RP www.funpecrp.com.brGenetics and Molecular Research 12 (4): 4768-4779 (2013)
IGF-1R gene polymorphisms and idiopathic short stature
Single locus chi-squared test or Armitage trend test
The Hardy-Weinberg equilibrium test showed no significant difference in rs1976667 between the ISS group and the normal population (P > 0.05), indicating that the sample repre-sented the normal population distribution. The chi-squared test was used to carry out the allele frequency, genotypic frequency, and G dominant/recessive mode analyses. In normal control individuals, rs2684788 differed significantly from Hardy-Weinberg expectations (P < 0.05). The Armitage trend test was used to analyze the allele frequency, genotypic frequency, and G dominant/recessive mode analysis.
Analysis at the screening stage of the 275 ISS patients and 379 control subjects revealed that rs1976667 and rs2684788 were significantly correlated to ISS (P = 0.03636 and P = 0.01352, respectively). Targeting these 2 loci, validation was conducted by further expanding the sample size to 715 ISS patients and 575 control subjects. The validation revealed no statistical significance in the differences in the distribution frequency of the 2 SNP alleles, the distribution frequency of genotypes, or case-control associations of genotype in the dominant and recessive modes. The data was then stratified by sex, and the results are presented in the following sections.
Analysis of the rs1976667 and rs2684788 loci in males
The results of the rs1976667 locus analysis in males showed no statistically signifi-cant difference in the G/A allele distribution frequency between case and control groups (χ2
= 3.312, P = 0.069, odds ratio (OR) = 0.734, 95% confidence interval (CI) = 0.525-0.943). However, the difference in the genotype distribution frequency between groups was statisti-cally significant (χ2 = 6.176, P = 0.046), as was the difference in the G dominant mode (χ2 = 5.564, P = 0.018, OR = 0.709, 95%CI = 0.524-0.943). After Bonferroni correction for multiple tests, the difference of the G dominant mode remained statistically significant, suggesting that the genotypes GG and GA were relevant to ISS susceptibility in males, which might show a G dominant mode of inheritance (Table 2).
SNP locus ISS group (N = 486) Control group (N = 289) χ2 P OR 95%CI Bonferroni correction
N % N %
Genotype GG 38 8.1 22 7.7 6.176 0.046 - - GA 202 41.5 146 50.3 AA 246 50.5 121 42.0Allele G 108 22.5 81 28.0 3.312 0.069 0.734 0.525,1.025 0.083 A 378 77.5 208 72.0 1.00 1.00Dominant mode GG+GA 240 49.5 168 58.0 5.564 0.018 0.709 0.524,0.943 0.022 AA 246 50.5 121 42.0 1.00 1.00Recessive mode AA + GA 38 8.1 22 7.7 0.011 0.917 1.052 0.596,1.778 1.000 GG 448 91.9 267 92.3 1.00 1.00
Table 2. Chi-square test for rs1976667 locus of the IGF-IR gene in males.
The results of the rs2684788 analysis in males showed a statistically significant differ-ence between case and control groups in the G/A allele distribution frequency (χ2 = 5.786, P = 0.016, OR = 0.677, 95%CI = 0.493-0.931). However, the genotype distribution frequency did
4774
©FUNPEC-RP www.funpecrp.com.brGenetics and Molecular Research 12 (4): 4768-4779 (2013)
Y. Yang et al.
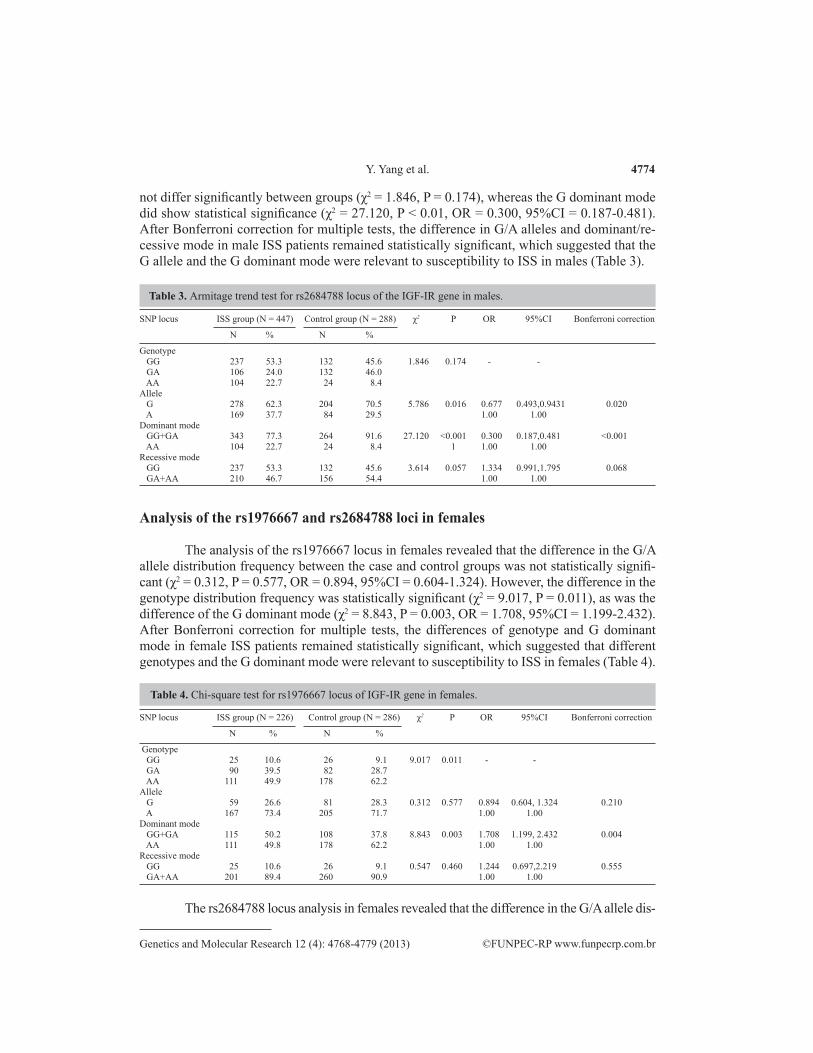
not differ significantly between groups (χ2 = 1.846, P = 0.174), whereas the G dominant mode did show statistical significance (χ2 = 27.120, P < 0.01, OR = 0.300, 95%CI = 0.187-0.481). After Bonferroni correction for multiple tests, the difference in G/A alleles and dominant/re-cessive mode in male ISS patients remained statistically significant, which suggested that the G allele and the G dominant mode were relevant to susceptibility to ISS in males (Table 3).
SNP locus ISS group (N = 447) Control group (N = 288) χ2 P OR 95%CI Bonferroni correction
N % N %
Genotype GG 237 53.3 132 45.6 1.846 0.174 - - GA 106 24.0 132 46.0 AA 104 22.7 24 8.4Allele G 278 62.3 204 70.5 5.786 0.016 0.677 0.493,0.9431 0.020 A 169 37.7 84 29.5 1.00 1.00Dominant mode GG+GA 343 77.3 264 91.6 27.120 <0.001 0.300 0.187,0.481 <0.001 AA 104 22.7 24 8.4 1 1.00 1.00Recessive mode GG 237 53.3 132 45.6 3.614 0.057 1.334 0.991,1.795 0.068 GA+AA 210 46.7 156 54.4 1.00 1.00
Table 3. Armitage trend test for rs2684788 locus of the IGF-IR gene in males.
SNP locus ISS group (N = 226) Control group (N = 286) χ2 P OR 95%CI Bonferroni correction
N % N %
Genotype GG 25 10.6 26 9.1 9.017 0.011 - - GA 90 39.5 82 28.7 AA 111 49.9 178 62.2Allele G 59 26.6 81 28.3 0.312 0.577 0.894 0.604, 1.324 0.210 A 167 73.4 205 71.7 1.00 1.00Dominant mode GG+GA 115 50.2 108 37.8 8.843 0.003 1.708 1.199, 2.432 0.004 AA 111 49.8 178 62.2 1.00 1.00Recessive mode GG 25 10.6 26 9.1 0.547 0.460 1.244 0.697,2.219 0.555 GA+AA 201 89.4 260 90.9 1.00 1.00
Analysis of the rs1976667 and rs2684788 loci in females
The analysis of the rs1976667 locus in females revealed that the difference in the G/A allele distribution frequency between the case and control groups was not statistically signifi-cant (χ2 = 0.312, P = 0.577, OR = 0.894, 95%CI = 0.604-1.324). However, the difference in the genotype distribution frequency was statistically significant (χ2 = 9.017, P = 0.011), as was the difference of the G dominant mode (χ2 = 8.843, P = 0.003, OR = 1.708, 95%CI = 1.199-2.432). After Bonferroni correction for multiple tests, the differences of genotype and G dominant mode in female ISS patients remained statistically significant, which suggested that different genotypes and the G dominant mode were relevant to susceptibility to ISS in females (Table 4).
Table 4. Chi-square test for rs1976667 locus of IGF-IR gene in females.
The rs2684788 locus analysis in females revealed that the difference in the G/A allele dis-

4775
©FUNPEC-RP www.funpecrp.com.brGenetics and Molecular Research 12 (4): 4768-4779 (2013)
IGF-1R gene polymorphisms and idiopathic short stature
tribution frequency between the case and control groups was statistically significant (χ2 = 7.750, P = 0.005, OR = 1.698, 95%CI = 1.169-2.468). The difference in the genotype distribution fre-quency was statistically significant (χ2 = 7.984, P = 0.005) as was the difference in the G recessive mode (χ2 = 11.722, P = 0.001, OR = 1.890, 95%CI = 1.311-2.725). After Bonferroni correction for multiple tests, the differences in genotype, the G/A allele, and the G recessive mode in the female ISS group remained statistically significant, which implied that different genotypes, the G/A al-lele, and the G recessive mode of the rs2684788 locus was relevant to ISS in females (Table 5).
SNP locus ISS group (N = 202) Control group (N = 283) χ2 P OR 95%CI Bonferroni correction
N % N %
Genotype GG 111 55.3 111 42.4 7.984 0.005 - - GA 46 21.3 93 39.5 AA 45 23.4 79 18.1Allele G 134 65.5 152 53.7 7.750 0.005 1.698 1.169, 2.468 0.007 A 68 34.5 131 46.3 1.00 1.00Dominant mode GG+GA 157 76.6 204 72.1 1.965 0.161 1.351 0.887, 2.058 0.194 AA 45 23.4 79 27.9 1.00 1.00Recessive mode GG 111 55.3 111 39.2 11.722 0.001 1.890 1.311, 2.725 0.001 GA+AA 91 44.7 172 60.8 1.00 1.00
Table 5. Armitage trend test for rs2684788 locus of IGF-1R gene in females.
Correlation analysis of the IGF-IR gene and clinical data
The differences in Ht SDS, weight SDS, BMI, IGF-1 SDS, IGF-BP3 SDS, and TH SDS of the GG+GA genotype at loci rs1976667 and rs2684788 in the male ISS group were not statistically significant (P > 0.05) (Table 6 and Table 7).
GG+GA (n) AA (n) N P
Ht SDS -3.15 ± 1.05 (240) -3.11 ± 0.98 (246) -3.13 ± 1.01 (486) 0.714Weight SDS -1.76 ± 1.24 (240) -1.74 ± 1.42 (246) -1.75 ± 1.33 (486) 0.837BMI 15.94 ± 4.13 (240) 15.64 ± 4.39 (246) 15.79 ± 4.26 (486) 0.426IGF-1 SDS -1.58 ± 1.48 (198) -1.53 ± 1.76 (194) -1.55 ± 1.62 (392) 0.731IGF-BP3 SDS -0.72 ± 1.66 (172) -0.79 ± 1.59 (179) -0.72 ± 1.62 (351) 0.928TH SDS -1.57 ± 1.02 (155) -1.61 ± 1.59 (170) -1.59 ± 1.00 (325) 0.750
Table 6. Correlation analysis of (GG+GA) genotype of G dominant mode at rs1976667 locus and clinical parameters in male ISS group.
GG+GA AA N P
Ht SDS -3.12 ± 1.03 (343) -3.08 ± 0.77 (104) -3.11 ± 0.98 (486) 0.745Weight SDS -1.80 ± 1.25 (343) -1.57 ± 1.68 (104) -1.74 ± 1.36 (447) 0.135BMI 15.72 ± 4.02 (343) 15.99 ± 5.32 (104) 15.78 ± 4.35 (447) 0.571IGF-1 SDS -1.54 ± 1.71 (279) -1.59 ± 1.35 (83) -1.55 ± 1.63 (362) 0.834IGF-BP3 SDS -0.70 ± 1.71 (250) -0.68 ± 1.39 (76) -0.69 ± 1.64 (326) 0.950TH SDS -1.63 ± 1.02 (227) -1.55 ± 0.97 (60) -1.61 ± 1.00 (287) 0.589
Table 7. Correlation analysis of (GG+GA) genotype of G dominant mode at rs2684788 locus and clinical parameters in male ISS group.

4776
©FUNPEC-RP www.funpecrp.com.brGenetics and Molecular Research 12 (4): 4768-4779 (2013)
Y. Yang et al.
The differences in Ht SDS, weight SDS, BMI, IGF-1 SDS, IGF-BP3 SDS, and TH SDS of the GG+GA genotype of the G dominant mode at the rs1976667 locus in females were compared. Only the difference in IGF-1 SDS was statistically significant (P = 0.006), which implied that the GG+GA genotype was relevant to the IGF-1 SDS value (Table 8).
GG+GA (n) AA (n) N P
Ht SDS -3.15 ± 1.04 (115) -3.25 ± 1.03 (111) -3.20 ± 1.03 (226) 0.496Weight SDS -1.23 ± 1.65 (115) -1.46 ± 1.26 (111) -1.34 ± 1.76 (226) 0.239BMI 16.00 ± 4.64 (115) 15.40 ± 3.76 (111) 15.71 ± 4.24 (226) 0.291IGF-1 SDS -1.68 ± 1.52 (84) -0.98 ± 1.80 (87) -1.33 ± 1.70 (177) 0.006IGF-BP3 SDS -1.95 ± 1.26 (69) -1.95 ± 1.09 (77) -1.95 ± 1.17 (146) 0.982TH SDS -0.79 ± 0.81 (70) -0.96 ± 1.00 (81) -0.88 ± 0.92 (151) 0.254
Table 8. Correlation analysis of G dominant (GG+GA) genetic mode at rs1976667 locus and clinical parameters in female ISS group.
DISCUSSION
The IGF-1R gene is 315 kb, is located in chromosome 15q26.3, and contains 21 exons and 20 introns (Klammt et al., 2011). The 21 exons of the human IGF-1R gene encode an mRNA of approximately 11,242 bp that includes the 5ꞌ-untranslated region (UTR) and the 3ꞌ-UTR. A total of 4104 nucleotides encode the IGF-1R protein, which consists of 1367 amino acids in the open reading frame of IGF-1R mRNA. IGF-1R belongs to the insulin receptor family, and is a type of transmembrane multi-subunit protein tyrosine kinase receptor that is composed of an α-β isomerous tetramer, and has a high degree of homology with the insulin receptor.
The GH-IGF-1 axis plays an important role in the incidence of ISS, and any level of abnormality of this axis may cause short stature (Huang and Yang, 2011). Several studies, both within China and beyond, have reported associations between polymorphisms of the GHR of the GH-IGF-1 axis with the hereditary susceptibility to ISS and therapeutic efficacy (Lu et al., 2010; Yu et al., 2011). It was not until 1993 that the IGF-1R gene was found to play an impor-tant role in growth and development, which was first discovered through a rat model of IGF/IGF-1R. The first human IGF-1R mutation was discovered during the screening of SGA in Germany and the US in 2003. Many clinical studies have shown that IGF-1R gene mutations were related to short stature (Yu, 2011; Kawashima et al., 2012), such as SGA and intrauterine growth retardation (Klammt et al., 2008). Phenomena such as insensitivity to GH and IGF-1 resistance have been found in ISS patients (Cohen et al., 2010), which suggested that ISS might be related to IGF-1R gene abnormalities. In addition, IGF-1R participates in many more com-plex signal pathways, such as the estrogen signal pathway (Eroles et al., 2012), endochondral bone formation (Duan et al., 2010), and early embryonic development (Bedzhov et al., 2012), which indicates that IGF-1R is closely related to growth and development. However, no study has investigated the relationship between SNPs of the IGF-IR gene in ISS children until now.
Through the analysis of 46 tSNP loci of IGF-1R in 275 ISS children and 379 con-trol individuals at the screening stage, 2 positive tSNP loci were identified, rs1976667 and rs2684788, to be significantly associated with ISS (P = 0.03636 and P = 0.01352, respectively).
Validation analysis targeting the rs1976667 and rs2684788 loci found no statistical sig-nificance in the differences in distribution frequencies of the tSNP alleles, the distribution fre-quencies of genotypes, or case-control associations of genotype in the dominant and recessive

4777
©FUNPEC-RP www.funpecrp.com.brGenetics and Molecular Research 12 (4): 4768-4779 (2013)
IGF-1R gene polymorphisms and idiopathic short stature
model. The gender stratification analysis showed that rs1976667 and rs2684788 of the IGF-1R gene were differently associated with genetic susceptibility to ISS in male and female children.
Genotypes at the rs1976667 locus in males showed different associations with genetic susceptibility to ISS (P = 0.047). Carrying the GG + GA genotype significantly influenced the genetic susceptibility to ISS (P = 0.018), which was most likely a protective factor (0 < OR < 1), and presented a G dominant genetic mode of inheritance. These results indicated that males carrying the GG + GA genotype at the rs1976667 locus were probably less likely to develop ISS. The G allele at rs2684788 in males was also relevant to the genetic susceptibility to ISS (P = 0.016), and was a protective factor of ISS (0 < OR < 1), with a risk of 0.677 times that of the A allele. Carrying the GG + GA genotype was associated with genetic susceptibility to ISS (P < 0.001), appeared to be a protective factor (0 < OR < 1), and presented a G dominant genetic mode, which indicated that males carrying the G allele or the GG + GA genotype at the rs2684788 locus were less likely to develop ISS.
Similarly, genotypes at the rs1976667 locus in females showed different associations to the susceptibility to ISS (P = 0.011). The GG + GA genotype was associated with genetic susceptibility to ISS (P = 0.003), and appeared to be an intermediate risk factor of ISS (1 < OR < 2). Its risk was 1.708 times that of the AA genotype, and it presented a G dominant genetic mode, which indicated that females carrying the GG + GA genotype at the rs1976667 locus were more likely to develop ISS. Genotype differences at the rs2684788 locus in females were also relevant to the genetic susceptibility to ISS (P = 0.05). The G allele was associated with susceptibility to ISS (P = 0.005), and appeared to be an intermediate risk factor of ISS (1 < OR < 2). Its risk was 1.698 times that of the A allele. The GA + AA genotype was associated with genetic susceptibility to ISS (P = 0.001), and also appeared to be an intermediate risk factor of ISS (1 < OR < 2). Its risk was 1.890 times that of the AA genotype, and presented a G recessive genetic mode, which indicated that females carrying the A allele or the GA + AA genotype at the rs2684788 locus were more likely to develop ISS.
The rs1976667 locus is located in the first intron region of the IGF-1R gene, and no studies have investigated the structure and function of the encoded protein at this locus to date. The rs2684788 locus is located in the 3ꞌ-UTR mRNA region of the IGF-1R gene, and is thus likely involved in the regulation of gene expression. The 3ꞌ-UTR mRNA of eukaryotic cells contains important functional elements of mRNA, and plays an essential role in gene expres-sion, regulation, and positioning for mRNA. Disruptions to the regulating function mediated by the 3ꞌ-UTR can cause one or more gene abnormalities. The mutation of a single allele on the 3ꞌ-UTR may lead to the occurrence of diseases. Our study found that the rs1976667 or rs2684788 locus of the IFG-1R gene might be relevant to the genetic susceptibility to ISS in males and females. Currently, there are no studies on the encoded proteins at the rs1976667 or rs2684788 loci, and thus further study on the relationship between structure and function is required to clarify the association of the rs1976667 and rs2684788 loci with genetic suscep-tibility to ISS.
The difference in the IGF-1 SDS was statistically significant between female ISS pa-tients carrying the GG +GA genotype at rs1976667 and those carrying the AA genotype (P = 0.006), which suggested that the GG +GA genotype was likely relevant to IGF-1 SDS. IGF-1 must bind with the IGF-1R of the target issue to play its growth-promoting role; therefore, IGF-1R gene abnormalities can affect IGF-1 levels. Recently, ISS clinical research (Zhang et al., 2008; Yang et al., 2009; Bedzhov et al., 2012) indicated that the IGF-1 level of ISS children was

4778
©FUNPEC-RP www.funpecrp.com.brGenetics and Molecular Research 12 (4): 4768-4779 (2013)
Y. Yang et al.
lower than that of normal children. Furthermore, the IGF-1 level correspondingly increased af-ter receiving GH treatment, which implied that the treatment was effective. Therefore, IGF-1 is often used to evaluate the therapeutic effect of GH on ISS in clinical practice. Our study showed that the GG +GA genotype at rs1976667 in female ISS patients was significantly related to IGF-1 SDS, which suggested that different genotypes of the IGF-1R gene at rs1976667 likely influ-ences the IGF-1 level of female ISS children. The rs19766667 locus of the IGF-1R gene might be involved in an important process linking the pathway of IGF-1 combined with IGF-1R, thus affecting the IGF-1 level of ISS children, and leading to the ISS occurrence. Therefore, further research investigating how rs1976667 is involved in the structure and function of the encoded protein is needed. On the other hand, if IGF-1 levels of female ISS children whose IGF-1 levels are low do not increase correspondingly after GH therapy, it needs to consider whether there is poor treatment effect caused by genetic susceptibility of IGF-1R gene.
REFERENCES
Backeljauw P, Bang P, Dunger DB, Juul A, et al. (2010). Insulin-like growth factor-I in growth and metabolism. J. Pediatr. Endocrinol. Metab. 23: 3-16.
Bedzhov I, Liszewska E, Kanzler B and Stemmler MP (2012). Igf1r signaling is indispensable for preimplantation development and is activated via a novel function of E-cadherin. PLoS Genet. 8: e1002609.
Cohen P, Rogol AD, Deal CL, Saenger P, et al. (2008). Consensus statement on the diagnosis and treatment of children with idiopathic short stature: a summary of the Growth Hormone Research Society, the Lawson Wilkins Pediatric Endocrine Society, and the European Society for Paediatric Endocrinology Workshop. J. Clin. Endocrinol. Metab. 93: 4210-4217.
Cohen P, Germak J, Rogol AD, Weng W, et al. (2010). Variable degree of growth hormone (GH) and insulin-like growth factor (IGF) sensitivity in children with idiopathic short stature compared with GH-deficient patients: evidence from an IGF-based dosing study of short children. J. Clin. Endocrinol. Metab. 95: 2089-2098.
Duan C, Ren H and Gao S (2010). Insulin-like growth factors (IGFs), IGF receptors, and IGF-binding proteins: roles in skeletal muscle growth and differentiation. Gen. Comp Endocrinol. 167: 344-351.
Eroles P, Bosch A, Perez-Fidalgo JA and Lluch A (2012). Molecular biology in breast cancer: intrinsic subtypes and signaling pathways. Cancer Treat. Rev. 38: 698-707.
Huang H and Yang Y (2011). Progress on research of association of insulin-like growth factor-1 receptor gene with idiopathic short stature. J. Appl. Clin. Pedatrics 26: 1602-1604.
Kawashima Y, Takahashi S and Kanzaki S (2012). Familial short stature with IGF-I receptor gene anomaly. Endocr. J. 59: 179-185.
Klammt J, Pfaffle R, Werner H and Kiess W (2008). IGF signaling defects as causes of growth failure and IUGR. Trends Endocrinol. Metab. 19: 197-205.
Klammt J, Kiess W and Pfaffle R (2011). IGF1R mutations as cause of SGA. Best. Pract. Res. Clin. Endocrinol. Metab. 25: 191-206.
Li H, Ji CY, Zong XN and Zhang YQ (2009). Height and weight standardized growth charts for Chinese children and adolescents aged 0 to 18 years. Zhonghua Er. Ke. Za Zhi 47: 487-492.
Lu WL, Wang W, Wang DF, Xiao Y, et al. (2010). Relationship between the polymorphism of growth hormone receptor Ex3 and the efficacy of rhGH treatment in children with idiopathic short stature. Zhongguo Dang. Dai Er. Ke. Za Zhi 12: 730-733.
Rosenbloom AL (2009). Idiopathic short stature: conundrums of definition and treatment. Int. J. Pediatr. Endocrinol. 2009: 470378.
Savage MO, Burren CP and Rosenfeld RG (2010). The continuum of growth hormone-IGF-I axis defects causing short stature: diagnostic and therapeutic challenges. Clin. Endocrinol. 72: 721-728.
Tanner JM, Goldstein H and Whitehouse RH (1970). Standards for children’s height at ages 2-9 years allowing for heights of parents. Arch. Dis. Child. 45: 755-762.
Wit JM, Clayton PE, Rogol AD, Savage MO, et al. (2008). Idiopathic short stature: definition, epidemiology, and diagnostic evaluation. Growth Horm. IGF. Res. 18: 89-110.
Wit JM, Kiess W and Mullis P (2011). Genetic evaluation of short stature. Best. Pract. Res. Clin. Endocrinol. Metab. 25:

4779
©FUNPEC-RP www.funpecrp.com.brGenetics and Molecular Research 12 (4): 4768-4779 (2013)
IGF-1R gene polymorphisms and idiopathic short stature
1-17.Xu SS, Gu XF and Pan H (2013). Reference values for serum IGF-1 and IGFBP-3 in children and adolescents. J. Clinical.
Pediatrics 2009: 1105-1110. Yang HY, Wang MY and Dong JH (2009). Levels of IGF-1 and bone metabolic markers and their correlation analysis in
idiopathic short stature children before puberty. Chin. J. Child Health Care 17: 528-532.Yu BS (2011). Molecular basis and diagnosis and treatment of idiopathic short stature. J. Appl. Clin. Pediatrics 26: 632-
636.Yu Y, Wang W, Wang Y, Huang W, et al. (2011). Associations of single nucleotide polymorphisms of growth hormone
receptor with susceptibility to idiopathic short stature. J. Shanghai Jiaotong Univ. Med. Sci. 31: 932-936.Zhang XX, Yi ZW, Wang XY, He XJ, et al. (2008). Disorder of the growth hormone/insulin-like growth factors axis in
children with idiopathic short stature. Chin. J. Practical Pediatrics 23: 290-292.


![Expansion of the Receptor-Like Kinase/Pelle Gene Family · Expansion of the Receptor-Like Kinase/Pelle Gene Family and Receptor-Like Proteins in Arabidopsis1[w] Shin-Han Shiu and](https://img.dokumen.tips/doc/110x75/6062fe504860f365ba0e2c31/expansion-of-the-receptor-like-kinasepelle-gene-expansion-of-the-receptor-like.jpg)