Embed Size (px)
Citation preview
RESEARCH ARTICLE Open Access
Association of Drug Burden Index with gripstrength, timed up and go and Barthelindex activities of daily living in olderadults with intellectual disabilities: anobservational cross-sectional studyJuliette O’Connell1* , Martin C. Henman2, Éilish Burke3, Clare Donegan1, Philip McCallion4, Mary McCarron5 andMáire O’Dwyer2
Abstract
Background: Drug Burden Index (DBI), a measure of exposure to medications with anticholinergic and sedativeactivity, has been associated with poorer physical function in older adults in the general population. Whileextensive study has been conducted on associations between DBI and physical function in older adults in thegeneral population, little is known about associations in older adults with intellectual disabilities (ID). This is the firststudy which aims to examine the association between DBI score and its two sub-scores, anticholinergic andsedative burden, with two objective measures of physical performance, grip strength and timed up and go, and ameasure of dependency, Barthel Index activities of daily living, in older adults with ID.
Methods: Data from Wave 2 (2013/2014) of the Intellectual Disability Supplement to the Irish Longitudinal Studyon Ageing (IDS-TILDA) was analysed. Analysis of Covariance (ANCOVA) was used to detect associations andproduce adjusted means for the physical function and dependency measures with respect to categorical DBI scoresand the anticholinergic and sedative sub-scores (DBA and DBS).
Results: After adjusting for confounders (age, level of ID, history of falls, comorbidities and number of non-DBImedications, Down syndrome (grip strength only) and gender (timed up and go and Barthel Index)), neither gripstrength nor timed up and go were significantly associated with DBI, DBA or DBS score > 0 (p > 0.05). Higherdependency in Barthel Index was associated with DBS exposure (p < 0.001).
Conclusions: DBI, DBA or DBS scores were not significantly associated with grip strength or timed up and go. Thiscould be as a result of established limitations in physical function in this cohort, long-term exposure to these typesof medications or lifelong sedentary lifestyles. Higher dependency in Barthel Index activities of daily living wasassociated with sedative drug burden, which is an area which can be examined further for review.
Keywords: Ageing, Intellectual disability, Drug burden index, Anticholinergic, Sedative, Medication, Physicalfunction, Grip strength, Timed up and go, Barthel index
© The Author(s). 2019 Open Access This article is distributed under the terms of the Creative Commons Attribution 4.0International License (http://creativecommons.org/licenses/by/4.0/), which permits unrestricted use, distribution, andreproduction in any medium, provided you give appropriate credit to the original author(s) and the source, provide a link tothe Creative Commons license, and indicate if changes were made. The Creative Commons Public Domain Dedication waiver(http://creativecommons.org/publicdomain/zero/1.0/) applies to the data made available in this article, unless otherwise stated.
* Correspondence: [email protected] of Pharmacy and Pharmaceutical Sciences and IDS-TILDA, School ofNursing and Midwifery, Trinity College, Dublin, IrelandFull list of author information is available at the end of the article
O’Connell et al. BMC Geriatrics (2019) 19:173 https://doi.org/10.1186/s12877-019-1190-3
BackgroundIntellectual disability (ID) is a neurodevelopmental dis-order which manifests early in life and is characterisedby impairments of general mental abilities that affectadaptive functioning [1]. Historically, people with ID hadgreatly reduced life expectancy compared to those with-out ID [2]; however, in recent years the life expectancyamong this group has increased and people with ID areliving into middle and old age [2, 3]. This success is de-rived from numerous factors, including better access tomedical intervention and improved health status [4].However, people with ID still experience prematuremortality. The Confidential Inquiry into prematuredeaths of people with ID, commissioned by the Depart-ment of Health in England, identified that there was ahigher probability of preventable deaths of people withID, owing to untreated health problems and deficienciesin healthcare provision for this population [5]. Age-related changes tend to occur earlier in the lives ofpeople with ID, including those with Down syndrome,cerebral palsy, Cornelia de Lange syndrome, Prader-Willi syndrome and fragile X syndrome [2]. These age-related changes can include early menopause (Downsyndrome; fragile X syndrome), Alzheimer’s disease(Down syndrome), degenerative arthritis and faster mus-culoskeletal system ageing (cerebral palsy) and early de-velopment of osteoporosis and premature greying of hair(Cornelia de Lange syndrome) [2, 6].It has been reported that seven out of ten adults with
ID over 40 years old experience multimorbidity, withmental illness, neurological disease, gastrointestinal dis-ease and eye disease among the most prevalent condi-tions [7]. Higher rates of cardiac abnormalities,musculoskeletal disorders, hypothyroidism, early meno-pause, epilepsy, dementia and hearing and visual impair-ments are observed in adults with ID as they agecompared to the general population [8]. Older adultswith ID face different challenges as compared to olderadults without ID. The trend of deinstitutionalisation foradults with ID, while important to enabling better qual-ity of life and social connectedness, may also result inreduced access to services required to meet the needs ofadults ageing with an ID. Health practitioners in primarycare may fail to identify special and unique problems ex-perienced by people with ID who are ageing [8]. Whilepeople with ID may typically be treated by the sameGeneral Practitioner (GP) throughout their lifetime, ithas been well-documented that disparities in healthcareexist [5, 9, 10]. As a result of multiple morbidities andthe higher prevalence of certain medical conditions inthis population, including epilepsy and mental healthconditions [7, 11], which frequently require accessingmore specialist services such as neurology andpsychiatry, problems with coordination of care and
information sharing are relatively common for peoplewith ID as they may access primary care for some treat-ments and secondary care for others [5, 9], and havebeen identified as factors which contribute to prematuredeath [5]. Other issues around care of people with IDsuch as difficulty communicating, diagnostic oversha-dowing and atypical presentation of certain illnesses canmake diagnosis and treatment of health conditions inthis population more difficult and as a result lead to dis-parities in healthcare [9, 10].In the absence of appropriate alternative interventions,
older adults with ID may have increased risk of experi-ence of high levels of exposure to multiple medicines,including those with anticholinergic and sedative effects[12, 13]. Older adults with ID are more likely to receivemedications with anticholinergic properties, intermedi-ate and long-acting benzodiazepines and antipsychoticsthan older adults in the general population [14]. Across-sectional study of ageing in people with ID inIreland identified 70.9% were exposed to medicationswith anticholinergic effects as measured by the Anti-cholinergic Cognitive Burden Scale (ACB) [12]. Anti-cholinergic and sedative burden as measured by theDrug Burden Index (DBI) has been found to be higheramong older people with ID than those without ID –78.6% of older adults with ID were regularly exposed tomedications with anticholinergic and sedative effects[15], compared to 28–49% among older adults withoutID, depending on study setting and population [16–32].These types of medications have well-documented ad-verse effects on older adults in the general population,such as falls, frailty, fracture liability, and physical andcognitive impairment [33–41] and, as a result, studyinganticholinergic and sedative medication use in olderadults with ID was identified as an area of researchinterest. Studies of the adverse effects of these types ofmedication on older adults with ID are limited, thoughexisting research has found that use of anticholinergicmedications in older adults with ID is associated withdaytime drowsiness and chronic constipation [12].The DBI has been developed as a tool to measure the
total exposure of an individual to medications with anti-cholinergic and sedative activity [21]. The DBI is a dose-related measure which assesses quantitatively the burdenan individual is exposed to from medications with theseeffects. The inventory of medications is typically selectedby literature review and medication analysis to assignmedications as having anticholinergic and/or sedative ef-fects [15]. The total daily dose of each medication withanticholinergic/sedative activity that a person is exposedto is examined with respect to the minimum effectivedaily dose for that medication. The minimum effectivedaily dose is selected in order to approximate the DR50,or dose required achieve 50% of maximal contributory
O’Connell et al. BMC Geriatrics (2019) 19:173 Page 2 of 21

effect at steady state [42]. An individual exposed to theminimum effective daily dose of a DBI medication willbe assigned a score of 0.5 for that medication. This cal-culation is performed for each relevant medication, andscores are summed to give a cumulative DBI score forthe individual. Existing literature uses a common cat-egorisation of scores: DBI score 0 (no DBI exposure),DBI score 0 > 1 (low) and DBI score ≥ 1 (high). [16, 17,19–23, 31, 43, 44]. It has been internationally validatedand has been associated with impairment of physicalfunction in older people without ID, including poorerperformance in measures such as walking speed, bal-ance, grip strength, timed up and go (TUG) and theShort Physical Performance Battery [18–20, 45]. DBI hasalso been found to be associated with a greater risk oftransitioning from the robust state to the pre-frail statein community-dwelling men aged 70 and older [46]. DBIhas recently been analysed in older adults with ID, andit has been found that DBI scores are much higher inthis population than those reported in older adults with-out ID, with 54% older adults with ID having a high DBIscore (≥1) compared to between 5 and 29% of olderadults without ID [15]. In particular, exposure to medi-cations with anticholinergic effects is much more fre-quent in older adults with ID [12, 15]. In addition, highDBI score has been found to be significantly associatedwith increased dependency in Barthel Index (BI) activ-ities of daily living in older adults with ID [15].Physical performance is an important marker of func-
tional independence in older adults [45]. Physical fitnessmeasurements have only in recent years been assessedin older adults with ID. Hilgenkamp et al. [47, 48] haveexamined the feasibility and reliability of physical func-tion measures in this group and concluded that gripstrength is an appropriate method of measuring functionin this group. Enkelaar et al. (2013) [49] have identifiedthat TUG is a feasible method of assessing balance andgait capacities in older adults with ID.The association between performance in physical func-
tion measures and DBI has been examined in a numberof studies of older adults without ID. However, there is alack of research in the area of the association of drugburden on physical function in older adults with ID. Toour knowledge, this is the first study to examine physicalfunction measurements in relation to DBI in older adultswith ID.
AimThe aim of this study is to examine the association be-tween Drug Burden Index and performance in two phys-ical function measures, grip strength and TUG, and ameasure of dependency, Barthel Index, in a cohort ofolder adults with ID at a cross-sectional level to establishif similar exposure in people with ID leads to the same
functional effects as has been reported in the generalpopulation.More specifically, the objectives were to identify asso-
ciations and adjusted means for:
a. Grip strengthb. Timed up and goc. Barthel Index
with respect to exposure to DBI medications, DBI medi-cations with anticholinergic activity (DBA) and DBImedications with sedative activity (DBS) and three-level,dose-related categorical DBI, DBA and DBS scores.
MethodsDesignData for this study was obtained from older adults withID enrolled in Wave 2 (2013/2014) of the IntellectualDisability Supplement to the Irish Longitudinal Study onAgeing (IDS-TILDA), an observational, cross-sectionalstudy, and has been described in detail elsewhere [15].IDS-TILDA is a large scale, nationally representativelongitudinal study which examines the ageing of peoplewith ID [50, 51].
ParticipantsThe sampling frame for Wave 1 of this study was theNational Intellectual Disability Database (NIDD). NIDDcollects information to define the specific health servicesin use or required by people with ID in the Republic ofIreland. Staff at NIDD randomly selected 1800 personalidentification numbers (PINs) and an invitation packwith a consent form was sent to each potential partici-pant. Participants signed written informed consent inde-pendently or, if this was not possible, a family member/guardian signed a letter of agreement for their familymember to participate. At Wave 1 of the study (2010/2011), 753 people aged ≥40 years participated. Partici-pants were aged 40 years or older to account for the re-duced life expectancy and presentation of older ageconditions, e.g. dementia, at a younger age in peoplewith ID [2]. Ethical approval for the study was grantedby the Faculty of Health Sciences Research Ethics Com-mittee in Trinity College Dublin. In addition, local and/or regional ethical committee approval was granted fromeach service provider (n = 138).All living Wave 1 participants (n = 719) were invited
to participate in Wave 2. The study population withavailable medication data was 677 (95.6%) (Fig. 1).Data was gathered by three means.
� Firstly, participants were provided with a pre-interview questionnaire (PIQ) 1 week in advance ofthe face-to-face interview. The PIQ captured data in
O’Connell et al. BMC Geriatrics (2019) 19:173 Page 3 of 21

a number of areas, including physical health andmedication data. In the majority of cases (92.8%;n = 628), the PIQ was completed by proxy (a keyworker or family member known to participants forat least 6 months). It was provided in advance of theinterview in order to allow adequate time for com-pletion, which involved accessing medical records.
� Secondly, a computer assisted personal interview(CAPI) was used by field researchers in the face-to-face interview with participants. Three differentinterview techniques were employed to facilitate theneeds of participants – (1) participants completedinterview independently, (2) participants completedinterview with assistance from a proxy or (3) inter-view with a proxy only on behalf of the participant.
The PIQ and CAPI for Wave 2 of IDS-TILDA areavailable online [52].
� Thirdly, a registered nurse in intellectual disability(RNID) carried out a health assessment whichincluded the objective measures of physical function– grip strength and timed up and go (TUG). Inaddition, body mass index (BMI) and Lunar AchillesGE Quantitative Ultrasound (QUS) were assessed inorder to collect data on overweight/obesity andosteoporosis/osteopenia [50]. Adaptable andaccessible materials and methods were developed toassist participants who partook in the healthassessment. This component has been described indetail elsewhere, for further details see Burke et al.,2014, 2016a & 2016b [50, 53, 54].
Fig. 1 Flow Chart for IDS-TILDA
O’Connell et al. BMC Geriatrics (2019) 19:173 Page 4 of 21

Figure 1 displays the flow chart of the study.The STROBE (Strengthening the Reporting of Obser-
vational Studies in Epidemiology) reporting guidelinesfor cross-sectional studies were used [55, 56].
Drug burden indexMedication data was collected by asking participants/proxies to complete the medication section of the Pre-Interview Questionnaire (PIQ). Participants/proxies wereasked “Can you tell me what medications (including pre-scribed or over the counter (OTC)) and supplementsyou take on a regular basis (like every day or everyweek)?”Medication data was recorded by brand name/Inter-
national Non-Proprietary Name (INN), dose, frequency,route of administration and date on which medicine wasinitiated in the PIQ.The Anatomical Therapeutic Chemical Classification
System (ATC) was used to code medications and datawas verified by two pharmacists. Medications whichwere topical, inhaled, “as required” or recorded for usewhich was not regular (eg pre-dental/medical proce-dures; acute seizure control) were excluded from ana-lysis. The only exception was atropine eye drops (ATCcode S01FA01), which are considered to have clinicallysignificant systemic effects [57]. Prochlorperazine wasrecoded from ATC code N05AB04 (Antipsychotics) toA04A (Antiemetics and Antinauseants) as the dosagesreported in the IDS-TILDA population fell within thedosage range used for treatment of Meniere’s syndrome,nausea and vomiting (10 – 40mg daily) as opposed toschizophrenia and other psychotic disorders (75 – 100mg daily) [58].The DBI score for each participant was calculated
using the following formula:
Drug Burden Index ¼X D
δ þ D
where D is the daily dose and δ is the Minimum DailyDose (MDD). The MDD is used as an estimate for theDR50, the daily dose to achieve 50% of the maximum ofanticholinergic and/or sedative effect. Medications wereidentified as having clinically significant anticholinergicand/or sedative effects by referring to relevant studies[12, 21, 34, 43, 59] and the Irish medicinal product lit-erature (Summary of Product Characteristics, SmPC),available from the Health Products Regulatory Authority(HPRA) [60] Medications with both anticholinergic andsedative effects were classified primarily as anticholiner-gic as per previous studies. MDDs were identified as thelowest effective daily dose listed in the Irish medicinalproduct licenses from the HPRA [60]. This medication
inventory and the DBI tool for this cohort has been de-scribed in more detail elsewhere [15].
Physical function measuresTwo measures of physical function were completed: gripstrength and TUG. Grip strength is a measure of maximumvoluntary force of the hand [61] and has been found to be avalid and reliable instrument for measuring hand strength[62]. Three pre-assessment skills processes were conductedby an RNID. Initially the person was asked to sign theirconsent and the researcher noted the hand used for signing.Then the person was asked which was their dominant hand(strongest or which one they used for doing most things).Dominance may be a challenging concept for people withID to determine. If there remained a difficulty the re-searcher got the participant to squeeze two of her fingerson each hand and noted which side appeared stronger. Gripstrength was measured using a Jamar Hydraulic Dynamom-eter (two measurements on each hand), a valid and reliableinstrument for measuring hand strength [63]. Grip strengthis reported as a continuous variable (in kg) and as a cat-egorical variable, stratified by age and gender according tothe manufacturer’s instructions [53]. Four grip strengthreadings were obtained, two from the right hand and twofrom the left, and all results were recorded. The gripstrength measure was demonstrated by the RNID prior tothe participant’s measurement. The participant was encour-aged to squeeze as hard as they could for as long as theycould or until the needle stopped rising. Once the needlestopped rising the participant was instructed to stopsqueezing. Grip strength was measured with participant sit-ting, with forearms flat on the arms of a chair, feet flat onthe ground, as per the protocol used for grip strength as-sessment (Roberts et al., 2011 [64]).TUG was used as a means of assessing the proximal
muscle strength, balance and executive function of par-ticipants [65]. A standard chair was placed against a wallto provide secure support. This chair measured 45 cmfrom the floor to the top of the armrest. A tape measurewas used to measure a distance three meters from thechair and high visibility tape was used to mark thispoint. Participants were instructed to get up from a sit-ting position in the chair, walk to the marked point, turnaround, walk back to the chair and sit down. The pro-cedure was timed and recorded in seconds with a Secastopwatch [53].After assessing the safety of performing the TUG as-
sessment and obtaining verbal consent, the RNID gavethe following verbal directions to the participant:
“I am going to do a walking test. I will get you to sitin this chair with your back resting against the back ofthe chair. On the word GO you should stand up walkto the line on the floor, turn around, walk back to the
O’Connell et al. BMC Geriatrics (2019) 19:173 Page 5 of 21

chair and sit down. Please walk at your regular pace.Is that OK? Do you have any questions? I willdemonstrate this now”.
After addressing any relevant questions or concerns, theRNID demonstrated performance of the test. If theRNID had concerns that the respondent did not fullyunderstand the instructions, they allowed them to do apractice prior to the timed test.Following this, the RNID gave this direction:
“I will now get you to do that. Do you have anyquestions before we begin? I am going to time you. Youshould walk at your usual pace. Are you ready? ‘Go’”
This procedure was consistent with that which wasemployed by Salb et al. (2015) for TUG, whereby partici-pants were given a demonstration of the test by the in-vestigator, offered a trial, invited to “walk in acomfortable and safe (e.g. unrushed) speed” and beginthe test on the rater’s command “and go” [66].Prior to assessment, participants were offered the op-
portunity to practice for the grip strength measurementby squeezing a rubber ball and were offered a practicerun of the TUG.
Barthel indexThe Barthel Index measures the level of dependence ofan individual in ten instrumental activities of daily living(mobility, using stairs, dressing, bathing, grooming, feed-ing, transfer, toileting and bladder and bowel contin-ence). It consists of an ordinal scale with range 0–20[67, 68]. A modified form of BI activities of daily livingwas created for this population (Additional file 1). Lowerscores indicated poorer physical function.As per a previous study, participants with two or more
missing values were excluded from the Barthel Indexevaluation (n = 42) [15, 46].
Representativeness of samplePearson chi-square tests were used to identify bias inparticipation in the health assessment. Univariate ana-lysis was used to compare participants (n = 437 for gripstrength; n = 468 for TUG) with the total populationwith medication data available (n = 677) on demograph-ics (gender (male/female), age range (44–49 years; 50–64 years; 65+ years), level of ID (mild; moderate; severeand profound), type of residence (independent; commu-nity group home; residential care), Down syndrome (yes/no), physical activity level (low; moderate; high) and ex-posure to medications). This reflected the method usedin a previous study of physical fitness measures in adultswith ID [69].
CovariatesDemographic variables: Gender (male/female), age range(44–49 years; 50–64 years; 65+ years), level of ID (mild;moderate; severe/profound) and type of residence (inde-pendent; community group home; residential care) wereincluded as covariates.Level of ID is based on reported intelligence quotient
(IQ) scores as follows; mild (50–55 to approx. 70), mod-erate (35–40 to 50–55) and severe/profound (below 35–40) [1]. Participant case notes were used to identify cor-rect classification. Those with unverified level of ID (n =53) were excluded from analysis.Community group homes were defined as homes with
small groups of people with ID (< 10), based in a com-munity setting with staff support. Residential settingswere defined where ten or more people share a singleliving unit or where the living arrangements are campusbased. Physical activity level: Participants/proxies wereasked how many days they had been involved in physicalactivity in the previous week. The answers were classi-fied into the three categories (low, moderate and high)based on the International Physical Activity Question-naire (IPAQ) [70]. Low physical activity was defined asno reported activity or some reported activity but notenough to meet moderate or high physical activity cri-teria as measured by the IPAQ [70, 71].Moderate activity was defined as either of the follow-
ing 3 criteria:
a. 3 or more days of vigorous activity of at least 20min per day or
b. 5 or more days of moderate-intensity activity and/or walking of at least 30 min per day or
c. 5 or more days of any combination of walking,moderate-intensity or vigorous intensity activitiesachieving a minimum of at least 600 metabolicequivalent (MET) minutes per week.
High activity was defined as either of the following 2criteria:
a. Vigorous-intensity activity on at least 3 days andaccumulating at least 1500 MET-minutes per weekor
b. 7 or more days of any combination of walking,moderate or vigorous intensity activitiesaccumulating at least 3000 MET-minutes/week.
This measure of physical activity captures both work-related and leisure time physical activity.
History of fallsParticipants/proxies were asked “in the past year haveyou had any fall including a slip or trip in which you lost
O’Connell et al. BMC Geriatrics (2019) 19:173 Page 6 of 21
your balance and landed on the floor or ground or lowerlevel?” to which they answered “yes”, “no” or “don’tknow”. Those who answered “don’t know” were ex-cluded from the analyses (n = 10). Answering “yes” tothis question was considered a history of falls in the pre-vious 12 months. The measure of history of falls wasself-reported.
Functional comorbidity indexA modified version of the Functional Comorbidity Index(FCI) was utilised to adjust for comorbidities in the ana-lyses (Additional file 2). The FCI was calculated by sum-ming the presence of a reported doctor’s diagnosis of thefollowing conditions: arthritis; osteoporosis/osteopenia;asthma; lung disease; angina; congestive heart failure (orheart disease); myocardial infarction; neurological dis-ease; stroke or transient ischaemic attack; diabetes melli-tus type I or II; upper gastrointestinal disease (e.g. ulcer,hernia, reflux); depression (unipolar or bipolar); anxietyor panic disorder; visual impairment (e.g., cataracts,glaucoma, macular degeneration); hearing impairment;and overweight/obese to produce a continuous score be-tween 0 and 16. Data on osteoporosis/osteopenia andoverweight/obese were also supplemented with objectivedata from the health assessment. Previously, a numberof DBI studies have used modified versions of the FCI.Where participants were missing data on two or moreconditions (n = 145), they were excluded from the FCIscore evaluation, reflecting the method used previously[18, 20–22, 28, 45, 46].
Statistical analysisCalculation of DBI scores was performed using Micro-soft Excel 2010 (Microsoft Corporation). Statistical ana-lyses were performed using Statistical Package for SocialSciences (SPSS) version 21.0 (IBM Corporation). Statis-tical significance was set at p < 0.05.The characteristics of the study population were de-
scribed using descriptive analyses (percentages and 95%confidence intervals (CI’s). Medians and interquartilerange (IQR) are reported as the data was not normallydistributed.
Rationale for selection of analysis of covariance(ANCOVA)Techniques for statistical inference can fail in one of twoways: they can incorrectly reject the null hypothesis ofno difference between groups (Type I error) or incor-rectly fail to reject the null hypothesis of no differencebetween groups (Type II error) [72]. It has been shownthat F-tests (including ANCOVA) are robust to viola-tions of normality in terms of Type I error, considering awide variety of distributions commonly found in thehealth and social sciences [73]. Concern over the relative
advantages of parametric and non-parametric methods,as a result, has focused on Type II error [72]. The resultsof comprehensive analysis by Olejnik and Algina (1984)[74] indicated that the parametric analysis of covariancewas robust to violations of either the conditional nor-mality or homoscedasticity assumption. In situationswhere both assumptions were violated, however, and thecovariate has a non-normal distribution, the parametricANCOVA exhibited a slight tendency to lead to a con-servative test of the hypothesis when the sample sizewas small and the nominal level of significance was 0.05[74]. Much of the literature around use of ANCOVA fornon-normal data has focused on baseline and post-exposure data and change scores in randomised studies,as ANCOVA is frequently employed under these cir-cumstances. In these circumstances, ANCOVA has beenfound to outperform non-parametric methods such asMann-Whitney for most types of distribution [72].While Mann-Whitney has been found to outperformANCOVA in cases of extreme skew in a biomarkerstudy, ANCOVA has still been suggested as the pre-ferred method of analysis for other distributions [72].ANCOVA also produces a mean score which is moreclinically meaningful and interpretable than the mediansproduced by Mann-Whitney [72]. In addition, semi-parametric and non-parametric alternatives toANCOVA, such as rank-transform ANCOVA andQuade’s test would not be appropriate for the data inthis study as the dependent variable is continuous.In addition, a key driver behind the choice of
ANCOVA for this analysis was its prior use in severalstudies of the association between physical performanceand DBI score [19–21, 45]. This method of analysis hasbeen the accepted procedure for this data previously[19–21, 45], and in order to produce a comparable studyit was selected for use in the current analysis, while stillgiving due consideration to the statistical assumptions ofANCOVA.
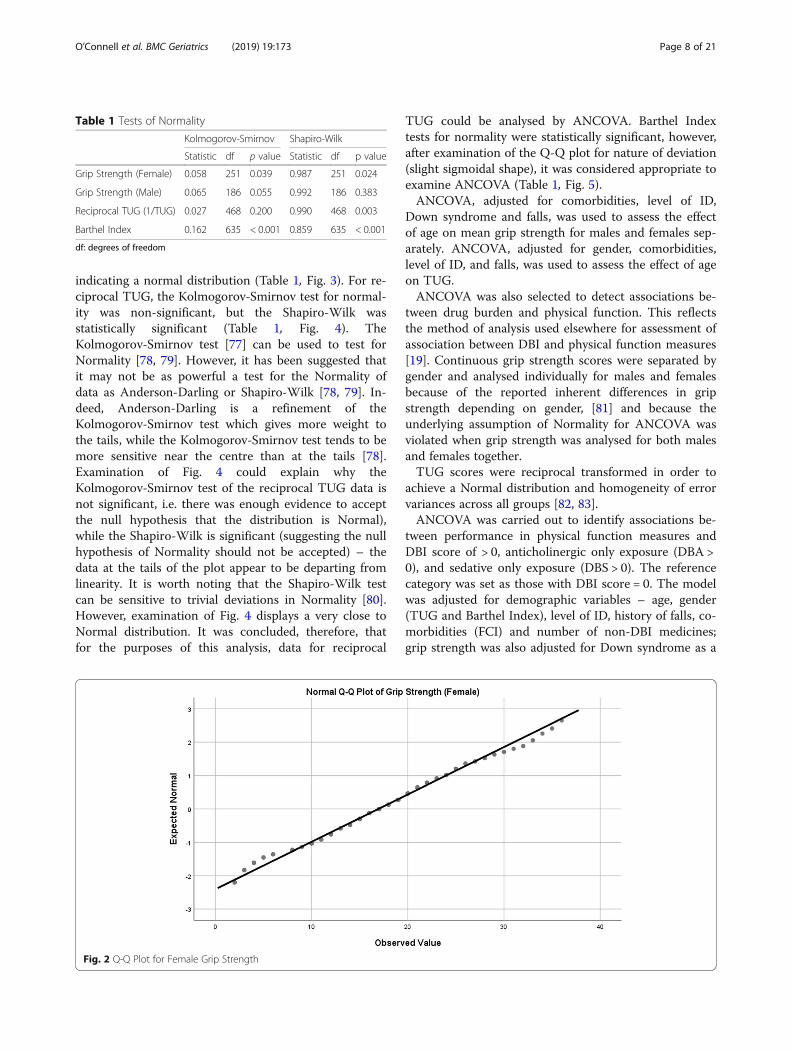
Tests of normalityObserved data is very rarely normally distributed inhealth science research [75, 76]. This does not invalidatethe use of ANCOVA. Tests for normality were per-formed on the three dependent variables – grip strength(separated by gender), reciprocal TUG and Barthel Index(Table 1).In addition, normal Q-Q plots were produced in order
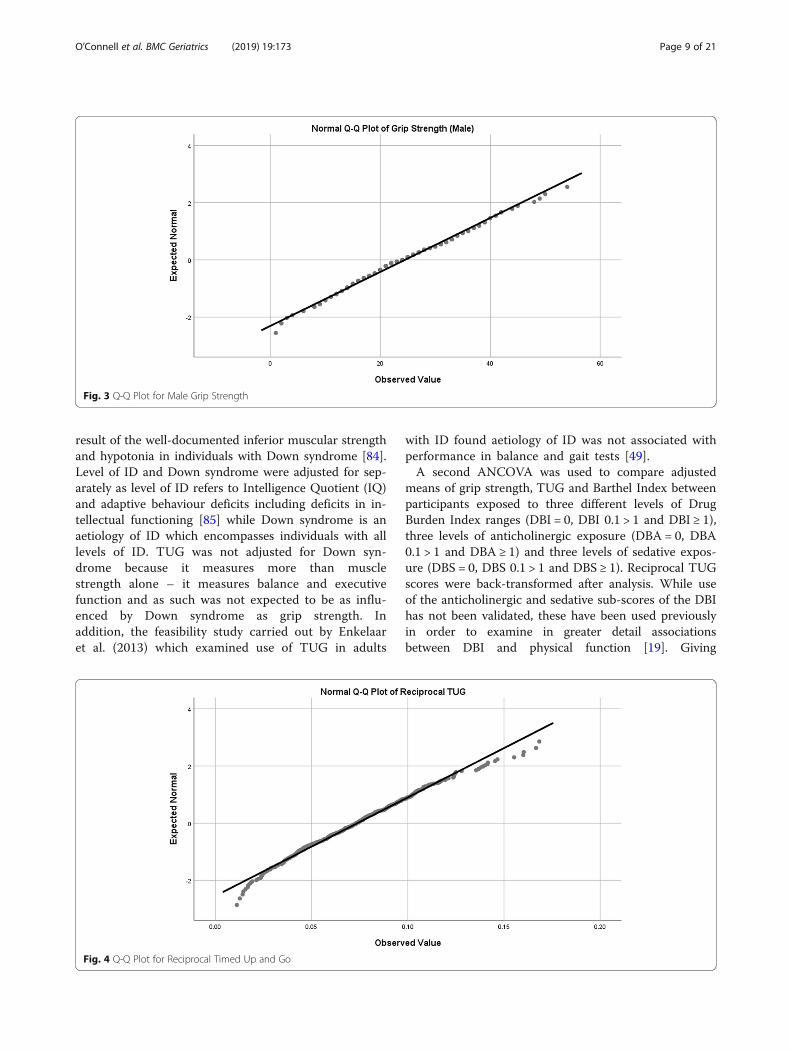
to visually assess departures from normality. Female gripstrength, while statistically significant on statistical nor-mality tests, showed only slight deviation in the Q-Qplot, so were considered to be appropriate for analysiswith ANCOVA (Table 1, Fig. 2). In the case of male gripstrength, both tests used for normality (Kolmogorov-Smirnov and Shapiro-Wilk) were non-significant,
O’Connell et al. BMC Geriatrics (2019) 19:173 Page 7 of 21
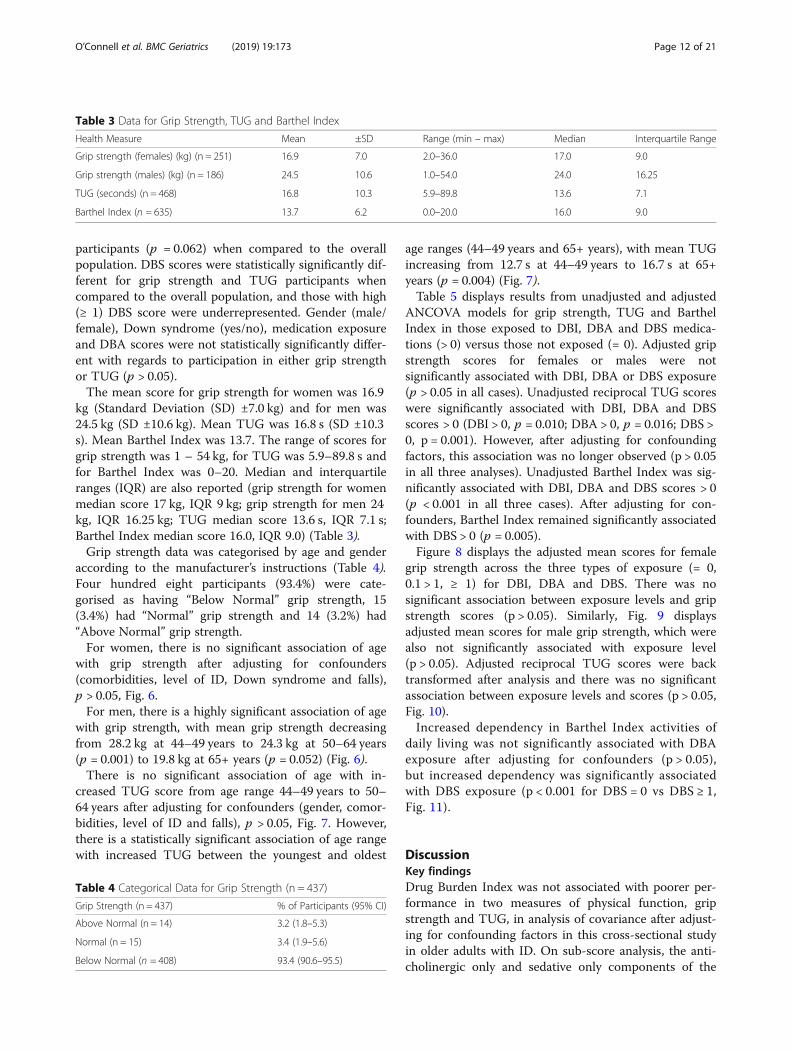
indicating a normal distribution (Table 1, Fig. 3). For re-ciprocal TUG, the Kolmogorov-Smirnov test for normal-ity was non-significant, but the Shapiro-Wilk wasstatistically significant (Table 1, Fig. 4). TheKolmogorov-Smirnov test [77] can be used to test forNormality [78, 79]. However, it has been suggested thatit may not be as powerful a test for the Normality ofdata as Anderson-Darling or Shapiro-Wilk [78, 79]. In-deed, Anderson-Darling is a refinement of theKolmogorov-Smirnov test which gives more weight tothe tails, while the Kolmogorov-Smirnov test tends to bemore sensitive near the centre than at the tails [78].Examination of Fig. 4 could explain why theKolmogorov-Smirnov test of the reciprocal TUG data isnot significant, i.e. there was enough evidence to acceptthe null hypothesis that the distribution is Normal),while the Shapiro-Wilk is significant (suggesting the nullhypothesis of Normality should not be accepted) – thedata at the tails of the plot appear to be departing fromlinearity. It is worth noting that the Shapiro-Wilk testcan be sensitive to trivial deviations in Normality [80].However, examination of Fig. 4 displays a very close toNormal distribution. It was concluded, therefore, thatfor the purposes of this analysis, data for reciprocal
TUG could be analysed by ANCOVA. Barthel Indextests for normality were statistically significant, however,after examination of the Q-Q plot for nature of deviation(slight sigmoidal shape), it was considered appropriate toexamine ANCOVA (Table 1, Fig. 5).ANCOVA, adjusted for comorbidities, level of ID,
Down syndrome and falls, was used to assess the effectof age on mean grip strength for males and females sep-arately. ANCOVA, adjusted for gender, comorbidities,level of ID, and falls, was used to assess the effect of ageon TUG.ANCOVA was also selected to detect associations be-
tween drug burden and physical function. This reflectsthe method of analysis used elsewhere for assessment ofassociation between DBI and physical function measures[19]. Continuous grip strength scores were separated bygender and analysed individually for males and femalesbecause of the reported inherent differences in gripstrength depending on gender, [81] and because theunderlying assumption of Normality for ANCOVA wasviolated when grip strength was analysed for both malesand females together.TUG scores were reciprocal transformed in order to
achieve a Normal distribution and homogeneity of errorvariances across all groups [82, 83].ANCOVA was carried out to identify associations be-
tween performance in physical function measures andDBI score of > 0, anticholinergic only exposure (DBA >0), and sedative only exposure (DBS > 0). The referencecategory was set as those with DBI score = 0. The modelwas adjusted for demographic variables – age, gender(TUG and Barthel Index), level of ID, history of falls, co-morbidities (FCI) and number of non-DBI medicines;grip strength was also adjusted for Down syndrome as a
Table 1 Tests of Normality
Kolmogorov-Smirnov Shapiro-Wilk
Statistic df p value Statistic df p value
Grip Strength (Female) 0.058 251 0.039 0.987 251 0.024
Grip Strength (Male) 0.065 186 0.055 0.992 186 0.383
Reciprocal TUG (1/TUG) 0.027 468 0.200 0.990 468 0.003
Barthel Index 0.162 635 < 0.001 0.859 635 < 0.001
df: degrees of freedom
Fig. 2 Q-Q Plot for Female Grip Strength
O’Connell et al. BMC Geriatrics (2019) 19:173 Page 8 of 21
result of the well-documented inferior muscular strengthand hypotonia in individuals with Down syndrome [84].Level of ID and Down syndrome were adjusted for sep-arately as level of ID refers to Intelligence Quotient (IQ)and adaptive behaviour deficits including deficits in in-tellectual functioning [85] while Down syndrome is anaetiology of ID which encompasses individuals with alllevels of ID. TUG was not adjusted for Down syn-drome because it measures more than musclestrength alone – it measures balance and executivefunction and as such was not expected to be as influ-enced by Down syndrome as grip strength. Inaddition, the feasibility study carried out by Enkelaaret al. (2013) which examined use of TUG in adults
with ID found aetiology of ID was not associated withperformance in balance and gait tests [49].A second ANCOVA was used to compare adjusted
means of grip strength, TUG and Barthel Index betweenparticipants exposed to three different levels of DrugBurden Index ranges (DBI = 0, DBI 0.1 > 1 and DBI ≥ 1),three levels of anticholinergic exposure (DBA = 0, DBA0.1 > 1 and DBA ≥ 1) and three levels of sedative expos-ure (DBS = 0, DBS 0.1 > 1 and DBS ≥ 1). Reciprocal TUGscores were back-transformed after analysis. While useof the anticholinergic and sedative sub-scores of the DBIhas not been validated, these have been used previouslyin order to examine in greater detail associationsbetween DBI and physical function [19]. Giving
Fig. 3 Q-Q Plot for Male Grip Strength
Fig. 4 Q-Q Plot for Reciprocal Timed Up and Go
O’Connell et al. BMC Geriatrics (2019) 19:173 Page 9 of 21

consideration to the different medication exposure pat-terns (i.e., higher anticholinergic burden) in older adultswith ID, further justified the method of analysis.Variance Inflation Factors (VIF) and Spearman’s correl-
ation coefficients were used to test independent variablesfor multicollinearity. All VIFs were < 2, therefore there wasno collinearity of concern between variables. Dancy andReidy’s categorisation [86] was used to interpret Spearman’scorrelation coefficients. All correlation coefficient valueswere < 0.4, indicating only weak correlations existed be-tween variables which were again not of concern.Power calculations were performed using G*Power (ver-
sion 3.1.9.2) [87]. To detect a medium effect size (Cohen’sf = 0.25) [88], for three-level analysis (DBI/DBA/DBS 0,0.1 > 1, ≥1) with 6 covariates, a sample size of 133 for malesachieved a power of 0.72 and a sample size of 199 for fe-males achieved a power of 0.89 with α = 0.05 (grip strengthassessment). For three-level analysis with 6 covariates, asample size of 383 achieved a power of 0.995 with α = 0.05(TUG assessment) and a sample size of 464 achieved apower of 0.999 with α = 0.05 (Barthel Index assessment).For two-level analysis (DBI/DBA/DBS 0 or > 0) with six
covariates, a sample size of 133 for males achieved apower of 0.82 and a sample size of 199 for femalesachieved a power of 0.94 with α = 0.05 (grip strength as-sessment). For two-level analysis with 6 covariates, a sam-ple size of 383 achieved a power of 0.998 with α = 0.05(TUG assessment) and a sample size of 464 achieved apower of 0.999 with α = 0.05 (Barthel Index assessment).
ResultsTable 2 displays descriptive statistics of the characteris-tics of the IDS-TILDA population and the grip strengthand TUG sub-populations.
Of the 677 individuals who took part in Wave 2 ofIDS-TILDA, 56.1% (n = 380) were female and 51.3%(n = 347) were aged between 50 and 64 years. Of the 624individuals with data available on level of ID, 44% (n =287) of participants had moderate level of ID; 44% (n =298) of the 676 participants with data on type of resi-dence reported lived in a community group home. Al-most three-quarters (73.5%; n = 491) of participantsreported low level of physical activity. Six hundred fortyfour participants (95.1%) reported taking medication and78.6% (n = 532) were exposed to medication with anti-cholinergic and/or sedative activity (DBI medications).21.4% (n = 145) of individuals were not exposed to DBImedicines (DBI = 0), 24.4% (n = 165) had a DBI score of0.1 > 1 and 54.2% (n = 367) had a DBI score ≥ 1. On sub-score analysis, 31.9% (n = 216) of participants were ex-posed to no anticholinergic medicines (DBA = 0), 33.5%(n = 227) had a DBA score of 0.1 > 1 and 34.6% (n =234) had a DBA score ≥ 1. 50.2% (n = 340) of partici-pants were exposed to no sedative medicines (DBS = 0),30.6% (n = 207) had a DBS score of 0.1 > 1 and 19.2%(n = 130) had a DBS score ≥ 1 (Table 2).Table 2 presents univariate analysis of demographic
and clinical characteristics and participation in gripstrength and TUG measurements. Level of ID, type ofresidence and physical activity level were significantly as-sociated with participation in both measures (p < 0.05).In addition, age range was significantly associated withparticipation in TUG (p = 0.040). Those with mild andmoderate ID were over-represented compared to thosewith severe/profound level of ID in both measures(IDS-TILDA 67.9% for mild/moderate, 30.1% for severe/profound; grip strength 83.5% for mild/moderate, 16.6%for severe/profound, p < 0.001; TUG 75.9% for mild/
Fig. 5 Q-Q Plot for Barthel Index
O’Connell et al. BMC Geriatrics (2019) 19:173 Page 10 of 21

moderate, 24.1% for severe/profound, p < 0.001), andthose living in residential care were under-representedin both measures (IDS-TILDA 40.8%; grip strength
34.8%, p < 0.001; TUG 36.3%, p = 0.001). Drug BurdenIndex exposure was significantly different for gripstrength participants (p = 0.017) but not for TUG
Table 2 Descriptive of characteristics of IDS-TILDA participants (n = 677) and of the two physical function measures (grip strengthn = 437; TUG n = 468) and representativeness
Characteristics IDS-TILDA% (95% CI) (n)
Grip strength% (95% CI) (n)
TUG% (95% CI) (n)
Total N 677 437 p 468 p
Gender n = 677 n = 437 0.355 n = 468 0.432
Male 43.9 (40.2–47.6) (n = 297) 42.6 (37.9–47.4) (n = 186) 44.9 (40.3–49.5) (n = 210)
Female 56.1 (52.4–59.8) (n = 380) 57.4 (52.6–62.1) (n = 251) 55.1 (50.5–59.7) (n = 258)
Age range n = 676 n = 437 0.498 n = 468 0.040*
44–49 years 27.6 (24.2–31.0) (n = 187) 26.5 (22.5–30.9) (n = 116) 28.2 (24.2–32.5) (n = 132)
50–64 years 51.3 (47.5–55.1) (n = 347) 51.3 (46.5–56.0) (n = 224) 53.4 (48.8–58.0) (n = 250)
65 years + 21.0 (17.9–24.1) (n = 142) 22.2 (18.4–26.4) (n = 97) 18.4 (15.0–22.2) (n = 86)
Level of ID n = 624 n = 398 < 0.001* n = 432 < 0.001*
Mild 23.9 (20.6–27.3) (n = 149) 30.2 (25.7–34.9) (n = 120)a 26.4 (22.3–30.8) (n = 114)
Moderate 44.0 (40.1–47.9) (n = 287) 53.3 (48.2–58.3) (n = 212)a 49.5 (44.7–54.4) (n = 214)a
Severe/Profound 30.1 (26.5–33.7) (n = 188) 16.6 (13.1–20.6) (n = 66)b 24.1 (20.1–28.4) (n = 104)b
Type of residence n = 676 n = 437 < 0.001* n = 468 0.001*
Independent 15.0 (12.3–17.7) (n = 102) 17.6 (14.2–21.5) (n = 77) 15.8 (12.6–19.4) (n = 74)
Community Group Home 44.1 (40.4–47.8) (n = 298) 47.6 (42.8–52.4) (n = 208) 47.9 (43.3–52.5) (n = 224)a
Residential Care 40.8 (37.1–44.5) (n = 276) 34.8 (30.3–39.5) (n = 152)b 36.3 (32.0–40.9) (n = 170)b
Down syndrome n = 663 n = 437 0.087 n = 468 0.388
Yes 19.2 (16.2–22.4) (n = 127) 16.7 (13.3–20.5) (n = 73) 17.3 (14.0–21.0) (n = 81)
No 80.8 (77.6–83.8) (n = 536) 81.5 (77.5–85.0) (n = 356) 81.0 (77.1–84.4) (n = 379)
Physical activity level n = 668 n = 432 0.043* n = 462 0.002*
Low 73.5 (70.0–76.8) (n = 491) 70.6 (66.1–74.9) (n = 305) 69.5 (65.1–73.7) (n = 321)b
Moderate 24.3 (21.0–27.7) (n = 162) 27.3 (23.2–31.8) (n = 118) 28.1 (24.1–32.5) (n = 130)a
High 2.2 (1.3–3.7) (n = 15) 2.1 (1.0–3.9) (n = 9) 2.4 (1.2–4.2) (n = 11)
Exposure to any medications 95.1 (93.5–96.7) (n = 644) 93.8 (91.1–95.9) (n = 410) 0.249 94.2 (91.7–96.2) (n = 441) 0.475
Exposure to DBI medications 78.6 (75.5–81.7) (n = 532) 75.3 (71.0–79.3) (n = 329)b 0.003* 76.7 (72.6–80.5) (n = 359) 0.045*
DBI score n = 677 n = 437 0.017* n = 468 0.062
0 21.4 (18.3–24.5) (n = 145) 24.7 (20.7–29.0) (n = 108)a 23.3 (19.5–27.4) (n = 109)
0.1 > 1 24.4 (21.2–27.6) (n = 165) 23.8 (19.9–28.1) (n = 104) 25.4 (21.5–29.6) (n = 119)
≥ 1 54.2 (50.5–58.0) (n = 367) 51.5 (46.7–56.3) (n = 225) 51.3 (46.7–55.9) (n = 240)
DBA score n = 677 n = 437 0.197 n = 468 0.685
0 31.9 (28.4–35.6) (n = 216) 33.9 (29.4–38.5) (n = 148) 32.5 (28.3–36.9) (n = 152)
0.1 > 1 33.5 (30.0–37.2) (n = 227) 31.4 (27.0–35.9) (n = 137) 32.5 (28.3–36.9) (n = 152)
≥ 1 34.6 (31.0–38.3) (n = 234) 34.8 (30.3–39.5) (n = 152) 35.0 (30.7–39.6) (n = 164)
DBS score n = 677 n = 437 0.039* n = 468 0.001*
0 50.2 (46.4–54.1) (n = 340) 53.8 (49.0–58.5) (n = 235) 54.1 (49.4–58.6) (n = 253)
0.1 > 1 30.6 (27.1–34.2) (n = 207) 27.9 (23.8–32.4) (n = 122) 30.1 (26.0–34.5) (n = 141)
≥ 1 19.2 (16.2–22.2) (n = 130) 18.3 (14.8–22.3) (n = 80) 15.8 (12.6–19.4) (n = 74)b
aOver-represented bUnder-representedStatistically significant results are marked in bold with an asterisk (*)
O’Connell et al. BMC Geriatrics (2019) 19:173 Page 11 of 21
participants (p = 0.062) when compared to the overallpopulation. DBS scores were statistically significantly dif-ferent for grip strength and TUG participants whencompared to the overall population, and those with high(≥ 1) DBS score were underrepresented. Gender (male/female), Down syndrome (yes/no), medication exposureand DBA scores were not statistically significantly differ-ent with regards to participation in either grip strengthor TUG (p > 0.05).The mean score for grip strength for women was 16.9
kg (Standard Deviation (SD) ±7.0 kg) and for men was24.5 kg (SD ±10.6 kg). Mean TUG was 16.8 s (SD ±10.3s). Mean Barthel Index was 13.7. The range of scores forgrip strength was 1 – 54 kg, for TUG was 5.9–89.8 s andfor Barthel Index was 0–20. Median and interquartileranges (IQR) are also reported (grip strength for womenmedian score 17 kg, IQR 9 kg; grip strength for men 24kg, IQR 16.25 kg; TUG median score 13.6 s, IQR 7.1 s;Barthel Index median score 16.0, IQR 9.0) (Table 3).Grip strength data was categorised by age and gender
according to the manufacturer’s instructions (Table 4).Four hundred eight participants (93.4%) were cate-gorised as having “Below Normal” grip strength, 15(3.4%) had “Normal” grip strength and 14 (3.2%) had“Above Normal” grip strength.For women, there is no significant association of age
with grip strength after adjusting for confounders(comorbidities, level of ID, Down syndrome and falls),p > 0.05, Fig. 6.For men, there is a highly significant association of age
with grip strength, with mean grip strength decreasingfrom 28.2 kg at 44–49 years to 24.3 kg at 50–64 years(p = 0.001) to 19.8 kg at 65+ years (p = 0.052) (Fig. 6).There is no significant association of age with in-
creased TUG score from age range 44–49 years to 50–64 years after adjusting for confounders (gender, comor-bidities, level of ID and falls), p > 0.05, Fig. 7. However,there is a statistically significant association of age rangewith increased TUG between the youngest and oldest
age ranges (44–49 years and 65+ years), with mean TUGincreasing from 12.7 s at 44–49 years to 16.7 s at 65+years (p = 0.004) (Fig. 7).Table 5 displays results from unadjusted and adjusted
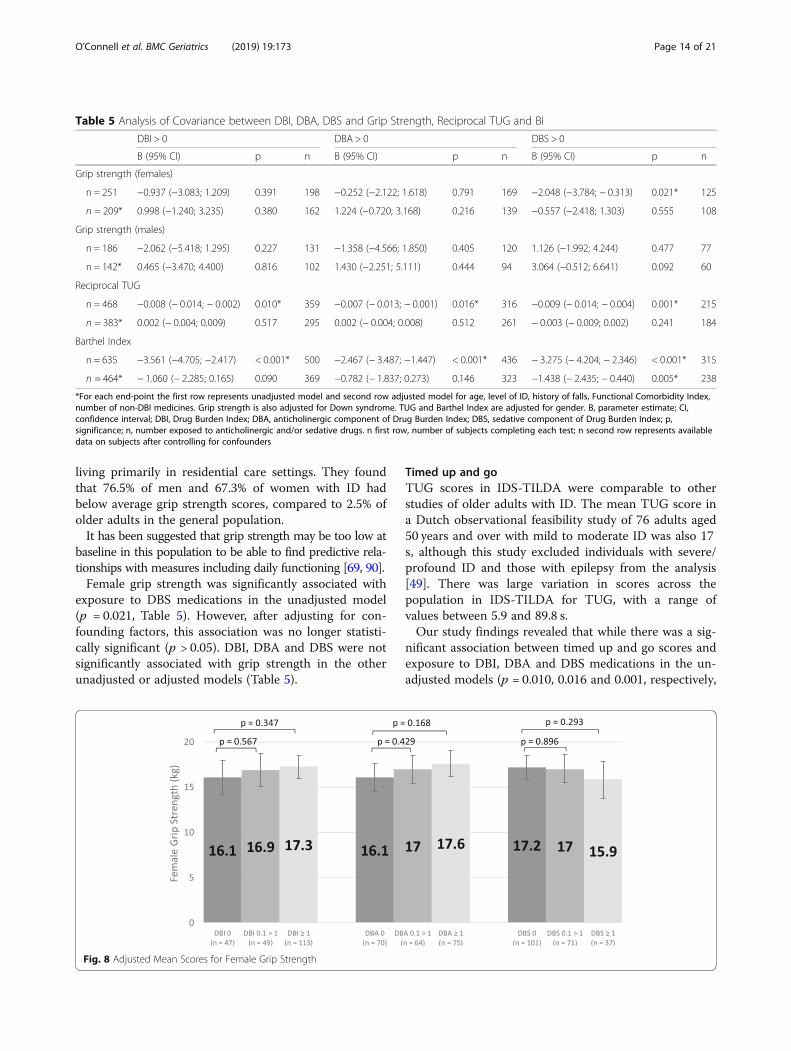
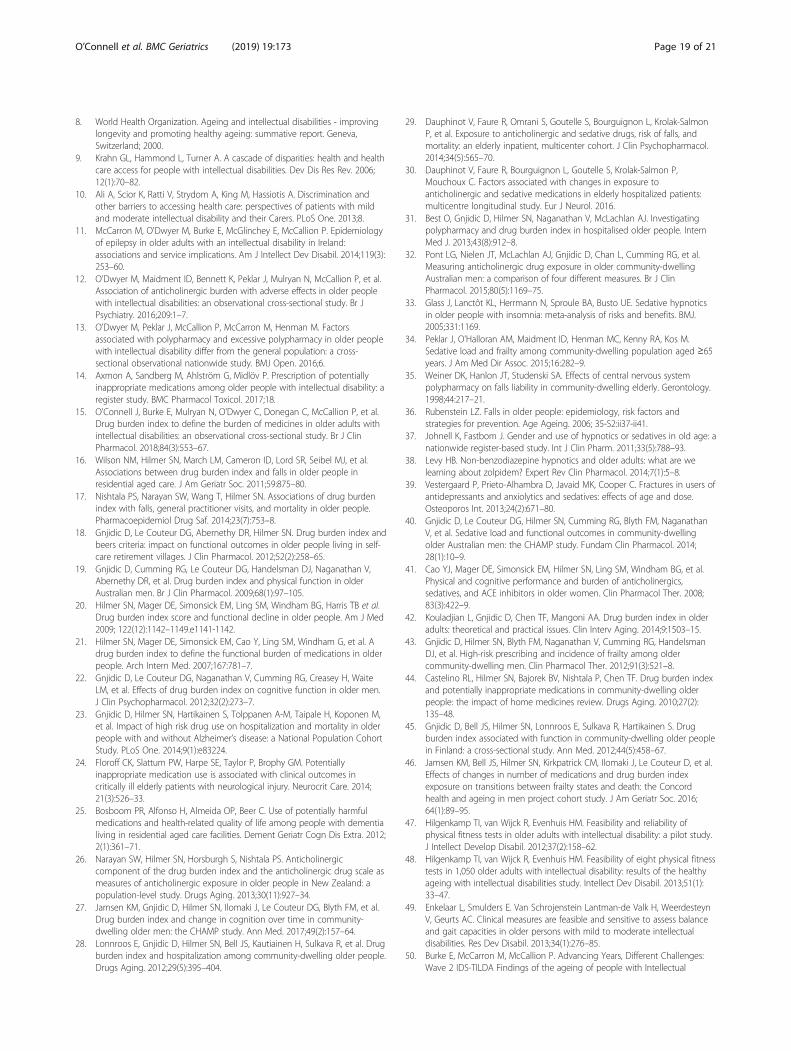
ANCOVA models for grip strength, TUG and BarthelIndex in those exposed to DBI, DBA and DBS medica-tions (> 0) versus those not exposed (= 0). Adjusted gripstrength scores for females or males were notsignificantly associated with DBI, DBA or DBS exposure(p > 0.05 in all cases). Unadjusted reciprocal TUG scoreswere significantly associated with DBI, DBA and DBSscores > 0 (DBI > 0, p = 0.010; DBA > 0, p = 0.016; DBS >0, p = 0.001). However, after adjusting for confoundingfactors, this association was no longer observed (p > 0.05in all three analyses). Unadjusted Barthel Index was sig-nificantly associated with DBI, DBA and DBS scores > 0(p < 0.001 in all three cases). After adjusting for con-founders, Barthel Index remained significantly associatedwith DBS > 0 (p = 0.005).Figure 8 displays the adjusted mean scores for female
grip strength across the three types of exposure (= 0,0.1 > 1, ≥ 1) for DBI, DBA and DBS. There was nosignificant association between exposure levels and gripstrength scores (p > 0.05). Similarly, Fig. 9 displaysadjusted mean scores for male grip strength, which werealso not significantly associated with exposure level(p > 0.05). Adjusted reciprocal TUG scores were backtransformed after analysis and there was no significantassociation between exposure levels and scores (p > 0.05,Fig. 10).Increased dependency in Barthel Index activities of
daily living was not significantly associated with DBAexposure after adjusting for confounders (p > 0.05),but increased dependency was significantly associatedwith DBS exposure (p < 0.001 for DBS = 0 vs DBS ≥ 1,Fig. 11).
DiscussionKey findingsDrug Burden Index was not associated with poorer per-formance in two measures of physical function, gripstrength and TUG, in analysis of covariance after adjust-ing for confounding factors in this cross-sectional studyin older adults with ID. On sub-score analysis, the anti-cholinergic only and sedative only components of the
Table 3 Data for Grip Strength, TUG and Barthel Index
Health Measure Mean ±SD Range (min – max) Median Interquartile Range
Grip strength (females) (kg) (n = 251) 16.9 7.0 2.0–36.0 17.0 9.0
Grip strength (males) (kg) (n = 186) 24.5 10.6 1.0–54.0 24.0 16.25
TUG (seconds) (n = 468) 16.8 10.3 5.9–89.8 13.6 7.1
Barthel Index (n = 635) 13.7 6.2 0.0–20.0 16.0 9.0
Table 4 Categorical Data for Grip Strength (n = 437)
Grip Strength (n = 437) % of Participants (95% CI)
Above Normal (n = 14) 3.2 (1.8–5.3)
Normal (n = 15) 3.4 (1.9–5.6)
Below Normal (n = 408) 93.4 (90.6–95.5)
O’Connell et al. BMC Geriatrics (2019) 19:173 Page 12 of 21

DBI were also not associated with poorer performancein these measures.
Grip strengthGrip strength scores were lower in the IDS-TILDApopulation than in the Dutch cross-sectional study“Healthy ageing and intellectual disabilities” (HA-ID),which included participants aged 50 years and over livingprimarily in residential care in the Netherlands (n =1050, of which 725 completed grip strength assessment)
[69, 89]. In particular, grip strength scores for women inall age groups were lower than their counterparts inHA-ID (Additional file 3) [69]. Variation of grip strengthscores was also large, with scores ranging from 2.0 kg to36.0 kg (Table 3). It is important to consider that 9 outof 10 participants were categorised as having “BelowNormal” grip strength. This finding is not surprising -Hilgenkamp et al. [69] compared reference values forgrip strength by gender in the general population withscores from older adults with intellectual disabilities
Fig. 6 Grip Strength Versus Age and Gender
Fig. 7 Timed Up and Go Versus Age
O’Connell et al. BMC Geriatrics (2019) 19:173 Page 13 of 21
living primarily in residential care settings. They foundthat 76.5% of men and 67.3% of women with ID hadbelow average grip strength scores, compared to 2.5% ofolder adults in the general population.It has been suggested that grip strength may be too low at
baseline in this population to be able to find predictive rela-tionships with measures including daily functioning [69, 90].Female grip strength was significantly associated with
exposure to DBS medications in the unadjusted model(p = 0.021, Table 5). However, after adjusting for con-founding factors, this association was no longer statisti-cally significant (p > 0.05). DBI, DBA and DBS were notsignificantly associated with grip strength in the otherunadjusted or adjusted models (Table 5).
Timed up and goTUG scores in IDS-TILDA were comparable to otherstudies of older adults with ID. The mean TUG score ina Dutch observational feasibility study of 76 adults aged50 years and over with mild to moderate ID was also 17s, although this study excluded individuals with severe/profound ID and those with epilepsy from the analysis[49]. There was large variation in scores across thepopulation in IDS-TILDA for TUG, with a range ofvalues between 5.9 and 89.8 s.Our study findings revealed that while there was a sig-
nificant association between timed up and go scores andexposure to DBI, DBA and DBS medications in the un-adjusted models (p = 0.010, 0.016 and 0.001, respectively,
Table 5 Analysis of Covariance between DBI, DBA, DBS and Grip Strength, Reciprocal TUG and BI
DBI > 0 DBA > 0 DBS > 0
B (95% CI) p n B (95% CI) p n B (95% CI) p n
Grip strength (females)
n = 251 −0.937 (−3.083; 1.209) 0.391 198 −0.252 (−2.122; 1.618) 0.791 169 −2.048 (−3.784; − 0.313) 0.021* 125
n = 209* 0.998 (−1.240; 3.235) 0.380 162 1.224 (−0.720; 3.168) 0.216 139 −0.557 (−2.418; 1.303) 0.555 108
Grip strength (males)
n = 186 −2.062 (−5.418; 1.295) 0.227 131 −1.358 (−4.566; 1.850) 0.405 120 1.126 (−1.992; 4.244) 0.477 77
n = 142* 0.465 (−3.470; 4.400) 0.816 102 1.430 (−2.251; 5.111) 0.444 94 3.064 (−0.512; 6.641) 0.092 60
Reciprocal TUG
n = 468 −0.008 (− 0.014; − 0.002) 0.010* 359 −0.007 (− 0.013; − 0.001) 0.016* 316 −0.009 (− 0.014; − 0.004) 0.001* 215
n = 383* 0.002 (− 0.004; 0.009) 0.517 295 0.002 (− 0.004; 0.008) 0.512 261 − 0.003 (− 0.009; 0.002) 0.241 184
Barthel Index
n = 635 −3.561 (−4.705; −2.417) < 0.001* 500 −2.467 (− 3.487; −1.447) < 0.001* 436 − 3.275 (− 4.204; − 2.346) < 0.001* 315
n = 464* − 1.060 (− 2.285; 0.165) 0.090 369 −0.782 (− 1.837; 0.273) 0.146 323 −1.438 (− 2.435; − 0.440) 0.005* 238
*For each end-point the first row represents unadjusted model and second row adjusted model for age, level of ID, history of falls, Functional Comorbidity Index,number of non-DBI medicines. Grip strength is also adjusted for Down syndrome. TUG and Barthel Index are adjusted for gender. B, parameter estimate; CI,confidence interval; DBI, Drug Burden Index; DBA, anticholinergic component of Drug Burden Index; DBS, sedative component of Drug Burden Index; p,significance; n, number exposed to anticholinergic and/or sedative drugs. n first row, number of subjects completing each test; n second row represents availabledata on subjects after controlling for confounders
Fig. 8 Adjusted Mean Scores for Female Grip Strength
O’Connell et al. BMC Geriatrics (2019) 19:173 Page 14 of 21
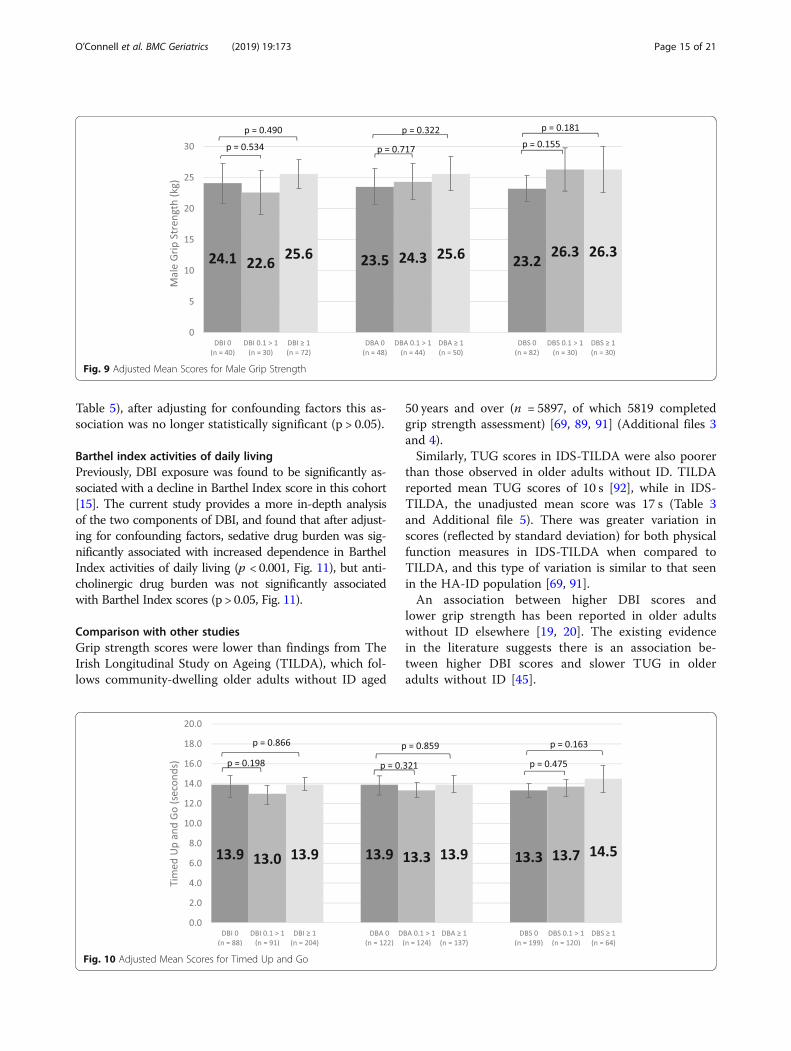
Table 5), after adjusting for confounding factors this as-sociation was no longer statistically significant (p > 0.05).
Barthel index activities of daily livingPreviously, DBI exposure was found to be significantly as-sociated with a decline in Barthel Index score in this cohort[15]. The current study provides a more in-depth analysisof the two components of DBI, and found that after adjust-ing for confounding factors, sedative drug burden was sig-nificantly associated with increased dependence in BarthelIndex activities of daily living (p < 0.001, Fig. 11), but anti-cholinergic drug burden was not significantly associatedwith Barthel Index scores (p > 0.05, Fig. 11).
Comparison with other studiesGrip strength scores were lower than findings from TheIrish Longitudinal Study on Ageing (TILDA), which fol-lows community-dwelling older adults without ID aged
50 years and over (n = 5897, of which 5819 completedgrip strength assessment) [69, 89, 91] (Additional files 3and 4).Similarly, TUG scores in IDS-TILDA were also poorer
than those observed in older adults without ID. TILDAreported mean TUG scores of 10 s [92], while in IDS-TILDA, the unadjusted mean score was 17 s (Table 3and Additional file 5). There was greater variation inscores (reflected by standard deviation) for both physicalfunction measures in IDS-TILDA when compared toTILDA, and this type of variation is similar to that seenin the HA-ID population [69, 91].An association between higher DBI scores and
lower grip strength has been reported in older adultswithout ID elsewhere [19, 20]. The existing evidencein the literature suggests there is an association be-tween higher DBI scores and slower TUG in olderadults without ID [45].
Fig. 9 Adjusted Mean Scores for Male Grip Strength
Fig. 10 Adjusted Mean Scores for Timed Up and Go
O’Connell et al. BMC Geriatrics (2019) 19:173 Page 15 of 21

A number of factors could be influencing the physicalfunction scores of older adults with ID; ageing, gender,physical activity level, medication burden and the pres-ence of the intellectual disability itself.It is important to note that the age range encompassed
by this study (age ≥ 44 years) represents a younger co-hort than that typically investigated in studies of ageing.However, because people with ID experience the onsetof age-related conditions at a much younger age thanthe general population, and also experience prematureageing and reduced life expectancy (in Ireland, life ex-pectancy at birth has been found to be 19 years lowerthan for people without ID, and death occurs earlier themore severe the level of ID [93, 94]), choice of thisyounger cohort reflects the relatively new phenomenonof adults with ID living into older age [2, 6]. The effectof ageing, which is more pronounced at a younger age inpeople with ID, combined with the long term reducedactivity levels, could be overpowering the effect of drugburden alone. Decline in grip strength is significantly as-sociated with age for men in this cohort, with mean gripstrength decreasing across the three age ranges afteradjusting for confounding factors (p ≤ 0.05); however,there is no significant association between decline ingrip strength and age range for women (p > 0.05, Fig. 6).This also suggests that gender is an important factor
when examining decline in grip strength, as men appearto be more susceptible to decline as they age, whilewomen, though producing lower scores overall, maintaintheir function in this area.Almost three quarters of the IDS-TILDA cohort have
reported low levels of physical activity (Table 2), and thismay be contributing to the reduced muscle strength andbalance observed in this study. The low physical fitnesslevel may be a result of lifelong sedentary lifestyle [69].It is well-established that adults with ID are less
physically active than their counterparts without ID, andthis lower level of activity is evident across all age ranges[95–97]. It has been suggested that a lack of adequatephysical activity choices in day services and residentialcare settings prevents adults with ID from meeting rec-ommendations for physical activity [98]. However, im-provements in physical activity, such as cardiovasculartraining and balance and weight-bearing exercises leadto better performance in tests of muscle strength andimprovement in measures of balance and executivefunction, including TUG [95]. This suggests that phys-ical activity levels play a substantial role in the extent ofphysical function, and that long term inactivity impactsgreatly on performance in tests of function.Adults with ID generally take medications with anti-
cholinergic and sedative effects throughout their lifetime,while older adults in the general population may onlybegin to take these classes of medications later in life[99]. People with ID are exposed to higher proportionsof these medications for a longer duration of time.Therefore, the effect on performance for older adultswithout ID is more pronounced from these types ofmedications. In previous DBI studies of older adultswithout ID, sedative medications contributed more tothe overall Drug Burden Index score than anticholiner-gic medications, while in recently published research inthe IDS-TILDA cohort, scores were considerably higherand anticholinergic medications contributed more to theburden [15]. The association with physical function hasbeen found to be stronger for the sedative sub-score ofthe DBI than the anticholinergic sub-score in olderadults without ID [19]. Interestingly, neither number ofmedications nor use of psychotropic medication were as-sociated with any of the balance and gait tests carriedout in a study of older adults with mild to moderate IDin the Netherlands [49]. Older adults with ID also differ
Fig. 11 Adjusted Mean Scores for Barthel Index
O’Connell et al. BMC Geriatrics (2019) 19:173 Page 16 of 21

from those without ID because they have higher levelsof polypharmacy even in the youngest age group [13,100] and the evidence in the literature suggests that thishigher level of drug use begins much earlier [100, 101].If exposure to DBI medications makes a contribution, itmay be much earlier in the life of people with ID.It may also be that the onset of epilepsy, dementia and
neurological impairment, which is more prevalent inadults with ID as they age [7, 11, 69], causes a rapid de-cline in physical functioning, and the response of carersto these changes and their influence on the possibilitiesfor physical activity in the person with ID, would renderdrug effects small in comparison.The association between sedative drug burden and in-
creased dependency in Barthel Index activities of dailyliving is of particular interest because the associationremained even after correcting for the factors whichmay be having a strong influence on physical function,such as age and gender. It has been suggested that asso-ciation of total DBI, anticholinergic-only Drug Burdenand sedative-only Drug Burden with poorer BarthelIndex is independent of established determinants ofpoorer physical function and the magnitude of the asso-ciations were similar to that of these determinants [102].Targeting sedative medications for review and re-assessing Barthel Index scores could potentially identifyan area for clinical intervention that may improve qual-ity of life in older adults with ID.
Strengths and limitationsThere are four main strengths in this study. First, thisstudy uses data from a large, nationally representativesample of older adults with ID. Second, comprehensivemedication data was collected for this cohort. Third, theDrug Burden Index was used, which is an internationallyvalidated, robust measure of anticholinergic and sedativedrug effects. Fourth, objective measures of physical per-formance were measured.However, there are also several limitations to this
study. This is a cross-sectional observational study so itis only possible to describe association, not causality.Another possible limitation of this study is that it under-represents those with severe/profound level of ID. It hasbeen suggested that the higher drop-off rate from partic-ipants with severe/profound level of ID in grip strengthmeasurements is as a result of difficulty in adaptation tograsping for this group [103]. There is also no baseline/pre-exposure data, as these adults have typically beentaking medications with anticholinergic and/or sedativeeffects long-term. The use of sub-score analysis ofanticholinergic-only burden and sedative-only burdenscores has not been validated in relation to physicalfunction measures in any population. Finally, some ofthe data obtained is based on reported rather than
measured data, and this may be a limitation to the ac-curacy of some data.
ConclusionsThe current study findings suggest that the DBI toolmay not be useful at identifying the effect of these medi-cations on physical function in older adults with ID.However, the adverse effects of these medications arewell established. It is highly probable that these medica-tions are indeed affecting function to a degree in this co-hort, but that this effect occurs earlier in life in theseindividuals. As this study includes individuals aged 44years and older, there is no reference available from thecurrent study design to examine function among youn-ger adults with ID. It is possible that exposure to anti-cholinergic and sedative medications at a younger ageleads to lifelong exposure, which then impacts on phys-ical function. The lack of pre-exposure data from thestudy design limits the understanding of whether expos-ure to these medications have an immediate or perman-ent effect on physical performance. This is an area withpotential for further research in future. It is likely thatthe DBI tool is useful for detecting changes in physicalfunction in older adults without ID that commence anti-cholinergic and/or sedative medications later in life.Regular medication review should be carried out forolder adults with ID, alongside appropriate de-prescribing, due to the well-established adverse effectsand interaction potential for these types of medications.The higher morbidity in this population also suggeststhat they are more likely to be exposed to these medica-tions, and while the reference category of those withDBI = 0 have, at this point in time, no exposure to thesemedications, it does not necessarily mean they werenever exposed, and it is not possible to ascertain priorexposure and duration of treatment from the currentstudy design.Considering the substantial number of participants
who did not wish to, or were not able to complete thetests, this cohort of older adults with ID appear less ac-tive and physically weaker than older adults without ID.This also poses challenges to determining if there is afurther decline in their physical functioning associatedwith drug use because of the low level of physical func-tion they have attained already.While DBI may be associated with other outcomes in
older adults with ID, including higher dependence inBarthel Index activities of daily living [15], it was not sig-nificantly associated with the two objective measures ofphysical function in this study. Further study is neededto investigate associations between DBI and physicalfunction in adults with ID, potentially by following ayounger cohort, aged 40–50 years, over a longer periodof time.
O’Connell et al. BMC Geriatrics (2019) 19:173 Page 17 of 21

Additional files
Additional file 1: Modified Barthel Index. A descriptive table of theBarthel Index components matched to variables on function from TheIntellectual Disability Supplement to the Irish Longitudinal Study onAgeing (IDS-TILDA). (DOCX 50 kb)
Additional file 2: Modified Functional Comorbidity Index. A descriptivetable of the Functional Comorbidity Index components matched tovariables on morbidities from The Intellectual Disability Supplement tothe Irish Longitudinal Study on Ageing (IDS-TILDA). (DOCX 15 kb)
Additional file 3: Female Grip Strength Comparison. A comparativetable of female grip strength scores from The Intellectual DisabilitySupplement to the Irish Longitudinal Study on Ageing (IDS-TILDA), theHealthy ageing and intellectual disabilities study (HA-ID) and the IrishLongitudinal Study on Ageing (TILDA). (DOCX 14 kb)
Additional file 4: Male Grip Strength Comparison. A comparative tableof male grip strength scores from The Intellectual Disability Supplementto the Irish Longitudinal Study on Ageing (IDS-TILDA), the Healthy ageingand intellectual disabilities study (HA-ID) and the Irish Longitudinal Studyon Ageing (TILDA). (DOCX 16 kb)
Additional file 5: Timed Up and Go Comparison. A comparative tableof timed up and go scores from The Intellectual Disability Supplement tothe Irish Longitudinal Study on Ageing (IDS-TILDA) and the IrishLongitudinal Study on Ageing (TILDA). (DOCX 14 kb)
AbbreviationsANCOVA: Analysis of Covariance; ATC: Anatomical Therapeutic ChemicalClassification System; BI: Barthel Index; BMI: Body Mass Index; CAPI: ComputerAssisted Personal Interview; DBA: Anticholinergic Subscale of Drug BurdenIndex; DBI: Drug Burden Index; DBS: Sedative Subscale of Drug Burden Index;df: degrees of freedom; FCI: Functional Comorbidity Index; HA-ID: HealthyAgeing and Intellectual Disabilities; HPRA: Health Products RegulatoryAuthority; ID: Intellectual Disabilities; IDS-TILDA: Intellectual DisabilitySupplement to the Irish Longitudinal Study on Ageing; INN: InternationalNon-Proprietary Name; IPAQ: International Physical Activity Questionnaire;IQ: Intelligence Quotient; IQR: Interquartile Range; MDD: Minimum DailyDose; NIDD: National Intellectual Disability Database; OTC: Over the Counter;PIN: Personal Identification Numbers; PIQ: Pre-Interview Questionnaire;QUS: Quantitative Ultrasound; RNID: Registered Nurse in IntellectualDisability; SD: Standard Deviation; SmPC: Summary of Product Characteristics;SPSS: Statistical Package for Social Sciences; STROBE: Strengthening theReporting of Observational Studies in Epidemiology; TUG: Timed up and go;VIF: Variance Inflation Factors
AcknowledgementsThe authors would like to thank the people with ID who participated in thisstudy, their families, carers, the services involved, the IDS-TILDA Scientific Ad-visory Committee, and the Intellectual Disability Consultative Groups for theirsupport. They would like to acknowledge the contributions of Dr. RachaelCarroll. The authors would also like to acknowledge funding for the IDS-TILDA study from the Health Research Board (HRB) and the Department ofHealth. The views expressed are those of the authors and are not necessarilythose of the Department of Health, The Health Research Board or Trinity Col-lege Dublin.
Authors’ contributionsJOC, MCH, EB, CD, PM, MM and MOD contributed to the overall conceptionand design of the study. EB undertook gathering of health assessment data(grip strength, TUG, Quantitative Heel Ultrasound). JOC and CD undertookthe data extraction. JOC and MOD carried out the statistical analyses of thestudy; JOC wrote the first draft of this manuscript. MCH, EB, CD, PM, MM andMOD revised the manuscript. All authors, external and internal, had fullaccess to all of the data (including statistical reports and tables) in the studyand can take responsibility for the integrity of the data and the accuracy ofthe data analysis. All authors contributed to the interpretation of results anddrafting of this manuscript. All authors read and approved the finalmanuscript. JOC and MM are the guarantors.
FundingThis research was funded by the Department of Health in Ireland andmanaged by the Health Research Board. The lead author (JOC) receivedfunding for a PhD from the Trinity College Dublin Studentship, Dean’s Fundand Non-Foundation Scholarship. MO’D received funding for this study fromthe Dean’s Fund Award, Faculty of Health Sciences, Trinity College Dublin.The funding bodies did not play a role in the study design, writing of themanuscript.
Availability of data and materialsThe datasets generated and/or analysed during the current study are notpublicly available. The data used for this study contains sensitive informationon the cohort of older adults with ID. Currently, the IDS-TILDA dataset is onlyavailable with the permission of the Principal Investigators. Due to the sensi-tive nature of the data, strict data protection protocols are in place to man-age and control the access to this data. Access to this data is only availablethrough a hot desk system under the permission and discretion of the Princi-pal Investigators.
Ethics approval and consent to participateEthical approval for the IDS-TILDA study was granted by the Faculty ofHealth Sciences Research Ethics Committee in Trinity College Dublin. Inaddition, local and/or regional ethical committee approval was granted fromeach service provider (n = 138).Participants signed written informed consent independently (with the aid ofeasy-to-read information) or, if this was not possible, a family member/guard-ian signed a letter of agreement for their family member to participate. Con-sent to participate in the health assessment was also collected in writing atthe time of the objective measures. A system of process consent wasemployed whereby between each measure, affirmation to proceed to thenext measure was attained from the participant.
Consent for publicationNot applicable.
Competing interestsThe authors declare they have no competing interests.
Author details1School of Pharmacy and Pharmaceutical Sciences and IDS-TILDA, School ofNursing and Midwifery, Trinity College, Dublin, Ireland. 2School of Pharmacyand Pharmaceutical Sciences, Trinity College, Dublin, Ireland. 3IDS-TILDA,School of Nursing and Midwifery, Trinity College, Dublin, Ireland. 4College ofPublic Health, Temple University, Philadelphia, USA. 5Dean of Faculty ofHealth Sciences, Trinity College, Dublin, Ireland.
Received: 14 November 2018 Accepted: 17 June 2019
References1. American Psychiatric Association. Diagnostic and statistical manual of mental
disorders. 5th ed. Arlington, VA: American Psychiatric Publishing; 2013.2. Coppus AMW. People with intellectual disability: what do we know about
adulthood and life expectancy? Dev Dis Res Rev. 2013;18(1):6–16.3. Patja K, Iivanainen M, Vesala H, Oksanen H, Ruoppila I. Life expectancy of
people with intellectual disability: a 35-year follow-up study. J IntellectDisabil Res. 2000;44 ( Pt 5:591–9.
4. Janicki MP, Dalton AJ, Henderson CM, Davidson PW. Mortality andmorbidity among older adults with intellectual disability: health servicesconsiderations. Disabil Rehabil. 1999;21(5–6):284–94.
5. Heslop P, Blair PS, Fleming P, Hoghton M, Marriott A, Russ L. The confidentialinquiry into premature deaths of people with intellectual disabilities in the UK:a population-based study. Lancet. 2014;383(9920):889–95.
6. Perkins EA, Moran JA. Aging adults with intellectual disabilities. J Am MedAssoc. 2010;304(1):91–2.
7. McCarron M, Swinburne J, Burke E, McGlinchey E, Carroll R, McCallion P.Patterns of multimorbidity in an older population of persons with anintellectual disability: results from the intellectual disability supplement tothe Irish longitudinal study on aging (IDS-TILDA). Res Dev Disabil. 2013;34(1):521–7.
O’Connell et al. BMC Geriatrics (2019) 19:173 Page 18 of 21
8. World Health Organization. Ageing and intellectual disabilities - improvinglongevity and promoting healthy ageing: summative report. Geneva,Switzerland; 2000.
9. Krahn GL, Hammond L, Turner A. A cascade of disparities: health and healthcare access for people with intellectual disabilities. Dev Dis Res Rev. 2006;12(1):70–82.
10. Ali A, Scior K, Ratti V, Strydom A, King M, Hassiotis A. Discrimination andother barriers to accessing health care: perspectives of patients with mildand moderate intellectual disability and their Carers. PLoS One. 2013;8.
11. McCarron M, O'Dwyer M, Burke E, McGlinchey E, McCallion P. Epidemiologyof epilepsy in older adults with an intellectual disability in Ireland:associations and service implications. Am J Intellect Dev Disabil. 2014;119(3):253–60.
12. O'Dwyer M, Maidment ID, Bennett K, Peklar J, Mulryan N, McCallion P, et al.Association of anticholinergic burden with adverse effects in older peoplewith intellectual disabilities: an observational cross-sectional study. Br JPsychiatry. 2016;209:1–7.
13. O'Dwyer M, Peklar J, McCallion P, McCarron M, Henman M. Factorsassociated with polypharmacy and excessive polypharmacy in older peoplewith intellectual disability differ from the general population: a cross-sectional observational nationwide study. BMJ Open. 2016;6.
14. Axmon A, Sandberg M, Ahlström G, Midlöv P. Prescription of potentiallyinappropriate medications among older people with intellectual disability: aregister study. BMC Pharmacol Toxicol. 2017;18.
15. O'Connell J, Burke E, Mulryan N, O'Dwyer C, Donegan C, McCallion P, et al.Drug burden index to define the burden of medicines in older adults withintellectual disabilities: an observational cross-sectional study. Br J ClinPharmacol. 2018;84(3):553–67.
16. Wilson NM, Hilmer SN, March LM, Cameron ID, Lord SR, Seibel MJ, et al.Associations between drug burden index and falls in older people inresidential aged care. J Am Geriatr Soc. 2011;59:875–80.
17. Nishtala PS, Narayan SW, Wang T, Hilmer SN. Associations of drug burdenindex with falls, general practitioner visits, and mortality in older people.Pharmacoepidemiol Drug Saf. 2014;23(7):753–8.
18. Gnjidic D, Le Couteur DG, Abernethy DR, Hilmer SN. Drug burden index andbeers criteria: impact on functional outcomes in older people living in self-care retirement villages. J Clin Pharmacol. 2012;52(2):258–65.
19. Gnjidic D, Cumming RG, Le Couteur DG, Handelsman DJ, Naganathan V,Abernethy DR, et al. Drug burden index and physical function in olderAustralian men. Br J Clin Pharmacol. 2009;68(1):97–105.
20. Hilmer SN, Mager DE, Simonsick EM, Ling SM, Windham BG, Harris TB et al.Drug burden index score and functional decline in older people. Am J Med2009; 122(12):1142–1149.e1141-1142.
21. Hilmer SN, Mager DE, Simonsick EM, Cao Y, Ling SM, Windham G, et al. Adrug burden index to define the functional burden of medications in olderpeople. Arch Intern Med. 2007;167:781–7.
22. Gnjidic D, Le Couteur DG, Naganathan V, Cumming RG, Creasey H, WaiteLM, et al. Effects of drug burden index on cognitive function in older men.J Clin Psychopharmacol. 2012;32(2):273–7.
23. Gnjidic D, Hilmer SN, Hartikainen S, Tolppanen A-M, Taipale H, Koponen M,et al. Impact of high risk drug use on hospitalization and mortality in olderpeople with and without Alzheimer’s disease: a National Population CohortStudy. PLoS One. 2014;9(1):e83224.
24. Floroff CK, Slattum PW, Harpe SE, Taylor P, Brophy GM. Potentiallyinappropriate medication use is associated with clinical outcomes incritically ill elderly patients with neurological injury. Neurocrit Care. 2014;21(3):526–33.
25. Bosboom PR, Alfonso H, Almeida OP, Beer C. Use of potentially harmfulmedications and health-related quality of life among people with dementialiving in residential aged care facilities. Dement Geriatr Cogn Dis Extra. 2012;2(1):361–71.
26. Narayan SW, Hilmer SN, Horsburgh S, Nishtala PS. Anticholinergiccomponent of the drug burden index and the anticholinergic drug scale asmeasures of anticholinergic exposure in older people in New Zealand: apopulation-level study. Drugs Aging. 2013;30(11):927–34.
27. Jamsen KM, Gnjidic D, Hilmer SN, Ilomaki J, Le Couteur DG, Blyth FM, et al.Drug burden index and change in cognition over time in community-dwelling older men: the CHAMP study. Ann Med. 2017;49(2):157–64.
28. Lonnroos E, Gnjidic D, Hilmer SN, Bell JS, Kautiainen H, Sulkava R, et al. Drugburden index and hospitalization among community-dwelling older people.Drugs Aging. 2012;29(5):395–404.
29. Dauphinot V, Faure R, Omrani S, Goutelle S, Bourguignon L, Krolak-SalmonP, et al. Exposure to anticholinergic and sedative drugs, risk of falls, andmortality: an elderly inpatient, multicenter cohort. J Clin Psychopharmacol.2014;34(5):565–70.
30. Dauphinot V, Faure R, Bourguignon L, Goutelle S, Krolak-Salmon P,Mouchoux C. Factors associated with changes in exposure toanticholinergic and sedative medications in elderly hospitalized patients:multicentre longitudinal study. Eur J Neurol. 2016.
31. Best O, Gnjidic D, Hilmer SN, Naganathan V, McLachlan AJ. Investigatingpolypharmacy and drug burden index in hospitalised older people. InternMed J. 2013;43(8):912–8.
32. Pont LG, Nielen JT, McLachlan AJ, Gnjidic D, Chan L, Cumming RG, et al.Measuring anticholinergic drug exposure in older community-dwellingAustralian men: a comparison of four different measures. Br J ClinPharmacol. 2015;80(5):1169–75.
33. Glass J, Lanctôt KL, Herrmann N, Sproule BA, Busto UE. Sedative hypnoticsin older people with insomnia: meta-analysis of risks and benefits. BMJ.2005;331:1169.
34. Peklar J, O'Halloran AM, Maidment ID, Henman MC, Kenny RA, Kos M.Sedative load and frailty among community-dwelling population aged ≥65years. J Am Med Dir Assoc. 2015;16:282–9.
35. Weiner DK, Hanlon JT, Studenski SA. Effects of central nervous systempolypharmacy on falls liability in community-dwelling elderly. Gerontology.1998;44:217–21.
36. Rubenstein LZ. Falls in older people: epidemiology, risk factors andstrategies for prevention. Age Ageing. 2006; 35-S2:ii37-ii41.
37. Johnell K, Fastbom J. Gender and use of hypnotics or sedatives in old age: anationwide register-based study. Int J Clin Pharm. 2011;33(5):788–93.
38. Levy HB. Non-benzodiazepine hypnotics and older adults: what are welearning about zolpidem? Expert Rev Clin Pharmacol. 2014;7(1):5–8.
39. Vestergaard P, Prieto-Alhambra D, Javaid MK, Cooper C. Fractures in users ofantidepressants and anxiolytics and sedatives: effects of age and dose.Osteoporos Int. 2013;24(2):671–80.
40. Gnjidic D, Le Couteur DG, Hilmer SN, Cumming RG, Blyth FM, NaganathanV, et al. Sedative load and functional outcomes in community-dwellingolder Australian men: the CHAMP study. Fundam Clin Pharmacol. 2014;28(1):10–9.
41. Cao YJ, Mager DE, Simonsick EM, Hilmer SN, Ling SM, Windham BG, et al.Physical and cognitive performance and burden of anticholinergics,sedatives, and ACE inhibitors in older women. Clin Pharmacol Ther. 2008;83(3):422–9.
42. Kouladjian L, Gnjidic D, Chen TF, Mangoni AA. Drug burden index in olderadults: theoretical and practical issues. Clin Interv Aging. 2014;9:1503–15.
43. Gnjidic D, Hilmer SN, Blyth FM, Naganathan V, Cumming RG, HandelsmanDJ, et al. High-risk prescribing and incidence of frailty among oldercommunity-dwelling men. Clin Pharmacol Ther. 2012;91(3):521–8.
44. Castelino RL, Hilmer SN, Bajorek BV, Nishtala P, Chen TF. Drug burden indexand potentially inappropriate medications in community-dwelling olderpeople: the impact of home medicines review. Drugs Aging. 2010;27(2):135–48.
45. Gnjidic D, Bell JS, Hilmer SN, Lonnroos E, Sulkava R, Hartikainen S. Drugburden index associated with function in community-dwelling older peoplein Finland: a cross-sectional study. Ann Med. 2012;44(5):458–67.
46. Jamsen KM, Bell JS, Hilmer SN, Kirkpatrick CM, Ilomaki J, Le Couteur D, et al.Effects of changes in number of medications and drug burden indexexposure on transitions between frailty states and death: the Concordhealth and ageing in men project cohort study. J Am Geriatr Soc. 2016;64(1):89–95.
47. Hilgenkamp TI, van Wijck R, Evenhuis HM. Feasibility and reliability ofphysical fitness tests in older adults with intellectual disability: a pilot study.J Intellect Develop Disabil. 2012;37(2):158–62.
48. Hilgenkamp TI, van Wijck R, Evenhuis HM. Feasibility of eight physical fitnesstests in 1,050 older adults with intellectual disability: results of the healthyageing with intellectual disabilities study. Intellect Dev Disabil. 2013;51(1):33–47.
49. Enkelaar L, Smulders E. Van Schrojenstein Lantman-de Valk H, WeerdesteynV, Geurts AC. Clinical measures are feasible and sensitive to assess balanceand gait capacities in older persons with mild to moderate intellectualdisabilities. Res Dev Disabil. 2013;34(1):276–85.
50. Burke E, McCarron M, McCallion P. Advancing Years, Different Challenges:Wave 2 IDS-TILDA Findings of the ageing of people with Intellectual
O’Connell et al. BMC Geriatrics (2019) 19:173 Page 19 of 21
Disability. Dublin: School of Nursing and Midwifery, Trinity College, Dublin;2014: 1–178.
51. McCarron M, Swinburne J, Burke E, McGlinchey E, Mulryan N, Andrews V,et al. Growing older with an intellectual disability in Ireland 2011: first resultsfrom the intellectual disability supplement to the Irish longitudinal study onageing. Dublin: School of Nursing, Trinity College; 2011.
52. Intellectual Disability Supplement to the Irish Longitudinal Study on Ageing.Results from Wave 2. https://idstilda.tcd.ie/about/resultsw2.php. Accessed 18Dec 2018.
53. Burke E. Bone health in older adults with intellectual disability. Dublin,Ireland: Trinity College; 2016.
54. Burke E, Walsh J, McCallion P, McCarron M. One size does not fit all, makingreasonable adjustment to facilitate the engagement of people withintellectual disability in objective health assessment. Melbourne, Australia:IASSIDD Congress; 2016.
55. von Elm E, Altman DG, Egger M, Pocock SJ, Gøtzsche PC, VandenbrouckeJP, et al. The strengthening the reporting of observational studies inepidemiology (STROBE) statement: guidelines for reporting observationalstudies. Int J Surg. 2014;12(12):1495–9.
56. Vandenbroucke JP, von Elm E, Altman DG, Gøtzsche PC, Mulrow CD, PocockSJ, et al. Strengthening the reporting of observational studies inepidemiology (STROBE): explanation and elaboration. Int J Surg. 2014;12(12):1500–24.
57. Kaila T, Korte JM, Saari KM. Systemic bioavailability of ocularly applied 1%atropine eyedrops. Acta Ophthalmol Scand. 1999;77(2):193–6.
58. Health products regulatory authority. Summary of product characteristicsStemetil 5mg tablets. https://www.hpra.ie/img/uploaded/swedocuments/LicenseSPC_PA0540-127-005_09032018091041.pdf. Accessed 21 June 2019.
59. Linjakumpu T, Hartikainen S, Klaukka T, Koponen H, Kivelä S-L, Isoaho R. A modelto classify the sedative load of drugs. Int J Geriatr Psychiatry. 2003;18:542–5.
60. Health Products Regulatory Authority. Health Products Regulatory Authority.http://www.hpra.ie. Accessed Jan to Jun 2016.
61. Cuesta-Vargas A, Hilgenkamp T. Reference values of grip strength measuredwith a Jamar dynamometer in 1526 adults with intellectual disabilities andcompared to adults without intellectual disability. PLoS One. 2015;10(6):e0129585.
62. Mathiowetz V, Kashman N, Volland G, Weber K, Dowe M, Rogers S. Grip andpinch strength: normative data for adults. Arch Phys Med Rehabil. 1985;66(2):69–74.
63. Mathiowetz V, Weber K, Volland G, Kashman N. Reliability and validity ofgrip and pinch strength evaluations. J Hand Surg Am. 1984;9(2):222–6.
64. Roberts HC, Denison HJ, Martin HJ, Patel HP, Syddall H, Cooper C, et al. Areview of the measurement of grip strength in clinical and epidemiologicalstudies: towards a standardised approach. Age Ageing. 2011;40(4):423–9.
65. Podsiadlo D, Richardson S. The timed "up & go": a test of basic functionalmobility for frail elderly persons. J Am Geriatr Soc. 1991;39(2):142–8.
66. Salb J, Finlayson J, Almutaseb S, Scharfenberg B, Becker C, Sieber C, et al.Test-retest reliability and agreement of physical fall risk assessment tools inadults with intellectual disabilities. J Intellect Disabil Res. 2015;59(12):1121–9.
67. Collin C, Wade DT, Davies S, Horne V. The Barthel ADL index: a reliabilitystudy. Int Disabil Stud. 1988;10(2).
68. Sainsbury A, Seebass G, Bansal A, Young JB. Reliability of the Barthel indexwhen used with older people. Age Ageing. 2005;34(3):228–32.
69. Hilgenkamp TI, van Wijck R, Evenhuis HM. Low physical fitness levels inolder adults with ID: results of the HA-ID study. Res Dev Disabil. 2012;33(4):1048–58.
70. Craig CL, Marshall AL, Sjostrom M, Bauman AE, Booth ML, Ainsworth BE,et al. International physical activity questionnaire: 12-country reliability andvalidity. Med Sci Sports Exerc. 2003;35(8):1381–95.
71. International Physical Activity Questionnaire Research Committee.Guidelines for Data Processing and Analysis of the International PhysicalActivity Questionnaire (IPAQ) – Short and Long Forms. https://sites.google.com/site/theipaq/scoring-protocol. Accessed 13 Feb 2019.
72. Vickers AJ. Parametric versus non-parametric statistics in the analysis ofrandomized trials with non-normally distributed data. BMC Med ResMethodol. 2005;5:35.
73. Blanca MJ, Alarcón R, Arnau J, Bono R, Bendayan R. Non-normal data: IsANOVA still a valid option? Psicothema. 2017;29(4):552–7.
74. Olejnik SF, Algina J. Parametric ANCOVA and the rank transform ANCOVAwhen the data are conditionally non-Normal and heteroscedastic. J EducStat. 1984;9(2):129–49.
75. Micceri T. The unicorn, the normal curve, and other improbable creatures.Psychol Bull. 1989;105(1):156.
76. Bono R, Blanca MJ, Arnau J, Gómez-Benito J. Non-normal distributionscommonly used in health, education, and social sciences: a systematicreview. Front Psychol. 2017;8:1602.
77. Chakravarti L, Roy. Handbook of methods of applied statistics, Volume I:John Wiley and Sons; 1967.
78. NIST/SEMATECH. e-Handbook of Statistical Methods. http://www.itl.nist.gov/div898/handbook/. Accessed 31 Jan 2018.
79. Stephens M. EDF statistics for goodness of fit and some comparisons. J AmStat Assoc. 1974;69(347).
80. Kent State University Libraries. SPSS Tutorials: Descriptive Stats for OneNumeric Variable (Explore). https://libguides.library.kent.edu/SPSS/Explore.Accessed 18 Jan 2018.
81. Turusheva A, Frolova E, Degryse JM. Age-related normative values forhandgrip strength and grip strength’s usefulness as a predictor of mortalityand both cognitive and physical decline in older adults in Northwest Russia.J Musculoskelet Neuronal Interact. 2017;17(1):417–32.
82. Doncaster CP, Davey AJH. Analysis of variance and covariance : how tochoose and construct models for the life sciences. Cambridge: CambridgeUniversity Press; 2007.
83. Box GEP, Cox DR. An analysis of transformations. J Royal Stat Soc B. 1964;26:211–52.
84. Morris AF, Vaughan SE, Vaccaro P. Measurements of neuromuscular tone andstrength in Down's syndrome children. J Ment Defic Res. 1982;26(Pt 1:41–6.
85. Tasse MJ, Luckasson R, Schalock RL. The relation between intellectualfunctioning and adaptive behavior in the diagnosis of intellectual disability.Intellect Dev Disabil. 2016;54(6):381–90.
86. Dancy C, Reidy J. Statistics without maths for psychology. Harlow: Pearsoneducation limited; 2004.
87. Faul F, Erdfelder E, Lang AG, Buchner A. G*power 3: a flexible statisticalpower analysis program for the social, behavioral, and biomedical sciences.Behav Res Methods. 2007;39(2):175–91.
88. Cohen J. Statistical power analysis for the behavioral sciences. 2nd ed. ed.Hillsdale, N.J: L. Erlbaum Associates; 1988.
89. Hilgenkamp TI, Bastiaanse LP, Hermans H, Penning C, van Wijck R, EvenhuisHM. Study healthy ageing and intellectual disabilities: recruitment anddesign. Res Dev Disabil. 2011;32(3):1097–106.
90. Oppewal A, Hilgenkamp TI, van Wijck R, Schoufour JD, Evenhuis HM.Physical fitness is predictive for a decline in the ability to performinstrumental activities of daily living in older adults with intellectualdisabilities: results of the HA-ID study. Res Dev Disabil. 2015;41-42:76–85.
91. Kenny RA, Coen RF, Frewen J, Donoghue OA, Cronin H, Savva GM.Normative values of cognitive and physical function in older adults: findingsfrom the Irish longitudinal study on ageing. J Am Geriatr Soc. 2013;61(Suppl2):S279–90.
92. Donoghue OA, Savva GM, Cronin H, Kenny RA, Horgan NF. Using timed upand go and usual gait speed to predict incident disability in daily activitiesamong community-dwelling adults aged 65 and older. Arch Phys MedRehabil. 2014;95(10):1954–61.
93. Glover G, Williams R, Heslop P, Oyinlola J, Grey J. Mortality in people withintellectual disabilities in England. J Intellect Disabil Res. 2017;61(1):62–74.
94. McCarron M, Carroll R, Kelly C, McCallion P. Mortality rates in the generalIrish population compared to those with an intellectual disability from 2003to 2012. J Appl Res Intellect Disabil. 2015;28(5):406–13.
95. Bartlo P, Klein PJ. Physical activity benefits and needs in adults withintellectual disabilities: systematic review of the literature. Am J Intellect DevDisabil. 2011;116(3):220–32.
96. Frey GC. Comparison of physical activity levels between adults with andwithout mental retardation. J Phys Act Health. 2004;1(3):235–45.
97. Draheim CC, Williams DP, McCubbin JA. Prevalence of physical inactivityand recommended physical activity in community-based adults withmental retardation. Ment Retard. 2002;40(6):436–44.
98. Messent PR, Cooke CB, Long J. Daily physical activity in adults with mildand moderate learning disabilities: is there enough? Disabil Rehabil. 1998;20(11):424–7.
99. Chiba Y, Shimada A, Yoshida F, Keino H, Hasegawa M, Ikari H, et al. Risk offall for individuals with intellectual disability. Am J Intellect Dev Disabil.2009;114(4):225–36.
100. Peklar J, Kos M, O'Dwyer M, McCarron M, McCallion P, Kenny RA, et al.Medication and supplement use in older people with and without
O’Connell et al. BMC Geriatrics (2019) 19:173 Page 20 of 21
intellectual disability: an observational, cross-sectional study. PLoS One.2017;12(9):e0184390.
101. O'Dwyer M, Peklar J, Mulryan N, McCallion P, McCarron M, Henman MC.Prevalence, patterns and factors associated with psychotropic use in olderadults with intellectual disabilities in Ireland. J Intellect Disabil Res. 2017;61(10):969–83.
102. Lowry E, Woodman RJ, Soiza RL, Hilmer SN, Mangoni AA. Drug burdenindex, physical function, and adverse outcomes in older hospitalizedpatients. J Clin Pharmacol. 2012;52(10):1584–91.
103. Sprague RL, Deutsch KM, Newell KM. Adaptive force control in grasping as afunction of level of developmental disability. J Intellect Disabil Res. 2009;53(9):797–806.
Publisher’s NoteSpringer Nature remains neutral with regard to jurisdictional claims inpublished maps and institutional affiliations.
O’Connell et al. BMC Geriatrics (2019) 19:173 Page 21 of 21