Embed Size (px)
Citation preview

Association mapping of spot blotch resistance in wild barley
Joy K. Roy • Kevin P. Smith •
Gary J. Muehlbauer • Shiaoman Chao •
Timothy J. Close • Brian J. Steffenson
Received: 16 August 2009 / Accepted: 25 January 2010
� The Author(s) 2010. This article is published with open access at Springerlink.com
Abstract Spot blotch, caused by Cochliobolus sat-
ivus, is an important foliar disease of barley. The
disease has been controlled for over 40 years through
the deployment of cultivars with durable resistance
derived from the line NDB112. Pathotypes of
C. sativus with virulence for the NDB112 resistance
have been detected in Canada; thus, many commercial
cultivars are vulnerable to spot blotch epidemics. To
increase the diversity of spot blotch resistance in
cultivated barley, we evaluated 318 diverse wild barley
accessions comprising the Wild Barley Diversity
Collection (WBDC) for reaction to C. sativus at the
seedling stage and utilized an association mapping
(AM) approach to identify and map resistance loci. A
high frequency of resistance was found in the WBDC
as 95% (302/318) of the accessions exhibited low
infection responses. The WBDC was genotyped with
558 Diversity Array Technology (DArT�) and 2,878
single nucleotide polymorphism (SNP) markers and
subjected to structure analysis before running the AM
procedure. Thirteen QTL for spot blotch resistance
were identified with DArT and SNP markers. These
QTL were found on chromosomes 1H, 2H, 3H, 5H, and
7H and explained from 2.3 to 3.9% of the phenotypic
variance. Nearly half of the identified QTL mapped to
chromosome bins where spot blotch resistance loci
were previously reported, offering some validation for
the AM approach. The other QTL mapped to unique
genomic regions and may represent new spot blotch
resistance loci. This study demonstrates that AM is an
effective technique for identifying and mapping QTL
for disease resistance in a wild crop progenitor.
Keywords Hordeum vulgare subsp. spontaneum �Quantitative trait loci (QTL) � Population structure �Linkage disequilibrium mapping � SNP � DArT�
Introduction
Spot blotch, caused by Cochliobolus sativus (Ito and
Kurib.) Drechsl. ex Dastur [anamorph: Bipolaris
Electronic supplementary material The online version ofthis article (doi:10.1007/s11032-010-9402-8) containssupplementary material, which is available to authorized users.
J. K. Roy � B. J. Steffenson (&)
Department of Plant Pathology, University of Minnesota,
St. Paul, MN 55108, USA
e-mail: [email protected]
K. P. Smith � G. J. Muehlbauer
Department of Agronomy and Plant Genetics,
University of Minnesota, St. Paul, MN 55108, USA
S. Chao
Biosciences Research Lab, United States Department
of Agriculture-Agricultural Research Service, Fargo,
ND 58105, USA
T. J. Close
Department of Botany and Plant Sciences, University
of California, Riverside, CA 92521, USA
123
Mol Breeding
DOI 10.1007/s11032-010-9402-8
sorokiniana (Sacc. in Sorok.) Shoem.], is an impor-
tant foliar disease of barley in the Upper Midwest
region of the United States and eastern prairies of
Canada, the largest production area in North Amer-
ica. Under favorable conditions, this disease can
cause significant reductions in both the yield (Clark
1979) and quality of the crop (Nutter et al. 1985).
Spot blotch can be controlled by applying fungicides,
but the most effective and environmentally sound
means of reducing the impact of this disease is
through the use of resistant cultivars. Through a
concerted effort of breeding and selection, the first
spot blotch resistant cultivar (Dickson) was released
for the Upper Midwest region in 1964. The resistance
in Dickson was derived from NDB112 (Wilcoxson
et al. 1990), a breeding line derived from the
composite cross CC-XIII selection CIho 7117-77. In
fact, all subsequent six-rowed malting cultivars
released in the Upper Midwest since 1964 carry the
NDB112 resistance and have remained highly resis-
tant to spot blotch. The durability of this resistance is
remarkable considering the large area (up to 2.3 mil-
lion ha) over which various cultivars carrying the
resistance have been grown, the ubiquity of C. sativus
inoculum, and the wide range of environmental
conditions under which the pathogen can cause
epidemics (Fetch et al. 2008).
Two-rowed cultivars bred for resistance in the same
region have not been broadly effective against popu-
lations of C. sativus. A case in point is cultivar
Bowman, a two-rowed feed barley classified as
moderately resistant to spot blotch when it was first
released in 1984. Six years after Bowman was
released, high levels of infection were observed on it
and derived breeding lines in the field (Fetch and
Steffenson 1994). Analysis of pathogen isolates
revealed that Bowman had succumbed to a new
pathotype of C. sativus (Fetch and Steffenson 1994;
Valjavec-Gratian and Steffenson 1997). Recent
research indicates the presence of additional C. sativus
pathotypes in Canada, some of which possess virulence
for the durable NDB112 resistance present in six-
rowed malting cultivars (Ghazvini and Tekauz 2007).
The emergence of pathotypes with virulence for the
NDB112 resistance is alarming and could result in
widespread epidemics given the genetic uniformity of
spot blotch resistance in six-rowed malting cultivars.
The durable resistance provided by NDB112 has
led to some complacency with regard to identifying
new sources of spot blotch resistance in barley. Given
the reports of virulent pathotypes in the region,
additional research is needed to identify new sources
of resistance. Recently, Fetch et al. (2008) reported
on the screening of over 5,000 spring barley acces-
sions from the USDA National Small Grains Collec-
tion for resistance to both spot blotch and net blotch.
Only 5.8% (373 accessions) of the evaluated germ-
plasm was resistant to spot blotch in the field. The
geographic analysis of spot blotch resistance revealed
a ‘‘center of concentration’’ in North America, due
possibly to the wide use of the NDB112 resistance in
breeding lines and cultivars that comprised the
collection (Bonman et al. 2005; Fetch et al. 2008).
Another possible source of spot blotch resistance is
wild barley, Hordeum vulgare subsp. spontaneum
(C. Koch) Thell. This subspecies is the progenitor of
cultivated barley (von Bothmer et al. 2003) and
possesses a high level of genetic diversity and also
novel alleles for many economically important traits
(Ellis et al. 2000; Fetch et al. 2003; Shakhatreh et al.
2009; Steffenson et al. 2007). Wild barley can be found
across a wide geographic range extending from North
Africa in the west, throughout the Fertile Crescent, and
across to Central Asia and western Pakistan in the east
(von Bothmer et al. 2003). The transfer of genes from
wild into cultivated barley can proceed without any
difficulties because both are fully inter-fertile. Despite
the rich diversity of novel alleles in H. vulgare subsp.
spontaneum, this member of the primary Hordeum
genepool has not been systematically characterized
and exploited for genes or quantitative trait loci (QTL)
conferring spot blotch resistance.
Fetch et al. (2003) evaluated 116 wild barleys from
Israel and Jordan for reaction to spot blotch at the
seedling stage and found 46% and 53% of accessions
with resistance (i.e., infection responses [IRs] of 1–5
on a 1–9 scale) from the respective countries. How-
ever, only six of these accessions exhibited a high
level of spot blotch resistance (IRs of 1–2). Based on
these results, there is potential for identifying addi-
tional sources of spot blotch resistance from a wider
collection of H. vulgare subsp. spontaneum germ-
plasm. Recently, a large ecogeographically diverse
collection of wild barley was assembled (the Wild
Barley Diversity Collection or WBDC), comprising
318 accessions collected from 19 countries (Steffen-
son et al. 2007). This expanded core collection was
established to catalog and exploit the genetic diversity
Mol Breeding
123
of wild barley for a number of important agronomic
traits, including spot blotch resistance.
To effectively utilize new spot blotch resistance
genes from wild barley, genetic characterization is
required. The standard approach is to construct
bi-parental crosses between resistant and susceptible
parents and then phenotype and genotype (with
molecular markers) progeny populations to determine
the number and chromosomal location of resistance
loci (Lander and Botstein 1986). An alternative
approach for mapping resistance loci that does not
require development of bi-parental crosses or screen-
ing generations of progeny is association mapping
(AM) or linkage disequilibrium (LD) mapping. With
AM, statistical assessments are made for associations
between genotypes based on molecular markers and
phenotypes of various traits in reference germplasm
sets (Buntjer et al. 2005). Theoretically, this tech-
nique can be applied to any set of germplasm
(including wild accessions of a crop species) and
detect QTL for as many traits that show variation.
Compared to traditional QTL mapping, AM has three
main advantages: increased resolution power for
mapping QTL, greater capacity for detecting more
alleles, and faster completion time (Yu and Buckler
2006; Zhu et al. 2008). AM was pioneered in human
genetics (Hardy and Singleton 2009). Since its first
use with plants in 2001 (Thornsberry et al. 2001), AM
has gained wide application in many important crop
plants because of advances in high throughput
genotyping technologies, increased interest in iden-
tifying novel alleles, and improvements in statistical
methods (Gupta et al. 2005; Zhu et al. 2008).
Our long-term goal is to catalog and characterize
economically important genes in wild barley for
cultivated barley improvement. The objective of this
study was to identify and map loci conferring spot
blotch resistance in the WBDC using an AM approach.
Materials and methods
Plant materials
The WBDC consists of 318 accessions selected on
the basis of various eco-geographic parameters (e.g.,
longitude/latitude, elevation, high/low temperature,
rainfall, soil type, etc.). Most of the accessions were
from the Fertile Crescent (246/318 or 77.4%), with
fewer numbers from Central Asia (50/318 or 15.7%),
North Africa (12/318 or 3.8%), and the Caucasus
region (10/318 or 3.1%) (Steffenson et al. 2007).
Single plant selections were initially made from each
accession in the WBDC. These selections were then
selfed several times to achieve greater homozygosity.
Seeds from the first selfed (S1) or third selfed (S3)
generation were used in this study. Cultivar Bowman
and line NDB112 were the resistant controls and line
ND5883 was the susceptible control in all spot blotch
phenotyping experiments.
Sowing and plant growing conditions
Four seeds from each WBDC accession were placed
on moistened filter paper in petri plates and incubated
in a cold room (4�C) for 1 week to break dormancy.
Then, the seeds were moved to room temperature
(25 ± 2�C) for one day before being sown in pots.
Seeds were planted in the corners of square plastic
pots (10.2 9 10.2 cm) filled with 50% soil and 50%
MetroMix 200 (a vermiculite, peat moss, perlite, and
sand mix). Plants were grown in a greenhouse at 16–
24�C with 14 h of supplemental lighting provided by
400 W sodium vapor lamps (*300 lmol m-2 s-1
photon flux). At planting, the seeds were fertilized
with a water-soluble (Peters Dark Weather 15–0–15,
N–P–K, 150 g/gal concentrate at 1/16 dilution
[Scott’s Company, Marysville, OH]) and slow release
(Osmocote 14–14–14 N–P–K, 3 g/pot [Scott’s Com-
pany]) fertilizer. Thereafter, plants were fertilized bi-
weekly with Peters 20–10–20, N–P–K (145 g/gal
concentrate at 1/16 dilution [Scott’s Company]).
Pathogen isolate, inoculation, and incubation
conditions
Isolate ND85F was used in all experiments conducted
in this study and represents one (i.e., pathotype 1) of
the three major virulence types identified in the
Upper Midwest region of the USA (Valjavec-Gratian
and Steffenson 1997). This isolate is routinely used to
screen breeding materials for spot blotch resistance
and its virulence pattern is well characterized. The
isolate was originally derived from a single spore and
was maintained as conidia stored on silica gel crystals
in glass vials in a refrigerator at 4�C. Detailed
protocols for inoculum production are described in
Bilgic et al. (2006).
Mol Breeding
123
When the second leaves of plants were fully
expanded (usually 14 days after planting), seedlings
were inoculated with a conidial suspension
(8,000 conidia/ml) of isolate ND85F using a Paasche
H single action, external mix airbrush (Paasche
Airbrush Company, Harwood Heights, IL) pressurized
by an air pump (138 kPa). To facilitate even distribu-
tion and adherence of conidia on the barley leaves, a
surfactant (Tween-20: polyoxyethylene-20-sorbitan
monolaurate) was added (100 ll/l) to the conidial
suspension. The volume of inoculum suspension
applied to each plant was approximately 0.4 ml. After
inoculation, plants were transferred into a mist cham-
ber and misted with ultrasonic humidifiers for 30–
40 min to establish a layer of free moisture on the leaf
surfaces. Thereafter, the humidifiers were set to come
on for 2 minutes every hour to maintain leaf wetness.
During this time, the plants were kept at 18–22�C and
near 100% RH in the dark. After 16–18 h, the misters
were turned off and the chamber doors opened in order
to facilitate the slow drying of moisture from the plant
surfaces. Plants were then moved to the greenhouse
under the same conditions described above.
Disease phenotyping
Between 9–12 days post-inoculation, the spot blotch
IRs were assessed on the second leaves of seedlings
using the nine-class (1–9) rating scale of Fetch and
Steffenson (1999). This scale is based on the type
(presence of necrosis and/or chlorosis) and relative
size of lesions. The experiment was conducted in a
completely randomized design and repeated once.
Accessions giving variable reactions between exper-
iments were repeated again to confirm the pheno-
types. The first two disease evaluation experiments
were conducted on S1 generation plants of the WBDC
as this was the only generation available at the start of
the study. Subsequent phenotyping tests were done on
S3 generation plants. All experiments were conducted
at the Plant Growth Facility on St. Paul campus of
University of Minnesota.
Genotyping using diversity arrays technology
markers
Genomic DNA was extracted from 2-week-old seed-
lings of WBDC accessions using the FASTprep kit (Q-
BIOgene, Irvine, CA) and sent to Diversity Arrays
Technology Pty. Ltd (Yarralumla, Australia) for geno-
typing. Diversity Arrays Technology (DArT�) geno-
typing was done first on the WBDC; thus, only the S1
generation was available at the time. A total of 558 non-
redundant DArT� (a dominant marker type) markers,
previously developed (Jaccoud et al. 2001) and mapped
onto a barley consensus map (Wenzl et al. 2004, 2006),
were used to genotype the WBDC accessions.
Genotyping using single nucleotide
polymorphism markers
DNA for single nucleotide polymorphism (SNP)
(a co-dominant marker type) genotyping was
extracted from S3 generation plants of the WBDC.
Leaf segments (5–8 cm lengths) from 2-week-old
seedlings were cut and freeze-dried in 2.0 ml Eppen-
dorf tubes. DNA was then extracted following a
modified sodium dodecyl sulphate (SDS) method
(Pallotta et al. 2003). The general quality and quantity
of DNA was verified on a 0.8% agarose gel. Two
barley oligonucleotide pool assays (BOPAs), BOPA1
and BOPA2 (Close et al. 2009), containing allele-
specific oligos for a set of 3,072 SNPs (1,536 SNPs on
each BOPA) were used to genotype the WBDC
accessions following the protocols of Illumina’s
GoldenGate Bead Array Technology (Illumina, San
Diego, CA, USA) (Fan et al. 2003, 2006; Oliphant
et al. 2002). SNP genotyping was done at the USDA-
ARS Biosciences Research Laboratory in Fargo, ND.
The 3,072 SNP markers of BOPA1 and BOPA2 were
developed by a consortium of research groups led by
Timothy Close at the University of California-River-
side (Close et al. 2009). Of the 3,072 SNP markers
developed, 2,878 provided good quality genotype calls
and were used for subsequent analyses (Supplemental
Table S1). More than 95% of the 3,072 SNP markers
have been mapped in a barley consensus map consist-
ing of four populations (Close et al. 2009).
Population structure analysis
To estimate the number of subpopulations in the
WBDC, the DArT and SNP marker datasets were
analyzed separately for population structure using the
STRUCTURE program, ver. 2.0/2.1 (Falush et al.
2003, 2007; Pritchard et al. 2000). Analyses for LD
(Steffenson et al. 2007; Roy and Steffenson unpub-
lished), population structure, and AM were conducted
Mol Breeding
123

separately for several reasons: (a) the DArT and SNP
marker maps are based on different consensus maps
where marker intervals may not have the same degree
of precision; (b) the WBDC accessions were assigned
to different subpopulations depending on the marker
type used; and (c) we were interested in comparing
the results obtained for population structure and AM
from the two marker types readily available within
the barley research community. A burn-in period of
100,000 and Monte Carlo Markov Chain replications
of 200,000 were used for the analyses. The ‘‘Admix-
ture’’ and ‘‘Correlated’’ options were used for the
ancestry and allele frequency models, respectively.
STRUCTURE was run to test the hypothesis of two
to fifteen (K = 2–15) subpopulations. A Q matrix,
i.e., the n 9 p population structure incidence matrix
where n is the number of individuals assayed and p is
the number of populations defined, from the structure
analysis was used as a covariate in AM (discussed
below). The 558 DArT and 2,878 SNP marker
datasets both estimated ten subpopulations in the
WBDC. These population structure parameters were
accounted for in the AM analyses.
Association mapping
As with structure analysis, genome-wide scans for
AM of loci governing spot blotch resistance were
conducted separately for DArT and SNP markers.
Before analysis, the phenotype data were transformed
with the Box-Cox transformation to make them
conform to a more normal distribution (Box and
Cox 1964). The mean spot blotch IR from all
experiments was used as the response factor, with
the Q matrix from population structure analysis as a
covariate in the analysis. AM analysis was conducted
in the TASSEL standalone program, ver. 2.1 (www.
maizegenetics.net). The default settings of the pro-
gram were used for filtering marker data for mini-
mum genotype count and minor allele frequency
(MAF). Marker data were filtered for a minimum
count of 235 (75% of 314 accessions) and 238 (75%
of 318 accessions) for the DArT and SNP datasets,
respectively. Markers having a MAF less than 10%
were removed from the datasets. Preliminary analy-
ses of data revealed very little kinship among
accessions in the WBDC; thus, a general linear model
(GLM) was used instead of a mixed linear model. In
the program, a GLM was fitted for each single marker
and trait association (Yu et al. 2005). A permutation
test using 10,000 permutations was conducted to
correct the P-value for multiple comparisons. The
experiment-wise P-value provides a test of signifi-
cance (adjusted P-value) that corresponds to the
experiment-wise error and was used to make deci-
sions about the significance of marker effects.
Results
Disease phenotypes
Spot blotch infection on plants was uniform across all
experiments, allowing for the clear and unambiguous
classification of IRs. The controls reacted as expected
to C. sativus isolate ND85F: the two resistant controls
NDB112 and Bowman exhibited low IRs (mean of
2.3 and 3.0, respectively), whereas the susceptible
control ND5883 exhibited a high IR (mean of 7.7).
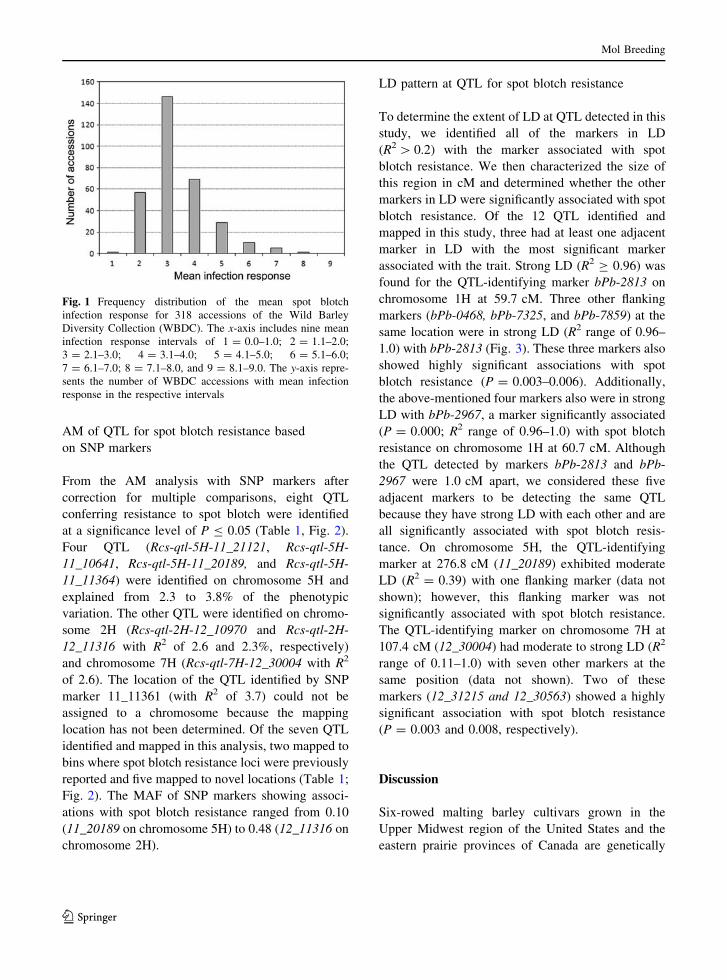
Most WBDC accessions (302/318 or 95%) were
resistant to spot blotch, exhibiting mean IRs of 5.0 or
lower (Fig. 1). Within this resistant group, 204
accessions exhibited very low IRs of 3.0 or lower.
The remaining WBDC accessions were susceptible
(16/318 or 5%), exhibiting mean IRs greater than 5.0.
AM of QTL for spot blotch resistance based
on DArT markers
From the AM analysis with DArT markers after
correction for multiple comparisons, five QTL con-
ferring resistance to spot blotch were identified at a
significance level of P B 0.05 (Table 1; Fig. 2). Two
QTL (Rcs-qtl-1H-bPb-2813 and Rcs-qtl-1H-bPb-
3089) were identified on chromosome 1H and
explained 2.7 and 3.9% of the phenotypic variation
as assessed by R2, respectively. The remaining three
QTL were identified on chromosomes 3H (Rcs-qtl-
3H-bPb-1068), 5H (Rcs-qtl-5H-bPb-2378), and 7H
(Rcs-qtl-7H-bPb-4584) and explained 3.6, 3.6, and
3.1% of the phenotypic variation, respectively. Of the
five QTL identified in this analysis, three mapped to
bins where spot blotch resistance loci were previously
reported and two mapped to novel locations (Table 1;
Fig. 2). The MAF of DArT markers showing asso-
ciations with spot blotch resistance ranged from 0.16
(bPb-2378 on chromosome 5H) to 0.40 (bPb-1068 on
chromosome 3H).
Mol Breeding
123
AM of QTL for spot blotch resistance based
on SNP markers
From the AM analysis with SNP markers after
correction for multiple comparisons, eight QTL
conferring resistance to spot blotch were identified
at a significance level of P B 0.05 (Table 1, Fig. 2).
Four QTL (Rcs-qtl-5H-11_21121, Rcs-qtl-5H-
11_10641, Rcs-qtl-5H-11_20189, and Rcs-qtl-5H-
11_11364) were identified on chromosome 5H and
explained from 2.3 to 3.8% of the phenotypic
variation. The other QTL were identified on chromo-
some 2H (Rcs-qtl-2H-12_10970 and Rcs-qtl-2H-
12_11316 with R2 of 2.6 and 2.3%, respectively)
and chromosome 7H (Rcs-qtl-7H-12_30004 with R2
of 2.6). The location of the QTL identified by SNP
marker 11_11361 (with R2 of 3.7) could not be
assigned to a chromosome because the mapping
location has not been determined. Of the seven QTL
identified and mapped in this analysis, two mapped to
bins where spot blotch resistance loci were previously
reported and five mapped to novel locations (Table 1;
Fig. 2). The MAF of SNP markers showing associ-
ations with spot blotch resistance ranged from 0.10
(11_20189 on chromosome 5H) to 0.48 (12_11316 on
chromosome 2H).
LD pattern at QTL for spot blotch resistance
To determine the extent of LD at QTL detected in this
study, we identified all of the markers in LD
(R2 [ 0.2) with the marker associated with spot
blotch resistance. We then characterized the size of
this region in cM and determined whether the other
markers in LD were significantly associated with spot
blotch resistance. Of the 12 QTL identified and
mapped in this study, three had at least one adjacent
marker in LD with the most significant marker
associated with the trait. Strong LD (R2 C 0.96) was
found for the QTL-identifying marker bPb-2813 on
chromosome 1H at 59.7 cM. Three other flanking
markers (bPb-0468, bPb-7325, and bPb-7859) at the
same location were in strong LD (R2 range of 0.96–
1.0) with bPb-2813 (Fig. 3). These three markers also
showed highly significant associations with spot
blotch resistance (P = 0.003–0.006). Additionally,
the above-mentioned four markers also were in strong
LD with bPb-2967, a marker significantly associated
(P = 0.000; R2 range of 0.96–1.0) with spot blotch
resistance on chromosome 1H at 60.7 cM. Although
the QTL detected by markers bPb-2813 and bPb-
2967 were 1.0 cM apart, we considered these five
adjacent markers to be detecting the same QTL
because they have strong LD with each other and are
all significantly associated with spot blotch resis-
tance. On chromosome 5H, the QTL-identifying
marker at 276.8 cM (11_20189) exhibited moderate
LD (R2 = 0.39) with one flanking marker (data not
shown); however, this flanking marker was not
significantly associated with spot blotch resistance.
The QTL-identifying marker on chromosome 7H at
107.4 cM (12_30004) had moderate to strong LD (R2
range of 0.11–1.0) with seven other markers at the
same position (data not shown). Two of these
markers (12_31215 and 12_30563) showed a highly
significant association with spot blotch resistance
(P = 0.003 and 0.008, respectively).
Discussion
Six-rowed malting barley cultivars grown in the
Upper Midwest region of the United States and the
eastern prairie provinces of Canada are genetically
Fig. 1 Frequency distribution of the mean spot blotch
infection response for 318 accessions of the Wild Barley
Diversity Collection (WBDC). The x-axis includes nine mean
infection response intervals of 1 = 0.0–1.0; 2 = 1.1–2.0;
3 = 2.1–3.0; 4 = 3.1–4.0; 5 = 4.1–5.0; 6 = 5.1–6.0;
7 = 6.1–7.0; 8 = 7.1–8.0, and 9 = 8.1–9.0. The y-axis repre-
sents the number of WBDC accessions with mean infection
response in the respective intervals
Mol Breeding
123

uniform for spot blotch resistance as nearly all carry
the NDB112 resistance. Given the recent reports of
isolates carrying virulence for this resistance, it is
readily apparent that the barley crop is vulnerable to
spot blotch epidemics. A recent evaluation of culti-
vated barley germplasm revealed a low percentage of
adult plant spot blotch resistance and that many of the
resistant accessions were likely derived from
NDB112 (Fetch et al. 2008). To identify new sources
of spot blotch resistance and to map the underlying
QTL, we evaluated the WBDC for reaction to
C. sativus at the seedling stage in the greenhouse.
A high frequency of seedling resistance was found in
the WBDC as 95% (302/318) of the accessions
exhibited mean IRs of 5 or lower. This frequency of
resistance is much higher than that reported by Fetch
et al. (2003) for wild barley accessions from Israel
(46%) and Jordan (53%) using the same C. sativus
isolate and methodology. Considering only the
accessions from Israel and Jordan in the WBDC,
the frequency of resistance within the respective
countries was still higher at 92.9% (39/42) and 86.9%
(53/61). Thus, seedling resistance to spot blotch in
wild barley is extremely common and likely
Table 1 Quantitative trait loci (QTL) for seedling spot blotch resistance identified through association mapping in the Wild Barley
Diversity Collection
Marker
systemaQTLb Chrc Markerd MAFe Position
(cM)fBINg P of
markerhP adjustedi R2
(%)jTypek
DArT Rcs-qtl-1H-bPb-2813 1H bPb-2813 0.37 59.7 7 0.003 0.019** 2.7 QTL
DArT Rcs-qtl-1H-bPb-3089 1H bPb-3089 0.20 90.7 10 0.000 0.000*** 3.9 Novel
SNP Rcs-qtl-2H-12_10970 2H 12_10970 0.18 7.8 1 0.003 0.017* 2.6 Novel
SNP Rcs-qtl-2H-12_11316 2H 12_11316 0.48 104.8 8 0.005 0.045* 2.3 QTL
DArT Rcs-qtl-3H-bPb-1068 3H bPb-1068 0.40 66.2 5 0.002 0.006** 3.6 QTL
SNP Rcs-qtl-5H-11_21121 5H 11_21121 0.17 105.9 6 0.001 0.002** 3.3 Novel
SNP Rcs-qtl-5H-11_10641 5H 11_10641 0.35 108.3 6 0.005 0.037* 2.3 Novel
DArT Rcs-qtl-5H-bPb-2378 5H bPb-2378 0.16 82.9 7 0.001 0.001*** 3.6 Novel
SNP Rcs-qtl-5H-11_20189 5H 11_20189 0.10 276.8 14 0.000 0.000*** 3.8 Novel
SNP Rcs-qtl-5H-11_11364 5H 11_11364 0.44 289.1 15 0.004 0.018* 2.5 Novel
DArT Rcs-qtl-7H-bPb-4584 7H bPb-4584 0.39 28.3 2 0.002 0.007** 3.1 Rcs5
SNP Rcs-qtl-7H-12_30004 7H 12_30004 0.28 107.4 7 0.003 0.012** 2.6 QTL
SNP NA – 11_11361 – – – 0.000 0.001*** 3.7 –
NA Not availablea Two marker systems, DArT and SNP, were used in separate association mapping analyses for detection of QTL for seedling spot
blotch resistanceb QTL were identified using a general linear model (GLM) accounting for population structure in the association mapping analyses
conducted in the TASSEL program. In this study, the QTL name is composed of four parts: first: Rcs indicates Resistance to
Cochliobolus sativus, the spot blotch pathogen; second: qtl indicates a quantitative trait locus; third: the chromosome number of
barley; and fourth: name of marker showing significant association with spot blotch resistancec Chromosome where QTL was positionedd Markers showing significant association with seedling spot blotch resistance after correction for multiple comparisons (P B 0.05)e Minor allele frequency (MAF) for individual markersf Chromosomal positions (in centiMorgans) of significantly associated DArT and SNP markers were according to Wenzl et al. (2006)
and Close et al. (2009), respectivelyg BIN locations of barley chromosomes were according to Kleinhofs and Graner (2001)h Test of individual markersi The P-value adjusted after multiple tests (experiment-wise P value) where *, **, *** indicate markers significant at the multiple
testing adjusted significance levels of P B 0.05, 0.01, 0.001, respectivelyj The marker R2 is the portion of total variation explained by the marker, not including other terms in the modelk A QTL was considered novel if no previous report has positioned a gene or QTL in this region or bin
Mol Breeding
123

Mol Breeding
123
governed by many different loci given the diversity
of genotypes in the WBDC (see below).
Evaluations of the WBDC revealed many potential
sources of spot blotch resistance that may be useful
for cultivated barley improvement. An important
question to consider is what scheme will most
effectively identify spot blotch resistance QTL in
these accessions and their utilization in breeding
programs? The standard method would be to select
diverse accessions (i.e., based on ecogeographic
origin and molecular marker diversity) exhibiting
resistance and then develop individual bi-parental
mapping populations. In previous research, three
bi-parental mapping populations were developed
from wild barley accessions that are included in the
WBDC. QTL analyses for spot blotch resistance and
other traits have been completed in these wild 9 cul-
tivated barley populations (i.e., OUH602/Harrington
[Yun et al. 2005, 2006], Damon/Harrington [Alsop
2009], and Shechem/Harrington [Alsop 2009]),
revealing from one to three QTL for seedling spot
blotch resistance in the respective populations. In
total, these three mapping populations carried only
four QTL (Rcs-3H-1-2, Rcs-5H-11, Rcs-7H-3-4/Rcs-
QTL-7H-2-4, and Rcs-7H-7), all of which mapped to
regions coincident with previously identified QTL for
seedling spot blotch resistance. Despite the develop-
ment of cost-effective, high-throughput marker sys-
tems such as DArT, QTL mapping efforts in
individual bi-parental populations (e.g., Alsop 2009)
will not reveal, in the most efficient way, the diverse
alleles present in large germplasm collections and
their chromosomal locations.
AM is an alternative strategy for mapping QTL in
germplasm collections that does not require devel-
opment of bi-parental crosses or screening genera-
tions of progeny. Since AM relies on statistical
assessments of associations between genotypes and
phenotypes, one can apply the technique to any set of
germplasm and detect QTL for as many traits that
show variation. As a prerequisite for conducting these
AM studies, we initially genotyped the WBDC with
558 non-redundant DArT� markers (Steffenson et al.
2007) and then later with [3,000 SNP markers (Roy
and Steffenson unpublished). Marker data for the
WBDC revealed a low level and rapid decay of LD to
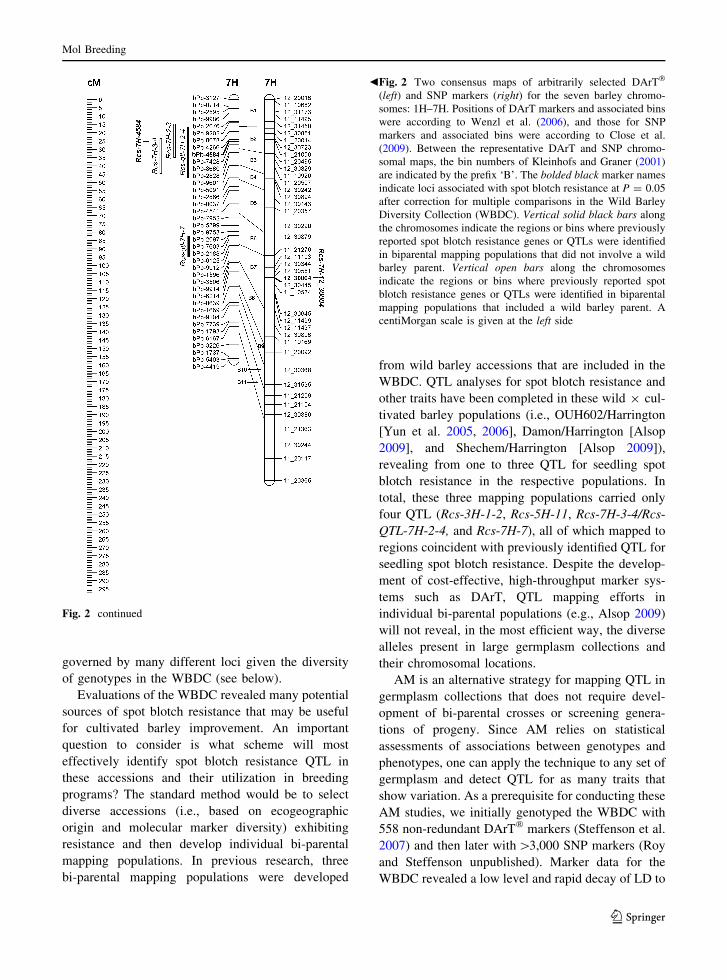
Fig. 2 Two consensus maps of arbitrarily selected DArT�
(left) and SNP markers (right) for the seven barley chromo-
somes: 1H–7H. Positions of DArT markers and associated bins
were according to Wenzl et al. (2006), and those for SNP
markers and associated bins were according to Close et al.
(2009). Between the representative DArT and SNP chromo-
somal maps, the bin numbers of Kleinhofs and Graner (2001)
are indicated by the prefix ‘B’. The bolded black marker names
indicate loci associated with spot blotch resistance at P = 0.05
after correction for multiple comparisons in the Wild Barley
Diversity Collection (WBDC). Vertical solid black bars along
the chromosomes indicate the regions or bins where previously
reported spot blotch resistance genes or QTLs were identified
in biparental mapping populations that did not involve a wild
barley parent. Vertical open bars along the chromosomes
indicate the regions or bins where previously reported spot
blotch resistance genes or QTLs were identified in biparental
mapping populations that included a wild barley parent. A
centiMorgan scale is given at the left side
b
Fig. 2 continued
Mol Breeding
123

within 1.0 cM. This LD profile can facilitate high
resolution mapping of QTL that exceeds the level
possible through standard bi-parental mapping
(Rafalski 2002). However, rapid LD decay, as in
the case of the WBDC, necessitates a high density of
markers in order to identify QTL through AM. With
the LD decay and current marker density in the
WBDC, the chances for identifying significant asso-
ciations are moderately low; yet, if ones are detected,
they likely represent close linkages between the
markers and respective QTL. In this study using 558
DArT markers (average inter-marker distance of
2.3 cM) and 2,878 SNP markers (average inter-
marker distance of 0.4 cM), we identified 13 QTL for
seedling spot blotch resistance in 318 wild barley
accessions (Table 1). Although a number of QTL were
likely not detected due to rapid LD decay and low
marker density, AM still represents a marked improve-
ment in the efficiency of identifying QTL for spot
blotch resistance over that obtained through bi-paren-
tal mapping. Moreover, the significantly associated
markers identified in this study are probably tightly
linked to the respective QTL given the level of LD
found across the genome for the WBDC accessions
(Roy and Steffenson unpublished). Such markers will
be valuable in breeding programs using marker-
assisted selection to introgress spot blotch resistance
genes.
Five of the twelve mapped QTL identified in this
study were found in the same bins where spot blotch
resistance loci were previously reported (Fig. 2). This
includes previous studies describing either qualitative
or quantitative resistance loci identified at either the
seedling or adult plant stage and in both cultivated
and wild barley (Alsop 2009; Bilgic et al. 2005;
Steffenson et al. 1996; Yun et al. 2005, 2006)
(Table 1). The chromosomal location of one QTL
could not be determined because the marker
(11_11361) showing the association has not been
mapped. The chromosome 3H QTL Rcs-qtl-3H-bPb-
1068 mapped to the same bin as one found at the
seedling stage in the Dicktoo/Morex population
(Bilgic et al. 2005). The chromosome 7H QTL Rcs-
qtl-7H-bPb-4584 mapped to the same bin as one
identified at the seedling stage in the Steptoe/Morex,
Dicktoo/Morex, Harrington/Morex, Harrington/
TR306, and OUH602/Harrington populations (Bilgic
et al. 2005; Yun et al. 2005). The second chromo-
some 7H QTL Rcs-qtl-7H-12_30004 mapped to the
same bin as one identified at the seedling stage in the
Dicktoo/Morex, Harrington/TR306, and Damon/Har-
rington populations (Alsop 2009; Bilgic et al. 2005).
The other two QTL were found in coincident bins for
adult plant resistance reported from previously
investigated populations. Specifically, QTL Rcs-qtl-
1H-bPb-2813 was identified in a bin coincident to
one reported in the Steptoe/Morex population and
QTL Rcs-qtl-2H-12_11316 in a bin coincident to one
reported in the Harrington/Morex and Damon/Har-
rington populations (Alsop 2009; Bilgic et al. 2005).
The chromosome 7H QTL Rcs-qtl-7H-bPb-4584
mapped to a bin coincident with the major effect
spot blotch resistance gene Rcs5, which has been
implicated in conferring resistance at the seedling
and/or adult plant stages in eight previously analyzed
bi-parental mapping populations (Alsop 2009; Bilgic
et al. 2005; Steffenson et al. 1996; Yun et al. 2005,
2006). While spurious associations can be a problem
in AM (Breseghello and Sorrells 2006), the number
of previously reported QTL that we have possibly
confirmed suggests false discoveries are relatively
low. In this study, we identified one of three
Fig. 3 Triangular linkage disequilibrium (LD) matrix plot of
nine DArT� markers on chromosome 1H in the Wild Barley
Diversity Collection (WBDC). The plots were produced using
pairwise R2 estimates of LD with the computer program,
Haploview (Barrett et al. 2005). In the figure, the pairwise R2
values are given inside the boxes. The solid back boxesrepresent a pairwise R2 value of 1.0
Mol Breeding
123
QTL for spot blotch resistance reported in three
wild 9 cultivated barley crosses (either seedling or
adult plant resistance: Alsop 2009; Yun et al. 2005,
2006) and also two additional ones reported in several
cultivated 9 cultivated barley crosses (Bilgic et al.
2005; Steffenson et al. 1996). Although based only on
general coincident bin mapping locations, these
results offer some validation for the effectiveness of
the AM approach. Validation of QTL identified in the
WBDC through AM also was reported by Steffenson
et al. (2007) for the rpg4/Rpg5 stem rust resistance
gene complex in two wild 9 cultivated barley pop-
ulations. Additionally, Cockram et al. (2008) vali-
dated the AM approach with the VRN-H1 and
VRN-H2 genes for flowering time that control the
vernalization requirement in barley. They also
showed discrimination between intragenic VRN-H1
markers, demonstrating the feasibility of fine map-
ping candidate genes.
The other seven QTL identified in the WBDC
appear to map at unique locations for spot blotch
resistance and may therefore represent new loci
(Table 1). While easy and fast to assay, spot blotch
resistance at the seedling stage may not be indicative
of the reaction at the adult plant stage because some
genes are known to function at specific ontogenetic
stages (Steffenson et al. 1996). Adult plant resistance
is essential for barley cultivars in North America
because spot blotch does not increase significantly
until after the crop has headed. Additional evalua-
tions of the WBDC for adult plant resistance in the
field should be completed before utilizing any
accession in the breeding program. Moreover, acces-
sions carrying putative novel alleles also should be
tested against a collection of different C. sativus
isolates in the greenhouse to determine whether they
possess broad-based resistance, as was done by Fetch
et al. (2008). The genetics of spot blotch resistance in
barley can be complex and dependent on genetic
background. For example, Bilgic et al. (2005) iden-
tified three different major effect QTL derived from
the resistant donor cultivar Morex in individual
crosses with three different susceptible parents. One
may therefore expect to see an even greater number
of spot blotch resistance loci revealed in crosses
between WBDC accessions and various breeding
lines. These loci will significantly increase the
diversity for spot blotch resistance in cultivated
barley, thereby reducing the threat of epidemics.
LD, population structure, and AM analyses for the
WBDC were conducted separately for DArT and
SNP markers. This was done for several reasons: (a)
the DArT and SNP marker maps are based on
different consensus maps where marker intervals may
not have the same degree of precision (Close et al.
2009; Wenzl et al. 2006), (b) the WBDC accessions
were assigned to different subpopulations depending
on the marker type used, and (c) we were interested in
comparing the results obtained for the two marker
types readily available to the barley research com-
munity. Of the five and eight QTL identified sepa-
rately by DArT and SNP markers (one QTL identified
with a SNP marker had an unknown mapping
location), respectively, none mapped in the same
bin for the two marker types. The fact that DArT and
SNP markers detected unique sets of QTL for spot
blotch resistance is not completely surprising. Given
the low number of DArT and SNP markers found
significantly associated with spot blotch resistance
and the very rapid LD decay in the WBDC, the
chances of identifying the same QTL with any two
markers at distinct genomic positions regardless of
type is extremely low.
As mentioned previously, LD in the WBDC is low
and decays very rapidly based on both DArT and
SNP markers (Steffenson et al. 2007; J. Roy and B.
Steffenson, unpublished). To specifically assess the
LD pattern at the identified spot blotch resistance
QTL, we investigated the association of flanking
markers. No LD was observed between nine QTL-
identifying markers and their respective flanking
markers. This result was expected because of the
rapid LD decay. For the remaining three QTL-
identifying markers, we observed moderate or strong
LD. Moderate LD was observed between the QTL-
identifying marker 11_20189 on chromosome 5H
(276.8 cM) and one flanking marker. This flanking
marker, however, was not significantly associated
with spot blotch resistance (data not shown). In
contrast, strong LD was observed between the QTL-
identifying marker bPb-2813 on chromosome 1H
(59.7 cM) and the three flanking markers bPb-0468,
bPb-7325, and bPb-7859 (Fig. 3). These same four
markers also showed strong LD with another nearby
QTL-identifying marker (bPb-2967) on chromosome
1H at 60.7 cM (Fig. 3). We considered these five
adjacent markers to be detecting the same QTL
because they have strong LD with each other and are
Mol Breeding
123
also significantly associated with spot blotch resis-
tance. In addition to the chromosome 5H and 1H LD
cases, the QTL-identifying marker on chromosome
7H at 107.4 cM (12_30004) had moderate to strong
LD with seven other markers at the same position,
two of which showed a highly significant association
with spot blotch resistance. In predominantly self-
pollinated species such Arabidopsis and rice, previ-
ous investigators have demonstrated strong LD
surrounding genes controlling flowering time and
disease resistance—in some cases extending from
tens of kb up to 1 cM (Thornsberry et al. 2001;
Hagenblad and Nordborg 2002; Nordborg et al. 2002;
Garris et al. 2003; Olsen et al. 2004). In cultivated
barley, strong LD beyond a target gene has been
observed: 212 kb at the Ha locus controlling grain
hardness (Caldwell et al. 2006); 5.5 cM at a gene
conferring resistance to the Barley Yellow Mosaic
Virus (BYMV) complex (Stracke et al. 2007); and 0.7
and 6.4 cM for the VRN-H1 and VRN-H2 loci
(Cockram et al. 2008). In this study, only one of 12
identified and mapped QTL showed strong LD up to
1.0 cM. This indicates that higher resolution mapping
can be done in the WBDC compared to other reported
studies utilizing cultivated barley collections or
populations (Cockram et al. 2008; Stracke et al.
2007). Additionally, the low LD of the WBDC can be
exploited for conducting candidate gene analyses
based on homology with Brachypodium and rice
sequences.
In this study, the R2 for all of the identified QTL
was low, ranging from 2.3 to 3.9% (Table 1). A low
R2 value (3.1%) also was found for the QTL
identified by DArT marker bPb-4584 at the putative
Rcs5 locus. Rcs5 is a major effect locus conferring
seedling and/or adult plant resistance depending on
the population studied. It was mapped as a Mendelian
locus in the Steptoe/Morex population (Steffenson
et al. 1996) and as a QTL in eight other populations
explaining from 8 to 85% of the phenotypic variation
(Alsop 2009; Bilgic et al. 2005; Steffenson et al.
1996; Yun et al. 2005, 2006). If DArT marker bPb-
4584 has indeed identified Rcs5, the low variation
explained is somewhat surprising and may be due to
several reasons. First, previous studies used crosses
with relatively small population sizes that are likely
to overestimate the effects of QTL (Beavis 1998;
Melchinger et al. 1998). Secondly, since many QTL
were identified in this study, the presence of a
resistance allele at more than one QTL in any one
accession could affect the estimate of the QTL
effects. For example, if most of the QTL identified
had a relatively large effect and most accessions
carried the resistance allele at more than one of these
loci, then the R2 for any one QTL would be lower.
In summary, the data accumulated from this study
provides a wealth of information from which to
initiate preemptive breeding efforts to reduce the
vulnerability of barley to spot blotch. The first step
would be to identify a small subset of resistant
accessions that carry resistance alleles at different
QTL. These accessions would then be used as donor
parents in a marker-assisted backcrossing scheme to
create sets of lines carrying resistance alleles at
different loci in a cultivated target background.
Further characterization of these sets of near-isogenic
lines would confirm the QTL, provide more accurate
estimates of allelic effects, and assess whether
individual QTL are equally effective against a broad
range of pathogen isolates. Finally, the closely linked
markers identified as a result of low LD in the WBDC
can be used to efficiently pyramid multiple QTL into
cultivars, thereby providing more stable spot blotch
resistance as was done for stripe rust of barley (Castro
et al. 2003).
Open Access This article is distributed under the terms of the
Creative Commons Attribution Noncommercial License which
permits any noncommercial use, distribution, and reproduction
in any medium, provided the original author(s) and source are
credited.
References
Alsop BP (2009) Linkage analysis and inheritance of multiple
disease resistance in intra-specific wild 9 cultivated bar-
ley populations. PhD dissertation, University of Minne-
sota, St. Paul
Barrett JC, Fry B, Maller J, Daly MJ (2005) Haploview:
analysis and visualization of LD and haplotype maps.
Bioinformatics 21:263–265
Beavis WB (1998) QTL analyses: power, precision, and
accuracy. In: Patterson AH (ed) Molecular dissection of
complex traits. CRC Press, Boca Raton
Bilgic H, Steffenson BJ, Hayes P (2005) Differential expres-
sion of seedling and adult plant resistance to spot blotch in
different genetic backgrounds of barley. Theor Appl
Genet 111:1238–1250
Bilgic H, Steffenson BJ, Hayes P (2006) Molecular mapping of
loci conferring resistance to different pathotypes of the
spot blotch pathogen in barley. Phytopathol 96:699–708
Mol Breeding
123
Bonman JM, Bockelman HE, Jackson LF, Steffenson BJ
(2005) Disease and insect resistance in cultivated barley
accessions from the USDA National Small Grains Col-
lection. Crop Sci 45:1271–1280
Box GEP, Cox DR (1964) An analysis of transformations. J R
Stat Soc Ser B 26:211–252
Breseghello F, Sorrells ME (2006) Association mapping of
kernel size and milling quality in wheat (Triticum aes-tivum L.) cultivars. Genetics 172:1165–1177
Buntjer JB, Sorensen AP, Peleman JD (2005) Haplotype
diversity: the link between statistical and biological
association. Trends Plant Sci 10:466–471
Caldwell KS, Russell J, Langridge P, Powell W (2006)
Extreme population-dependent linkage disequilibrium
detected in an inbreeding plant species, Hordeum vulgare.
Genetics 172:557–567
Castro AJ, Chen X, Hayes P, Johnston M (2003) Pyramiding
quantitative trait locus (QTL) alleles determining resis-
tance to barley stripe rust. Crop Sci 43:651–659
Clark RV (1979) Yield losses in barley cultivars caused by spot
blotch. Can J Plant Pathol 1:113–117
Close TJ, Bhat PR, Lonardi S, Wu Y, Rostoks N, Ramsay L,
Druka A, Stein N et al (2009) Development and imple-
mentation of high-throughput SNP genotyping in barley.
BMC Genomics 10:582
Cockram J, White J, Leigh FJ, Lea VJ, Chiapparino E, Laurie
DA, Mackay IJ, Powell W, O’Sullivan DM (2008)
Association mapping of partitioning loci in barley. BMC
Genet 9:16
Ellis RP, Forster BP, Robinson D, Handley LL, Gordon DC,
Russell JR, Powell W (2000) Wild barley: a source of
genes for crop improvement in the 21st century? J Exp
Bot 51:9–17
Falush D, Stephens M, Pritchard JK (2003) Inference of pop-
ulation structure using multilocus genotype data: linked
loci and correlated allele frequencies. Genetics 164:1567–
1587
Falush D, Stephens M, Pritchard JK (2007) Inference of pop-
ulation structure using multilocus genotype data: domi-
nant markers and null alleles. Mol Ecol Notes 7:574–578
Fan JB, Oliphant A, Shen R, Kermani BG, Garcia F, Gun-
derson KL, Hansen M, Steemers F et al (2003) Highly
parallel SNP genotyping. Cold Spring Harb Symp Quant
Biol 68:69–78
Fan JB, Gunderson KL, Bibikova M, Yeakley JM, Chen J,
Wickham Garcia E, Lebruska LL, Laurent M, Shen R,
Barker D (2006) Illumina universal bead arrays. Methods
Enzymol 410:57–73
Fetch TG Jr, Steffenson BJ (1994) Identification of Cochlio-bolus sativus isolates expressing differential virulence on
two-row barley genotypes from North Dakota. Can J Plant
Pathol 16:202–206
Fetch TG Jr, Steffenson BJ (1999) Rating scales for assessing
infection responses of barley infected with Cochliobolussativus. Plant Dis 83:213–217
Fetch TG Jr, Steffenson BJ, Nevo E (2003) Diversity and
sources of multiple disease resistance in Hordeum spon-taneum. Plant Dis 87:1439–1448
Fetch TG Jr, Steffenson BJ, Bockelman HE, Wesenberg DM
(2008) Spring barley accessions with dual spot blotch and
net blotch resistance. Can J Plant Pathol 30:534–542
Garris AJ, McCouch SR, Kresovich S (2003) Population
structure and its effect on haplotype diversity and linkage
disequilibrium surrounding the xa5 locus of rice (Oryzasativa L.). Genetics 165:759–769
Ghazvini H, Tekauz A (2007) Virulence diversity in the pop-
ulation of Bipolaris sorokiniana. Plant Dis 91:814–821
Gupta PK, Rustgi S, Kulwal PL (2005) Linkage disequilibrium
and association studies in higher plants: present status and
future prospects. Plant Mol Biol 57:461–485
Hagenblad J, Nordborg M (2002) Sequence variation and
haplotype structure surrounding the flowering time locus
FRI in Arabidopsis thaliana. Genetics 161:289–298
Hardy J, Singleton A (2009) Genomewide association studies
and human disease. N Engl J Med 360:1759–1768
Jaccoud D, Peng K, Feinstein D, Kilian A (2001) Diversity
arrays: a solid state technology for sequence information
independent genotyping. Nucleic Acids Res 29:e25
Kleinhofs A, Graner A (2001) An integrated map of the barley
genome. In: Phillips RL, Vasil IK (eds) DNA-based
markers in plants, 2nd edn. Kluwer, Dordrecht, pp 187–
199
Lander ES, Botstein D (1986) Strategies for studying hetero-
geneous genetic traits in humans by using a linkage map
of restriction fragment length polymorphisms. Proc Natl
Acad Sci USA 83:7353–7357
Melchinger AE, Utz HF, Schon CC (1998) Quantitative trait
locus (QTL) mapping using different testers and inde-
pendent population samples in maize reveals low power
of QTL detection and large bias in estimates of QTL
effects. Genetics 149:383–403
Nordborg M, Borevitz JO, Bergelson J, Berry CC, Chory J,
Hagenblad J, Kreitman M, Maloof JN, Noyes T, Oefner
PJ, Stahl EA, Weigel D (2002) The extent of linkage
disequilibrium in Arabidopsis thaliana. Nat Genet
30:190–193
Nutter FW Jr, Pederson VD, Foster AE (1985) Effects of
inoculations with Cochliobolus sativus at specific growth
stages on grain yield and quality of malting barley. Crop
Sci 25:933–938
Oliphant A, Barker DL, Stuelpnagel JR, Chee MS (2002)
BeadArray technology: enabling an accurate, cost-effec-
tive approach to high-throughput genotyping. Biotech
Suppl 5:6–58
Olsen KM, Halldorsdottir SS, Stinchcombe JR, Weinig C,
Schmitt J, Purugganan MD (2004) Linkage disequilibrium
mapping of Arabidopsis Cry2 flowering time alleles.
Genetics 167:1361–1369
Pallotta MA, Warner P, Fox RL, Kuchel H, Jefferies SJ,
Langridge P (2003) Marker assisted wheat breeding in the
southern region of Australia. In: Pogna NE, Romano M,
Pogna EA, Galterio Z (eds) Proceedings of the 10th
International Wheat Genetics Symposium, Paestum, pp
789–791
Pritchard JK, Stephens M, Donnelly P (2000) Inference of
population structure using multilocus genotype data.
Genetics 155:945–959
Rafalski A (2002) Applications of single nucleotide polymor-
phisms in crop genetics. Curr Opin Plant Biol 5:94–100
Shakhatreh Y, Haddad N, Alrababah M, Grando S, Ceccarelli S
(2009) Phenotypic diversity in wild barley (Hordeumvulgare L. ssp. spontaneum (C. Koch) Thell.) accessions
Mol Breeding
123

collected in Jordan. Genet Resour Crop Evol. doi:
10.1007/s10722-009-9457-8
Steffenson BJ, Hayes PM, Kleinhofs A (1996) Genetics of
seedling and adult plant resistance to net blotch (Pyren-ophora teres f. teres) and spot blotch (Cochliobolus sat-ivus) in barley. Theor Appl Genet 92:552–558
Steffenson BJ, Olivera P, Roy JK, Jin Y, Smith KP, Mu-
ehlbauer GJ (2007) A walk on the wild side: mining wild
wheat and barley collections for rust resistance genes.
Aust J Agric Res 58:532–544
Stracke S, Presterl T, Stein N, Perovic D, Ordon F, Graner A
(2007) Effects of introgression and recombination on
haplotype structure and linkage disequilibrium surround-
ing a locus encoding Bymovirus resistance in barley.
Genetics 175:805–817
Thornsberry JM, Goodman MM, Doebley J, Kresovich S,
Nielsen D, Buckler ES IV (2001) Dwarf8 polymorphisms
associate with variation in flowering time. Nat Genet
28:286–289
Valjavec-Gratian M, Steffenson BJ (1997) Pathotypes of
Cochliobolus sativus on barley in North Dakota. Plant Dis
81:1275–1278
von Bothmer R, Sato K, Kamatsuda T, Yasuda S, Fischbeck G
(2003) The domestication of cultivated barley. In: von
Bothmer R, van Hintum T, Knupffer H, Sato K (eds)
Diversity in barley (Hordeum vulgare). Elsevier,
Amsterdam, pp 9–27
Wenzl P, Carling J, Kudrna D, Jaccoud D, Huttner E, Klein-
hofs A, Kilian A (2004) Diversity arrays technology
(DArT) for whole-genome profiling of barley. Proc Natl
Acad Sci USA 101:9915–9920
Wenzl P, Li H, Carling J, Zhou M, Raman H, Paul E, Hearnden
P, Maier C, Xia L, Caig V et al (2006) A high-density
consensus map of barley linking DArT markers to SSR,
RFLP and STS loci and agricultural traits. BMC
Genomics 7:206
Wilcoxson RD, Rasmusson DC, Miles MR (1990) Develop-
ment of barley resistant to spot blotch and genetics of
resistance. Plant Dis 74:207–210
Yu J, Buckler ES (2006) Genetic association mapping and
genome organization of maize. Curr Opin Biotechnol
17:155–160
Yu J, Pressoir G, Briggs WH, Vroh Bi I, Yamasaki M, Doebley
JF, McMullen MD, Gaut BS, Nielsen DM, Holland JB,
Kresovich S, Bucker ES (2005) A unified mixed-model
method for association mapping that accounts for multiple
levels of relatedness. Nat Genet 38:203–208
Yun S-Y, Gyenis L, Hayes PM, Matus I, Smith KP, Steffenson
BJ, Muehlbauer GJ (2005) Quantitative trait loci for
multiple disease resistance in wild barley. Crop Sci
45:2563–2572
Yun SJ, Gyenis L, Bossolini E, Hayes PM, Matus I, Smith KP,
Steffenson BJ, Tuberosa R, Muehlbauer GJ (2006) Vali-
dation of quantitative trait loci for multiple disease
resistance in barley using advanced backcross lines
developed with a wild barley. Crop Sci 46:1179–1186
Zhu C, Gore M, Buckler ES, Yu J (2008) Status and prospects
of association mapping in plants. Plant Genome 1:5–20
Mol Breeding
123