Embed Size (px)
Citation preview

RESEARCH ARTICLE
Association between physicians’ interaction
with pharmaceutical companies and their
clinical practices: A systematic review and
meta-analysis
Hneine Brax1☯‡, Racha Fadlallah2☯‡, Lina Al-Khaled3, Lara A. Kahale4, Hala Nas5, Fadi El-
Jardali2,6,7, Elie A. Akl2,4,7*
1 Faculty of Medicine, Universite Saint Joseph, Beirut, Lebanon, 2 Center for Systematic Reviews of Health
Policy and Systems Research (SPARK), American University of Beirut, Beirut, Lebanon, 3 Department of
Pediatrics and Adolescent Medicine, Faculty of Medicine, American University of Beirut, Beirut, Lebanon,
4 Department of Internal Medicine, American University of Beirut, Beirut, Lebanon, 5 Faculty of Medicine,
University of Damascus, Damascus, Syria, 6 Department of Health Management and Policy, American
University of Beirut, Beirut, Lebanon, 7 Department of Clinical Epidemiology and Biostatistics, McMaster
University, Hamilton, ON, Canada
☯ These authors contributed equally to this work.
‡ These authors are first authors on this work.
Abstract
Background
Pharmaceutical company representatives likely influence the prescribing habits and profes-
sional behaviors of physicians. The objective of this study was to systematically review the
association between physicians’ interactions with pharmaceutical companies and their clini-
cal practices.
Methods
We used the standard systematic review methodology. Observational and experimental
study designs examining any type of targeted interaction between practicing physicians and
pharmaceutical companies were eligible. The search strategy included a search of MED-
LINE and EMBASE databases up to July 2016. Two reviewers selected studies, abstracted
data, and assessed risk of bias in duplicate and independently. We assessed the quality of
evidence using the GRADE approach.
Results
Twenty articles reporting on 19 studies met our inclusion criteria. All of these studies were
conducted in high-income countries and examined different types of interactions, including
detailing, industry-funded continuing medical education, and receiving free gifts. While all
included studies assessed prescribing behaviors, four studies also assessed financial out-
comes, one assessed physicians’ knowledge, and one assessed their beliefs. None of the
studies assessed clinical outcomes. Out of the 19 studies, 15 found a consistent association
PLOS ONE | https://doi.org/10.1371/journal.pone.0175493 April 13, 2017 1 / 28
a1111111111
a1111111111
a1111111111
a1111111111
a1111111111
OPENACCESS
Citation: Brax H, Fadlallah R, Al-Khaled L, Kahale
LA, Nas H, El-Jardali F, et al. (2017) Association
between physicians’ interaction with
pharmaceutical companies and their clinical
practices: A systematic review and meta-analysis.
PLoS ONE 12(4): e0175493. https://doi.org/
10.1371/journal.pone.0175493
Editor: James M. Wright, University of British
Columbia, CANADA
Received: October 17, 2016
Accepted: March 27, 2017
Published: April 13, 2017
Copyright: © 2017 Brax et al. This is an open
access article distributed under the terms of the
Creative Commons Attribution License, which
permits unrestricted use, distribution, and
reproduction in any medium, provided the original
author and source are credited.
Data Availability Statement: All relevant data are
within the paper and its Supporting Information
files.
Funding: The authors received no specific funding
for this work.
Competing interests: The authors have declared
that no competing interests exist.

between interactions promoting a medication, and inappropriately increased prescribing
rates, lower prescribing quality, and/or increased prescribing costs. The remaining four stud-
ies found both associations and lack of significant associations for the different types of
exposures and drugs examined in the studies. A meta-analysis of six of these studies found
a statistically significant association between exposure and physicians’ prescribing behav-
iors (OR = 2.52; 95% CI 1.82–3.50). The quality of evidence was downgraded to moderate
for risk of bias and inconsistency. Sensitivity analysis excluding studies at high risk of bias
did not substantially change these results. A subgroup analysis did not find a difference by
type of exposure.
Conclusion
There is moderate quality evidence that physicians’ interactions with pharmaceutical com-
panies are associated with their prescribing patterns and quality.
Introduction
Promotional activities within pharmaceutical industries were relatively high in the past few
years. In 2012, the pharmaceutical industry in the USA spent more than US$27 billion on drug
promotion [1]. In Canada, promotional activities were estimated to cost US$30000 per physi-
cian per year [2]. Pharmaceutical companies appear to spend much more on promotion than
they do on research and development (R&D) [3]. For example, a study based on annual reports
of pharmaceutical companies found that ten of the largest global pharmaceutical companies
spent a total of US$739 billion on ‘marketing and administration’ between 1996 and 2005
compared to US$288 billion on R&D for the same period [3].
The industry claims that the promotional activities aim to provide health care professionals
with scientific and educational information [4]. Also, surveys suggest that many physicians
believe that marketing does not influence their prescribing habits or acknowledge that it may
have an influence on some physicians but not on themselves [5–7]. Despite these claims, there
is evidence suggesting that the interaction of pharmaceutical companies with physicians may
have a negative effect on their clinical practice [8–11].
The last identified systematic review assessing the interaction of pharmaceutical com-
panies with physicians was published by Spurling et al. in 2010. The population under
study included both physicians in practice and residents in training [11]. The review
found high degrees of heterogeneity that may have been due to the diverse populations
under study (i.e., both practicing and in-training physicians). The review by Spurling et al.
could not reach definitive conclusions about the degree to which information from phar-
maceutical companies decreases, increases or has no effect on the quality, cost or fre-
quency of prescribing.
Since the publication of Spurling’s review, at least eight original studies have been published
[12–19]. One of these was a large study of the association between physicians’ receipt of meals
from industry and the rates of prescribing the promoted drug to Medicare patients [15]. That
study appears to be at lower risk of bias than the previously published studies, and thus would
contribute the improving the quality of the evidence. Therefore, the objective of our study was
to systematically review the association between physicians’ interactions with pharmaceutical
companies and their clinical practice.
Association between physician-pharmaceutical companies interactions and clinical practices
PLOS ONE | https://doi.org/10.1371/journal.pone.0175493 April 13, 2017 2 / 28
Methods
Protocol
We followed a detailed methodology that we describe in the protocol included in S1 Appendix.
The review followed the Preferred Reporting Items for Systematic Reviews and Meta-Analyses
(PRISMA) guidelines (S2 Appendix).
Eligibility criteria
The inclusion criteria were:
• Type of study design: observational design (e.g., cohort, time series analysis, before-after
design, case control, cross sectional), and experimental design (non-randomized controlled
trials, and randomized controlled trials);
• Type of participants: practicing physicians as defined in the primary studies
• Type of exposure: targeted interaction between physicians and pharmaceutical companies,
where there is direct interaction with the physician. Direct interactions could include indi-
vidual invitation to a continuing medical education (CME) event; active presentation of
industry-related information to the physician; or provision of gifts to the individual;
• Type of control: either no interaction or a lower level of interaction. The intention was to
capture studies that stratified the levels of interaction of physicians with medical representa-
tives, e.g., according to the number of visits within a specified period of time.
• Types of outcomes:
� Knowledge of physicians (e.g., accuracy of knowledge related to a specific medication);
� Attitude of physicians (e.g., perceived influence of information from pharmaceutical
company on their behavior);
� Behavior of physicians (e.g., prescribing quality; prescribing quantity/frequency; reliance
on pharmaceutical companies for drug information; giving drug sample to patients; sub-
mitting a formulary request for a drug made by a specific company);
� Financial outcomes (e.g., patient out of pocket expenses; prescription costs);
� Patients’ clinical outcomes.
The exclusion criteria were:
• Qualitative studies, ecological studies, econometric studies, editorials, letters to the editor,
and non-English studies.
• Studies focusing on medical students and physicians in training.
• Studies assessing the relationship between attitudes and behavior
• Studies assessing non-targeted interactions (e.g., journal advertisement) and research
funding
• Studies assessing interventions to share industry-independent drug information or interven-
tions to reduce interactions between physicians and pharmaceutical companies. The latter
has been addressed in a recent systematic review [20].
We did not exclude studies based on date of publication. We did not exclude any study
based on risk of bias. Instead, we conducted sensitivity analyses excluding studies at high risk
Association between physician-pharmaceutical companies interactions and clinical practices
PLOS ONE | https://doi.org/10.1371/journal.pone.0175493 April 13, 2017 3 / 28

of bias, and also took risk of bias into account when grading the quality of evidence using
GRADE approach.
Search strategy
We used OVID interface to electronically search MEDLINE and EMBASE in July 2016. The
search included both free text words and medical subject headings. It combined terms for phy-
sicians and pharmaceutical industry and did not use any search filter. A medical librarian
assisted with designing the search strategy (see supporting file S3 Appendix for full search
strategy). In addition, we reviewed the references lists of included and relevant primary studies
and literature reviews.
Selection of studies
Two reviewers screened the title and abstracts of identified citations for potential eligibility in
duplicate and independently. We retrieved the full text for citations considered potentially eli-
gible by at least one of the two reviewers. The two reviewers then screened the full texts in
duplicate and independently for eligibility. The reviewers resolved disagreement by discussion
or with the help of a third reviewer. They conducted calibration exercises and used a standard-
ized and pilot tested screening form.
Data collection
Two reviewers abstracted data from eligible studies using a standardized and pilot tested
screening form with detailed written instructions. When needed, disagreement was resolved
with the help of a third reviewer. The data abstracted included: type of study, funding source,
characteristics of the population, exposure, outcomes assessed, and statistical data. For studies
including both attending physicians and residents, we attempted to contact authors for data
relating to the former group.
Assessment of risk of bias in included studies
Two reviewers assessed the risk of bias in each eligible study in duplicate and independently.
They resolved disagreements by discussion or with the help of a third reviewer. We used the
tool suggested by the GRADE working group for assessing the risk of bias for observational
studies [21].
We calculated the risk of bias using the following criteria:
• Failure to develop and apply appropriate eligibility criteria (e.g., no clear eligibility criteria,
convenient sampling, under- or over-matching in case-control studies, selection of exposed
and unexposed in cohort studies from different populations, and low response rate (<60%)
with no attempts to compare non-respondents to respondents) [22].
• Flawed measurement of exposure (e.g., differences in measurement of exposure such as
recall bias in case- control studies, and subjective or self-reported assessment of exposure)
• Flawed measurement of outcome (e.g., differential surveillance for outcome in exposed and
unexposed in cohort studies, and subjective or self-reported assessment of outcome)
• Failure to adequately control confounding (e.g., failure of accurate measurement of all
known prognostic factors, absence of control group in a before-after study, failure to match
for prognostic factors and/or adjustment in statistical analysis
• Incomplete follow-up or failure to control for loss-to-follow up
Association between physician-pharmaceutical companies interactions and clinical practices
PLOS ONE | https://doi.org/10.1371/journal.pone.0175493 April 13, 2017 4 / 28

We graded each potential source of bias as high, low or unclear risk of bias. We used
unclear when the authors did not report enough information for us to make the judgment.
Data synthesis
We calculated the kappa statistic to assess the agreement between reviewers for full text
screening.
We conducted a meta-analysis to pool the results across studies for the association between
‘targeted interactions with physicians’ as the exposure of interest, and ‘changes in physician
prescribing behavior’ as the outcome of interest. We contacted the authors of studies that
appeared to have measured the outcome and exposure of interest, but did not report data
(such as odds ratio or standard error) that we could include directly. We received responses
from authors of 7 out of 9 relevant studies. The authors provided us with the needed informa-
tion for only two out of the seven studies. Please refer to S1 Table for a summary of author
contacts.
We used the following a priori plan for choosing which data to include in the meta-
analysis:
• For studies reporting on more than one type of exposure (e.g., gifts, detailing), we treated
each exposure as a separate unit of analysis.
• For studies measuring the same outcome at several points in time, we chose the first time
point to avoid any potential confounding effects from subsequent measures.
• For studies assessing the association of interest for more than one drug (i.e., reporting more
than one association), we included the value that is the closest to the mean of all reported val-
ues amongst those associations.
We used the generic inverse variance technique with a random-effects model to pool the
association measures across included studies that reported the needed statistical data. We car-
ried out statistical analysis using RevMan (version 5.2).
To take into account the heterogeneity introduced by the different types of exposures (i.e.,
gifts, detailing, and CME), we stratified the meta-analyses by type of exposure. We tested the
results for homogeneity using the I2 test and considered heterogeneity present if I2 exceeded
50%.
In addition, we conducted three post-hoc sensitivity analyses by respectively excluding:
• Studies at high risk of bias;
• Studies funded by pharmaceutical industry;
• Studies measuring the outcome of interest as ‘changes in generic prescription’ or ‘formulary
request’ (as these were considered indirect measures compared with the ‘changes in the pre-
scribing of promoted drug’).
Although we had planned to construct funnel plots to assess publication bias, the number
of included studies in the meta-analyses was too low to allow for that. Indeed, funnel plots are
encouraged for interventions that include at least 10 studies, with a substantially higher num-
ber required if significant heterogeneity is present.[23].
We used the GRADE approach to assess the quality of the body of evidence [21]. The
GRADE methodology involves rating the initial quality of evidence for an association as high
(with observational data), followed by downgrading based on five criteria (risk of bias, incon-
sistency, imprecision, indirectness and publication bias), and upgrading based on three criteria
(large effect size, dose-response gradient, and plausible confounding) [24].
Association between physician-pharmaceutical companies interactions and clinical practices
PLOS ONE | https://doi.org/10.1371/journal.pone.0175493 April 13, 2017 5 / 28

We narratively reported any additional results that we were not able to include in the meta-
analysis from eligible studies (this includes studies that could have contributed data to the
meta-analysis). Whenever provided, we included the p-value to denote significance of results.
Results
Selection of studies
Fig 1 shows the study flow. Of the 12, 400 article titles identified by the electronic literature
search, 20 articles reporting on 19 studies met our inclusion criteria (two articles reported on
different outcomes for the same study) [25, 26]. A list of the excluded studies along with rea-
sons for exclusion is provided in S2 Table. The kappa statistic value for full text screening was
0.89, suggesting high levels of agreement.
Characteristics of included studies
Table 1 shows the characteristics of the 19 included studies. The design for the majority of stud-
ies was cross-sectional (n = 13). Four studies reported using pre-post study designs, [17, 27–29]
one was a retrospective cohort study [12] and one was a nested case-control study [30]. The
sample sizes in these studies varied between 10 and 279, 669 with a median of 206. One study
did not provide adequate information on the exact sample size [18]. The included studies were
conducted in the USA (n = 13), Australia (n = 1), Spain (1), Denmark (n = 1), Germany (n = 1)
and the Netherlands (n = 2). The publication year ranged from 1972 to 2016. The specialties of
the physicians in the majority of studies were primary care (including general practitioners,
family medicine, internal medicine) (n = 8); obstetrics and gynecology (OB/GYN) (n = 1); der-
matologists (n = 1); mix (n = 3); and unclear (n = 6). The types of exposure assessed were sales
representatives’ visits or detailing (n = 10), industry-funded continuing medical education
including travel funds (n = 4), and receiving free gifts (e.g. drug samples, meals, gifts in the
form of office stationery, and grants and payments) (n = 11). One study assessed a mix of expo-
sures without reporting data specific to each exposure [31]. The types of outcomes assessed
were physicians’ prescribing behaviors (n = 19), physicians’ beliefs (n = 1), physicians’ knowl-
edge (n = 1) and financial outcomes (n = 4). Physicians’ prescribing behavior was defined as the
changes in quantity or quality of prescriptions. None of the studies assessed clinical outcomes.
Risk of bias
The detailed judgments about each risk of bias item for included studies are displayed in
Table 2. Fig 2 shows the corresponding risk of bias summary for these studies. For the majority
of the studies, the risk of bias was judged to be low for ‘appropriate eligibility criteria’, ‘mea-
surement of intervention’, and ‘measurement of outcome’, except for the ‘completeness of
data’ that was judged as unclear. For ‘controlling for confounding’ the risk of bias was judged
as low for nine studies, unclear for four studies, and high for six studies.
Findings of studies
Table 3 provides a summary of the outcomes and the statistical results reported for each
included study. Out of the 19 included studies, six reported data in a format that could be
included in the meta-analysis of the association between the exposure and the behavior (i.e.,
reported odds ratio or risk ratio or provided raw data allowing the calculation of an odds ratio)
[15, 17, 19, 27, 28, 30]. Below, we present the results of those six studies and their meta-analy-
sis. We then narratively report any additional results that we were unable to include in the
meta-analysis from eligible studies.
Association between physician-pharmaceutical companies interactions and clinical practices
PLOS ONE | https://doi.org/10.1371/journal.pone.0175493 April 13, 2017 6 / 28

Results of the meta-analysis
The study design of the six included studies were retrospective (n = 2), nested-case control
(n = 1), pre-post (n = 1) and cross-sectional studies (n = 2). These studies assessed the follow-
ing types of interactions (with some studies reporting on more than one type): detailing
Fig 1. Study flowchart showing the selection process.
https://doi.org/10.1371/journal.pone.0175493.g001
Association between physician-pharmaceutical companies interactions and clinical practices
PLOS ONE | https://doi.org/10.1371/journal.pone.0175493 April 13, 2017 7 / 28

Table 1. Characteristics of included studies.
Study Name Study Design Participants Exposure Control Outcomes
Becker 1972
[34]
Cross sectional survey with
self-administered
questionnaire
29 general practitioners, 5
osteopaths and 3 internists in
a mid-Atlantic state
Use of detail men as sources
of prescribing information
concerning new drugs.
No use of detail men as
sources of prescribing
information for new drugs.
Behavior: appropriateness
and prescribing pattern of
physicians.
Haayer, 1982
[31]
A cross-sectional study;
self-administered
questionnaire in September
1979,
118 general practitioners in
Twente, Netherlands
A mix of exposures:
“manufacturer’s
representatives, drug
companies’ mailings, use of
samples, drug companies’
journals, drug firm meetings”
Lower levels of exposure Behavior: rational prescribing
of physicians based on their
responses to eight common-
practice case-histories
Bowman, 1988
[27]
A pre-post survey study 197 physician participants,
with 121 (61.4%) returning
matched forms (course III);
setting not clear
Attendance of continuing
medical education courses,
subsidized heavily by a single
but different drug company
Period prior to attending
course III
Behavior: changes in rates of
prescribing by physicians of
course-related drugs
(immediately prior to six
months after each course)
Peay, 1988 [37] A cross-sectional survey
between October and
December 1981
124 specialists and general
practitioners in private
practice in one (or both) of two
geographical areas in the
vicinity of a major Australian
city
• Contact with detail men
regarding the drug
• Receiving a sample of the
drug
Lower levels of exposure • Behavior: prescription of
temazepam routinely in
preference to alternatives, the
timing of prescription of
temazepam
• Knowledge: awareness of
physician about the drug being
promoted
Orlowski, 1992
[29]
Pre-post study (Data
collected between 1987
and 1989)
Physicians from one major
medical center (1006 bed); no
further information provided.
(10 physicians attended the
symposium on drug A and 10
attended symposium on drug
B)
All-expenses-paid trip to an
attractive resort for the
physician and a significant
other to attend a symposium
on one of the company’s
drugs. One symposium was
on drug A, a new intravenous
antibiotic, and another was on
drug B, a new intravenous
cardiovascular drug.
• Control 1: physicians
prior to attending the
symposia
• Control 2: hospitals with
more than 500 beds and
major medical centers that
used the two drugs but
were not exposed to
symposium
Behavior: physician
prescribing patterns of two
drugs (approximately 22
months) before and
(approximately 17 months)
after the expense-paid trips.
Chren, 1994 [30] Nested case-control study 120 full-time attending
physicians at the University
Hospitals of Cleveland (874
bed); 105 participated (36
cases and 69 controls)
• Pharmaceutical sales
representative visits;
• Acceptance of money to
attend symposia;
• Acceptance of money to
speak at symposia
No exposure Behavior: Physicians’
formulary request for a drug
made by a specific company
Figueiras 2000
and Caamano
2002[25, 26]
A cross sectional study
(Data collected using a
60-item self-administered
mail questionnaire. The first
questionnaire was mailed
out in October, 1992)
405 primary care physicians
in Galicia, Northwest Spain; of
those 234 physicians
responded
• Utilization of information
obtained from visiting sales
representatives measured with
a dichotomous yes/no variable
• Number of sale
representatives’ visits per
week
• Lower levels of exposure
(sale representatives’ visits
per week)
• No utilization of
information obtained from
visiting sales
representatives measured
• Behavior: quality of drug
prescribed, reflected via 3
indicators combined to
produce a global indicator
variable. Indicators included:
“% of drugs prescribed with no
controlled trials for their
efficacies; % of drugs
prescribed of therapeutic use
not elevated in PC; and % of
drugs not included in the 1992
formulary for PC “
• Financial outcome:
expenditure by physician
Mizik, 2004[35] “Pooled time series cross-
sectional study” covering a
24-month period
Panel data comprising 74,075
individual physicians
Sales representative visits per
month Receiving free drug
samples (per month)
Lower levels of exposure Behavior: number of new
prescriptions issued by a
physician per month for three
studied drugs
Muijrers, 2005
[36]
A cross-sectional survey
(Data collected using a
questionnaire in 2001)
324 GPs in solo practices in
the south of the Netherlands
(out of 1434 GPs included in
an initial survey; those in non-
solo practices were excluded)
Visits by pharmaceutical
industry representatives
measured as the number of
visits per month.
Lower levels of exposure Behavior: quality of
prescribing measured as
‘adherence to guidelines’
calculated as a weighted
average score on 20
prescribing indicators based on
general practice guidelines of
the Dutch College of General
Practitioners.
(Continued)
Association between physician-pharmaceutical companies interactions and clinical practices
PLOS ONE | https://doi.org/10.1371/journal.pone.0175493 April 13, 2017 8 / 28
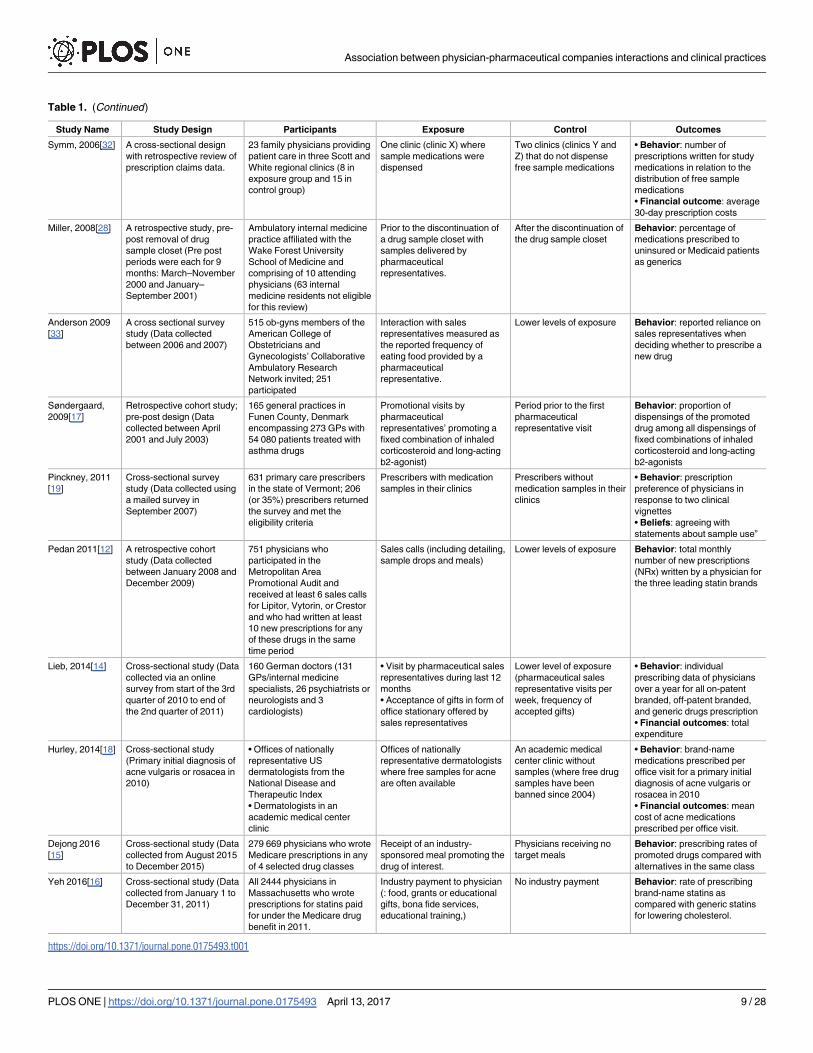
Table 1. (Continued)
Study Name Study Design Participants Exposure Control Outcomes
Symm, 2006[32] A cross-sectional design
with retrospective review of
prescription claims data.
23 family physicians providing
patient care in three Scott and
White regional clinics (8 in
exposure group and 15 in
control group)
One clinic (clinic X) where
sample medications were
dispensed
Two clinics (clinics Y and
Z) that do not dispense
free sample medications
• Behavior: number of
prescriptions written for study
medications in relation to the
distribution of free sample
medications
• Financial outcome: average
30-day prescription costs
Miller, 2008[28] A retrospective study, pre-
post removal of drug
sample closet (Pre post
periods were each for 9
months: March–November
2000 and January–
September 2001)
Ambulatory internal medicine
practice affiliated with the
Wake Forest University
School of Medicine and
comprising of 10 attending
physicians (63 internal
medicine residents not eligible
for this review)
Prior to the discontinuation of
a drug sample closet with
samples delivered by
pharmaceutical
representatives.
After the discontinuation of
the drug sample closet
Behavior: percentage of
medications prescribed to
uninsured or Medicaid patients
as generics
Anderson 2009
[33]
A cross sectional survey
study (Data collected
between 2006 and 2007)
515 ob-gyns members of the
American College of
Obstetricians and
Gynecologists’ Collaborative
Ambulatory Research
Network invited; 251
participated
Interaction with sales
representatives measured as
the reported frequency of
eating food provided by a
pharmaceutical
representative.
Lower levels of exposure Behavior: reported reliance on
sales representatives when
deciding whether to prescribe a
new drug
Søndergaard,
2009[17]
Retrospective cohort study;
pre-post design (Data
collected between April
2001 and July 2003)
165 general practices in
Funen County, Denmark
encompassing 273 GPs with
54 080 patients treated with
asthma drugs
Promotional visits by
pharmaceutical
representatives’ promoting a
fixed combination of inhaled
corticosteroid and long-acting
b2-agonist)
Period prior to the first
pharmaceutical
representative visit
Behavior: proportion of
dispensings of the promoted
drug among all dispensings of
fixed combinations of inhaled
corticosteroid and long-acting
b2-agonists
Pinckney, 2011
[19]
Cross-sectional survey
study (Data collected using
a mailed survey in
September 2007)
631 primary care prescribers
in the state of Vermont; 206
(or 35%) prescribers returned
the survey and met the
eligibility criteria
Prescribers with medication
samples in their clinics
Prescribers without
medication samples in their
clinics
• Behavior: prescription
preference of physicians in
response to two clinical
vignettes
• Beliefs: agreeing with
statements about sample use”
Pedan 2011[12] A retrospective cohort
study (Data collected
between January 2008 and
December 2009)
751 physicians who
participated in the
Metropolitan Area
Promotional Audit and
received at least 6 sales calls
for Lipitor, Vytorin, or Crestor
and who had written at least
10 new prescriptions for any
of these drugs in the same
time period
Sales calls (including detailing,
sample drops and meals)
Lower levels of exposure Behavior: total monthly
number of new prescriptions
(NRx) written by a physician for
the three leading statin brands
Lieb, 2014[14] Cross-sectional study (Data
collected via an online
survey from start of the 3rd
quarter of 2010 to end of
the 2nd quarter of 2011)
160 German doctors (131
GPs/internal medicine
specialists, 26 psychiatrists or
neurologists and 3
cardiologists)
• Visit by pharmaceutical sales
representatives during last 12
months
• Acceptance of gifts in form of
office stationary offered by
sales representatives
Lower level of exposure
(pharmaceutical sales
representative visits per
week, frequency of
accepted gifts)
• Behavior: individual
prescribing data of physicians
over a year for all on-patent
branded, off-patent branded,
and generic drugs prescription
• Financial outcomes: total
expenditure
Hurley, 2014[18] Cross-sectional study
(Primary initial diagnosis of
acne vulgaris or rosacea in
2010)
• Offices of nationally
representative US
dermatologists from the
National Disease and
Therapeutic Index
• Dermatologists in an
academic medical center
clinic
Offices of nationally
representative dermatologists
where free samples for acne
are often available
An academic medical
center clinic without
samples (where free drug
samples have been
banned since 2004)
• Behavior: brand-name
medications prescribed per
office visit for a primary initial
diagnosis of acne vulgaris or
rosacea in 2010
• Financial outcomes: mean
cost of acne medications
prescribed per office visit.
Dejong 2016
[15]
Cross-sectional study (Data
collected from August 2015
to December 2015)
279 669 physicians who wrote
Medicare prescriptions in any
of 4 selected drug classes
Receipt of an industry-
sponsored meal promoting the
drug of interest.
Physicians receiving no
target meals
Behavior: prescribing rates of
promoted drugs compared with
alternatives in the same class
Yeh 2016[16] Cross-sectional study (Data
collected from January 1 to
December 31, 2011)
All 2444 physicians in
Massachusetts who wrote
prescriptions for statins paid
for under the Medicare drug
benefit in 2011.
Industry payment to physician
(: food, grants or educational
gifts, bona fide services,
educational training,)
No industry payment Behavior: rate of prescribing
brand-name statins as
compared with generic statins
for lowering cholesterol.
https://doi.org/10.1371/journal.pone.0175493.t001
Association between physician-pharmaceutical companies interactions and clinical practices
PLOS ONE | https://doi.org/10.1371/journal.pone.0175493 April 13, 2017 9 / 28

Table 2. Risk of bias and funding source for each included study.
Study Name Funding source Developing and applying
appropriate eligibility criteria
Measurement of exposure Measurement of outcome Controlling for confounding Completeness of
data
Becker 1972
[34]
Grants from the National
Center for Health Services
Research and Development
USPHS &from National
Institute of Health DHEW
Low: All actively practicing
primary physicians in the
county included with a
response rate of 84% (37 out of
44)
High: Self-reported scale to
collect data on physician’s
use of detail men as sources
of prescribing information.
Low for prescription pattern
outcome (computer-generated
profiles of actual prescribing of
chloramphenicol); High for
prescription appropriateness
(Two panels of experts
evaluated physician’s general
prescribing behavior relative to
five common complaints and
five common illnesses)
Unclear: Controlled for
variance in numbers and
types of patients.
Unclear: Author did
not comment on
completeness of
data
Haayer, 1982
[31]
Ziekenfondsraad (Health
Insurance Fund)
Low: Population-based study
targeting all GPs (148) in
Twente, resulting in a final list of
131 GPs (118 GPs agreed to
participate)
High: Study interview pilot
tested but not validated. Risk
of recall bias and/or social
desirability bias since it is
self-reported by physician
High: Study questionnaire pilot
tested but not validated. A
panel of experts rated the
rationality of prescribing on four
different scales that have then
been combined.
Low: Authors conducted
stepwise multiple regression
to adjust for potential
confounders.
Unclear: Author did
not comment on
completeness of
data
Bowman 1988
[27]
Not reported High: Sampling method not
explained; low response rate
(49%); characteristics of non-
responders and responders
were not compared
Low: No reason to suspect
that measurement of
attendance of course was
not valid
High: Non validated self-report
survey was used.
High: Control for
confounding variables not
reported (Analyses did not
take into account other
predictors of prescription
behavior)
High: Response rate
for different courses
varied between 43%
and 76%)
Peay, 1988[37] Australian Research Grants
Scheme and the Flinders
University Research Budget
Low: Clear sample selection
and eligibility criteria with 60%
response rate.
High: Survey/interview
method used to measure the
exposure. Authors did not
report on validity and
reliability of the interview
guide.
High: No objective
measurement of outcome
(survey/interview method used
to measure behavior. Also,
authors did not report on the
validity and reliability of the
interview guide)
Low: Additional multivariate
analyses were carried out.
Unclear: The author
did not mention any
missing data
Orlowski, 1992
[29]
Not reported Unclear: No clearly defined
eligibility criteria or sampling
method (physicians who had
accepted invitations to attend
symposia were identified by
general questioning of
colleagues and were affiliated
with one institution)
Low: No reason to suspect
that measurement of
attendance of symposia was
not valid
Low: Objective measurement
of outcome; prescribing pattern
was tracked retrospectively
using the hospital pharmacy
inventory usage reports; both
drugs were used only in
hospitalized physicians;
National usage data for the 2
drugs was obtained from
Pharmaceutical Data Services
High: Study focuses on the
symposia and ignores the
impact of other approaches
to marketing including
advertisements, salesman
contacts, and journal articles.
Also, analysis did not adjust
for the fact that the second
course was offered
approximately 20 months
after drug B had been added
to the hospital formulary
Unclear: Author did
not comment on
completeness of
data
Chren, 1994 National Institute of Arthritis,
USA; Skin Diseases
Research Center and Clinical
Analysis Project, University
Hospitals of Cleveland,
Low: Clear sample selection
and eligibility criteria. Response
rate was 88%
High: Survey pilot tested but
not validated. Risk of recall
bias and/or social desirability
bias since it is self-reported
by physician
Low: Objective measurement
of outcome by reviewing the
standard formulary request
forms
Low: Multivariable logistic
regression models controlled
for physician age, gender,
departmental appointment,
and number of patients seen
per week
Unclear: The author
did not mention any
missing data
Figueiras 2000
and Caamano,
2002[25, 26]
Spanish Ministry of Health
and Consumption
Low: Clear eligibility criteria
with random selection of
subjects. Exposed and control
subjects were from the same
population. Response rate was
75%
Low: A “valid and reliable”
self-administered mailed
questionnaire was used to
collect information on
exposure
Low: Objective measurement
of outcome using “the
database of the accounting
archives of the National Health
Service, which includes all
prescriptions served in all the
pharmacies in Galicia.”
Low: Analyses controlled for
confounding variables such
as type of practice, number of
identification cards, number
of patients seen per day, the
service accessibility\ for the
patients, unemployment rate
and population distribution.
Low: Missing data
were controlled for
by carrying out
multiple imputation
Mizik, 2004[35] Institute for the Study of
Business Markets (ISBM) at
Pennsylvania State University
Unclear: No clearly defined
eligibility criteria or sampling
method
Low: Objective
measurement of exposure
using panel data from US
pharmaceutical
manufacturer
Low: Objective measurement
of outcome using panel data
from a U.S. pharmaceutical
manufacturer
Low: Dynamic fixed-effects
distributed lag regression
model controlled for a range
of potential confounding
factors
Unclear: Author did
not mention any
missing data
Muijrers, 2005
[36]
Dutch Pharmacist’s
Association and the CZ health
insurance company
Low: Clear selection criteria.
Studied general practitioners in
south of the Netherland.
Response rate was 71%.
High: Self-reported survey
used to measure exposure.
Authors did not report on
validity and reliability of
survey tool.
Low: Objective measurement
of prescribing indicators using
a prescription database
compiled by linking pharmacy
databases from 379
pharmacies.
Low: A multiple regression
analysis included the a range
of predictors
Unclear: Author did
not mention any
missing data
Symm, 2006
[32]
Scott & White Institutional
Research Fund
Low: Clear selection criteria.
The 25 sample medications
selected comprised 84% of
samples dispensed during
study period
Low: Objective
measurement of exposure
using the 2003 sample logs
which were reported to be
95% to 100% accurate
Low: Objective measurement
of outcome using Scott & White
Health Plan prescription claims
data.
High: Although case-mix
adjustment data indicates
very similar practices among
the 3 clinics, “there may still
have been differences that
we overlooked or were
unable to measure”
Unclear: Author did
not mention any
missing data
(Continued)
Association between physician-pharmaceutical companies interactions and clinical practices
PLOS ONE | https://doi.org/10.1371/journal.pone.0175493 April 13, 2017 10 / 28

Table 2. (Continued)
Study Name Funding source Developing and applying
appropriate eligibility criteria
Measurement of exposure Measurement of outcome Controlling for confounding Completeness of
data
Miller, 2008[28] Not reported Low: Clear eligibility criteria
with all 10 attending physicians
in a large resident-faculty
practice selected.
Low: Objective
measurement of exposure
(observation of existing
sample cabinet being
discontinued)
Low: “Presence of an
electronic pharmacy database
allowed to abstract accurate
data for a wide assortment of
medications prescribed by a
variety of physicians.”
Low: Controlled for a range
of potential confounders.
Also conducted sensitivity
analysis which did not
significantly affect results
Unclear: Author did
not mention any
missing data
Anderson 2009
[33]
Office of Medical Applications
of Research, National
Institutes of Health, and
Maternal and Child Health
Bureau, Health Resources
and Services Administration,
USA
Low: Random selection of
participants from a nationally
representative database.
Response rate of 49%;
however, factors for which
responders and non-
responders differed were not
associated with industry
attitudes and interaction
High: Study questionnaire
pilot tested but not validated.
Risk of recall bias and/or
social desirability bias since
it is self-reported by
physician
High: Study questionnaire pilot
tested but not validated. Risk of
recall bias and/or social
desirability bias since it is self-
reported by physician
Low: Authors constructed
three linear regression
models controlling for:
reading guidelines on
physician-pharma
interactions, physician
characteristics, physician
practice, physician perceived
value of industry drug
information.
Unclear: Authors did
not comment on
completeness of
data
Søndergaard,
2009[17]
AstraZeneca funded the study
through a grant to the
Research Unit for General
Practice in Odense
Low: Population-based study
targeting all GPs (191) in the
county, resulting in a final list of
165 GPs
Low: Objective
measurement of exposure
using AstraZeneca’s
database
Low: “Outcome data based on
a highly valid and complete
register covering all prescribed
asthma drugs”
Unclear: While authors
controlled for calendar time
and device preferences, they
did not control for other
factors such as competing
firm’s drug marketing effort,
which can also affect drug
preference.
Low: Only two of the
requested to be
withdrawn from the
analysis
Pinckney, 2011
[19]
Freeman Medical Scholars
Program, The Champlain
Valley Area Health Education
Center, and the Attorney
General Consumer and
Prescriber Grant Program
High: Low response rate was
low (35% of all 631 primary care
clinicians practicing in the state
of Vermont)
Low: Absence or presence
of sample closet in clinic
measured using “several
items from a survey
developed and validated by
Chew et al”.
High: Prescription preference
was based on a hypothetical
scenario and not actual
behavior. Attitude
measurement used a scale
that was not reported as
validated
Low: Authors used
multivariable regression
models to adjust for potential
confounders.
Low: Exclusion due
to incomplete data
less than 6%
Pedan 2011[12] Inventiv Health Low: Clear eligibility criteria.
Results were “robust to
alternative . . . sample selection
criteria”. The panel is
geographically and
socioeconomically
representative.
Low: Objective
measurement of exposure
using the unique
representative dataset.
Low: Objective measure of
outcome using the dispensing
records from a large number of
nationwide and regional
pharmacy chains (inVentiv
Health computerized pharmacy
prescription database)
Low: Authors accounted for
competitive promotions,
various physicians, practice
settings, patient base, and
market dynamic
characteristics.
Unclear: Authors did
not comment on
completeness of
data
Lieb, 2014[14] No support or funding to
report
High: No clear eligibility criteria;
Low response rate 11.5%
(n = 160)
High: No objective
measurement of exposure;
doctors completed an online
questionnaire. Also,
discrepancy in categorizing
exposure and control group
Low: Objective measurement
using prescribing data over a
year for all on-patent branded,
off-patent branded, and
generic drugs from the
Bavarian Association of
Statutory Health Insurance
Physicians
High: Control for
confounding variables not
reported “We have not
recorded or taken into
consideration any other
factors that could influence
the prescribing habits of
doctors and may interact with
the PSR visits”
Unclear: Authors did
not comment on
completeness of
data
Hurley, 2014
[18]
National Heart, Lung, and
Blood Institute & National
Center for Research
Resources and the National
Center for Advancing
Translational Sciences,
National Institutes of Health
Unclear: While national data
was obtained from the National
Disease and Therapeutic Index
(NDTI), physicians were
selected from master lists of the
American Medical Association
(AMC) and the American
Osteopathic Association
through random sampling.
Differences in demographics
between patients at the AMC
and on a national level
Low: Objective
measurement of outcome
using data from a large
academic medical center
without samples extracted
from Stanford University’s
Epic electronic database via
the Center for Clinical
Informatics
Low: Objective measurement
of outcome using national data
obtained from the National
Disease and Therapeutic Index
(NDTI). Drug prices were
directly quoted from customer
service representatives of a
major pharmacy in July 2013.
High: “The observed
differences in prescribing
habits may be attributed to
other forms of
pharmaceutical marketing
that were not adequately
captured in our study, such
as the number of visits by or
gifts from pharmaceutical
representatives or the use of
co-payment discount cards,
which can also influence
prescribing patterns
Unclear: Authors did
not comment on
completeness of
data
Dejong 2016
[15]
National Center for Advancing
Translational Sciences,
National Institutes of Health;
and by the Hawaii Medical
Service Association Endowed
Chair in Health Services and
Quality Research at
University of Hawaii
Low: Clear eligibility criteria.
The study population included
279 669 physicians. Of these,
155 849 physicians wrote more
than 20 prescriptions in 1 of the
4 target drug classes and were
assigned to study groups.
Low: Objective
measurement of exposure
using the 2013 Open
Payments database which
describes the value and the
drug or device being
promoted for all payments to
physicians from August
through December 2013
Low: Objective measurement
of prescribing data for
individual physicians from
Medicare Part D
Low: Multivariable grouped
logistic regression models
with binomial physician-level
prescribing data, and
adjusting for a number of
covariates
Low: 5% of
payments promoting
the target drugs were
excluded from the
regression analysis
(Continued)
Association between physician-pharmaceutical companies interactions and clinical practices
PLOS ONE | https://doi.org/10.1371/journal.pone.0175493 April 13, 2017 11 / 28

(n = 2); industry-funded continuing medical education including travel funding (n = 2); and
receiving free gifts (drug samples and meals) (n = 3).
Sondergaard et al. conducted a retrospective cohort study and reported a statistically signif-
icant effect of the first visit of drug representatives on the general practitioner’s drug prefer-
ence favoring the marketed drug (odds ratio (OR) 2.39; 95% confidence interval (CI) 1.72–
3.32) [17]. The effect on drug preference increased further after the second visit (OR = 1.51;
95% CI: 1.19–1.93), but no significant change was noted after the third visit (OR = 1.06; 95%
CI: 0.94–1.20). We considered the data for the first visits only as the analysis for subsequent
visits may be confounded by the effect of the previous visits as highlighted by the authors: “the
effect of promotional visits could in part be caused by representatives selecting practices with a
higher probability of adopting the promoted drug. Although we have controlled for the time
until first visit, a selection effect cannot be excluded.” Also, none of the remaining studies
included in the meta-analysis reported data for subsequent visits.
Bowman et al. conducted a pre-post survey showing the effects of attendance of three con-
tinuing medical education courses, each subsidized by a single but different drug company,
and the changes in rate of prescribing by physicians of course-related drugs [27]. We excluded
the results for courses I and II, given data were not matched. In course III, Diltiazem was the
sponsoring company’s drug. Prescribing Diltiazem most frequently to new patients statistically
increased from 22.3% to 33.9% pre-post course (p<0.05). In addition, the number of new pre-
scriptions for Diltiazem increased statistically from 31.4% to 50.1% pre-post course (p<0.05%)
[27]. We considered the first outcome and conducted sensitivity analysis that demonstrated no
important changes in results.
Pinckney et al. examined in a cross-sectional study the interaction between the availability
of medication samples in the clinics and the prescription preference of primary care prescrib-
ers (stated as the name of the medication) in response to two clinical vignettes [19]. Clinicians
who did not have samples in their offices were more likely to prescribe hypertension medica-
tion according to clinical practice guidelines (p<0.01), and more likely to prescribe a depres-
sion medication that was generic (p = 0.02) [19]. Multivariable regression models were
conducted only for the hypertension vignette. The findings showed that clinicians with sam-
ples were still less likely to select thiazide diuretic that is the preferred treatment for hyperten-
sion (OR = 0.15; 95% CI: 0.04–0.56).
Miller et al. conducted a retrospective study to look at the association of a pre-post removal
of drug sample closet and the percentage of medications prescribed to uninsured or Medicaid
patients as generics. Following a logistic regression model, the authors found that the absence
of the sample closet was associated with uninsured patients receiving a generic prescription
(OR = 4.54; 95% CI: 1.37–15.0) [28].
Table 2. (Continued)
Study Name Funding source Developing and applying
appropriate eligibility criteria
Measurement of exposure Measurement of outcome Controlling for confounding Completeness of
data
Yeh 2016 [16] Not reported Low: “From 363653 physicians
in the Medicare Part D
prescription claims database,
we identified 9628 with a
business address in
Massachusetts, of whom 2444
had associated statin
prescriptions covered by
Medicare.”
Unclear: Although exposure
was measured using
Massachusetts physicians
payment database compiled
by Massachusetts
Department of Health, the
authors were unable to
determine the frequency of
misattribution of the payment
category or underreporting of
payment
Low: Objective measurement
of outcome using Part D
Medicare prescriptions claims
data prepared by the Centers
for Medicare and Medicaid
Services (CMS).
Unclear: Although authors
mentioned conducting linear
regression models, they
stated that they were not able
to control for certain
physician characteristics
(e.g., practice characteristics,
level of experience) which
may have an impact on
prescribing patterns.
Unclear: Authors did
not mention any
missing data
https://doi.org/10.1371/journal.pone.0175493.t002
Association between physician-pharmaceutical companies interactions and clinical practices
PLOS ONE | https://doi.org/10.1371/journal.pone.0175493 April 13, 2017 12 / 28

Fig 2. Risk of bias summary reflecting reviewers’ judgments about each risk of bias item for included
studies.
https://doi.org/10.1371/journal.pone.0175493.g002
Association between physician-pharmaceutical companies interactions and clinical practices
PLOS ONE | https://doi.org/10.1371/journal.pone.0175493 April 13, 2017 13 / 28

Table 3. A summary of the outcomes and statistical results of each included study.
Study Name Exposure Outcomes Statistical results
Becker 1972 [34] Detailing Behavior: appropriateness and prescribing pattern of
physicians.
Use of detail men as sources of prescribing information
concerning new drugs was significantly associated with
higher prescription of the drug chloramphenicol by
primary care physicians (p<0.01), and a poorer rating of
prescription quality (p<0.01) by two panels of experts
relative to five common complaints and five common
illnesses
Haayer, 1982 [31] A mix of exposure (without
reporting data specific to each
exposure)
Behavior: Rational prescribing of physicians based
on their responses to eight common-practice case-
histories
Reliance on information from pharmaceutical industry was
negatively associated with prescribing rationality
(p<0.001)
Bowman, 1988 [27] Industry- sponsored CME Behavior: changes in rates of prescribing by
physicians of course-related drugs
The number of new prescriptions for the sponsoring
company’s drug increased statistically from 31.4% to
50.1% pre-post course (p<0.05%)
Peay, 1988 [37] • Detailing
• Receiving free drug
Behavior: prescription of Temazepam routinely in
preference to alternatives, the timing of prescription of
Temazepam
• Physicians who had contact with detailmen regarding
Temazepam reported earlier awareness of it (p < 0.041),
were more likely to rate it as a moderate advance (as
opposed to a minor advance or no advance at all) (p<0.028), were more likely to have prescribed it (p< 0.0031),
reported prescribing it earlier (p< 0.005) and were more
likely to prescribe it routinely in preference to alternatives
(p< 0.014).
• Physicians who had received a sample of Temazepam,
compared to those who had not, were more likely to have
prescribed it (p < 0.001) and more likely to say that they
now usually prescribe it rather than the alternatives
(p < 0.006).
Orlowski, 1992[29] Industry-sponsored CME Behavior: physician prescribing patterns of the two
drugs before and after the expense-paid trips
The ‘expense-paid seminar at a resort’ was associated
with a significant increase in the prescribing of the
promoted drugs within a few months of each symposium
compared to their use before the symposium (p<0.001)
Chren, 1994 [30] • Detailing
• Attending industry-sponsored
educational symposia
• Speaking at industry-sponsored
educational symposia
Behavior: Physicians’ formulary request for a drug
made by a specific company
• Physicians who had met with pharmaceutical
representatives were significantly more likely to have
requested that drugs manufactured by specific companies
be added to the formulary, than other physicians
(OR = 3.4; 95% CI: 1.8–6.6).
• Increased odds of formulary requests were obtained for
physicians who had accepted money from those
companies to attend educational symposia (OR = 7.9;
95% CI: 1.1–55.6).
• Increased odds of formulary requests were obtained to
speak at educational symposia (OR = 3.9; 95% CI: 1.2–
12.7).
Figueiras 2000 [26]
and Caamano 2002
[25]
Detailing Behavior: quality of drug prescribed, reflected via 3
indicators combined to produce a global indicator
variable; Utilization of information obtained from
visiting sales representatives
• Using information obtained from pharmaceutical
representatives is associated with a higher percentage of
prescription drug not included in the primary care
formulary and with a higher “global indicator variable”,
thus reflecting lower prescription quality.
• Utilization of the visiting marketers’ information remained
significantly associated with higher amounts of
prescription (p = 0.048) Utilization of the visiting
marketers’ information was significantly associated with
higher expenditure per physician (p = 0.035); however
number of sales representative visits was not statistically
associated with expenditure.
Mizik, 2004 [35] • Detailing
• Receiving free samples
Behavior: number of new prescriptions issued by a
physician per month for three studied drugs A, B and
C
• The estimated total effects of detailing on new
prescriptions (average number per month by drug) were:
1.56 (95% CI: 0.80–2.23) for drug A; 0.32 (95% CI: 0.22–
0.43) for drug B; and 0.15 (95% CI: 0.11–0.20) for drug C.
• Receiving free sample medications had a statistically
significant but small impact on the number of new
prescriptions issued by a physician per month for three
studied drugs
Muijrers, 2005[36] Detailing Behavior: quality of prescribing measured as
‘adherence to guidelines’
Frequent visits from pharmaceutical industry
representatives had a significantly negative correlation
with the quality of prescription of general practitioners
measured as “adherence to guidelines” (p<0.05)
(Continued)
Association between physician-pharmaceutical companies interactions and clinical practices
PLOS ONE | https://doi.org/10.1371/journal.pone.0175493 April 13, 2017 14 / 28

Table 3. (Continued)
Study Name Exposure Outcomes Statistical results
Symm, 2006[32] Receiving free samples • Behavior: number of prescriptions written for study
medications in relation to the distribution of free
sample medications
• Financial outcome: average 30-day prescription
costs
• Family physicians in clinic X significantly wrote the
largest proportion of prescriptions for study medications (p
<0.0001) versus non-study medications; significantly
prescribed the lowest proportion of preferred name brand
medications (p <0.0001);
• Family physicians in clinic X were significantly higher in
the average cost per 30-day prescription than those in
clinic Y or Z. The average cost of a 30-day prescription
differed significantly by clinic (p <0.0001).
Miller, 2008 [28] Receiving free samples Behavior: % of medications prescribed to uninsured
or Medicaid patients as generics.
The absence of the sample closet was associated with
uninsured patients as well Medicaid patients receiving a
generic prescription (OR = 4.54; 95% CI: 1.37–15.0)
Anderson 2009 [33] Industry meal Behavior: reported reliance on sales representatives
when deciding whether to prescribe a new drug
Frequency of eating industry-funded food was associated
with greater reliance of OB/GYNs on pharmaceutical
representatives for drug information when prescribing
new medications: first regression analysis (β = 0.16, 95%
CI: 0.02–0.31)
Søndergaard, 2009
[17]
Detailing Behavior: proportion of dispensings of promoted drug
among all dispensings of fixed combinations of inhaled
corticosteroid and long-acting b2-agonists.
Effect of the first visit of drug representatives on the
general practitioner’s drug preference favoring the
marketed drug (odds ratio (OR): 2.39; 95% CI: 1.72–
3.32).
Pinckney, 2011[19] Receiving free samples • Behavior: prescription preference of physicians in
response to two clinical vignettes
• Beliefs: agreeing with statements about sample use,
measured on 5-point Likert scales, subsequently
dichotomized into “Agree” versus “Don’t agree”
• Clinicians with samples available were less likely to
prescribe thiazide diuretics according to clinical practice
guidelines [OR = 0.2 (95% CI: 0.06–0.68)]. To test the
robustness of this conclusion, authors conducted a full
regression which showed that clinicians with samples
were still less likely to select a thiazide diuretic [OR = 0.15
(95% CI: 0.04–0.56].
• Prescribers with samples were significantly more likely to
believe that samples: are liked by patients, expedite
treatment, help patients who cannot afford their
medication, reduce patient costs, and help physicians
assess the efficacy of medications. Most prescribers with
samples still agreed that they alter treatment plans and
increase the costs of care
Pedan 2011 [12] • Detailing
• Receiving free samples
• Industry meal
Behavior: total monthly number of new prescriptions
(NRx) written by a physician for the three leading
statin brands
• Detailing produced a highly significant positive impact on
new prescriptions for Lipitor and Crestor, although results
were not significant for Vytorin.
• Sample dispensing had significant positive effect for
Crestor (p<0.01) and Vytorin (p<0.05). Results were not
significant for Lipitor.
• Free meals had a significant positive impact on all three
statin brands: Lipitor (p<0.05), Crestor (p<0.05) and
Vytorin (p<0.01)
Lieb, 2014 [14] • Detailing
• Industry-sponsored CME
• Receiving gifts in the form of
office stationery
• Behavior: individual prescribing data of physicians
over a year for all on-patent branded, off-patent
branded, and generic drugs prescription
• Financial outcome: lower expenditure on off-patent
• Frequently visited practices had a significantly higher
number of prescriptions and total daily doses per patient
compared to more rarely visited practices (the results
were no longer significant after taking into consideration
the number of patients per office).
• Compared to doctors who frequently, occasionally or
rarely took part in sponsored CME events, doctors who
mentioned that they never took part in such events had a
lower number of on patent-branded drug prescriptions per
patient (mean ± SD; 1.05±0.35 vs. 1.27±0.55; p = 0.005, a
higher proportion of generics (83.28±7.77% vs. 76.34
±13.58%; p<0.0005) and lower expenditure on off-patent
branded drugs per patient (£27.36±23.23 vs. £43.75
±43.22; p = 0.002).
• Compared to physicians who only occasionally, rarely or
never accepted stationery, physicians who always or
frequently accepted gifts in the form of office stationery
prescribed higher daily dose totals per patient
(mean ± SD; 491.97±158.95 vs. 420.53±140.57;
p = 0.003) and more generics (mean ±SD; 385.52±147.52
vs. 319.43±133.69; p = 0.004)
(Continued)
Association between physician-pharmaceutical companies interactions and clinical practices
PLOS ONE | https://doi.org/10.1371/journal.pone.0175493 April 13, 2017 15 / 28

In a nested case-control study, Chren el at found that physicians who had met with pharma-
ceutical representatives were significantly more likely to have requested that drugs manufac-
tured by specific companies be added to the formulary, than other physicians (OR = 3.4; 95%
CI 1.8–6.6) [30]. Similar increased odds of formulary requests were obtained for physicians
who had accepted money from those companies to attend educational symposia (OR = 7.9;
95% CI: 1.1–55.6), or to speak at educational symposia (OR = 3.9; 95% CI: 1.2–12.7). We
treated each exposure as a separate unit of analysis in the meta-analysis.
Dejong et al. examined in a cross-sectional study the association between the receipt of an
industry-sponsored meal promoting the drug of interest and prescribing rates of promoted
drugs compared with alternatives in the same class [15]. Physicians who received a single meal
promoting the drug of interest had higher rates of prescribing Rosuvastatin over other statins
(OR = 1.18; 95% CI: 1.17–1.18), Olmesartan over other ACE inhibitors and ARBs (OR = 1.52;
95% CI: 1.51–1.53), Nebivolol over other β-blockers (OR = 1.70; 95% CI: 1.69–1.72), and Des-
venlafaxine over other SSRIs and SNRIs (OR = 2.18; 95% CI: 2.13–2.23). We included the
value that is the closest to the mean of all reported values amongst those associations.
We pooled the results for the six studies in a meta-analysis, stratified by type of exposure.
Please refer to S3 Table for a summary of all decisions and their rationale with respect to the
statistical data included in the meta-analysis. The pooled estimate showed a statistically signifi-
cant association between interaction with pharmaceutical industry and physicians’ prescribing
behaviors (OR = 2.52; 95% CI: 1.82–3.50). The heterogeneity was considered high with I2 of
64% (Fig 3). The test for subgroup effect did not identify any subgroup difference by type of
exposure (Test for subgroup differences: P = 0.88).
Fig 4 shows the risk of bias summary for these six studies. We judged the overall risk of bias in
four of these studies as low [15, 17, 28, 30]. Following the GRADE methodology we downgraded
Table 3. (Continued)
Study Name Exposure Outcomes Statistical results
Hurley, 2014[18] Receiving free drug samples • Behavior: brand-name medications prescribed per
office visit for a primary initial diagnosis of acne
vulgaris or rosacea in 2010
• Financial outcomes: the mean cost of acne
medications prescribed per office visit.
• The increase in provision of samples with a prescription
by dermatologists was strongly correlated (r = 0.92) to the
increase use of branded generic drugs promoted by these
samples. For physicians at local academic centers where
free samples are prohibited, only 17% of the commonly
prescribed medications were for branded or branded
generic drugs compared to 79% for office-based
dermatologists on a national level where free samples are
available.
• The national mean total retail cost of prescriptions was
conservatively estimated to be twice as higher (roughly
$465 nationally versus $200 at an academic medical
center where samples were prohibited)
Dejong 2016[15] Industry meal Behavior: Prescribing rates of promoted drugs
compared with alternatives in the same class
Physicians who received a single meal promoting the drug
of interest had higher rates of prescribing of rosuvastatin
over other statins (odds ratio (OR) = 1.18; 95% CI: 1.17–
1.18); nebivolol over other β-blockers (OR = 1.70; 95% CI:
1.69–1.72); olmesartan over other ACE inhibitors and
ARBs (OR = 1.52; 95% CI: 1.51–1.53); and
desvenlafaxine over other SSRIs and SNRIs (OR = 2.18;
95% CI: 2.13–2.23).
Yeh 2016[16] Industry payments for different
types of gifts (e.g. meal; grants/
educational gifts; educational
training)
Behavior: Rate of prescribing brand-name statins as
compared with generic statins for lowering cholesterol
Among physicians with industry payments reported in the
Massachusetts database, every $1000 in total payments
received was associated with a 0.1% increase in the rate
of brand-name statin drug prescribing (95% CI, 0.06%–
0.13%; P < .001). Payments for educational training were
associated with an average 4.8% increase in brand-name
prescribing compared with no receipt of educational
training (95%CI, 1.55–7.95;P = .004), but the other
payment types were not.
https://doi.org/10.1371/journal.pone.0175493.t003
Association between physician-pharmaceutical companies interactions and clinical practices
PLOS ONE | https://doi.org/10.1371/journal.pone.0175493 April 13, 2017 16 / 28

the quality of evidence for the outcome ‘behavior of physician’ from high to moderate for risk of
bias and inconsistency. There was no major concern with imprecision, indirectness of the evi-
dence, or publication bias warranting further downgrading.
The first sensitivity analysis excluded two studies judged as having an overall high risk of
bias [19, 27]. The analysis found no important change in the pooled effect estimate (OR = 2.55,
95% CI: 1.75–3.71). In the second sensitivity analysis, we excluded the one study funded by
pharmaceutical industry [17]. The analysis resulted in a non-substantial increase in size of the
pooled effect estimate (OR = 2.74, 95% CI: 1.78–4.23). The third sensitivity analysis excluded
two studies measuring the outcome of interest as ‘changes in generic prescription’ [28] and
‘formulary requests’ [30], respectively. The analysis resulted in the pooled effect estimate
decreasing slightly in size but remaining statistically significant (OR = 2.11; 95% CI: 1.62–
2.74). The details of the analyses are provided in S1, S2 and S3 Figs, respectively.”
Narrative summary of studies not included in the meta-analysis
As noted above, fourteen eligible articles reporting thirteen studies were not included in the
meta-analysis [12, 14, 16, 25, 26, 29, 31–37]. In addition, we narratively summarized the
Fig 3. Forest plot for changes in physician prescribing behavior stratified by type of exposure.
https://doi.org/10.1371/journal.pone.0175493.g003
Association between physician-pharmaceutical companies interactions and clinical practices
PLOS ONE | https://doi.org/10.1371/journal.pone.0175493 April 13, 2017 17 / 28

findings of the study by Pinckney et al (included in the meta-analysis), albeit only for the out-
come ‘beliefs of physicians’ [19].
The study designs were cross-sectional (n = 12), pre-post survey (n = 1) [27] and retrospec-
tive cohort study (n = 1)[12]. These studies assessed the following types of interactions
between physicians and drug representatives (with some studies reporting on more than one
type): detailing (n = 8); continuing medical education including travel funding (n = 2);
Fig 4. Risk of bias summary reflecting reviewers’ judgments about each risk of bias item for studies
included in the meta-analysis.
https://doi.org/10.1371/journal.pone.0175493.g004
Association between physician-pharmaceutical companies interactions and clinical practices
PLOS ONE | https://doi.org/10.1371/journal.pone.0175493 April 13, 2017 18 / 28

receiving free gifts (e.g. drug samples, meals, grants and payments) (n = 9); and a mix of inter-
actions (n = 1; this study did not report data specific to each exposure). We summarized the
results narratively, stratified by type of exposure and within each exposure by risk of bias.
Detailing (or pharmaceutical representative visits). Nine articles reporting on eight
studies evaluated the interactions between physicians and pharmaceutical sales representatives
[12, 14, 25, 26, 34–37]. All of these studies assessed prescribing behaviors. In addition to assess-
ing prescribing behavior, one assessed financial outcome [25] and one assessed physicians’
knowledge [37]. Five of the eight studies found an association between detailing and increased
prescribing frequency, lower prescribing quality, higher expenditure, or earlier awareness of
promoted drugs. Three studies found both associations with higher prescribing frequency or
expenditures and lack of significant associations, for the different types of drugs or exposures
examined. The overall risk of bias was judged as high for two of the eight studies [14, 37].
Figueiras et al. and Caamano et al. conducted a cross-sectional study to examine the associ-
ation between detailing and the amount, expenditure and quality of drug prescribed by pri-
mary care physicians. The quality of prescription was reflected via three indicators which were
combined to produce a global indicator variable. Figueiras et al. showed that using information
obtained from pharmaceutical representatives was associated with a higher percentage of pre-
scription drug not included in the primary care formulary and with a higher “global indicator
variable”, thus reflecting lower prescription quality [26]. Camaano, et al., found that the utiliza-
tion of the visiting marketers’ information was significantly associated with higher amounts of
prescription (p = 0.048) and higher expenditure per physician (p = 0.035) [25]. On the con-
trary, the number of sales representative visits was not statistically associated with prescription
amount or expenditure.
Pedan et al. conducted a retrospective cohort study to assess the impact of detailing on new
prescriptions for three different statin brands, namely, Lipitor, Crestor and Vytorin [12]. The
authors provided data for promotional activities of ‘own brand’ and the promotion of ‘compet-
itive brand’. The findings for ‘own promotion’ indicated that detailing produced a highly sig-
nificant positive impact on new prescriptions for Lipitor and Crestor (p<0.05), while results
were not significant for Vytorin. ‘Competitive’ detailing had a significant negative impact on
new prescription for Vytorin (p<0.05) whereas results were not significant for the other two
brands.
Muijrers et al. conducted a cross-sectional study and found that more frequent visits from
pharmaceutical industry representatives had a significant negative correlation with the quality
of prescribing of general practitioners measured as “adherence to guidelines” (p<0.05) [36].
The latter was calculated as a weighted average score on 20 prescribing indicators based on
general practice guidelines of the Dutch College of General Practitioners.
Mizik et al. conducted a pooled time series cross-sectional study to evaluate the association
between pharmaceutical sales representative visits per month and the number of new prescrip-
tions issued by a physician per month for three studied drugs [35]. The average number of
new prescription per month by drug, were: 1.56 (95% CI: 0.80–2.23) for drug A; 0.32 (95% CI:
0.22–0.43) for drug B; and 0.15 (95% CI: 0.11–0.20) for drug C.
Becker et al. conducted a cross-sectional study and found that the use of detail men as
sources of prescribing information concerning new drugs was significantly associated with
higher prescription of the drug chloramphenicol by primary care physicians (p<0.01), and a
poorer rating of prescription quality (p<0.01) by two panels of experts relative to five common
complaints and five common illnesses [34].
The findings of the remaining two studies with overall high risk of bias are discussed below
[14, 37].
Association between physician-pharmaceutical companies interactions and clinical practices
PLOS ONE | https://doi.org/10.1371/journal.pone.0175493 April 13, 2017 19 / 28

Peay et al. conducted a cross-sectional study and found that doctors (specialists and general
practitioners) who had contact with detail men regarding the promoted drug Temazepam
reported earlier awareness of it (p< 0.041), were more likely to rate it as a moderate advance
(as opposed to a minor advance or no advance at all) (p< 0.028), were more likely to have pre-
scribed it (p< 0.0031), reported prescribing it earlier (p< 0.005) and were more likely to pre-
scribe it routinely in preference to alternatives (p< 0.014) [37]. In the multivariate analysis,
contact with detail man regarding Temazepam and first news of drugs from detail man
remained significantly related to four of the five dependent variables correlating with prescrip-
tion of Temazepam.
In another cross-sectional study, Lieb et al. found that frequently visited practices (i.e. daily
or 2–3 times per week) had a significantly higher number of prescriptions (p = 0.005) and total
daily doses per patient (p = 0.003) compared to practices visited less frequently by representa-
tives. However, they did not have a higher total expenditure per patient (p = 0.115). The effects
of the “frequency” of pharmaceutical sales representatives visits on prescribing behavior were
no longer significant after taking into consideration the number of patients per office [14].
Continuing medical education. Two studies assessed the effects of industry-funded con-
tinuing medical education on physician prescribing behaviors [14, 29] and expenditure on off-
patent branded drugs [14]. Both studies found significant associations between attending
industry-funded continuing medical education and higher prescribing frequency, lower pre-
scribing quality, or increased prescription cost. The overall risk of bias was judged as high for
one of them [14].
A pre-post study tracked the prescribing pattern for two drugs before and after physi-
cians attended symposia sponsored by a pharmaceutical company. The ‘expense-paid
seminar at a resort’ was associated with a significant increase in the prescribing of the two
promoted drugs within a few months of each symposium compared to their use before the
symposium (p<0.001) [29].
The cross-sectional study with high risk of bias found that compared to doctors who fre-
quently, occasionally or rarely took part in sponsored CME events, doctors who mentioned
that they never took part in such events had a lower number of on patent-branded drug pre-
scriptions per patient (mean ± SD; 1.05±0.35 vs. 1.27±0.55; p = 0.005, a higher proportion of
generics (83.28±7.77% vs. 76.34±13.58%; p<0.0005) and lower expenditure on off-patent
branded drugs per patient (£27.36±23.23 vs. £43.75±43.22; p = 0.002) [14].
Receiving free gifts. Nine studies evaluated receiving free gifts as the exposure of interest
[12, 14, 16, 18, 19, 32, 33, 35, 37]. All of these studies assessed prescribing behaviors. In addi-
tion to assessing prescribing behaviors, two assessed financial outcomes [18, 32] and one
assessed physicians’ beliefs [19]. For the latter study, we did not include the findings pertaining
to prescribing behavior as these were already included in the meta-analysis. Five of the nine
studies found an association between receiving free gifts and increased prescribing frequency,
lower prescribing quality, or increased prescription cost. Each of three studies found both
associations with higher prescribing frequency and lack of significant associations, for the dif-
ferent types of gifts examined in the studies. The remaining study found that prescribers with
access to samples were significantly more likely to believe that samples benefited patients. The
overall risk of bias was judged as high for four of the nine studies [14, 19, 33, 37].
Pedan et al. conducted a retrospective cohort study to evaluate the effects of sample dispens-
ing and meals on total monthly number of new prescriptions written by a physician for the
three leading statin brands (Crestor, Lipitor and Vytorin) [12]. The authors provided data for
promotional activities of ‘own brand’ as well as the promotion of ‘competitive brand’. The find-
ings for ‘own promotion’ showed that sample dispensing had a significant positive effect on
new prescription for Crestor (p<0.01) and Vytorin (p<0.05), but results were not significant
Association between physician-pharmaceutical companies interactions and clinical practices
PLOS ONE | https://doi.org/10.1371/journal.pone.0175493 April 13, 2017 20 / 28

for Lipitor. They also found that free meals had a significant positive impact on new prescrip-
tion for all three statin brands: Lipitor (p<0.05), Crestor (p<0.05) and Vytorin (p<0.01). ‘Com-
petitive’ sampling had a significant negative impact on new prescription for Lipitor (p<0.05)
and Vytorin (p<0.05) but results were not significant for Crestor. ‘Competitive’ free meal-
related promotions had a significant negative impact on Lipitor only (p<0.05) The authors con-
cluded that, while on average the marketing efforts affect the brand share positively, the magni-
tude of the effects is very brand specific.
Mizik et al. conducted a pooled time series cross-sectional study to examine the association
between receiving free sample medications and the number of new prescriptions issued by a
physician per month for three drugs [35]. They observed statistically significant but small
effects of sample dispensing on prescription behavior for all three types of drugs.
In a cross-sectional study, Symm et al. examined the prescription claims data for 25 med-
ications in one “clinic X” where sample medications were dispensed compared to two clin-
ics, Y and Z, which did not dispense free sample medications [32]. They showed that, first,
family physicians in clinic X significantly wrote the largest proportion of prescriptions for
study medications (p <0.0001) versus non-study medications. Second, family physicians in
clinic X significantly prescribed the lowest proportion of preferred name brands among
study medications (p <0.0001). Third, the average cost of a 30-day prescription differed sig-
nificantly by clinic (p <0.0001), being the highest in clinic X.
Hurley et al. conducted a cross-sectional study and found a strong correlation (r = 0.92)
between the increase in provision of samples with a prescription by dermatologists and
increased use of branded generic drugs promoted by these samples [18]. For physicians at
local academic centers where free samples are prohibited, only 17% (230 of 1364) of the com-
monly prescribed medications were for branded or branded generic drugs compared to 79%
for office-based dermatologists on a national level where free samples are available. Addition-
ally, the national mean total retail cost of prescriptions was “conservatively” estimated to be
twice as higher (roughly $465 nationally versus $200 at an academic medical center where
samples were prohibited).
Yeh et al. found that among physicians with industry payments in the Massachusetts data-
base, every $1000 in total payments received was associated with a 0.1% increase in the rate of
brand-name statin drug prescribing (95% CI: 0.06%-0.13%; P< .001) [16]. Receiving payment
for educational training was associated with an average 4.8% increase in prescribing of brand-
name drugs (95% CI: 1.55–7.95; p = 0.004), but the other types of payment (i.e. food, grants/
education gifts, and bona fide services) were not.
The findings of the four studies with overall high risk of biases are summarized below.
Peay et al. examined in a cross-sectional study the association between receiving a sample
of Temazepam and physicians’ prescription rate and preference for it over the alternatives
[37]. They demonstrated that physicians (specialists and general practitioners) who had
received a sample of Temazepam, compared to those who had not, were more likely to have
prescribed it (p< 0.001) and more likely to say that they now usually prescribe it rather than
the alternatives (p< 0.006).
Pinckney et al. examined the association between the presence of samples in offices and
prescribers’ beliefs about the use of samples. They found that prescribers with samples were
significantly more likely to believe that samples: are liked by patients; expedite treatment; help
patients who cannot afford their medication; reduce patient costs; and help physicians assess
the efficacy of medications. Nonetheless, most prescribers with samples still agreed that sam-
ples alter treatment plans and increase the costs of care [19].
In another cross-sectional study, Lieb et al. found that physicians who always or frequently
accepted gifts in the form of office stationery prescribed higher daily dose totals per patient
Association between physician-pharmaceutical companies interactions and clinical practices
PLOS ONE | https://doi.org/10.1371/journal.pone.0175493 April 13, 2017 21 / 28

(mean ± SD; 491.97±158.95 vs. 420.53±140.57; p = 0.003) and more generics (mean ±SD;
385.52±147.52 vs. 319.43±133.69; p = 0.004) in comparison to physicians who only occasion-
ally, rarely or never accepted stationery [14]. We did not include the other types of gifts as the
categorization of answer options was not conducive to interpretation (e.g., the categories
‘rarely’ ‘frequently’ and ‘occasionally’ were grouped together as exposure group and the cate-
gory ‘never’ as control group for one type of gift whereas for another type of gift, the categories
‘frequently’ ‘occasionally’ ‘rarely’ and ‘never’ were categorized together as control group).
Anderson et al. conducted a cross-sectional study and found that the frequency of eating
industry-funded food was associated with greater reliance of obstetrics and gynecology physi-
cians on pharmaceutical representatives for drug information when prescribing new medica-
tions [33]. This finding was statistically significant in a first regression analysis (β = 0.16, 95%
CI: 0.02–0.31). It became non-significant in a second regression model including as an inde-
pendent variable “the perceived value of pharmaceutical representatives in helping physicians
to learn about new drugs” (β = 0.07, 95% CI: -0.06–0.19).
Mixed exposures. One cross-sectional study with overall high risk of bias examined the
association between rational prescribing of general practitioners and a mix of exposures
including “manufacturer’s representatives, drug companies’ mailings, use of samples, drug
companies’ journals, drug firm meetings and usefulness of drug company information” [31].
The investigators found that reliance on information from pharmaceutical industry was nega-
tively associated with prescribing rationality (p<0.001).
Discussion
Summary and interpretation of findings
We identified 19 studies looking the association between physicians’ interactions with phar-
maceutical companies and their prescribing behaviors. In addition to assessing prescribing
behavior, four of the 19 studies assessed financial outcomes [12, 19, 26, 35], one assessed physi-
cians’ knowledge [37], and one assessed their beliefs [19]. None of the included studies
assessed clinical outcomes.
Out of the 19 studies, 15 found a consistent association between interactions promoting a
medication, and inappropriately increased prescribing rates, lower prescribing quality, and/or
increased prescription costs. Each of three studies found both associations with higher prescribing
frequency and lack of significant associations, for the different types of exposures and drugs
examined in the studies [12, 16, 25]. Only one study, albeit at high risk of bias, found an associa-
tion between receiving gifts from the industry and increased generic prescribing whereas the
results were mixed for the remaining types of exposures and outcomes assessed in that study [14].
A meta-analysis of six of the included studies provided moderate quality evidence showing
more than doubling of inappropriate prescribing rate among practicing physicians. The het-
erogeneity was considered high. Sensitivity analyses excluding the two studies at high risk of
bias and the industry-funded study, respectively, did not substantially change these results. A
subgroup analysis did not find a difference by type of exposure.
Strengths and limitations of the review
A major strength of the present study is the use of Cochrane methodology for conducting the
systematic review. In addition, this is the first systematic review to focus on practicing physi-
cians, as other reviews included residents and physicians in training as their population of
interest [11]. A potential limitation of our review is that we searched only two electronic data-
bases. However, we believe our search was sensitive. Also, Spurling et al. did not include a
study that was eligible for our review, and that was missed by our search strategy. Another
Association between physician-pharmaceutical companies interactions and clinical practices
PLOS ONE | https://doi.org/10.1371/journal.pone.0175493 April 13, 2017 22 / 28

potential limitation is the exclusion of studies published in a language other than English.
Also, all included studies were conducted in developed, high-income countries; therefore,
there is a chance that we have missed studies conducted in low or middle-income countries
that have been published in a non-English language. However, given the consistency of find-
ings, we expect them to be generalizable to those countries. Another limitation relates to the
potential misattribution of the exposure category; however, such cases were few. One example
is the study conducted by Yeh et al. which considered “payments for CME” as different from
“payments for educational training” [16]. Other limitations relate to the observational nature
of all included studies and to our inability to include some studies in the meta-analysis because
they did not report data for the association between the exposure and the outcome of interest.
Comparison to findings of similar reviews
The latest systematic review addressing the same topic was published in 2010 and included
physicians as well as residents [11]. The chosen populations may have contributed to the high
level of statistical heterogeneity reported (I2 = 91%). Also, the previous systematic review
focused on exposure to information directly provided by pharmaceutical companies, and thus
excluded other types of exposures such as gifts, samples, and continuing medical education
courses that were funded by unrestricted grants from pharmaceutical companies. On the other
hand, our review has included these types of interaction and has covered 8 years of literature
since 2008, the year of literature search of the 2010 review. Still, our review included a relatively
lower number of studies compared to the previous review due to the stricter eligibility criteria
(e.g., we excluded residents and medical trainees; non-targeted interactions such as advertise-
ments in journals or prescribing software, or mailed information; and participation in spon-
sored clinical trials). Nevertheless, our findings are consistent with those of the previous
review in terms of decreased prescribing quality and increased costs associated with exposure
to information provided directly by pharmaceutical companies. In addition, we found evi-
dence of similar effects associated with drug samples and industry gifts (both of which were
not assessed in the previous review).
Implications for policy and practice
Our findings suggest that the interaction between physicians and pharmaceutical companies
should be better managed to reduce any negative effects and promote appropriate drug pre-
scribing. While many policy options have been proposed to manage the interactions between
physicians and pharmaceutical companies [38], the level of evidence supporting them varies,
as described below.
There is an increasing trend of mandating pharmaceutical companies to disclose payments
to physicians. For instance, the Physician Payments Sunshine Act enacted in the USA in 2010
requires pharmaceutical and medical device manufacturers to publicly disclose payments (or
transfers of values) exceeding US$10 per instance or US$100 per year made to physicians and
teaching hospitals [39]. Similarly, Medicines Australia recently revised its code of conduct,
requiring pharmaceutical companies to report on payments to individual health professionals
for their services, sponsorships to attend educational events, as well as educational grants [40].
However, so far there is no evidence supporting the effectiveness of mandatory disclosure [20].
As an example of regulatory approach, France introduced in 2004 the French Sales Visit
Charter which requires sales representatives to provide physicians with “approved product
information” [41]. A report by French National Authority for Health pointed to the ineffec-
tiveness of the Charter and the difficulty in supervising the content of verbal information con-
veyed during representative visits [42].
Association between physician-pharmaceutical companies interactions and clinical practices
PLOS ONE | https://doi.org/10.1371/journal.pone.0175493 April 13, 2017 23 / 28

A potentially effective option would be to restrict physician-industry interactions, particu-
larly given the evidence that restriction policies may have a positive effect on improving pre-
scribing behavior [20]. This could be achieved, at the institutional level by restricting free
samples, promotional material, and meetings with pharmaceutical company representatives.
For example, Stanford University banned pharmaceutical sales representatives from its hospi-
tals [43]. Similarly, Memorial Sloan Kettering Cancer Center and Brody School of Medicine at
East Carolina University banned all industry involvement (including funding) in CME, report-
edly with success [44]. At a higher level, policy makers may consider legislation specifying the
types of interactions that are permissible, and those that are not. For example, Minnesota
enacted a law that bans pharmaceutical industries from providing gifts to physicians with a
total annual combined retail value above US$50 [38].
While some may claim that restricting interactions between physicians and pharmaceutical
companies could create an ‘information gap’, several studies conducted in different contexts
found that sales representatives often did not state the risks and harmful effects of drugs to
physicians [40, 41, 45]. Academic detailing has emerged as an effective alternative to industry-
dependent drug information [46, 47]. For instance, Canada and some USA states have estab-
lished nationally-funded academic detailing programs that rely on similar sales tactics utilized
by the pharmaceutical industry to influence physician prescribing according to evidence-
based guidelines [48].
Considerations should also be given to educating health care providers about the influence
of interactions with the pharmaceutical industry, as well as inclusion of courses on industry
marketing techniques and conflict of interest in medical curricula [49]. Existing evidence sug-
gests positive effects of educational programs about industry marketing strategies on medical
trainees’ attitudes and behaviors [50, 51].
Implications for research
Given all of the included studies were conducted in high-income countries, future studies
should explore the effect of interaction of physicians in low and middle-income countries with
pharmaceutical companies on their clinical practices. Also, it would be important to under-
stand the impact of these interactions on clinical outcomes.
Supporting information
S1 Appendix. Study protocol.
(PDF)
S2 Appendix. PRISMA Checklist.
(DOC)
S3 Appendix. Full search strategy.
(PDF)
S1 Table. A summary of author contacts.
(PDF)
S2 Table. A list of the excluded studies along with reasons for exclusion.
(PDF)
S3 Table. A summary of all decisions and their rationale with respect to the statistical data
included in the meta-analysis.
(PDF)
Association between physician-pharmaceutical companies interactions and clinical practices
PLOS ONE | https://doi.org/10.1371/journal.pone.0175493 April 13, 2017 24 / 28

S1 Fig. Sensitivity analysis- exclusion of high risk of bias studies.
(TIF)
S2 Fig. Sensitivity analysis-exclusion of industry-sponsored study.
(TIF)
S3 Fig. Sensitivity analysis- exclusion of studies with indirect measures of outcomes.
(TIF)
Acknowledgments
We would like to thank Ms. Aida Farha for her valuable help in designing the search strategy
as well as the Alliance for Health Policy and Systems Research for supporting the work of our
group on systematic reviews related to health policy and health systems.
We would also like to thank Andrea Darzi (MD, MPH) for editing the manuscript.
Author Contributions
Conceptualization: EAA.
Data curation: HB RF LA LAK HN.
Formal analysis: EAA HB RF.
Methodology: EAA HB RF.
Project administration: HB RF FEJ LA LAK.
Resources: EAA.
Supervision: EAA.
Validation: EAA HB RF.
Writing – original draft: EAA HB RF.
Writing – review & editing: EAA HB RF FEJ LA LAK HN.
References1. The PEW Charitable Trusts. Persuading the Prescribers: Pharmaceutical Industry Marketing and its
Influence on Physicians and Patients. 2013. Accessed from http://www.pewtrusts.org/en/research-and-
analysis/fact-sheets/2013/11/11/persuading-the-prescribers-pharmaceutical-industry-marketing-and-
its-influence-on-physicians-and-patients.
2. Lexchin J: Are drugs too expensive in Canada? Yes. Can Fam Physician 2006, 52:573–576, 578–581.
3. Gagnon MA, Lexchin J: The cost of pushing pills: a new estimate of pharmaceutical promotion expendi-
tures in the United States. PLoS Med 2008, 5(1):e1. https://doi.org/10.1371/journal.pmed.0050001
PMID: 18177202
4. Code on Interactions with Healthcare Professionals [http://www.phrma.org/code_on_interactions_with_
healthcare_professionals]
5. Rutledge P, Crookes D, McKinstry B, Maxwell SR: Do doctors rely on pharmaceutical industry funding
to attend conferences and do they perceive that this creates a bias in their drug selection? Results from
a questionnaire survey. Pharmacoepidemiol Drug Saf 2003, 12(8):663–667. https://doi.org/10.1002/
pds.884 PMID: 14762982
6. Morgan MA, Dana J, Loewenstein G, Zinberg S, Schulkin J: Interactions of doctors with the pharmaceu-
tical industry. J Med Ethics 2006, 32(10):559–563. https://doi.org/10.1136/jme.2005.014480 PMID:
17012493
7. Gross GA, Ference JD: Pharmaceutical representative rounds: Teaching resident physician-pharma-
ceutical representative interactions. Osteopathic Family Physician 2011, 3(3):123–126.
Association between physician-pharmaceutical companies interactions and clinical practices
PLOS ONE | https://doi.org/10.1371/journal.pone.0175493 April 13, 2017 25 / 28

8. Othman N, Vitry A, Roughead EE: Quality of pharmaceutical advertisements in medical journals: A sys-
tematic review. PLoS ONE 2009, 4(7).
9. Wazana A: Physicians and the pharmaceutical industry: is a gift ever just a gift? Jama 2000, 283
(3):373–380. PMID: 10647801
10. Ziegler MG, Lew P, Singer BC: The accuracy of drug information from pharmaceutical sales representa-
tives. Jama 1995, 273(16):1296–1298. PMID: 7715044
11. Spurling GK, Mansfield PR, Montgomery BD, Lexchin J, Doust J, Othman N et al: Information from
pharmaceutical companies and the quality, quantity, and cost of physicians’ prescribing: a systematic
review. PLoS Med 2010, 7(10):e1000352. https://doi.org/10.1371/journal.pmed.1000352 PMID:
20976098
12. Pedan A, Wu H: Asymmetric responsiveness of physician prescription behavior to drug promotion of
competitive brands within an established therapeutic drug class. Health Mark Q 2011, 28(2):133–154.
https://doi.org/10.1080/07359683.2011.545341 PMID: 21590561
13. Chressanthis GA, Khedkar P, Jain N, Poddar P, Seiders MG: Can Access Limits on Sales Representa-
tives to Physicians Affect Clinical Prescription Decisions? A Study of Recent Events With Diabetes and
Lipid Drugs. Journal of Clinical Hypertension 2012, 14(7):435–446. https://doi.org/10.1111/j.1751-
7176.2012.00651.x PMID: 22747616
14. Lieb K, Scheurich A: Contact between doctors and the pharmaceutical industry, their perceptions, and
the effects on prescribing habits. PLoS One 2014, 9(10):e110130. https://doi.org/10.1371/journal.
pone.0110130 PMID: 25330392
15. DeJong C, Aguilar T, Tseng CW, Lin GA, Boscardin WJ, Dudley RA: Pharmaceutical Industry-Spon-
sored Meals and Physician Prescribing Patterns for Medicare Beneficiaries. JAMA Intern Med 2016,
176(8):1114–1110. https://doi.org/10.1001/jamainternmed.2016.2765 PMID: 27322350
16. Yeh JS, Franklin JM, Avorn J, Landon J, Kesselheim AS: Association of Industry Payments to Physi-
cians With the Prescribing of Brand-name Statins in Massachusetts. JAMA Intern Med 2016, 176
(6):763–768. https://doi.org/10.1001/jamainternmed.2016.1709 PMID: 27159336
17. Sondergaard J, Vach K, Kragstrup J, Andersen M: Impact of pharmaceutical representative visits on
GPs’ drug preferences. Fam Pract 2009, 26(3):204–209. https://doi.org/10.1093/fampra/cmp010
PMID: 19273463
18. Hurley MP, Stafford RS, Lane AT: Characterizing the relationship between free drug samples and pre-
scription patterns for acne vulgaris and rosacea. JAMA dermatology 2014, 150(5):487–493. https://doi.
org/10.1001/jamadermatol.2013.9715 PMID: 24740450
19. Pinckney RG, Helminski AS, Kennedy AG, Maclean CD, Hurowitz L, Cote E: The effect of medication
samples on self-reported prescribing practices: a statewide, cross-sectional survey. J Gen Intern Med
2011, 26(1):40–44. https://doi.org/10.1007/s11606-010-1483-x PMID: 20809157
20. Alkhaled L, Kahale L, Nass H, Brax H, Fadlallah R, Badr K et al: Legislative, educational, policy and
other interventions targeting physicians’ interaction with pharmaceutical companies: a systematic
review. BMJ open 2014, 4(7):e004880. https://doi.org/10.1136/bmjopen-2014-004880 PMID:
24989618
21. Guyatt GH, Oxman AD, Vist G, Kunz R, Brozek J, Alonso-Coello Pet al: GRADE guidelines: 4. Rating
the quality of evidence—study limitations (risk of bias). J Clin Epidemiol 2011, 64(4):407–415. https://
doi.org/10.1016/j.jclinepi.2010.07.017 PMID: 21247734
22. Fincham JE: Response rates and responsiveness for surveys, standards, and the Journal. Am J Pharm
Educ 2008, 72(2):43. PMID: 18483608
23. Sterne JA, Sutton AJ, Ioannidis JP, Terrin N, Jones DR, Lau J et al: Recommendations for examining
and interpreting funnel plot asymmetry in meta-analyses of randomised controlled trials. BMJ 2011,
343:d4002. https://doi.org/10.1136/bmj.d4002 PMID: 21784880
24. Iorio A, Spencer FA, Falavigna M, Alba C, Lang E, Burnand Bet al: Use of GRADE for assessment of
evidence about prognosis: rating confidence in estimates of event rates in broad categories of patients.
BMJ 2015, 350:h870. https://doi.org/10.1136/bmj.h870 PMID: 25775931
25. Caamano F, Figueiras A, Gestal-Otero JJ: Influence of commercial information on prescription quantity
in primary care. Eur J Public Health 2002, 12(3):187–191. PMID: 12232957
26. Figueiras A, Caamano F, Gestal-Otero JJ: Influence of physician’s education, drug information and
medical-care settings on the quality of drugs prescribed. Eur J Clin Pharmacol 2000, 56(9–10):747–
753. PMID: 11214787
27. Bowman MA, Pearle DL: Changes in drug prescribing patterns related to commercial company funding
of continuing medical education. J Contin Educ Health Prof 1988, 8(1):13–20. PMID: 10294441
Association between physician-pharmaceutical companies interactions and clinical practices
PLOS ONE | https://doi.org/10.1371/journal.pone.0175493 April 13, 2017 26 / 28

28. Miller DP, Mansfield RJ, Woods JB, Wofford JL, Moran WP: The impact of drug samples on prescribing
to the uninsured. South Med J 2008, 101(9):888–893. https://doi.org/10.1097/SMJ.
0b013e3181814d52 PMID: 18708971
29. Orlowski JP, Wateska L: The effects of pharmaceutical firm enticements on physician prescribing pat-
terns. There’s no such thing as a free lunch. Chest 1992, 102(1):270–273. PMID: 1623766
30. Chren MM, Landefeld CS: Physicians’ behavior and their interactions with drug companies. A controlled
study of physicians who requested additions to a hospital drug formulary. Jama 1994, 271(9):684–689.
PMID: 8309031
31. Haayer F: Rational prescribing and sources of information. Social science & medicine 1982, 16
(23):2017–2023.
32. Symm B AM, Forjuob SN, Preece: Effects of using free sample medications on the prescribing practices
of family physicians. J Am Board Fam Med 2006, 19:443–449. PMID: 16951293
33. Anderson BL, Silverman GK, Loewenstein GF, Zinberg S, Schulkin J: Factors associated with physi-
cians’ reliance on pharmaceutical sales representatives. Acad Med 2009, 84(8):994–1002. https://doi.
org/10.1097/ACM.0b013e3181ace53a PMID: 19638762
34. Becker MH, Stolley PD, Lasagna L, McEvilla JD, Sloane LM: Correlates of physicians’ prescribing
behavior. Inquiry 1972, 9(3):30–42. PMID: 4262972
35. Mizik N JR: Are Physicians "Easy Marks"? Quantifying the Effects of Detailing and Sampling on New
Prescriptions. Management Science 2004, 50(12):1704–1715.
36. Muijrers PE, Grol RP, Sijbrandij J, Janknegt R, Knottnerus JA: Differences in prescribing between GPs:
impact of the cooperation with pharmacists and impact of visits from pharmaceutical industry represen-
tatives. Fam Pract 2005, 22(6):624–630. https://doi.org/10.1093/fampra/cmi074 PMID: 16055474
37. Peay MY, Peay ER: The role of commercial sources in the adoption of a new drug. Social science &
medicine 1988, 26(12):1183–1189.
38. Grande D: Limiting the influence of pharmaceutical industry gifts on physicians: self-regulation or gov-
ernment intervention? J Gen Intern Med 2010, 25(1):79–83. https://doi.org/10.1007/s11606-009-1016-
7 PMID: 19756874
39. Rosenthal MB, Mello MM: Sunlight as disinfectant—new rules on disclosure of industry payments to
physicians. N Engl J Med 2013, 368(22):2052–2054. https://doi.org/10.1056/NEJMp1305090 PMID:
23718162
40. Othman N, Vitry AI, Roughead EE, Ismail SB, Omar K: Medicines information provided by pharmaceuti-
cal representatives: a comparative study in Australia and Malaysia. BMC Public Health 2010, 10:743.
https://doi.org/10.1186/1471-2458-10-743 PMID: 21118551
41. Mintzes B, Lexchin J, Sutherland JM, Beaulieu MD, Wilkes MS, Durrieu G et al: Pharmaceutical sales
representatives and patient safety: a comparative prospective study of information quality in Canada,
France and the United States. J Gen Intern Med 2013, 28(10):1368–1375. https://doi.org/10.1007/
s11606-013-2411-7 PMID: 23558775
42. Silversides A: Tight regulation of French drug reps mean French doctors get more balanced information
than doctors in the US. BMJ 2010, 341:c6964. https://doi.org/10.1136/bmj.c6964 PMID: 21131344
43. 2016 AMAMAnCoC-wimfmp.
44. Spithoff S: Industry involvement in continuing medical education: time to say no. Can Fam Physician
2014, 60(8):694–696, 700–693. PMID: 25122806
45. Zetterqvist AV, Mulinari S: Misleading advertising for antidepressants in Sweden: a failure of pharma-
ceutical industry self-regulation. PLoS One 2013, 8(5):e62609. https://doi.org/10.1371/journal.pone.
0062609 PMID: 23650519
46. Ostini R, Hegney D, Jackson C, Williamson M, Mackson JM, Gurman K et al: Systematic review of inter-
ventions to improve prescribing. Ann Pharmacother 2009, 43(3):502–513. https://doi.org/10.1345/aph.
1L488 PMID: 19261953
47. O’Brien MA, Rogers S, Jamtvedt G, Oxman AD, Odgaard-Jensen J, Kristoffersen DT et al: Educational
outreach visits: effects on professional practice and health care outcomes. Cochrane Database Syst
Rev 2007(4):CD000409. https://doi.org/10.1002/14651858.CD000409.pub2 PMID: 17943742
48. The Hilltop Institute. Academic Detailing: A Review of the Literature and States’Approaches. 2009.
Accessed from: http://www.hilltopinstitute.org/publications/
AcademicDetailingReviewOfTheLiteratureAndStates’Approaches-December2009.pdf.
49. Norris P, Herxheimer A., Lexchin J., & Mansfield P.: Drug promotion. What we know, what we have yet
to learn Reviews of materials in the WHO/HAI database on drug promotion. 2005.
Association between physician-pharmaceutical companies interactions and clinical practices
PLOS ONE | https://doi.org/10.1371/journal.pone.0175493 April 13, 2017 27 / 28

50. Carroll AE, Vreeman RC, Buddenbaum J, Inui TS: To what extent do educational interventions impact
medical trainees’ attitudes and behaviors regarding industry-trainee and industry-physician relation-
ships? Pediatrics 2007, 120(6):e1528–1535. https://doi.org/10.1542/peds.2007-0363 PMID: 18055668
51. Zipkin DA, Steinman MA: Interactions between pharmaceutical representatives and doctors in training.
A thematic review. J Gen Intern Med 2005, 20(8):777–786. https://doi.org/10.1111/j.1525-1497.2005.
0134.x PMID: 16050893
Association between physician-pharmaceutical companies interactions and clinical practices
PLOS ONE | https://doi.org/10.1371/journal.pone.0175493 April 13, 2017 28 / 28