Embed Size (px)
Citation preview
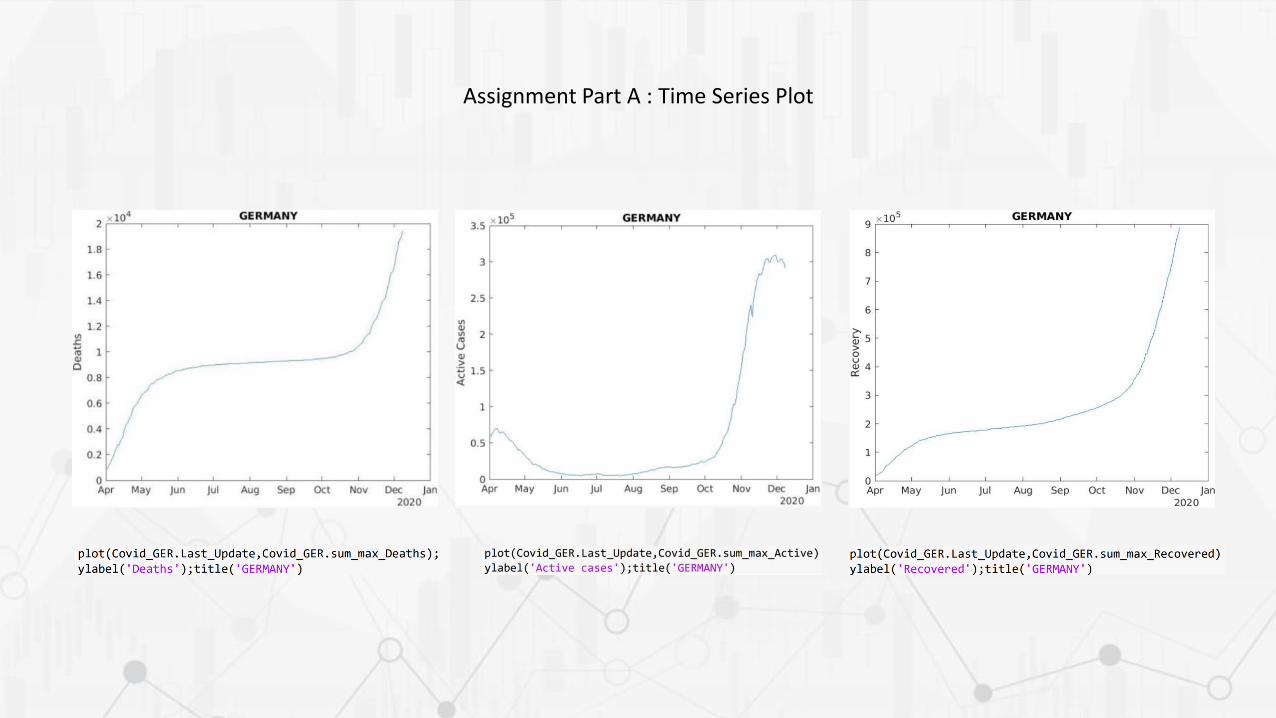
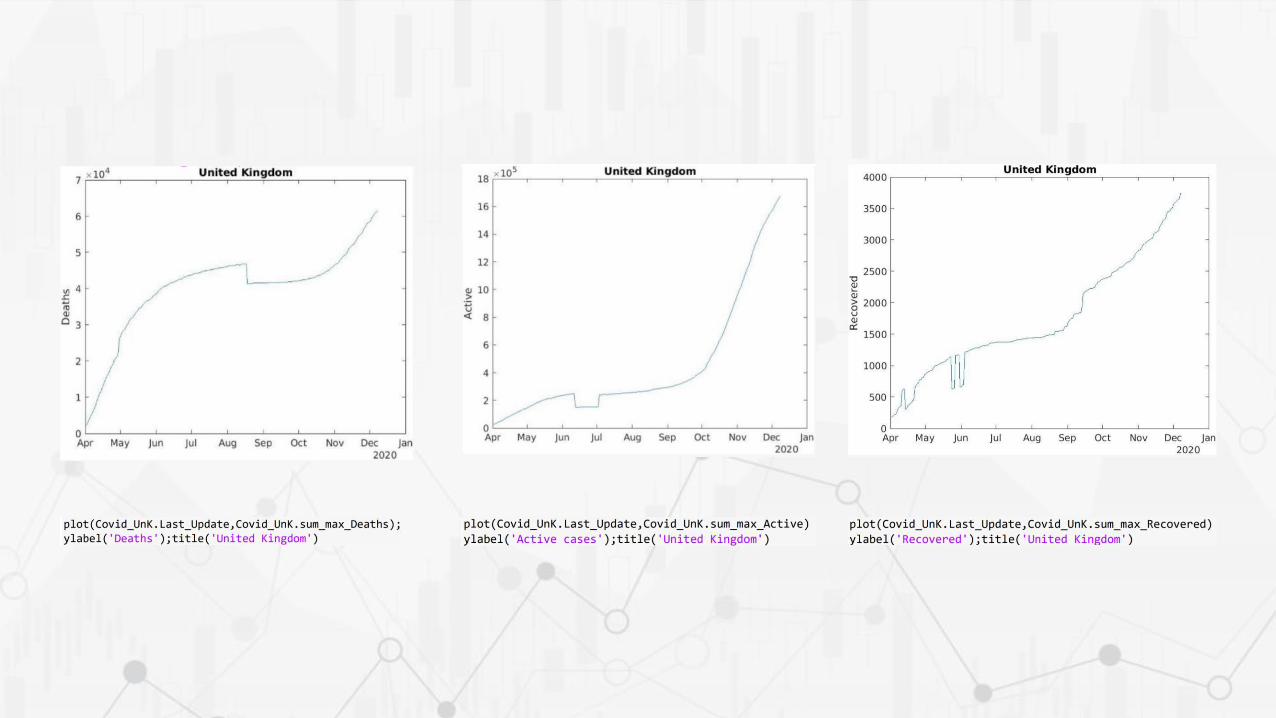
Assignment Part A : Time Series Plot
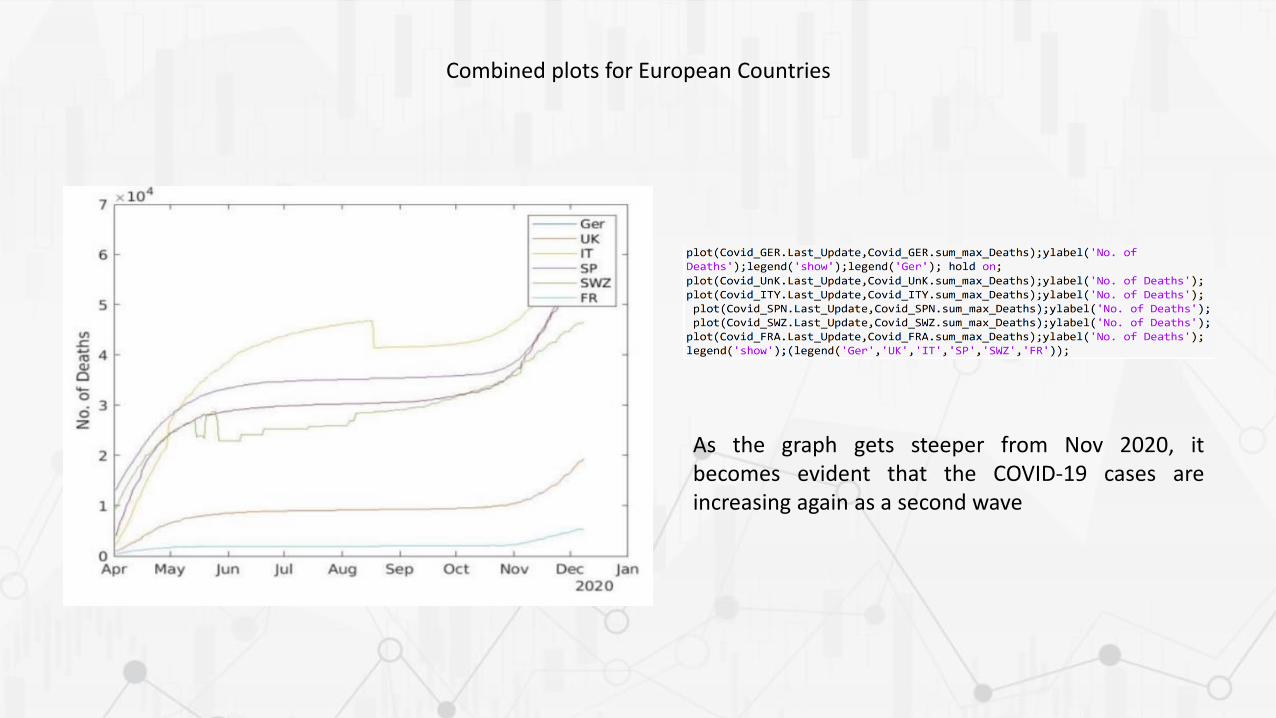
Combined plots for European Countries
As the graph gets steeper from Nov 2020, itbecomes evident that the COVID-19 cases areincreasing again as a second wave

Assignment Part B : Project Schema

Based on Process/Inspection MonitoringRequirement, multiple skinthermocouples are installed on drums atdifferent locations along the axial length.
For this Project Thermocouple data atsupport skirt-cone-shell junction isconsidered.
These sensors provide the temperaturedata at regular intervals which is themain predictor variable in this project.
Surface Thermocouple Sensors
Assignment Part B : Source of Data

Assignment Part B : Data Schema
Historian of Temperature data was recorded for every one-minute operations. From 1st of Sep 2020 to 10th of Dec2020.Ideally one complete cycle designed 48 hour ~ 2880 minutes. We have got 100 days of data, which means 50 completecycle data to get processed.
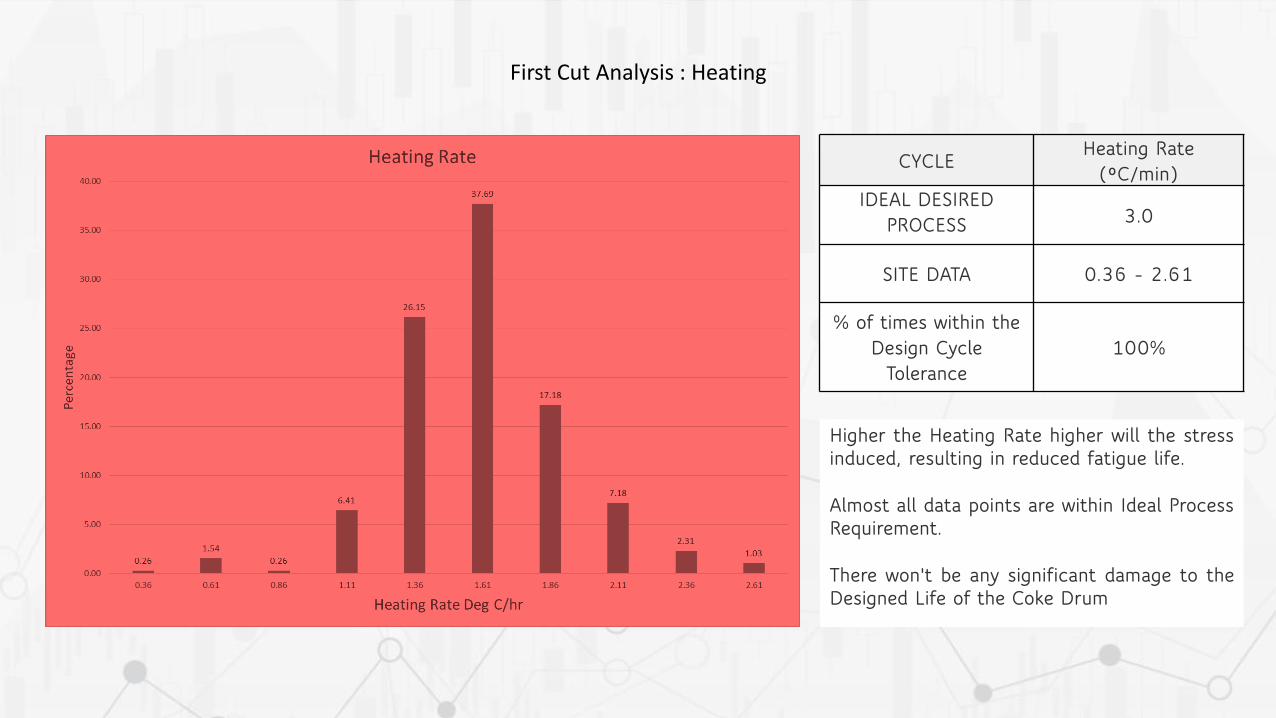
First Cut Analysis : Heating
CYCLEHeating Rate
(°C/min)IDEAL DESIRED
PROCESS 3.0
SITE DATA 0.36 - 2.61
% of times within the Design Cycle
Tolerance100%
Higher the Heating Rate higher will the stressinduced, resulting in reduced fatigue life.
Almost all data points are within Ideal ProcessRequirement.
There won't be any significant damage to theDesigned Life of the Coke Drum

First Cut Analysis : Cooling
Higher the Cooling Rate higher will the stressinduced, resulting in reduced fatigue life.
Almost 90% data points are within IdealProcess Requirement.
Still, on the conservative front, we haveassumed 0.85 deg/min in the FEA toevaluate fatigue life.
CYCLECooling Rate
(°C/min)IDEAL DESIRED
PROCESS 2.3
SITE DATA 0.22 - 6.03
% of times within the Design Cycle
Tolerance89.23%

Scripts