Embed Size (px)
Citation preview

Assessment of Scatter Components in High-Resolution PET: Correction by NonstationaryConvolution SubtractionM. Bentourkia, P. Msaki, J. Cadorette and R. Lecomte
Department of Nuclear Medicine and Radiobiology, University of Sherbrooke, Sherbrooke, Québec,Canada
This paper describes a new approach to determine individualscatter kernels and to use them for scatter correction by integraltransformation of the projections. Methods: Individual scattercomponents are fitted on the projections of a line source bymonoexponentials. The position-dependent scatter parametersof each scatter component are then used to design non-station
ary scatter correction kernels for each point in the projection.These kernels are used in a convolution-subtraction method
which consecutively removes object, collimator and detectorscatter from projections. This method is based on a model whichassumes that image degradation results exclusively from Comp-
ton interactions of annihilation photons, thus neglecting furtherCompton interactions of object scatters with collimator and detector. Results: Subtraction of the object scatter componentimproved contrast typical of what is obtained with standard convolution-subtraction methods. The collimator scatter component
is so weak that it can be safely combined with object scatter forcorrection. Subtraction of detector scatter from images did notimprove contrast because statistical accuracy is degraded byremoving counts from hot regions while cold regions (background) remain unchanged. Conclusion: Subtraction of objectand collimator scatter improves contrast only. The slight gain inimage sharpness resulting from the subtraction of detector scatter does not justify removal of this component at the expense ofsensitivity.
Key Words: PET; scattercomponents;detectorscatter;scattercorrection
J NucÃMed 1995; 36:121-130
kjcatter is one of the main causes of degradation of PETimages, resulting in loss of contrast, resolution and quantitative accuracy. Until recently (/), object and collimatorscatters were perceived as being the only scatter components responsible for degradation (2-7). However, in addition to the object and collimator scatter, photon spillagefrom primary to secondary detectors can add a significantscatter contribution to the events acquired with very high
resolution PET systems based on arrays of narrow anddeep detectors (8-13). In these systems, detector scattertends to reduce the overall spatial resolution, mainly bybroadening the distribution below the FWTM (11,12). Correction for these effects requires knowledge of the magnitude and shape of individual scatter components as a function of source position, scattering medium and energythreshold.
In this work, a method is presented to extract the scattercomponents originating from the object, the collimator andthe detector by fitting the projection response functionsobtained with a line source at different locations in theFOV with simple analytical functions. The amplitude andshape of the individual scatter response functions areshown to be well described by monoexponential functionswhich can then be used to generate nonstationary scattercorrection kernels. These kernels are subsequently usedfor removal of the individual scatter components in imagesby a consecutive convolution-subtraction approach basedon the integral transform method (3).
THEORY
Scatter ComponentsThe measured projection Pm of a high-resolution PET
system can be treated as the sum of true events (T), object(S0), collimator (Sc) and detector (Sd) scattered events:
Pm = T + S„+ Sc + S,'d. Eq. 1
Received Dec. 23,1993; revision accepted July 12,1994.For correspondence or reprints contact: Dr. Roger Lecomte, Department of
Nuclear Medicine and Radiobiology, Universitéde Sherbrooke, Sherbrooke,Québec,Canada J1H 5N4.
The scatter components in this model are assumed to bethe result of independent processes which neglect subsequent Compton interactions of object scattered photons inthe collimator and detector, as well as subsequent Compton interactions of collimator scattered photons in the detector. This is a valid assumption when such processes areweak or have negligible effects on the scatter distribution(6).
Many scatter correction methods estimate the scatterresponse function of the system from the response to a lineor point source (2-6, 14-16). Based on the above assumption, the normalized overall system response h(xs, x) to aline source at location in the object corresponding to position xs in the projection is also given as the sum of fourcomponents:
Scatter Correction in High Resolution PET •Bentourkia et al. 121
by on May 26, 2018. For personal use only. jnm.snmjournals.org Downloaded from

DetectareObjectscatter Broad
distribution
Une source
FIGURE 1. Schematicdiagramof the originand shapeof objectscatter.
DetectorsBrood
distribution
FIGURE 2. Schematicdiagramof the originand shape of colli-mator scatter.
h(xs, x) = 2j h¡(xs,x), Eq.2
where h¡(xs,x) are the individual position-dependent projection response functions for object scatter (i = o), colli-mator scatter (i = c), detector scatter (i = d) and intrinsicor geometric detector response (i = g). Their relative intensities are described by the scaling factors f¡which represent the fraction of each component (2 f¡= 1):
'= j h¡>fj(xs)= h¡(xs,x) dx. Eq. 3
It follows from the above assumptions that the collimatorand detector scatter components can be estimated from ameasurement made with the line source in the absence ofthe scattering media, since the physical processes leadingto these components are independent of the object. Thedependence of h(xs, x) on source depth in the object isweak, as many authors have demonstrated (2-4). Thedepth dependence of the object scatter component wasthus assumed negligible in this work.
Object Scatter. The object scatter component is formedby annihilation photons which have interacted in the objectby Compton effect. Figure 1 is a schematic representationof a single-interaction object scatter. The object scatterprofile in the projection must be estimated for every objectsince it is dependent upon the size, shape and uniformity ofthe media around the source. Since the attenuation pathlengths about the source located at the center of a uniformcylindrical object are symmetrically distributed, the objectscatter distribution is expected to be symmetric about xs =0. The asymmetry of the distribution progressively increases as the source moves laterally towards the edge ofthe object. The outer wing has a lower slope because itcorresponds to the side with smaller photon path lengths inthe object (2-5,17). The amplitude of object scatter is alsoexpected to decrease across the FOV due to the sameeffect.
Collimator Scatter. Figure 2 is a schematic representation of the origin of the collimator scatter in the projection.Based on the assumption of independent processes, thisscatter component can be estimated from the measurementof a line or point source in air. Scattering in the collimatortakes place closer to the detector and is forward peaked.The corresponding projection is thus expected to be centered on the source position and slightly narrower than the
object scatter. The collimator scatter distribution is characteristic of the system configuration. For suitably designed collimators, the solid angle for coincident radiationincident from the source is relatively small and, therefore,this scatter component is expected to be small (2). Inpractice the collimator scatter component is mixed with,but indistinguishable from, other effects such as singlegamma events detected in coincidence with annihilationradiation.
Detector Scatter. High resolution PET systems are oftenmade with long narrow detectors to increase detectionefficiency and spatial resolution. However, the narrowerthe detectors, the greater the spillage of annihilation photons from primary to secondary detectors in the array(10,13). Case 4 in Figure 3 illustrates the effect of annihilation photon spillage where a small amount of energybelow lower discrimination level is deposited in the primary detector and the rest is deposited and registered in asecondary detector. Annihilation photons scattered by surrounding materials such as intercrystal shielding septa ordetector package and registered in a neighboring detectoralso contribute to detector scatter. Due to the high densityof detector materials, this scatter contribution is confinedto a narrow distribution around the primary detector, asshown in Figure 4. For this reason, the contribution fromdetector scatter has been ignored in medium- and low-resolution scanners, as it has a negligible effect on theoverall response function. For the same reason, it has beenassumed in this work that scattering in the detector has anegligible effect on the object and collimator scatter distributions. The detector scatter is characteristic of the detec-
3511
keV•^¡r-"\V42^f* PrimarydetectorSecondary
detector
RGURE 3. Illustrationof detectorinteractionschemes:(Case 1)photoelectric interaction depositing all the incident energy in theprimary detector; (Case 2) Compton forward scatter depositing asmall amount of energy (E < 250 keV) in the primary detector; (Case3) Compton backward scatter depositing a larger amount of energy(250 keV s E ==340 keV) in the primary detector; and (Case 4)multiple-energy deposit in primary and secondary detectors.
122 The Journal of Nuclear Medicine •Vol. 36 •No. 1 •January 1995
by on May 26, 2018. For personal use only. jnm.snmjournals.org Downloaded from

Detectare
Narrowdistribution
FIGURE 4.tor scatter.
Schematic diagram of the origin and shape of detec
tion system and is dependent upon the energy discrimination threshold (72).
Geometric Detector Response Function. The geometricdetector response function is formed by annihilation photons which have not interacted with neither the object northe collimator. Since such photons carry exact informationabout the location of the source and the concentration ofradioactivity in the object, they form the true component.According to Figure 3, annihilation photons impinging onthe detector array can be completely absorbed in the primary crystal (Case 1), be scattered in the primary crystaland either escape from the detector array (Cases 2 and 3) orbe absorbed in a secondary crystal (Case 4). When theenergy deposited in the primary crystal is above the lowerdiscrimination threshold, Cases 1, 2 and 3 contribute to thegeometric detector response.
The events associated with Case 4 become ambiguous,and are thereby rejected when energies deposited in secondary and primary crystals are both greater than thelower energy discrimination levels of respective detectors.If the energy deposited in the primary detector is above theenergy discrimination level and the scattered energy deposited in the secondary detector is below the energy discrimination level or lost in the intercrystal septa or detectorpackage, the event becomes part of the geometric detectorresponse, which is well-positioned. Monte Carlo simula
tions of annihilation photons impinging on a linear array of3 x 5 x 20 mm BGO crystals without package have shownthat the relative amounts of events illustrated in Figure 3are: 64% for Case 1, 23% for Cases 2 and 3 combined and13% for Case 4 (7).
When the line-of-response (LOR) passes through the
center of the tomograph FOV, the detectors are paralleland the geometric detector response function, which isdictated exclusively by the physical dimensions of the detectors and is triangular in shape, as shown in Figure 5(left). As the source is moved off center, detector overlapincreases and, as a result, the shape of the geometric detector response function varies with source position in theFOV. Once the source position has been specified, thewidth of the geometric detector response function isuniquely defined by a set of parallel LORs connecting thecoincident detectors over the source. Note that other effects, including positron range in the source and deviationfrom 180°emission of the annihilation photons, which
broaden the distribution by amounts comparable to the
Detectara
FIGURE 5. Geometric detector response function for LORscrossing the center (left) and off-center (right). Note that the extent of
the geometric detector response is entirely determined by the geometry of the detectors.
detector geometric and scatter components, will be considered to be part of the detector scatter component withthe current assumptions (18).
Consecutive Convolution-Subtraction ApproachBergström et al. (3) have shown that the scatter distri
bution in the projection can be estimated and subtracted byintegral transformation of the projections using a scattercorrection kernel. Since the object, collimator and detectorscatter components were assumed to be independent ofeach other, the desired or corrected projection data Pocdconsisting of only true events can be estimated from themeasured projection data Pm by successive convolution (*)
subtraction processes of the form:
p = p —P1 <i l m * rr
Po = P - PO *
POCO- POC~ POC *
Eq. 4
where P¡is the projection free of scatter component(s) i =o, oc, ocd. F0, F¿and F'¿are the scatter correction kernels
for object, collimator and detector scatter, respectively,estimated from line source measurements as described below. The standard Bergström approach is applied to estimate object scatter from the measured projection Pm. Sincethe object scatter corrected projection P0 is a better estimate of the trues than Pm, the former is used to estimatethe collimator scatter, and so on for the detector scatter. Inthese calculations, the collimator Fc and detector Fd scatter kernels are renormalized as:
D
30.4mmetectonSÕ5ZL—coHlmotof/Une source\•^^c^110mm135mmLeadB7.omm310mmDetectan
FIGURE 6. Schematic of the PET simulator used for the measurements. One detector array and the object can be rotated toacquire tomographic data.
Scatter Correction in High Resolution PET •Bentourkia et al. 123
by on May 26, 2018. For personal use only. jnm.snmjournals.org Downloaded from

Fe
1-fn1-fo-fc' Eq. 5
where the fractions f¡are defined in Equation 3. Rearranging Equation 4, the following expression is obtained:
ocd = {[Pm * * (6 - F¿)}* (5 - F3) , Eq. 6
where 0 is the Dirac delta function as formally defined.Even though the convolution operation is commutative,the order in which the successive convolution-subtraction
operations are applied in Equation 6 is not, since it followsfrom the model used to describe the scatter degradationprocesses. The innermost convolution removes the overallobject scatter from Pm to produce the projection distribution which would result if only annihilation photons wereimpinging on the detection system. Similarly, the secondconvolution removes collimator scatter to produce the projection distribution resulting from a pure annihilation photon flux on the detector arrays.
MATERIALS AND METHODS
Phantom MeasurementsAll measurements were carried out using the Sherbrooke PET
camera simulator represented schematically in Figure 6 (11,19).The system was set up to simulate an animal-size, 310-mmdiameter ring PET camera with 256 discrete detectors based on avalanche photodiodes (20,27). The energy threshold on each detector was set at 350 keV. The system response functions weremeasured using a line source of 22Nahaving an effective diameter
of 0.85 mm. Other measurements were made with phantoms containing sources of ::Na in water solutions.
Two sets of measurements were conducted in order to obtainthe projection response function h(xs, x) as a function of positionxs. In the first set, the line source was placed at 11 positionsequally spaced from -50 mm to 50 mm along the diameter of the
FOV and data forming the parallel projections were acquired.Since projections have 64 bins, it would be necessary to interpolate or take additional measurements along the diameter to obtainthe projection response for each bin. In order to overcome thisinconvenience, the second set consisted of one tomographic measurement made with a line source at 50 mm from the center.Assuming the response functions are depth independent (2-4), itis conceivable that the projection response function for each bincan be extracted from the sinogram of this single measurement.Both measurements were made with the line source in air and ina 110-mmcylindrical plexiglas phantom.
Additional measurements were made with a cold spot phantomhaving two 10-mmcylindrical cold regions for contrast evaluationand a pie hot spot phantom having active regions ranging from 1to 3 mm in diameter for resolution study.
Efficiency calibration measurements were made with a planesource in air after each set of measurements. Randoms weresimultaneously acquired in a delayed coincidence time windowfor all measurements, including the calibration. The data wererebinned into 128 projections of 64 parallel LORs after randomsubtraction and detector efficiency normalization, as describedelsewhere (19). The corrected projections of the line source measurements were used to fit the scatter components. Phantomimages were reconstructed by filtered backprojection using projection data interpolated to 0.95 mm bins and with a ramp having
a high frequency roll-offgiven by a Butterworth filter of parametern = 2 and fc = 32 bin"1, unless otherwise specified. No attenua
tion correction was made in order to assess the effect of scattercorrection alone.
Fitting ProcedureIn addition to the geometric detector response, the projections
are assumed to consist of collimator and detector scatter components for the measurements taken with the line source in air, andof object, collimator and detector scatter components for themeasurements taken with the line source in the cylindrical phantom. In this work, only the spatial extent of the simulated geometric detector response was used in the scatter component fittingprocedures. The experimental detector response adjusted for thisspatial extent is simply the residual after all the scatter components have been subtracted from the measured system responsefunction h(xs, x).
The scatter functions h¡(xs,x) were fitted on the measuredsystem response to a line source (corrected as described) bymonoexponential functions of the form:
h¡(xs,x) = A¡(xs)e~ Sa(xJ|x~ Xsl x < xs
= A¡(xs)e' s*<x')|x- xj x > xs,Eq.7
where A| is the amplitude and S¡,and Sir are the left and rightdecay constants or slopes of the position-dependent scatter component hj(xs, x), respectively. For each scatter component, thetwo exponential functions extrapolated from the wings were assumed to have an intersection at the peak position of the measured distribution. The grid-search method of least squares described elsewhere (22) was used to fit the three parameters A¡,Snand Sirof each scatter component. The data in the extreme bins ofthe projection were excluded to avoid edge effects. The parameters describing the shapes of the collimator scatter componentswere evaluated from the measurements of the line source in air.These values were used to fix the collimator scatter contributionswhile fitting the object and detector scatter component in themeasurements made with the line source in plastic.
Scatter Correction KernelsIn principle, the desired nonstationary scatter correction ker
nels required in Equation 6 can be estimated directly for each binusing the line source fitting technique described above. However,this approach is not feasible because of the inevitable large statistical fluctuations of the measured scatter parameters. This difficulty was overcome by approximating the position-dependentscatter parameters by simple analytical functions described below. These functions were used to extrapolate missing data nearthe edges of the FOV and to generate the desired kernels F¡foreach bin in the projection according to:
F¡(xs,x) = A¡(xs)e" Si(Xl)|x- Xl1 x < xs
= A¡(xs)e" s"(x>)|x- xj x ==xs,Eq. 8
where the amplitude A¡and the slopes Sn and 5jr are read directlyfrom the analytical functions approximating the scatter parameters. These kernels were used to consecutively subtract the different types of scatter from the measured projection data as described by Equation 6.
124 The Journal of Nuclear Medicine •Vol. 36 •No. 1 •January 1995
by on May 26, 2018. For personal use only. jnm.snmjournals.org Downloaded from

Analytical Approximation of Scatter ParametersSince the intensity of scatter in any material is expected to
increase with photon path length, the amplitude of the scatterfunctions can be approximated by an attenuation law of the form:
Eq. 9
where a,, and ai2are coefficients to be evaluated from the fit to theexperimental values of A¡(xs).The variable d¡(xjis the path lengthof the photons within the object, collimator or detector array fora source at location xs in the FOV. For the object, d0(xs)= Vr - x;, where r is the radius of the object. In the case of thecollimator and detector components, d¡(xs) is given by d¡(xs) =V(Rj + L¡)2- xj - VR? - \l, where R¡is the internal radius and
L¡is the radial length of the collimator or detector.The left and right slopes of the scatter functions were fitted with
exponential functions of the form:
Sj(xs) = b¡i- bi2e" b°Xt, Eq. 10
where bn, bi2and bi3are coefficients to be determined from the fitto the experimental values of S¡(xs).Due to the symmetry of thering geometry, the values of the left and right slopes of eachscatter component are expected to be symmetric about the center.For this reason, respective fits to the experimental Sn(xs) andSjr(xs)for i = o, e, d, were constrained to be symmetrical aboutthe center.
Performance AssessmentThe performance of the scatter correction procedure was as
sessed from the images of the cold spot and pie hot spot phantomswhere the object, collimator and detector scatter componentswere successively subtracted. The image contrast for the coldspot images was evaluated using the equation:
C =HR-CRHR + CR ' Eq. 11
where HR and CR are counts from hot and cold regions, respectively. Resolution recovery was assessed by visual inspection ofthe hot spot images and by quantitative measure of the resolutionof the line source response functions before and after successiveremoval of the scatter components.
0.1000
0.0010
...-Q... Measured in air
TruesDetector scotterCollimator scatter
•--•A----Measured in object "Object scatter
16 32Projection bin
FIGURE 7. Comparison of the response functions, summed overall projections and normalized to the maximum amplitude, for a linesource at the center of the FOV in air and in an 11-cm diameter
cylindrical phantom. The fitted components are also shown. Thedetector scatter component is the same for both the measurementsin air and in the scattering medium, as expected.
in air. The component representing the trues is the narrowest and its width relates to the system spatial resolution.The ultimate goal of the consecutive convolution-subtrac
tion described in this work is to ensure that images areformed by this component only.
Figure 8 is an example of an off-center (xs = 32 mm)
response function measured in the cylindrical phantom.This response function was extracted from the sinogram ofa line source located at 50 mm from the FOV center. It isevident that suitable data to estimate the scatter responsesas a function of position can be obtained from the tomo-
graphic measurement. However, some projections takenfrom the sinogram are distorted when the source lies outside the channels defined by the sensitive volume of thedetectors. It was observed that this sampling effect, which
RESULTS AND DISCUSSION
Scatter Component FittingThe projection response functions measured with the
line source at the center of the FOV in air and in thecylindrical phantom are compared in Figure 7. As expected, the object and collimator scatter contributions aredescribed fairly well by monoexponentials having lowslope values. The detector scatter is a narrow distributionconfined to the vicinity of the source location in the FOV.Its intensity and shape remain nearly the same irrespectiveof whether the measurement is made in air or in the phantom. This implies that, in the present imaging situation, thiscomponent can be evaluated with adequate accuracy frommeasurements taken with the source in air or in scatteringmedium. However, for larger objects, accurate extractionof the detector scatter component may be difficult since itis partly masked by object scatter. In such cases, thiscomponent should be estimated from measurements made
1.0000
0.1000
0.0100
0.0001
Object+Collimotor scatterDetector scatterTruesTotal tit
. . O-.- Data
32Projection bin
64
RGURE 8. Projection extracted from the sinogram of a linesource located at 50 mm from the center of the cylindrical phantom.The source position on the projection is 32 mm from the center. Theobject + collimator and detector fitted components as well as theresidual geometric detector response function are shown.
Scatter Correction in High Resolution PET •Bentourkia et al. 125
by on May 26, 2018. For personal use only. jnm.snmjournals.org Downloaded from

FIGURE 9. Parameters of the objectscatter component as a function of position:(A) amplitude and (B) slopes. The analyticalapproximations to the experimental valuesare also shown.
UlM Mute* ponl.cn l bin) Un«Mure* positon (tun)
FIGURE 10. Parameters of the collima-
tor scatter component as a function of position: (A) amplitude and (B) slopes. The parameters were obtained from line sourceresponse functions in air. The analytical approximations to the experimental values arealso shown.
B
Lin«More»powtion (bin) Un* Mure* po.itmn (b,nl
is typical of the high intrinsic resolution and poor packingfraction of the photodiode detectors used in the study (72),does not significantly affect the fitting procedure. Theasymmetry is evident from the fits of the object and detector scatter components at 32 mm from the center. It isinteresting to note that the steepest slope of the objectscatter is on the inner side of the distribution while that ofthe detector scatter is on the outer side. These observations emphasize the need for selective scatter correctionkernels to process the object and detector scatter components by the convolution-subtraction method.
Scatter ParametersThe results of the fitting procedure are summarized in
Figures 9-12 where the scatter parameters (amplitude, left
and right slopes, scatter fraction) for each scatter component have been plotted as a function of position in theprojection. The analytical functions used to approximatethese parameters are also shown and their coefficients aresummarized in Table 1.
Figure 9A shows the variation of the object scatter amplitude as a function of source position in the projectiondata. The highest amplitude is attained at the center of thephantom and its value decreases with distance from thecenter in accordance with the shape of the cylindricalphantom. This is also reflected by the object scatter fraction shown in Figure 12. Figure 9B represents the left andright slopes of the object scatter response as a function ofposition. As the source is moved off-center, the slope of
FIGURE 11. Parameters of the detectorscatter component as a function of positionas obtained from the measurement of theline source in air: (A) amplitude and (B)slopes. The analytical approximations to theexperimental values are also shown. Un« lourc» polll.cn (tain) Un«>ourc* ponl.cn (tain)
FIGURE 12. Trues and scatter-to-total
fractions for the line source in the cylindricalphantom: (A) experimental values and (B)calculated from analytical approximations.
-M-SÉ^¿
B
126 The Journal of Nuclear Medicine •Vol. 36 •No. 1 •January 1995
by on May 26, 2018. For personal use only. jnm.snmjournals.org Downloaded from

TABLE 1Coefficients of the Analytical Functions Used to Approximate the Parameters of Object, Collimator and Detector Scatter
Functions
AmplitudesObject
CollimatorDetectora,9.83
1CT64.46 1(T58.9 10 3BZ
(bin-1)-0.297
-0.31-1.0b,
(bin1)0.1
8.010 2
0.9Slopes*b2(bin
1)-0.2
0.2040.19b3(bin
1)0.06
-0.20-0.06
'Coefficients are given for the left slopes. The right slopes can be obtained by symmetry.
the outer wings is observed to decrease while that of theinner wings increases. Independent fits of the analyticalfunction (Eq. 10) to the left and right slope values confirmed the symmetry of the slopes relative to the centerwith intersecting values at the center (bin 32), in support ofthe symmetry constrained fitting procedure which wasused.
The amplitude of the collimator scatter function variesonly slightly with the source position (Fig. 10A) and theslopes are equal and almost constant, except near theedges of the field (Fig. 10B). Although the object and thecollimator scatter components appear to have similarshapes for a given source location (see Fig. 7), their scatterparameters as a function of source position are definitelydifferent.
The amplitude and slopes of the detector scatter functionare shown in Figure 11A and 11B. As for the collimator,the amplitude of the detector scatter function has a relatively small variation with source position, but the detectorscatter fraction increases significantly as the source ismoved off center (Fig. 12). This is caused by longer photonpath length through the detector array due to inclined photon incidence. Note that the shielding from neighbouringcrystals and detector packages both tend to increase detector scatter. The asymmetry of the wings at positionsother than the center is attributed to the slightly largerrange of forward scattered Compton photons on the inneras compared to the outer side of the ring. This is illustratedschematically in Figure 13. As a result, the inner wing ofthe detector scatter function has a lower slope (larger extent), contrary to what was observed with the object scatter function.
Outer slope(Bockward
Detectors
Inner slope(Forward scatter)
\"Nuny source
FIGURE 13. Illustrationof the originof asymmetryof the slopesfor the detector scatter function. The forward scattered Comptonphotons have a higher probability to be registered on the inner sideof the ring.
ScatterCorrectionKernelsWe noted from the results presented in Figures 9-12 that
the object, collimator and detector scatter componentshave characteristics which differ significantly not only inmagnitude and shape, but also as a function of position inthe FOV. The magnitude of the object scatter is particularly large at the center of FOV while the opposite is truefor the detector scatter. This means that stationary kernelsextracted from a single-line source measurement at the
center of FOV would overestimate object scatter and underestimate detector scatter off center. In addition, objectand detector scatters show opposite asymmetry characteristics as a function of position in the projection. Independent, nonstationary scatter correction kernels are obviously required for accurate compensation of these twoscatter components.
According to Figure 12, the magnitude of object scatteris less than that of the detector scatter for the phantom sizeused in this study (diameter =110 mm). Since detector and
object scatter distributions are independent, it is evidentthat as the object size increases, the object scatter is boundto exceed the detector scatter. Under these conditions, itmay not be possible to assume that object and detectorscattering are independent processes as we have done inthis work, since the contribution of object scatter to thedetector response may not be negligible. In order to takesuch effects into consideration and to design appropriatekernels to correct for these contributions, a more sophisticated degradation model would be required.
ScatterCorrection¡mageContrast. Figure 14A shows the image of the cold
spot phantom uncorrected and successively corrected forobject, collimator and detector scatter. As expected, subtraction of the collimator scatter component does not introduce noticeable visual changes in the image. However,subtraction of object and detector scatter introduces significant visual changes in the corrected images. Quantita-
TABLE 2Contrast of the Cold Spot Phantom Images
Uncorrected Object Collimator Detector
Contrast 78.6% 93.6% 96.4% 96.5%
Scatter Correction in High Resolution PET •Bentourkia et al. 127
by on May 26, 2018. For personal use only. jnm.snmjournals.org Downloaded from
643
512 -
382 -
o 251 -O)
or
120
-11
DotaCollObj+CollObj+Coll+DetColl scatterObj scatterDet scatterZero level
36 54 73 91Position (pixel) (1 pixel=0.95 mm)
109 127
FIGURE 14. (A) Imageof the coldspotphantom.Clockwise:withoutcorrection;objectscattersubtracted;objectand collimatorscattersubtracted; object, collimator and detector scatter subtracted. (B) Profiles through the cold spots showing the scatter contributions and theresultant profiles after the successive corrections.
live explanation for these observations can be deducedfrom the profiles of the corrected images displayed inFigure 14B. The scatter-to-total ratios for the object, col
limator and detector are 10%, 2% and 24%, respectively. Itis important to note that these amounts will change as the
object size increases or decreases. In a larger object, scattering in the object will reduce photon transmission per unitradioactivity, thereby lowering the true as well as collimator and detector scattered events. The scatter-to-trues ra
tio, however, is expected to remain unchanged for the
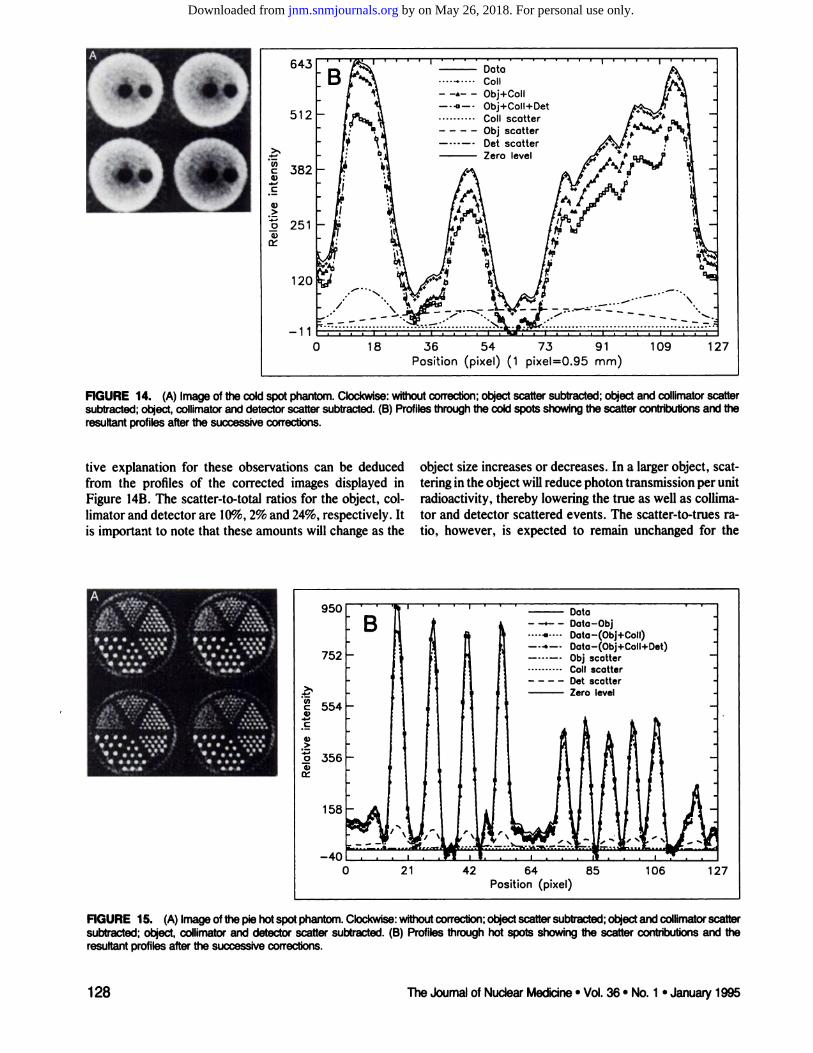
950 DataData-ObjData-(Obj-l-Coll)Doto-(Obj+Coll+Det)Obj scatterColl scatterDet scatterZero level
21 42 64Position (pixel)
85 106 127
FIGURE 15. (A) Imageof thepiehotspotphantom.Clockwise:withoutcorrection;objectscattersubtracted;objectand collimatorscattersubtracted; object, collimator and detector scatter subtracted. (B) Profiles through hot spots showing the scatter contributions and theresultant profiles after the successive corrections.
128 The Journal of Nuclear Medicine •Vol. 36 •No. 1 •January 1995
by on May 26, 2018. For personal use only. jnm.snmjournals.org Downloaded from

TABLE 3FWHM and FWTM of the Response Function to a Line
Source of ^Na at the Center of the Cylindrical Phantom
Uncorrected Object Collimator Detector
FWHM (mm)FWTM (mm)2.2 4.82.2 4.82.2 4.82.1 4.7
The images of the line source were reconstructed using a ramp filterof cut-off frequency 2.7 cm~1. The source had an effective diameter of
0.85 mm.
collimator and the detector components as object sizechanges.
The image contrast was evaluated from the cold spotimages of Figure 14A according to the definition of Equation 11. Relatively large ROIs were used in the hot and coldregions to avoid statistical and resolution effects on contrast estimation. The estimated values for uncorrected andcorrected images are given in Table 2. Removal of objectscatter produces the most significant contrast enhancement, in accordance with what many authors haveshown (2-6). Once again, removal of either collimator
or detector scatter does not produce significant contrastenhancement.
Resolution Recovery. Figure 15A displays the uncorrected pie hot spot image and the successively correctedimages for the three scatter components. It is evident thatthe image corrected for all three components is superior tothe others. Figure 15B shows the profiles of the uncorrected and corrected images. The object and collimatorscatter components are fairly uniform and, therefore, theirintensities do not follow the intensity of the source in theobject. This phenomenon has been observed by otherworkers (3-5). Since the collimator scatter contribution in
images is weak and broadly distributed, its inclusion in theobject scatter component for correction would have negligible effect on the quality of corrected images.
The detector scatter contribution follows the source activity more closely, in accordance with what we observe inthe projection fits where the detector scatter has a narrowdistribution wrapping up the geometric component (seeFigs. 7 and 8). Subtraction of the detector scatter component leads to slight improvements in edge sharpness, whichcan be noticed from the smaller structure in the profile ofFigure 15B. This is also observed from the resolution measured on the reconstructed line source profiles (Table 3).However, subtraction of the detector scatter also removessubstantial amounts of rather well-positioned events which
can be considered useful for quantitation. It is thereforerecommended that this component be restored and used inimage reconstruction.
CONCLUSION
New methods to estimate object, collimator and detector nonstationary scatter response functions for high-reso
lution PET have been developed. The observations made
in this work lead to the following conclusions: first, subtraction of object scatter improves contrast and quantitative accuracy but has little effect on spatial resolution in asmall animal PET system; second, the contribution fromcollimator scatter is small and similar in shape to the objectscatter contribution, so it can be safely combined with thelatter for correction; third, regardless of the slight resolution improvement, the overall effects of subtracting detector scatter is undesirable because it lowers the signal without improving image contrast. A complementary restoration model, capable of preserving the geometric component, removing object scatter, restoring detector scatterand suppressing noise generated by the scatter correctionis thus needed in high-resolution PET. Work is now in
progress to develop such a scatter correction model.
REFERENCES
1. Bentourkia M. Msaki P, Cadorette J. HéonM. Lecomte R. Assessment ofscalier components in a very high-resolution PET scanner. J NucÃMedI993;34:136P.
2. Barney JS. Rogers JG. Harrop R, Hoverath H. Object shape dependentscatter simulations for PET. IEEE Trans NucÃSci l99l;38:7l9-725.
3. BergströmM, Eriksson L, MuliniC. Blomqvist G. Litton J. Correction forscattered radiation in a ring detector positron camera by integral transformation of the projections. J Comp Assist Tomogr 1983:7:42-50.
4. Hoverath H. Kuebler WK, Ostertag HJ. et al. Scatter correction in thetransaxial slices of a whole-body positron emission tomograph. Phys MedBiol 1993:38:717-728.
5. Prati P. Lanza P. Corvisiero P, Guzzardi R. Sorace O. Verification of theintegral transformation of the projections technique for scatter correction inpositron tomographs. EurJ NucÃMed 1993:20:255-259.
6. Shao L, Karp JS. Cross-plane scattering correction: point source deconvolution in PET. IEEE Trans Med ¡mag1991:IO:234-239.
7. Thompson CJ. The effect of collimation on scatter fraction in multi-slicePET. IEEE Trans NucÃSci 1988:35:598-602.
8. Derenzo SE, Huesman RH, Cahoon JL. et al. Initial results from theDonner 600 crystal positron tomograph. IEEE Trans NucÃSci 1987;NS-34:321-325.
9. Derenzo SE. Huesman RH. Cahoon JL. et al. A positron tomograph with600 BOO crystal and 2.6 mm resolution. IEEE Trans NucÃSci 1988:35:659-664.
10. Hoffman EJ. Signal to noise improvement in PET using BGO. Proc NATOASI Phys Eng Med ¡mag1987:EI 19:874-881.
11. Lecomte R, Cadorette J. Jouan A. HéonM. Rouleau D. Gauthier G. Highresolution positron emission tomography with a prototype camera based onsolid state scintillation detectors. IEEE Trans NucÃSci 1990:37:805-811.
12. Lecomte R. Martel C, Cadorette J. Study of the resolution performance ofan array of discrete detectors with independent readouts for positron emission tomography. IEEE Trans Med ¡mag1991:10:347-357.
13. Murthy K, Thompson CJ, Weinberg IN, Mako FM. Measurement of thecoincidence response of very thin BGO crystals. IEEE Trans NucÃSci1994:41:1430-1435.
14. Acchiappati D. fenilici N. Guzzardi R. Assessment of the scatter fractionevaluation methodology using Monte Carlo simulation techniques. Ear JNucÃMed 1989:15:683-686.
15. Bendriem B. Wong WH, Michel C. Adler S, Mullani N. Analysis of scatterdeconvolution technique in PET using Monte Carlo simulation. J NucÃMed1987:28:681.
16. Msaki P, Axelsson B. Dahl CM. Larsson SA. Generalized scatter correction method in SPECT using point scatter distribution functions. J NucÃMed 1987:28:1861-1869.
17. McKee BTA, Hogan MJ. Howse DCN. Compton scattering in a large-aperture positron imaging system. IEEE Trans Med ¡mag1988:3:198-202.
18. Thompson CJ. Moreno-Cantu J. Picard Y. PETSIM: Monte Carlo simulation of all sensitivity and resolution parameters of cylindrical positron imaging systems. Phys Med Biol 1992:37:731-749.
19. Lecomte R. Cadorette J. Rodrigue S. et al. A PET camera with multispec-tral data acquisition capabilities. IEEE Trans NucÃSci 1993:40:1067-1074.
Scatter Correction in High Resolution PET •Bentourkia et al. 129
by on May 26, 2018. For personal use only. jnm.snmjournals.org Downloaded from

20. Lecomte R, Martel C, Carrier C. Status of BGO-avalanche photodiode
detectors for spectroscopy and timing measurements. NucÃInstr Meth PhysRes 1989;A278:585-597.
21. Lightstone AW, Mclntyre RJ, Lecomte R, Schmitt D. A bismuth ger-
manate-avalanche photodiode module designed for use in high resolutionpositron emission tomography. IEEE Trans NucÃSci 1986;NS-33:456-459.
22. Bevington PR. Dala reduction and error analysis for the physical sciences.New York, McGraw-Hill; 1969.
EDITORIALScatteredPhotonsas "Good CountsGone Bad:" Are TheyReformableor ShouldThey Be PermanentlyRemovedfromSociety?In general, the quality of an image
can be described (quantitatively) byits signal-to-noise ratio (/), which di
rectly affects diagnostic and quantitative accuracy. The signal-to-noise ratio describes the relative "strength"
of the desired information and thenoise (due to the statistics of radioactive decay, for example) in the image.The signal is typically thought of asthe difference or contrast between atarget and the surrounding activity. Inpractice, this contrast is provided inthe patient by the radiotracer's distri
bution. The goal of the imaging system is to preserve this contrast in theimage. Contrast is maintained byavoiding blurring, which smearscounts from higher-activity regionsinto lower-activity regions (and vice
versa), thus reducing image contrast.Therefore, spatial resolution, in itsbroadest sense, and contrast areclosely linked. This relationship isquantitatively described by the imaging system's modulation transfer func
tion, which is the Fourier transform ofthe point spread function. While themodulation transfer function is obtained from a conventional measure ofspatial resolution, it is actually the ratio of the contrast in the image to thatin the object as a function of spatialfrequency (2). Inclusion of scatteredphotons in the image reduces contrast;this is partially reflected in a change inthe point spread function and modula-
Received Aug. 25,1994; accepted Oct. 5,1994.For correspondence or reprints contact: Jonathan
Links, PhD, Dept. of Radiation Health Sciences andEnvironmental Health Sciences, Johns Hopkins Medical Institute, 615 N. Wolfe St., Baltimore, MD 21205-2179.
tion transfer function (2). The amountof scatter depends on the distributionof activity within the patient, the patient's body habitus, the imaging geometry of the system, the system's
energy resolution and the pulse heightwindow setting.
The design of a PET or SPECT system must address these issues by attempting to simultaneously maximizespatial resolution and sensitivity,while minimizing the acceptance ofscattered photons. In practice, thesecompeting design goals lead to an"optimum" (in the designer's mind)
compromise, and real-world scannershave less-than-ideal resolution, sensi
tivity, and scatter characteristics.There is, thus, much interest in software-based postacquisition ap
proaches to these problems. For thesake of simplicity, many software approaches begin with the assumption ofa linear, shift-invariant system. Such a
system responds linearly to changes inactivity distribution regardless of theposition of the activity within the fieldof view. In such a situation, the measured projection data can be considered as the convolution of the objectwith the imaging system's response:
p = o * h , Eq. l
where p represents the projectiondata, o the object and h the imagingsystem's response (i.e., the point
spread function). The asterisk represents convolution. It is important tonote that h contains both resolutionand scatter effects. The convolutiontheorem states that convolution in realspace is equivalent to multiplication inFourier space. If we use capital letters
to denote the Fourier transform of afunction, the above equation thus becomes:
P = OH. Eq. 2
In such a situation, o can be obtainedfrom p by deconvolution with aknown h (i.e., based on a measurement of a point source). Deconvolution is usually performed in Fourierspace, where mathematically it is asimple division:
O = P/H, Eq.3
in which o is obtained from O by taking the inverse Fourier transform. H" '
is known as the inverse filter. In theabsence of noise, such a filter will perfectly restore a blurred projection. Inpractice, the use of such a filter wouldlead to unacceptably large noise amplification, and a combination of inverse filtering and low-pass filtering
must be used. This approach formsthe basis for all Fourier-based restora
tion filtering (e.g.. Wiener or Metz filtering) in nuclear medicine. Such filters usually are composed of aninverse component (i.e., a boost) atlow to intermediate spatial frequencies, followed by a roll-off (i.e., a cut)
at intermediate to high spatial frequencies. Since scatter is mainly though byno means exclusively a low spatial frequency phenomenon, I have previously argued that the main effect ofsuch filtering is scatter reduction, bythe equivalent of deconvolution. Ofimportance, deconvolution here reduces scatter through a process of repositioning of scattered events, not bytheir elimination (3,4).
130 The Journal of Nuclear Medicine •Vol. 36 •No. 1 •January 1995
by on May 26, 2018. For personal use only. jnm.snmjournals.org Downloaded from

1995;36:121-130.J Nucl Med. M. Bentourkia, P. Msaki, J. Cadorette and R. Lecomte Nonstationary Convolution SubtractionAssessment of Scatter Components in High-Resolution PET: Correction by
http://jnm.snmjournals.org/content/36/1/121This article and updated information are available at:
http://jnm.snmjournals.org/site/subscriptions/online.xhtml
Information about subscriptions to JNM can be found at:
http://jnm.snmjournals.org/site/misc/permission.xhtmlInformation about reproducing figures, tables, or other portions of this article can be found online at:
(Print ISSN: 0161-5505, Online ISSN: 2159-662X)1850 Samuel Morse Drive, Reston, VA 20190.SNMMI | Society of Nuclear Medicine and Molecular Imaging
is published monthly.The Journal of Nuclear Medicine
© Copyright 1995 SNMMI; all rights reserved.
by on May 26, 2018. For personal use only. jnm.snmjournals.org Downloaded from


![Carbon-11-Forskolin:ALigandforVisualization ...jnm.snmjournals.org/content/34/11/1944.full.pdf · forskolin.Thesynthesisof[“C]forskolinanditsanalogs willbereportedindetaillater.Theradiochemicalyieldsof](https://img.dokumen.tips/doc/110x75/5f79980b6c1748423b252668/carbon-11-forskolinaligandforvisualization-jnm-forskolinthesynthesisofacforskolinanditsanalogs.jpg)