Embed Size (px)
Citation preview
Computers and Fluids 128 (2016) 1–15
Contents lists available at ScienceDirect
Computers and Fluids
journal homepage: www.elsevier.com/locate/compfluid
Assessment of RANS and DES methods for realistic automotive models
N. Ashton a,1,∗, A. West b, S. Lardeau b, A. Revell a
a Modelling & Simulation Centre, School of Mechanical, Aerospace & Civil Engineering, University of Manchester, UKb CD-adapco, 200 Shepherds Bush Road, London, UK
a r t i c l e i n f o
Article history:
Received 21 August 2015
Revised 24 December 2015
Accepted 13 January 2016
Available online 22 January 2016
Keywords:
Hybrid RANS-LES
DDES
Ahmed body
DrivAer
RANS
Separated flow
Automotive
a b s t r a c t
This paper presents a comprehensive investigation of RANS and DES models for the Ahmed car body
and a realistic automotive vehicle; the DrivAer model. A variety of RANS models, from the 1-equation
Spalart Allmaras model to a low-Reynolds number Reynolds Stress model have shown an inability to
consistently correctly capture the flow field for both the Ahmed car body and DrivAer model, with the
under-prediction of the turbulence in the initial separated shear layer found as a key deficiency. It has
been shown that the use of a hybrid RANS-LES model (in this case, Detached Eddy Simulation) offers an
advantage over RANS models in terms of the force coefficients, and general flow field for both the Ahmed
car body and the DrivAer model. However, for both cases even at the finest mesh level hybrid RANS-LES
methods still exhibited inaccuracies. Suggestions are made on possible improvements, in particular on
the use of embedded LES with synthetic turbulence generation. Finally the computational cost of each
approach is compared, which shows that whilst hybrid RANS-LES offer a clear benefit over RANS models
for automotive relevant flows they do so at a much increased cost.
© 2016 Elsevier Ltd. All rights reserved.
1
d
v
l
n
t
c
w
v
t
t
t
R
v
m
m
m
c
a
t
t
e
i
c
c
(
b
i
s
t
t
t
s
T
f
t
a
n
b
m
h
0
. Introduction
Computational Fluid Dynamics (CFD) has become one the main
esign tools for the external aerodynamic design of modern day
ehicles. The computational resources necessary for these simu-
ations has become more affordable, and commercial software is
ow sophisticated enough to handle the often complex geome-
ries that are common in automotive design. For typical automotive
onfigurations a separated wake flow exists behind the car body,
hich has a major impact on the drag and fuel efficiency of the
ehicle. Whilst there are other important areas around and within
he car, the ability of a CFD simulation to capture this recircula-
ion region is largely a function of the predictive capability of the
urbulence model. For this work, a comparison is made between
eynolds Averaged Navier–Stokes (RANS) models (at both eddy-
iscosity and second-moment closure levels) and hybrid RANS-LES
ethods (for this work, Detached Eddy Simulation (DES)). RANS
ethods assume that the entire spectrum of turbulence can be
odelled by a set of transport equations which arise from de-
omposing the turbulence into a mean and fluctuating component
round this mean. The result of this decomposition is an additional
erm in the Navier–Stokes equation, named the Reynolds Stress
∗ Corresponding author. Tel.: +441865610600.
E-mail address: [email protected] (N. Ashton).1 Present Affiliation: Oxford e-Research Centre, University of Oxford.
t
a
i
o
t
ttp://dx.doi.org/10.1016/j.compfluid.2016.01.008
045-7930/© 2016 Elsevier Ltd. All rights reserved.
ensor. This term requires additional modelling to close the set of
quations. Whilst this approach has a certain level of empiricism,
t is also based on key physical mechanisms observed in canoni-
al flows, and thus aim to model the turbulence at a much lower
ost than higher fidelity methods such as Large Eddy Simulation
LES). Hybrid RANS-LES methods attempt to provide a compromise
etween accuracy and computational expense by only using LES
n regions of flow which are challenging to RANS models (such as
eparated flow) but then use RANS models elsewhere. Compared
o a wall-resolved LES this results in a significant saving of compu-
ational resources.
Until recently, most validation work for turbulence models in
he automotive sector was confined to simple automotive models
uch as the Ahmed car body [1,2] or MIRA/SAE Reference bodies.
hese bodies resemble a car in terms of their broad aerodynamic
eatures, but miss some of the features of a complete automo-
ive model. Whilst different turbulence models have been evalu-
ted on full-car models, these are often internal studies that can-
ot be published for confidentiality reasons, and cannot be verified
y other groups because of the control on geometry and experi-
ental data.
This work aims to assess the capability of the current state of
he art RANS and hybrid RANS-LES models (in this work, DES) for
utomotive relevant test cases. The desired outcome is to provide
ndustrial users with the information to make informed choices
f whether to use RANS or hybrid RANS-LES approaches, both in
erms of their accuracy and computational expense.

2 N. Ashton et al. / Computers and Fluids 128 (2016) 1–15
g
p
n
t
c
a
p
2
b
m
a
m
c
(
c
w
t
r
i
d
s
v
a
f
v
s
C
2
c
s
(
i
v
e
b
a
a
v
m
d
i
I
s
o
w
3
In this paper the Ahmed car body, a well established auto-
motive test case that combines geometric simplicity with a com-
prehensive set of experimental data and prior numerical simula-
tions is firstly studied to provide information on the performance
of both RANS and hybrid RANS-LES models. Finally, a realistic car
model is evaluated to assess whether the conclusions from the
Ahmed car hold true for a complete vehicle and also to assess the
predictive capability of these different turbulence modelling ap-
proaches for a realistic car model. For this we evaluate the DrivAer
automotive model [3,4], a recent effort by TUM and Audi/BMW to
produce an open-source car model based closely on realistic com-
plete car geometries with openly available experimental data. The
ultimate aim of this paper is to bring together both academic and
industrial type studies to make conclusions that can be relevant to
the automotive industry.
This paper is structured as follows. Section 2 outlines the tur-
bulence models and approaches used in this study, including in-
formation on the validation procedure for the hybrid RANS-LES
models. Section 3 provides information the two test cases stud-
ied in this paper, including information on the computational grid,
boundary condition and numerical schemes in use. In Section 4 the
results for the two test cases are presented, using both RANS and
hybrid RANS-LES methods. In this section, there is also an analysis
of the computational expense of each approach as well as discus-
sion on possible improvements. Finally Section 5 provides the main
conclusions from this work and suggestions for further work.
2. Turbulence models
In this paper, a variety of turbulence modelling approaches are
assessed. These models represent some of the most popular RANS
models as well as variants of the popular DES approach (as shown
in Table 1). One of the central aims of this work is to assess the
current state-of-the art RANS models against one of the most well
validated and popular hybrid RANS-LES models; DES. Whilst this
work cannot claim to be fully comprehensive, it represents the
range of models typically found in the majority of CFD codes (both
commercial and open source) and therefore provides an assess-
ment of the current state-of-the-art RANS and DES models for au-
tomotive related flows.
The authors chose DES to represent the hybrid RANS-LES mod-
els as this is the model largely in use by the automotive industry
in finite-volume solvers.
The principle behind hybrid RANS-LES methods is that a tra-
ditional wall-resolved LES is too expensive for complex high-
Reynolds number flows that are influenced by near-wall effects. By
applying a RANS model in the boundary layer and using LES out-
side of this region, the total cell count can by greatly reduced as
RANS models do not require the same level of grid resolution in
the boundary layer. A comprehensive review of hybrid RANS-LES
methods can be found in Frohlich et al. [13], but in this study one
particular method is used: DES [6]. This method has become in-
creasingly popular due to its ease of implementation and demon-
strated performance for a range of applications.
Table 1
Turbulence models used in this study.
RANS models Hybrid RANS-LES models
Spalart Allmaras (SA) [5] SST-DDES [6]
Realisable k − ε (RKE) [7] SST-IDDES [8]
k − ω SST (SST) [9] SA-DDES [6]
Elliptic Blending k − ε v2 − f (B-EVM) [10] SA-IDDES [11]
Elliptic Blending Reynolds Stress Model
(EB-RSM) [12]
3
w
i
a
r
i
i
b
DES can be seen as a RANS model which performs as a LES sub-
rid scale model in regions where the grid is fine enough to sup-
ort LES content and as a standard RANS models where the grid is
ot. In this study we investigate both standard DDES [6] as well as
he variant, IDDES [11], which aims to improve some of the short-
omings of DDES and add a wall-modelled LES capability. Readers
re advised to read the doctoral thesis of Mockett [14] for a com-
rehensive explanation of DES models and its variants.
.1. Validation of DES — Decaying Isotropic Turbulence
Each DES formulation is validated using Decaying Isotropic Tur-
ulence (DIT) to ensure the correct energy decay and validate the
odel constants. Whilst this is a simple, idealised test case, it is
useful first case to ensure correct levels of dissipation before
oving to more complex cases. This is particularly important for
ommercial CFD codes which tend to have many numerical options
both default and user selectable). The solution domain of the DIT
alculation is cubic with length 2π . The solution domain is meshed
ith three grids consisting of 323, 643 & 1283 cubic and equidis-
ant cells. Periodic boundary conditions are imposed in each di-
ection. The initial velocity field is set with a suitable instance of
sotropic turbulence from the Wray [15] DNS data from the AGARD
atabase. In order to obtain the initial values for other variables
uch as the pressure and turbulence quantities (k & ε etc), a frozen
elocity field simulation was conducted, the turbulence variables
re solved, which once converged were used as initial conditions
or the unsteady decay of turbulence simulation.
Calculations were performed with the commercial finite-
olume code STAR-CCM+, developed by CD-Adapco. Additional
imulations were conducted using the open-source finite-volume
ode_Saturne [16] developed by EDF R&D.
The temporal discretisation is 2nd order, and a fully centred
nd order scheme is used to spatially discretise the momentum
onvective terms unless otherwise stated. A 2nd order upwind
cheme is applied to the turbulent quantities.
Fig. 1(a) & (b) shows the value of the model constant CDDES
which can be seen as an equivalent to the Smagorinsky constant
n LES) for each model using the 323, 643 & 1283 grids. The CDDES
alues were selected to give the appropriate level of dissipation for
ach model, although with a constant CDDES value it is not possi-
le to match the DNS data for every mesh resolution. These values
gree with the calibrated values from Ashton et al. [17] as well
s those observed by many partners in the EU project ATAAC (Ad-
anced Turbulence Simulation Approaches for the Aerospace Com-
unity) [18].
Additionally, a 2nd order upwind scheme and a blended central
ifference scheme were used to illustrate the importance of us-
ng a numerical scheme with low numerical dissipation (Fig. 1(c)).
t can be seen that using any scheme other than the fully central
cheme gives too much numerical dissipation. This can lead to an
ver-prediction of the separation region for such cases as the 2D
all-mounted hump [17] and the Ahmed car body [19].
. Test case descriptions
.1. Ahmed car body
The Ahmed car body [1,2] represents a generic car geometry
ith a slanted back and a flat front and has been extensively tested
n the literature [20–24]. While it is a much simplified version of
real car, it nevertheless provides many of flow features found in
eal-life cars such as the complex vortex interactions that occur in
ts wake and the large 3D separation region behind the car body
tself. The wake behind the car body is a result of the interaction
etween the counter-rotating vortices produced by the slant side

N. Ashton et al. / Computers and Fluids 128 (2016) 1–15 3
a b c
Fig. 1. (a) Calibration of the CDDES constant using Decaying Isotropic Turbulence for the SA-DDES model (b) Calibration of the CDDES constant using Decaying Isotropic
Turbulence for the SST-DDES model, (c) Numerical scheme sensitivity study using Decaying Isotropic Turbulence for the SA-DDES model.
a b
Fig. 2. (a) Ahmed car body flow physics and (b) Ahmed car body dimensions.
e
T
t
c
i
c
t
t
2
e
v
a
b
m
o
w
p
t
s
o
c
p
s
o
b
f
g
s
m
r
1
r
3
H
e
(
3
t
fl
o
i
H
i
a
w
s
a
t
l
ων
(
o
b
n
(
r
k
y
s
t
m
m
v
w
2 192,000 faces on the Ahmed body itself.
dges and the separated flow over the rear of the body (Fig. 2(a)).
he angle of the slant back section was found to be influential in
he structure of the wake and the reattachment point. At 35° the
ounter-rotating vortices are weaker, which results in the flow be-
ng completely separated over the entire slant back of the vehi-
le. At 25◦ the counter-rotating vortices are strong enough to help
o bring enough momentum into the separation region to reattach
he flow half way down the slant back.
This case has been the focus of several CFD investigations [19–
2,25–27] where a range of RANS, LES and hybrid RANS-LES mod-
ls were investigated. The general conclusions from the studies in-
olving RANS models [19–21,25,27] were dependant on the slant
ngle. At 35◦ (where the separation occurred along the entire slant
ack) most of the RANS approaches (both simple linear k − ε and
ore complex Reynolds stress models) captured the correct level
f the turbulent stresses and, as a result, showed good agreement
ith the experimental results for the separation and reattachment
oints. However at 25◦ (where the complex interaction between
he counter-rotating vortices and the separated flow results in a
horter separation region) the majority of RANS models,regardless
f mesh refinement or wall treatment, failed to predict the flow
orrectly. In general, they either failed to predict separation com-
letely, or even when they did, they did not predict the correct
eparation point and thus were unable to capture the correct size
f the recirculation region due to an under-prediction of the tur-
ulent stresses [22].
More recently, a number of LES & DES studies have been per-
ormed on this case, mainly at the more challenging 25◦ slant an-
le [19,22,26–32]. These studies were performed with a range of
ub-grid scale models and wall-treatments and, while some were
ore successful than others, many failed to capture fully the cor-
ect recirculation region. The high-Reynolds number (Re = 7.68 ×05) meant that even with meshes of up to 48 million cells, the
esolution requirements were still not ideal for a wall-resolved LES.
.1.1. Computational grid and boundary conditions
The car body was mounted on four stilts z/H = 0.174 (where
= 0.288 m is the height of the body) above the ground in the
xperiment to model the effect of the car’s height with wheels
and thus capture the important ground effect). Both the 25◦ and
5◦ slant back angles have been investigated in this study to assess
he capability of each model to capture the important changes in
ow physics and separation size & strength. The body has a length
f L/H = 3.625, a height of H and a width of W/H = 1.35. The flow
s at a Reynolds number of Re = 768, 000 based on the body height
and the free-stream velocity U∞ = 40 ms−1. For both cases, an
nlet condition is imposed at x/H = −7.3 upstream of the body and
n outlet condition is imposed x/H = 20.3 downstream. A no-slip
all condition is imposed on the ground floor and car body, with
lip conditions applied to the wind tunnel walls (z/H = 4.8 above
nd y/H = 3.1 to the side walls). Inlet turbulence levels were found
o be largely insensitive due to the large distance between the in-
et and car body, thus the turbulent intensity was set to 1%, and
and ε were computed by assuming the turbulent viscosity ratio
t = 10.
For the 25◦ angle, a structured 16 million cell mesh2 was used
Fig. 3(a)); courtesy of Professor Krajnovic of Chalmers University
f Technology. For this mesh, the first near-wall cells over the car
ody had a y+ < 1 and the refinement was concentrated on the
ear-wall and separation regions.
For the 35◦ angle, an unstructured polyhedral based mesh
Fig. 3(b)), created in STAR-CCM+ was used with three levels of
efinement (Coarse, Medium & Fine). A constant refinement was
ept in the near-wall region for each of these variants, ensuring a+ < 1 for all near-wall cells. The refinement between the succes-
ive meshes was concentrated in the rear separation region over
he rear window and behind the car. Mesh size were approxi-
ately 4, 10 and 19 million cells for the coarse, medium and fine
eshes respectively and it was found that acceptable mesh con-
ergence was reached by the fine mesh.
Calculations were performed using the open-source soft-
are Code_Saturne v3.0.1 [16,33] developed by EDF R&D and
4 N. Ashton et al. / Computers and Fluids 128 (2016) 1–15
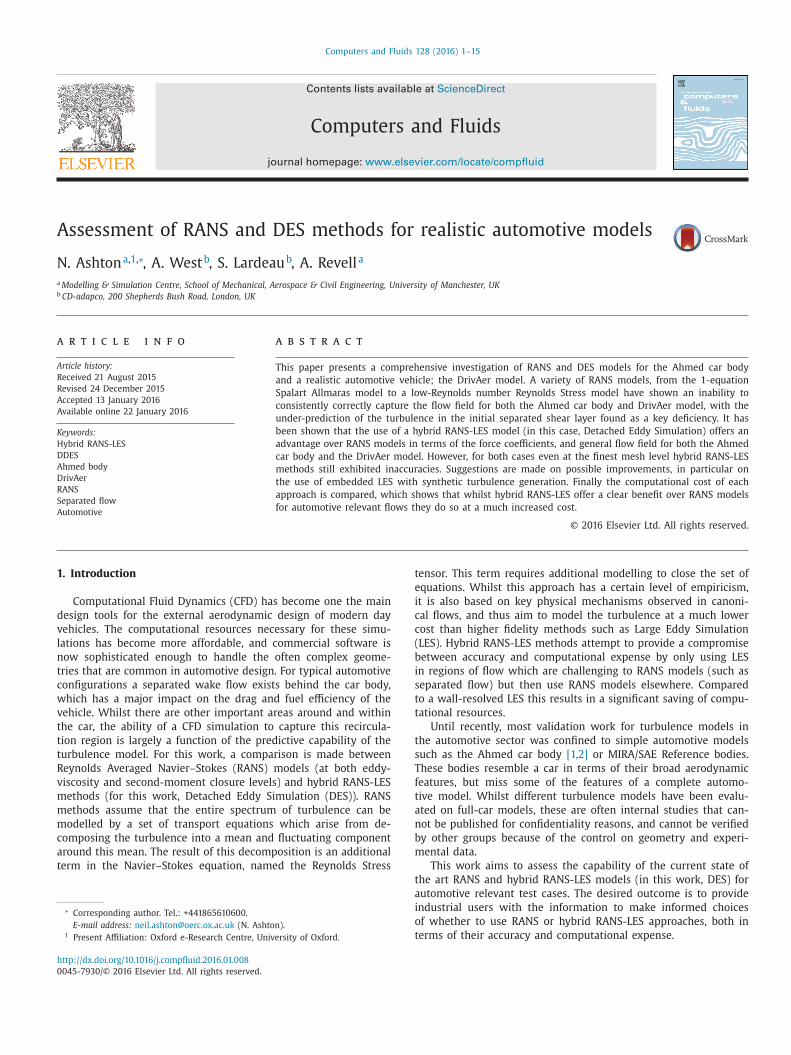
Fig. 3. Meshes for the Ahmed car body (a) Structured 16 million cell mesh for 25 degrees case and (b) unstructured 10 million cell mesh for 35 degrees case.
Table 2
Numerical setup for each code and turbulence modelling approach for the Ahmed car body.
Code Method Spatial scheme Temporal scheme Criteria
STAR-CCM+ RANS 2nd order Upwind Steady < 1 × 10⁻⁵ residuals
STAR-CCM+ DDES Hybrid CDS/2nd UDS [34] 2nd order (�tU/L = 1 × 10⁻⁴) 30 flow units
Code Saturne URANS 75% CDS-25% UDS 2nd order (�tU/L = 1 × 10⁻⁴) 10 flow units
Code Saturne DDES Hybrid CDS/2nd UDS [17] 2nd order (�tU/L = 1 × 10⁻⁴) 30 flow units
Fig. 4. (a) DrivAer models, F-Fastback, E-Estate, N-Notchback (b) DrivAer computational domain Size.
s
t
m
t
i
a
s
m
c
e
D
t
i
s
w
f
T
l
p
3
3
t
a
STAR-CCM+ v9.04, developed by CD-adapco. The computational de-
tails for each code is shown in Table 2.
3.2. DrivAer automotive model
A recent addition to the openly available car geometries is the
DrivAer model [3,4]. In these experiments three car configurations
(shown in Fig. 4(a)) were subject to a wind tunnel investigation,
where global loads were obtained as well as surface pressure in-
formation in key areas over and under the vehicles. These three
configurations represent three typical car configurations i.e. estate,
fastback and notchback. For each configuration, several variants
were also investigated where several components were tested on
and off the model (side mirrors and wheels) as well as a smooth
and detailed underbody. In addition each configuration were tested
with and without a rolling road to test the effect of ground simula-
tion. Previous numerical simulations by TUM focused only on the
fastback configuration with a single turbulence model [3]. Whilst
some effort was made to ensure mesh convergence and to investi-
gate the effect of the several geometry variations, no investigation
was made into different turbulence models or the other two Dri-
vAer configurations. The turbulence model in question, the k − ωSST [9] model was used in the study of [3] and also in this re-
search. The model in [3] used a mesh that did not resolve the near-
wall region which makes any direct comparison difficult, however
some key flow areas, such as the bonnet/windscreen intersection,
how the same trend between the previously mentioned work and
he authors previous work. Whilst they showed excellent agree-
ent for the drag coefficient, the pressure distribution over the
op and bottom of the car differs from the experiment suggest-
ng that a certain amount of error cancellation is present. This was
lso observed in recent work using OVERFLOW, which used over-
et structured meshes [35]. Even though a high quality structured
esh was used, the same discrepancies with the pressure coeffi-
ient were observed, which suggests a consistent turbulence mod-
lling error. Guilmineau [36] recently applied DES models to the
rivAer model, one of the first examples of DES being applied to
his case. Unfortunately only the fastback configuration was stud-
ed, however the findings were in agreement with the previous
tudies. RANS models (including an Explicit Algebraic RSM model)
ere unable to correctly predict the forces, particularly the lift
orce which was considerably different than the experimental data.
hey found that DES provided much improved accuracy (particu-
arly for the lift force) although there were still inaccuracies com-
ared to the experimental data.
.3. Computational set-up
.3.1. Computational grid and boundary conditions
Two configurations of the DrivAer model are investigated:
he Estate and Fastback variants (Fig. 4) both with side mirrors
nd a smooth underbody. For each configuration the meshing

N. Ashton et al. / Computers and Fluids 128 (2016) 1–15 5
Table 3
Numerical setup for each code and turbulence modelling approach for the DrivAer model.
Code Method Spatial scheme Temporal scheme Criteria
STAR-CCM+ RANS 2nd order Upwind Steady < 1 × 10⁻⁵ residuals
STAR-CCM+ DDES Hybrid CDS/2nd UDS [34] 2nd order (�tU/L = 1 × 10⁻³) 30 flow units
m
p
a
s
t
c
(
(
v
a
i
i
d
w
t
i
t
a
3
f
t
a
u
t
i
s
c
g
s
w
c
i
b
o
v
p
3
w
Table 4
Mesh type and resolution used within this study.
Mesh name Mesh type y+ Cell count DrivAer face count
RANS coarse Polyhedral+prism < 1 18 × 106 4.9 × 10⁵
RANS medium Polyhedral+prism < 1 37 × 106 6.0 × 10⁵
RANS fine Polyhedral+prism < 1 80 × 106 1.0 × 10⁶
DES coarse Polyhedral+prism < 1 80 × 106 1.0 × 10⁶
DES fine Hexahedral+prism < 1 100 × 106 1.6 × 10⁶
[
e
S
s
a
t
w
C
m
c
i
t
r
2
f
a
p
d
s
g
c
t
4
i
R
o
m
ethodology is identical in an attempt to ascertain the predictive
erformance of different turbulence models with the mesh being
known source of error. A schematic of the domain and car is
hown in Fig. 4(b), the top of the domain (where a slip wall condi-
ion is imposed) is at a height of 8H, where H is the height of the
ar body. An inlet condition is imposed at the start of the domain
13H upstream of the car) with a freestream velocity of 40 ms−1
Re = 1.48 × 10⁶ based upon the car height H = 0.567 m), turbulent
iscosity ratio of 20 and a turbulent intensity of 1%. The appropri-
te values for k, ε, ω and were then derived from these values us-
ng the appropriate relationship (e.g. νt = k/ω). An outlet condition
s imposed 19H downstream of the rear of the car. The width of the
omain is 14H, where slip wall conditions are imposed. The floor
as set to a no-slip condition with non-rotating wheels to match
he experimental non-ground simulation case. This was chosen as
t removes any rotating tyre modelling error and was also shown
o have little effect on the flow physics [4]. The choice of numerics
nd time-step are described below and summarised in Table 3.
.3.2. STAR-CCM+ : RANS
A steady coupled incompressible finite-volume solver is used
or each RANS calculation. A second order upwind scheme is used
o discretise the convection and diffusion terms of the momentum
nd turbulence equations. An Algebraic Multigrid (AMG) method
sing a V cycle for the momentum equations and a flex cycle for
he turbulence quantities was employed. The solution was initial-
zed using a Grid Sequencing Initialisation (GSI) method, which
olves a fully implicit incomplete-Newton solution algorithm to
ompute a first-order inviscid flow solution on a series of coarse
rids, which provides a better initial flow field than specifying con-
tant values for the flow variables over the domain. All simulations
ere run until the standard deviation of the drag and lift coeffi-
ients dropped below 2 × 10⁻⁵ over 400 samples. This criteria was
n conjunction with the residual error for the momentum and tur-
ulent equations reaching a monotonic state below 1 × 10⁻⁵. Both
f these were used to ensure that the flow had a reached full con-
ergence, which typically occurred after 2000–5000 iterations de-
ending on the turbulence model.
.3.3. STAR-CCM+ : DDES
An unsteady segregated incompressible finite-volume solver
as used for all the DES computations. A hybrid numerical scheme
Fig. 5. Slices through the symmetry plane of the meshes
34] was used to discretise the convective terms of the momentum
quations, which switches between a bounded Central Differencing
cheme (CDS) in regions where LES is active to a 2nd order upwind
cheme where RANS modes are active. For the turbulent quantities,
second order upwind scheme is used. The temporal discretisa-
ion was achieved using a 2nd order Crank–Nicholson type scheme
ith a non-dimensional time-step of �tU/L = 1 × 10⁻³, ensuring a
FL < 1 throughout the LES regions. An Algebraic Multigrid (AMG)
ethod using a V cycle for the momentum equations and a flex cy-
le for the turbulence quantities was employed. The solution was
nitialized using the steady RANS results which shortened the time
o reach a suitable time for time-averaging. Each simulation was
un for 10 convective flow units (10 × L/U) followed by a further
0 convective units for the gathering of time-averaged statistics.
Five grids were generated in total, for which two were used
or the DES calculations. These are summarised in Table 4
nd illustrated in Fig. 5. The meshes are split into broadly
olyhedral/prismatic based for the RANS studies and hexahe-
ral/prismatic cells for the DES studies. Each of the meshes were
uccessively refined to establish mesh convergence, each with
reater refinement throughout the rear of the domain (except for a
onstant highly resolved near-wall mesh, with 20 prism layer cells
o ensure the boundary layer was well captured).
. Results
To achieve the objective of both comparing a simple and real-
stic car model and also assessing the potential benefits of hybrid
ANS-LES methods over RANS models, we discuss the performance
f the RANS models for both cases before moving on the perfor-
ance of the hybrid RANS-LES models. It will be seen that there
used for the DES calculations (estate configuration).

6 N. Ashton et al. / Computers and Fluids 128 (2016) 1–15
a b
c d
Fig. 6. Streamwise velocity (a) over and at the (b) rear of the Ahmed car body at 35 degrees and Turbulent Kinetic Energy (TKE) (c) over and at the (d) rear of the Ahmed
car body at 35 degrees for different RANS models.
a
s
f
1
a
m
m
c
m
t
p
r
i
b
a
w
O
t
t
g
c
a
a
R
i
s
r
4
(
is a common theme between the simple and realistic car cases for
both RANS and hybrid RANS-LES models.
4.1. RANS
4.1.1. Ahmed car body: RANS
Fig. 6 show the results for a selection of RANS models for
the Ahmed car body with a 35◦ rear window angle for both the
streamwise velocity and turbulent kinetic energy (TKE). These re-
sults were obtained using STAR-CCM+, where a mesh convergence
study resulted in a final mesh of 10 million cells. Whilst further
mesh refinement may result in some modification of the results,
the authors believe that the trends will most likely be very similar.
It can be seen from these figures that the models predict largely
the correct flow along the symmetry plane which also reflected in
other planes. Each model shows good agreement with the experi-
mental data for the TKE, it is also notable that there are only small
differences between all the turbulence models, even for a fully sep-
arated flow. This is in agreement with many previous studies, in-
cluding the ERCOFTAC workshops [20,21] using a variety of differ-
ent turbulence models and grid resolution.
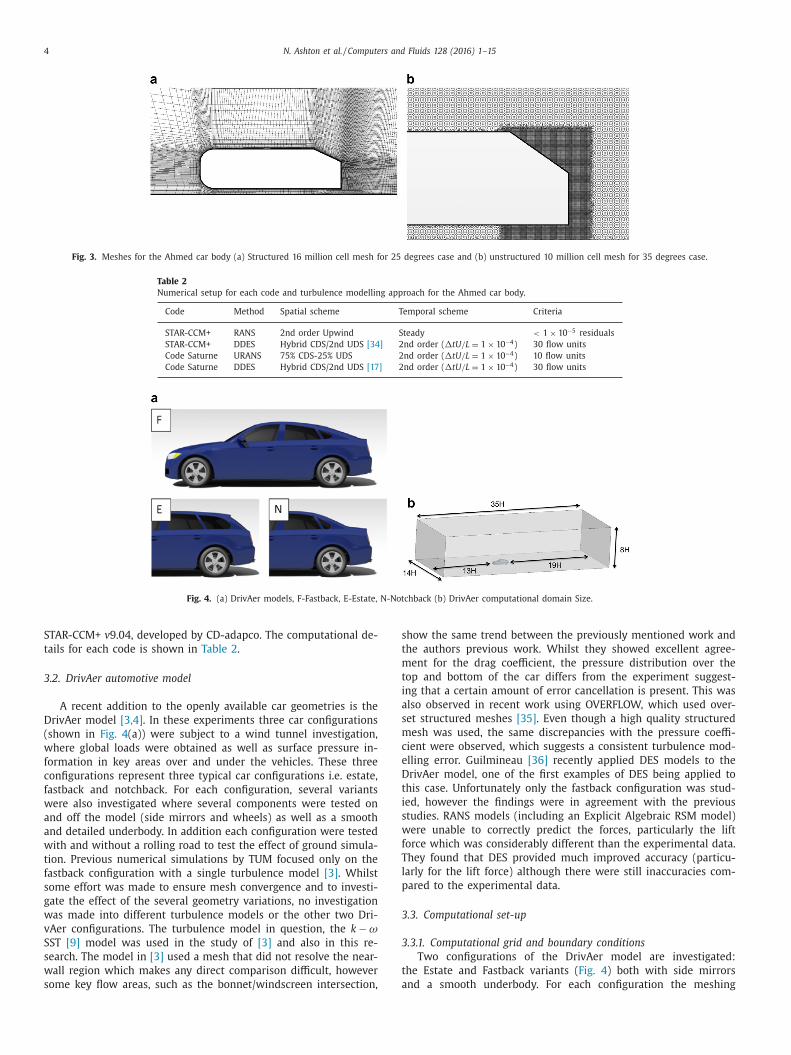
Fig. 7 shows the streamwise velocity and turbulent kinetic en-
ergy for the Ahmed car body with a 25◦ rear window angle. None
of the RANS models tested correctly predicted the streamwise ve-
locity with each model overpredicting the size of the recirculation
region. It can be seen that this a result of the turbulent kinetic
energy being under predicted in the initial separated shear layer
(just after separation) which means less turbulent mixing and thus
a greater recirculation region. It is again observed that there is
little difference between the models tested. These results are in
agreement again with many previous studies, where unsatisfactory
performance was observed with RANS models, both EVM and RSM
variants [20,21]. A common theme from all of these studies was
n under-prediction of the turbulent kinetic energy in the initial
eparated shear layer, which is also observed here.
In the work of Ashton et al. [19] a mesh convergence study
ound that mesh convergence was achieved for all models on the
6 million cell grid which is currently in use, therefore we discount
lack of grid resolution for the poor performance of the RANS
odels. In order to also eliminate code-related errors, the same
esh and models were tested in the open source finite-volume
ode, Code_Saturne. Whilst the exact numerics and model imple-
entation may be different between codes, it can be seen in Fig. 8
hat the models provide similar performance, with all models over-
redicting the separation region. We therefore believe that these
esults are code-independent.
As linear eddy-viscosity and Reynolds stress models give nearly
dentical results (in both codes as well as other studies), it can also
e concluded that it is not purely an issue of models lacking the
bility to capture anisotropy or near-wall modelling (although how
ell they do this may be contributing to the poor performance).
ther ε based RSM models (such as the LRR model [37]) were
ested and yielded no improvement. The under prediction of the
urbulence in the initial separated shear layer has been investi-
ated in more detail in the work of [19] and this same failure of
ommon RANS models has been found in a number of other sep-
rated flows e.g. 2D wall-mounted hump & 2D periodic hills. The
uthors believe this is an area of potential development for future
ANS models, and work is currently underway by the authors to
nvestigate this in the spirit of work done by Rumsey et al. [38] on
ensitising models to increase the turbulence in this initial sepa-
ated shear layer.
.1.2. DrivAer model: RANS
The same RANS models were applied to the DrivAer case
with the inclusion of the Spalart Allmaras model) which now
N. Ashton et al. / Computers and Fluids 128 (2016) 1–15 7
a b
c d
Fig. 7. Streamwise velocity (a) over and at the (b) rear of the Ahmed car body at 25 degrees and Turbulent Kinetic Energy (TKE) (c) over and at the (d) rear of the Ahmed
car body at 25 degrees for different RANS models.
a b
Fig. 8. (a) Streamwise velocity and (b) Turbulent Kinetic Energy for different RANS models at y = 0 for the Ahmed car body at 25 degrees with Code Saturne.
r
a
a
r
m
l
e
d
d
b
c
c
o
r
o
t
i
t
c
r
R
c
o
n
r
i
u
i
c
e
epresents a realistic car geometry. The results of these for the lift
nd drag coefficients are summarised in Table 5 and Figs. 9 & 10
re compared to the experimental data and simulations from other
esearch groups. The results from this study are all using the fine
esh (80 million cells), although it was seen that there was very
ittle difference between the medium and fine grids for most mod-
ls, as shown in Fig. 11.
It can be seen firstly that none of the models can correctly pre-
ict all the car configurations. Whilst one model may perform pre-
ict the drag force correctly for one configuration (SST for Fast-
ack), it is unable to predict the correct drag force for the other
ar configuration and has a significant error with the lift coeffi-
ient. This overprediction of the lift force is in agreement with the
ther studies, which each used different meshing strategies and
esolution. An inspection of the drag contribution from each part
f the car showed that the majority of the differences between
he models occurred in the rear of the car, which is not surpris-
ng as this is the area of greatest flow separation. There is a no-
iceable trend towards the RANS models predicting the fastback
onfiguration more accurately, which has no separation over the
ear window compared to the estate configuration. Whilst certain
ANS models predict the drag force better than others (e.g. SST
ompared to EBRSM), this appears to be due to an over-prediction
f the lift force, which in turn produces an induced drag compo-
ent. None of the RANS models captures the correct lift-to-drag
atio for either car configuration.
Table 5 also provides further insight by showing the difference
n lift and drag coefficient between the estate and fastback config-
rations. Whilst all the models capture the trend of a reduction
n drag coefficient, they all fail to capture the magnitude. Typi-
ally for industrial automotive flows it is accepted that RANS mod-
ls cannot capture the absolute force coefficients, so instead they

8 N. Ashton et al. / Computers and Fluids 128 (2016) 1–15
Table 5
Lift and drag coefficients for the computational and experimental results for the fastback and estate configurations of
the DrivAer using different RANS models on 80 million fine RANS mesh and a range of DES variants on the coarse and
fine meshes.
Model Estate Fastback Vehicle delta
CD CL CD CL CD CL
Exp. 0.294 −0.12 0.261 0.01 0.033 0.13
k − ω SST from Heft et al. [3] n/a n/a 0.243 n/a n/a n/a
k − ω SST from Peters et al. [35] n/a n/a 0.256 0.069 n/a n/a
EARSM from Guilmineau [36] n/a n/a 0.254 0.079 n/a n/a
Spalart Allmaras (SA) 0.280 0.054 0.260 0.136 0.02 0.084
Realizable k − ε (RKE) 0.260 −0.026 0.244 0.085 0.016 0.11
k − ω SST 0.275 0.0436 0.260 0.124 0.00 0.08
k − ε B-EVM 0.253 0.007 0.2435 0.116 0.0095 0.109
EB-RSM 0.256 −0.029 0.2482 0.075 0.0078 0.104
SST-DES from Guilmineau [36] n/a n/a 0.266 0.024 n/a n/a
SST IDDES (Coarse) 0.310 −0.096 0.268 0.011 0.042 0.107
SST IDDES (Fine) 0.307 −0.131 0.2615 0.024 0.0455 0.155
SA IDDES (Fine) 0.313 −0.136 n/a n/a n/a n/a
SA DDES (Fine) 0.307 −0.13 n/a n/a n/a n/a
Fig. 9. Drag Coefficient for the estate and fastback configurations using RANS and DES models.
i
T
s
i
t
fi
b
d
r
t
i
d
t
(
a
f
o
l
are used to assess the magnitude and direction of a trend. Looking
at geometry trends removes constant sources of error, which can
be useful for such a complex geometry however such high errors
suggest the models are missing some fundamental flow features
between the two configuration (i.e. the extent of the separation
region).
The pressure coefficient over the top of both the fastback and
estate vehicles is shown in Fig. 12. Inspection of Fig. 12(a) for the
fastback vehicle, shows that each model exhibits broadly similar
pressure distributions apart from the region at bottom of the front
window/bonnet intersection. Here the SST (in agreement with the
results of Heft et al. [4]) predicts too strong suction. All models
under-predict the pressure coefficient (for both the fastback and
estate vehicles) over the roof of the car, which is also seen in Heft
et al. [4]. This is likely due to the lack of a strut in the CFD model,
which connects the car model to the wind tunnel. The flow over
the roof of the car should be attached and therefore simple to cap-
ture with any turbulence model. Without also having the precise
geometry of the wind tunnel, it is not possible to match the same
blockage conditions. For the estate configuration in Fig. 12(b), there
s clear split between the models over the rear portion of the car.
his is due to differences in the model ability to capture the flow
eparation, which is also reflected in the drag coefficient (SST hav-
ng the largest drag for greater flow separation).
The previous figures have shown the Cp along a single plane at
he centreline, Fig. 13 however provides us with the pressure coef-
cient over the rear window of the car for the all the models for
oth configurations. Here it can be seen that the fastback is pre-
icted more accurately by all the turbulence models (which is also
eflected in the drag coefficient), with relatively little difference be-
ween them. For the estate configuration, the pressure coefficient
s far from the experimental values (which is again reflected in the
rag coefficient).
Figs. 14 & 15 shows a visualisation of the separated regions of
he flow (i.e. Ui < 0) for the SST, EBRSM and the SST-IDDES model
to be discussed in the next section). It can be seen that there is
noticeable difference in the shape of the wake for the both the
astback and estate configurations. These difference is likely to be
ne of the major contributions to the difference observed in the
ift and drag forces.

N. Ashton et al. / Computers and Fluids 128 (2016) 1–15 9
Fig. 10. Lift coefficient for the estate and fastback configurations using RANS and DES models.
a b
Fig. 11. Mesh Refinement for the fastback & estate configuration using RANS models.
a b
Fig. 12. (a) Pressure Coefficient over the top of the Fastback configuration for each RANS model. (b) Pressure Coefficient over the top of the Estate configuration for each
RANS model.
10 N. Ashton et al. / Computers and Fluids 128 (2016) 1–15
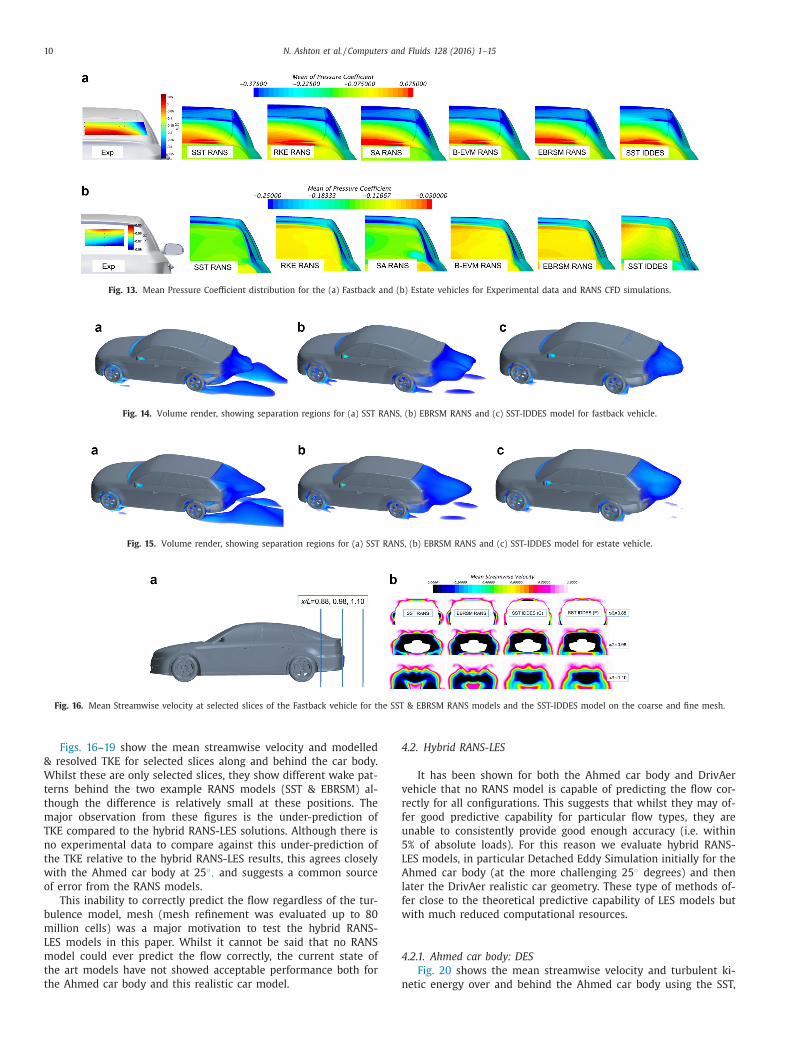
Fig. 13. Mean Pressure Coefficient distribution for the (a) Fastback and (b) Estate vehicles for Experimental data and RANS CFD simulations.
Fig. 14. Volume render, showing separation regions for (a) SST RANS, (b) EBRSM RANS and (c) SST-IDDES model for fastback vehicle.
Fig. 15. Volume render, showing separation regions for (a) SST RANS, (b) EBRSM RANS and (c) SST-IDDES model for estate vehicle.
Fig. 16. Mean Streamwise velocity at selected slices of the Fastback vehicle for the SST & EBRSM RANS models and the SST-IDDES model on the coarse and fine mesh.
4
v
r
f
u
5
L
A
l
f
w
4
n
Figs. 16–19 show the mean streamwise velocity and modelled
& resolved TKE for selected slices along and behind the car body.
Whilst these are only selected slices, they show different wake pat-
terns behind the two example RANS models (SST & EBRSM) al-
though the difference is relatively small at these positions. The
major observation from these figures is the under-prediction of
TKE compared to the hybrid RANS-LES solutions. Although there is
no experimental data to compare against this under-prediction of
the TKE relative to the hybrid RANS-LES results, this agrees closely
with the Ahmed car body at 25◦, and suggests a common source
of error from the RANS models.
This inability to correctly predict the flow regardless of the tur-
bulence model, mesh (mesh refinement was evaluated up to 80
million cells) was a major motivation to test the hybrid RANS-
LES models in this paper. Whilst it cannot be said that no RANS
model could ever predict the flow correctly, the current state of
the art models have not showed acceptable performance both for
the Ahmed car body and this realistic car model.
.2. Hybrid RANS-LES
It has been shown for both the Ahmed car body and DrivAer
ehicle that no RANS model is capable of predicting the flow cor-
ectly for all configurations. This suggests that whilst they may of-
er good predictive capability for particular flow types, they are
nable to consistently provide good enough accuracy (i.e. within
% of absolute loads). For this reason we evaluate hybrid RANS-
ES models, in particular Detached Eddy Simulation initially for the
hmed car body (at the more challenging 25◦ degrees) and then
ater the DrivAer realistic car geometry. These type of methods of-
er close to the theoretical predictive capability of LES models but
ith much reduced computational resources.
.2.1. Ahmed car body: DES
Fig. 20 shows the mean streamwise velocity and turbulent ki-
etic energy over and behind the Ahmed car body using the SST,

N. Ashton et al. / Computers and Fluids 128 (2016) 1–15 11
Fig. 17. (a) Mean Modelled Turbulent Kinetic Energy (TKE) & (b) Mean Resolved Turbulent Kinetic Energy (TKE) at selected slices of the Fastback vehicle for the SST & EBRSM
RANS models and the SST-IDDES model on the coarse and fine mesh.
Fig. 18. Mean Streamwise Velocity at selected slices of the Estate vehicle for the SST & EBRSM RANS models and the SST-IDDES model on the coarse and fine mesh.
Fig. 19. (a) Mean Modelled Turbulent Kinetic Energy (TKE) & (b) Mean Resolved Turbulent Kinetic Energy (TKE) at selected slices of the Estate vehicle for the SST & EBRSM
RANS models and the SST-IDDES model on the coarse and fine mesh.
E
m
a
g
t
m
s
r
t
p
b
e
S
t
w
a
C
a
s
e
T
F
R
e
p
s
t
t
c
a
BRSM and SST-IDDES models. It can be seen that the SST-IDDES
odel provides an improved prediction of the streamwise velocity
s a result of predicting a large TKE in the initial separated re-
ion. There is still however a clear under-prediction of the TKE in
he initial separated shear layer which means too little turbulent
ixing and an over-prediction of the separation region. This is vi-
ualised more clearly in Fig. 21 which shows the regions of sepa-
ated flow for the SST, EBRSM and SST-IDDES models, it’s clear that
he RANS model predict a much larger recirculation region com-
ared to the SST-IDDES model. To assess if this can be improved
y either ulitising a different underlying RANS models or a differ-
nt DES variant, Fig. 22 shows the results for the SA IDDES and
A-DDES models. It can be seen that there is very little sensitivity
o either the DES variant or underlying RANS models for this case,
ith none improving the underprediction of TKE in the initial sep-
rated shear layer region.
To establish that any errors do not arise from the use of STAR-
CM+ (i.e. the codes numerics or implementation), the same case
nd mesh was run in Code_ Saturne using the SST-DDES model (as
hown in Fig. 22(c)). It can be seen that there is little or no differ-
nce between this and the all the DES variants run in STAR-CCM+.
his is further seen through the visualisation of iso-contours in
ig. 23, where there is little difference in the structures observed.
For all the DES variants, there is a clear improvement over the
ANS models in the prediction of both the turbulent kinetic en-
rgy and the streamwise velocity. However, there is still an under-
rediction of the turbulence in the initial separated shear layer, as
hown in Fig. 22(c). This exists no matter the grid refinement (up
o 16 million cells [19], DES model formulation (IDDES, DDES) nor
he code itself (STAR-CCM+, Code Saturne). Further analysis of this
ase can be found in Ashton et al. [19], including more detailed
nalysis of the failure of the RANS and DES variants.

12 N. Ashton et al. / Computers and Fluids 128 (2016) 1–15
a b
c d
Fig. 20. (a) Mean Streamwise velocity along and (b) behind the Ahmed car body and (c) Mean turbulent kinetic energy along and (d) behind the Ahmed car body for the
SST & EBRSM RANS and SST-IDDES models.
Fig. 21. Visualisation of the separated flow for the Ahmed car body using the (a) SST RANS, (b) EBRSM RANS and (c) the SST-IDDES model.
a b c
Fig. 22. Mean Streamwise velocity along the Ahmed car body for the (a) SA-IDDES and SST-IDDES models, (b) SA-IDDES and SA-DDES models and (c) SST-IDDES and
SST-DDES (Code Saturne) models.
Fig. 23. (a) Iso surface contours of the λ2 function (λ2 = 200) for the Ahmed car
body using the SST-IDDES model, (b) the SST-DDES model in Code Saturne.
4
p
a
c
f
w
v
a
a
a
m
.2.2. DrivAer model: DES
It was seen that using hybrid RANS-LES for the Ahmed car body,
rovided an improvement over all RANS models in terms of a more
ccurate prediction of the separation region (although still not in
omplete agreement with experimental data). As the conclusions
rom the RANS study of both the Ahmed car body and DrivAer
ere similar, we now apply hybrid RANS-LES methods to the Dri-
Aer vehicle to assess if these also provide an improvement.
We evaluate two meshes for the hybrid RANS-LES calculations,
coarse 80 million cell grid composed of prism cells in the bound-
ry layer and polyhedral cells away from the wall, this is the same
s the fine grid used in the RANS simulations. Secondly we use a
esh of 100 million cells, with now hexahedral cells away from

N. Ashton et al. / Computers and Fluids 128 (2016) 1–15 13
a b
Fig. 24. (a) Mean Pressure Coefficient over the top of the Fastback configuration for each mesh using the SST IDDES model. (b) Mean Pressure Coefficient over the top of the
Estate configuration for each mesh using the SST IDDES model.
t
m
(
l
F
t
a
v
c
w
w
l
e
t
m
a
t
n
b
E
i
b
e
R
e
&
s
l
h
t
t
r
d
a
R
p
s
a
t
t
f
c
e
p
d
f
i
t
m
t
n
t
v
b
w
c
o
t
F
p
l
p
F
b
i
m
T
s
l
a
v
b
o
t
b
s
C
R
t
s
p
l
4
e
p
he wall to provide a more structured cell layout. A third finer
esh was evaluated but insufficient time-sampling has taken place
initial results show little difference between this and the 100 mil-
ion cell grid). These meshes are summarised in Table 4.
The results for the force coefficients are shown in Table 5 and
igs. 9 & 10 for the fastback and estate configurations, as well as
he pressure coefficient in Fig. 24. The results firstly show that
ll hybrid RANS-LES results (regardless of mesh resolution or DES
ariant) provide a better prediction of the flow for both vehicle
onfigurations. This is most noticeable for the lift coefficient, which
as poorly predicted by the RANS models, but predicted relatively
ell for all the hybrid RANS-LES models. Interestingly, in a simi-
ar fashion to the Ahmed car body, there is relatively little differ-
nce between the DES variants (SA IDDES, DDES, SST-IDDES) for
his flow, although this might be more pronounced with a finer
esh and/or the addition of inflow turbulence. There is a notice-
ble improvement with the fine mesh for the SST-IDDES compu-
ations, which suggests that the polyhedral mesh has additional
umerical dissipation (as there is only 20 million cells difference
etween coarse and fine meshes).
Table 5 also provides the change in drag coefficient between the
state and Fastback configurations. Compared to the RANS results
t can be seen that not only is the direction of the trend correct
ut the magnitude is much closer with the hybrid RANS-LES mod-
ls which combined with the absolute values, makes the hybrid
ANS-LES much more accurate overall than any of the RANS mod-
ls. These differences can be seen in the wake structures in Figs. 14
15 for the fastback and estate configurations respectively. In a
imilar fashion to the Ahmed car body, the RANS models predict a
arger recirculation region and a different wake structure than the
ybrid RANS-LES models. Whilst there is no experimental data for
he 3D wake, the close agreement with both the lift and drag for
he hybrid RANS-LES models suggests this is a more accurate rep-
esentation of the wake structures.
Fig. 13 also shows the CP distribution over the rear win-
ow of the Estate and Fastback configurations against the RANS
nd experimental data [4]. For the fastback configuration, both
ANS and DES methods predict a similar distribution to the ex-
erimental data, however both slightly under-predict the pres-
ure recovery. For the Estate configuration neither the RANS
nd DES methods can capture the correct distribution. Note
hat the scaling has been changed to make the differences be-
ween RANS and DES more visible. There may however be dif-
erences due to the exact wind tunnel domain not being repli-
ated in the CFD models which could affect the pressure co-
fficient. Both DES and RANS models over-predict the negative
ressure on the rear, which indicates too large separation pre-
iction. Unfortunately there is no skin-friction or oil flow data
rom the experiment but it is clear the estate configuration
s most challenging. The DES models provide better agreement
han the RANS which is reflected somewhat in the drag coefficient.
We can see from all the previous figures that firstly no RANS
odel can correctly predict the CD or Cp for any configuration and
hat whilst the DES methods give a better prediction they still can-
ot predict the correct flow, particularly for the estate configura-
ion. It is important to try to ascertain how the DES models pro-
ide this improved accuracy.
Fig. 17 shows both the modeled and resolved TKE for the fast-
ack vehicle. Whilst there is no experimental data to compare to,
e can see that firstly the modeled contribution is small (5%) in
omparison to the resolved content suggesting that the models are
perating in LES mode at these locations. This does not however
ell us whether the resolved turbulence levels are high enough.
or the Ahmed body it was found that all RANS models under-
redicted the level of turbulence in the initial separated shear
ayer and that also even DES variants on a fine mesh still under-
redicted the values compared to the experimental data [19]. In
ig. 17(b), the level of TKE predicted by the SST-RANS model can
e compared to the resolved TKE from the DES results. In a sim-
lar fashion to the Ahmed car body it can be seen that the RANS
odel predicts a lower value of TKE than any of the DES variants.
his helps to explain why the RANS models exhibits greater flow
eparation in Fig. 16(b), as reduced levels of TKE would result in
ower levels of turbulent mixing and a greater recirculation region.
Figs. 18 & 19 show the mean streamwise velocity, modeled TKE
nd resolved TKE for the estate configuration for different DES
ariants and the SST-RANS model. A similar conclusion to the fast-
ack can be observed where the RANS model predicts a lower level
f TKE and as a consequence shows a larger recirculation region
han any of the DES variants.
Whilst it has been established that the DES variants provides
etter accuracy on both car configurations than RANS models, they
till exhibit errors with the lift & drag coefficients and also for the
p over the rear window. So far it has been shown that the relative
ANS-DES performance for the DrivAer cars appear to match the
raits from the Ahmed car body (in terms of TKE and recirculation
ize), thus it is therefore likely that the level of TKE is still under-
redicted in the initial separated shear layer which results in too
arge recirculation length.
.3. Embedded LES
The solution for the Ahmed car body (as detailed in Ashton
t al. [19]) was to inject synthetic turbulence (via the DFSEM ap-
roach [39]) in a one-way coupled embedded DES region, thereby

14 N. Ashton et al. / Computers and Fluids 128 (2016) 1–15
a b
Fig. 25. (a) Mean Streamwise velocity along the Ahmed car body for the SST-URANS, SST-DDES and SST-E-DDES models. (b) Mean Turbulent Kinetic Energy along the Ahmed
car body for the SST-URANS, SST-DDES and SST E-DDES models.
Table 6
Computational expense of each RANS and DES simulation for the DrivAer vehicle.
Method Cells Cores Temporal scheme Time per iteration Compute time Relative cost
SST RANS 80 × 106 512 Steady 6s (2500 it.) 4 h 1
SST IDDES 100 × 106 704 Transient (5 × 10⁻⁵) 7s (26,000 t. steps) 50 h 17
SST IDDES 100 × 106 2048 Transient (5 × 10⁻⁵) 2.5s (26,000 t. steps) 18 h 17
t
i
s
t
a
c
e
b
t
m
w
o
n
i
s
u
c
e
b
t
p
5
A
d
A
h
f
i
s
3 Using 2.6 GHz Intel Sandy Bridge processors (16 cores per node with 64GB
memory), with Mellanox QDR Infiniband.4 Relative cost calculated as additional compute time × additional cost of HPC
resource (e.g. number of cores used).5 Performed on MareNostrum at Barcelona Supercomputing Centre (BSC) using
2.6 GHz Intel Sandy Bridge Xeon processors (16 cores per node with 32GB memory),
with Mellanox FDR Infiniband.
over-coming the lack of TKE in the initial separated shear layer.
This provided the unsteady velocity fluctuations prior to the sepa-
ration point, which allowed the flow to move into a fully resolved
state in the initial separated shear layer. This showed very promis-
ing performance for the Ahmed car body (as shown in Fig. 25) and
provided much closer prediction of the turbulence in the initial
separated shear layer. As this was a one-way coupled approach, it
meant cutting the domain and car prior to the separation point
and placing an inlet boundary condition on this plane, at which
synthetic turbulence could be produced.
Unfortunately for a realistic configuration, like the DrivAer
model, this approach would not be suitable. Cutting the car in
half firstly poses a challenge for the modelling of the vortices that
move down the car, which may be disturbed by such an approach
and secondly there is an obvious coupling effect of the rear sep-
aration on the whole circulation of the car, thus only a two-way
coupled approach would be suitable (which is also strictly true for
the Ahmed car body). The authors are currently working on de-
veloping such an approach but at present this was not available
to evaluate. Nevertheless it is of the opinion of the authors that
injecting synthetic turbulence prior to the separation point would
help overcome the current shortcomings of the DES approach, in a
similar fashion to the Ahmed car body, and hopefully provide an
even closer agreement to the experimental data.
4.4. Computational expense
A major consideration for industrial users of CFD is not only the
accuracy of the method but also the computational cost. Whilst it
has shown that hybrid RANS-LES methods, in particular DES pro-
vides a clear advantage over RANS models for the two test-cases
evaluated, it is important to also assess the computational cost of
each approach. For this, shown in Table 6, we compare a RANS
simulation using the SST model on the DrivAer fastback configu-
ration to the SST-IDDES model used also on the DrivAer fastback
configuration. A constant number of cells per core is used to de-
cide upon the total number of cores used; 144,000 cells per core
in this case. This represents the scalability possible with the ma-
jority of industrial CFD codes.
The RANS simulations were run steady-state so the number of
iterations required to reach the convergence criteria is stated. For
he SST-IDDES simulation a dual-time stepping transient approach
s used, thus the time per iteration is now the time per time
tep (of which 5 inner iterations are used). We calculate a rela-
ive cost based upon the additional compute time as well as the
dditional computational expense of using more HPC resources. It
an be seen that the hybrid RANS-LES simulation is 17 times more
xpensive than the RANS computation. Whilst these values could
e increased or decreased depending on specific optimisation of
he mesh or solution strategy this difference explains why RANS
odels are still the workhorse of many industries. Nevertheless,
ith the inaccuracies highlighted in this paper of the current state-
f-the-art RANS models, the additional computational time should
ow be deemed necessary.
Whilst the current turnaround time is 2 days (on 704 cores),
ncreased scalability of CFD codes and greater access to HPC re-
ources could bring this under 24 h, as highlighted in Table 6 when
sing 2048 cores on MareNostrum HPC facility at Barcelona Super-
omputing Centre (BSC). On the other hand, improved RANS mod-
ls capable of providing accuracy closer to hybrid RANS-LES would
ecome very attractive and thus it is the opinion of the authors
hat there is a still a real need for further research to produce im-
roved RANS models, particularly for complex separated flows.3,4,5
. Conclusions
A comprehensive investigation of RANS and DES models for the
hmed car body and a realistic automotive model has been con-
ucted. A variety of RANS models, from the one-equation Spalart
llmaras model to a low-Reynolds number Reynolds Stress model
ave shown an inability to consistently correctly capture the flow
or both these cases with the under-prediction of the turbulence
n the initial separated shear layer a key deficiency. It has been
hown that the use of a hybrid RANS-LES model (in this case,

N. Ashton et al. / Computers and Fluids 128 (2016) 1–15 15
D
i
t
c
t
o
a
i
a
o
m
w
i
b
A
a
p
s
B
T
f
T
e
d
f
R
[
[
[
[
[
[
[
[
[
[
[
[
[
[
[
[
etached Eddy Simulation) offers an advantage over RANS models
n terms of the force coefficients, and general flow field for both
he Ahmed car body and the DrivAer model. However, for both
ases even at the finest mesh level they could not correctly capture
he flow. The use of an embedded LES approach with the injection
f synthetic turbulence is discussed, and results from using such
n approach on the Ahmed car body is briefly presented, however
t is noted that further work is required to make this suitable for
complete vehicle simulation. Finally the computational expense
f each approach is discussed, showing that hybrid RANS-LES
ethods are still many times more expensive than steady RANS,
hich suggests that further work to improve RANS modelling
s still an important area, largely because of the potential cost
enefit.
cknowledgments
The authors gratefully acknowledge the support from CD-
dapco and also BETA-CAE Systems for providing the ANSA pre-
rocessing tool. The authors gratefully acknowledge computational
upport from EPSRC for UK’s National HPC Facility, ARCHER and
arcelona Supercomputing Centre (BSC) for time on Mare Nostrum.
his work also made use of the facilities of N8 HPC provided and
unded by the N8 consortium and EPSRC (Grant no.EP/K000225/1).
he Centre is co-ordinated by the Universities of Leeds and Manch-
ster. Finally the authors would like to thank the Institute of Aero-
ynamics and Fluid Mechanics at Technische Universitat Munchen
or providing the CAD data of the DrivAer models.
eferences
[1] Ahmed SR, Ramm G, Faltin G. Some salient features of the time averagedground vehicle wake. SAE Technical Paper 840300, 1984. doi:10.4271/840300.
[2] Lienhart H, Becker S. Flow and turbulent structure in the wake of a simplifiedcar model. SAE 2003;01(1):0656.
[3] Heft AI, Adams NA. Experimental and numerical investigation of the drivaermodel. In: Proceedings of the ASME 2012 fluids engineering summer meeting;
2012. p. 1–11.
[4] Heft A, Indinger T, Adams N. Introduction of a New Realistic Generic CarModel for Aerodynamic Investigations. SAE Technical Paper 2012-01-0168,
2012. doi:10.4271/2012-01-0168.[5] Spalart PR, Allmaras SR. A one-equation turbulence model for aerodynamic
flows. La Rech Aerosp. 1994;1:5–21.[6] Spalart PR, Deck S, Shur ML, Squires KD, Strelets MK, Travin A. A new ver-
sion of detached-eddy simulation, resistant to ambiguous grid densities. Theor
Comput Fluid Dyn 2006;20(3):181–95. doi:10.1007/s00162-006-0015-0.[7] Shih T, Liou WW, Shabbir A, Yang Z, Zhu J. A new k-epsilon eddy vis-
cosity model fo high Reynolds number turbulent flows. Comput Fluids1995;24(3):227–38.
[8] Gritskevich MS, Garbaruk AV, Menter FR. Fine-tuning of DDES and IDDES for-mulations to the k-w shear stress transport model. In: 4th european confer-
ence for aerospace sciences EUCASS4; 2011. p. 1–10.
[9] Menter FR. two-equation eddy-viscosity turbulence models for engineering ap-plications. AIAA 1994;32(8):1598–605.
[10] Billard F, Laurence D. A robust kε/k elliptic blending turbulence model ap-plied to near-wall, separated and buoyant flows. Int J Heat Fluid Flow
2012;33(1):45–58. doi:10.1016/j.ijheatfluidflow.2011.11.003.[11] Shur ML, Spalart PR, Strelets MK, Travin AK. A hybrid RANS-LES approach
with delayed-DES and wall-modelled LES capabilities. Int J Heat Fluid Flow2008;29(6):1638–49. doi:10.1016/j.ijheatfluidflow.2008.07.001.
[12] Lardeau S, Manceau R. Computations of complex flow configurations using a
modified elliptic-blending reynolds-stress model. In: ETMM10: 10th Interna-tional ERCOFTAC Symposium on Engineering; 2014.
[13] Fröhlich J, von Terzi D. Hybrid LES/RANS methods for the simulation of turbu-lent flows. Prog Aerosp Sci 2008;44:349–77.
[14] Mockett C. A comprehensive study of detached-eddy simulation. TUB; 2009.Ph.D. thesis.
[15] Wray A. Unpublished DNS data. Available on AGARD database Test Cases forthe Validation of Large- Eddy Simulations of Turbulent Flows. 1997.
[16] Fournier Y, Bonelle J, Moulinec C, Shang Z, Sunderland A, Uribe J. Op-timising Code Saturne computations on Petascale systems. Comput Fluids
2011;45(1):103–8. doi:10.1016/j.compfluid.2011.01.028.[17] Ashton N, Prosser R, Revell A. A hybrid numerical scheme for a new formu-
lation of delayed detached-eddy simulation (DDES) based on elliptic relax-ation. Journal of Physics: Conference Series 2011;vol. 318:042043. doi:10.1088/
1742-6596/318/4/042043.
[18] Schwamborn D, Strelets M. ATAAC An EU-Project Dedicated to Hybrid RANS-LES methods. In: Progress in Hybrid RANS-LES Modelling. In: Notes on Numer-
ical Fluid Mechanics and Multidisciplinary Design, vol. 117; 2012. p. 59–75.[19] Ashton N, Revell A. Key factors in the use of DDES for the flow around a sim-
plified car. Int J Heat Fluid Flow 2015;54:236–49. doi:10.1016/j.ijheatfluidflow.2015.06.002. http://linkinghub.elsevier.com/retrieve/pii/S0142727X15000673.
20] Jakirlic S, Jester-Zurker R, Tropea C. Report on 9th ERCOFTAC/IAHR/COST Work-
shop on Refined Turbulence Modelling. In: ERCOFTAC Bulletin. Darmstadt Uni-versity of Technology; 2002. p. 36–43.
[21] Manceau R, Bonnet J-P, Leschziner M, Menter FR. 10th Joint ERCOFTAC(SIG-15)/IAHR/QNET-CFD Workshop on Refined Flow Modelling. Universite de
Poitiers; 2002.22] Serre E, Minguez M, Pasquetti R, Guilmineau E, Deng GB, Kornhaas M, et al.
On simulating the turbulent flow around the Ahmed body: a FrenchGerman
collaborative evaluation of LES and DES. Comput Fluids 2013;78:10–23. doi:10.1016/j.compfluid.2011.05.017.
23] Mathey F, Cokljat D. Zonal multi-domain RANS/LES simulation of airflow overthe Ahmed body. In: Rodi W, Mulas M, editors. Engineering turbulence mod-
elling and experiments (ETMM 6); 2005. p. 647–56.24] Caridi D, Cokljat D, Schuetze J, Lechner R. Embedded large eddy simulation
of flow around the ahmed body. SAE Int. J. Commer. Veh. 2012;5(1):208–14.
doi:10.4271/2012-01-0587.25] Haase W, Aupoix B, Bunge U, Schwamborn D, editors. FLOMANIA - A European
Initiative on Flow Physics Modelling. Notes on Numerical Fluid Mechanics andMultidisciplinary Design, vol. 94. Springer-Verlag; 2006.
26] Haase W, Braza M, Revell A. DESider - A European Effort on Hybrid RANS-LESModelling. Notes on Numerical Fluid Mechanics and Multidisciplinary Design,
vol. 103. Springer-Verlag; 2007.
[27] Ashton N, Revell A, Poletto R. Grey-area mitigation for the Ahmed car bodyusing embedded DDES. In: Progress in Hybrid RANS-LES Modelling. In: Notes
on Numerical Fluid Mechanics; 2014.28] Hinterberger C, Garcia-Villalba M, Rodi W. Large eddy simulation of flow
around the Ahmed body. In: The Aerodynamics of Heavy Vehicles: Trucks,Buses, and Trains. In: Lecture notes in applied and computational mechanics,
vol. 19. Springer; 2004.
29] Minguez M, Pasquetti R, Serre E. High-order large-eddy simulation of flowover the Ahmed body car model. Phys Fluids 2008;20(9):095101. doi:10.1063/
1.2952595.30] Krajnovic S, Davidson L. Large-eddy simulation of the flow around simplified
car model. In: SAE World Congr Detroit; 2004.[31] Kapadia S, Roy S, Vallero M, Wurtzler K, Forsythe J. Detached-Eddy Simulation
over a reference Ahmed car model. In: AIAA 41th aerospace sciences meetingand exhibit. Reno Nevada: AIAA; 2003.
32] Guilmineau E, Deng G, Wackers J. Numerical simulation with a DES ap-
proach for automotive flows. J Fluids Struct 2011;27(5-6):807–16. doi:10.1016/j.jfluidstructs.2011.03.010.
33] Archambeau F, Mechitoua N, Sakiz M. A finite volume method for the compu-tation of turbulent incompressible flows - industrial applications. Int J Finite
Vol. 2004;1:1–62.34] Travin A, Shur M, Strelets M, Spalart PR. Physical and numerical upgrades in
the detached-eddy simulation of complex turbulent flows. In: Proceedings of
the 412th euromech colloquium on LES and complex transitional and turbulentflows. Munich; 2000.
35] Peters B, Uddin M, Bain J, Curley A, et al. Simulating drivaer with structuredfinite difference overset grids. SAE Technical Paper 2015-01-1536, 2015. doi:10.
4271/2015-01-1536.36] Guilmineau E. Numerical simulations of flow around a realistic generic car
model. SAE Int J Passeng Cars - Mech Syst 2014;7(2) : 2014–01. doi:10.4271/
2014-01-0607.[37] Launder BE, Reece GJ, Rodi W. Progress in the development of a Reynolds
stress turbulence closure. J Fluid Mech 1975;68:537–66.38] Rumsey CL, Jeyapaul E. Pressure-strain and near-wall modelling for two-
dimensional separated flows. In: Stanford Summer School 2009; 2012.39] Poletto R, Craft T, Revell A. A new divergence free synthetic eddy method
for the reproduction of inlet flow conditions for LES. Flow Turbul Combust
2013;91:519–39. doi:10.1007/s10494-013-9488-2.