Embed Size (px)
Citation preview

ASSESSMENT VARIABILITY OF ANNUAL DAILY MAXIMUM RAINFALL OF
JOHOR, MALAYSIA
NUR FAREHAH BINTI ABDULLAH ANASTAS ZORIN
Thesis submitted in partial fulfilment of the requirements for award of the degree of
Bachelor of Civil Engineering (Hons)
Faculty of Civil Engineering & Earth Resources
UNIVERSITI MALAYSIA PAHANG
JUNE 2015

vi
ABSTRACT
Floods generally occur in the main settlements in Johor. Flood happened in Johor
generally is characterised by the yearly alternation of Southwest and Northeast
monsoons. Floods have caused roads and connection between towns cut off. This
problem makes it harder for emergency teams to deliver aids quickly. This paper deals
with the assessment variability of annual daily maximum rainfall of Johor area. Daily
rainfall data were collected from daily satellite image, Tropical Rainfall Measuring
Mission (TRMM) for 16 years (1998-2013). Descriptive statistical analysis was
conducted for the three types of data i) annual rainfall ii) annual monthly maximum
rainfall and iii) annual daily maximum rainfall. Gumbel distribution function was
applied to estimate extreme rainfall events’ return period and found that annual daily
maximum for Kluang, the city with the highest rainfall equal or greater than 535 mm
had a return period of 100 years. The outcomes of this paper can be used to know the
estimated rainfall depth of maximum rainfall in Johor Bahru and can be used in
understanding rainfall patterns in different parts of cities in Johor. On top of that, we
can have better planning of infrastructures for mitigation to cater the predicted high
rainfall intensity.

vii
ABSTRAK
Banjir biasanya berlaku di kawasan penempatan utama di Johor. Banjir berlaku di Johor
umumnya adalah semasa peralihan antara monsun Barat Daya dan Timur Laut. Banjir
telah menyebabkan jalan raya dan hubungan antara bandar-bandar terputus. Masalah ini
menyukarkan pasukan kecemasan untuk menyampaikan bantuan dengan segera ke
kawasan-kawasan tersebut. Objektif kajian adalah untuk menilai kepelbagaian curahan
hujan maksimum tahunan harian di Johor. Data curahan hujan harian imej satelit
Tropical Rainfall Measuring Mission (TRMM) bagi tempoh selama 16 tahun (1998-
2013) dimuat turun dari pangkalan data domain awam. Analisis statistik deskriptif telah
dijalankan untuk tiga jenis data i) hujan tahunan ii) hujan tahunan maksimum bulanan
dan iii) hujan maksimum harian tahunan. Fungsi taburan Gumbel digunakan untuk
menganggarkan tempoh masa peristiwa hujan luar biasa dan mendapati bahawa
maksimum harian tahunan bagi Kluang, bandar dengan hujan yang paling tinggi
mempunyai tempoh ulangan 100 tahun untuk kedalaman hujan yang sama atau lebih
daripada 535 mm. Hasil kajian ini boleh digunakan untuk mengetahui anggaran
kedalaman hujan maksimum di Johor dan boleh digunakan untuk memahami corak
taburan hujan pada bahagian yang berlainan di bandar-bandar sekitar Johor. Selain itu,
perancangan yang lebih baik untuk infrastruktur boleh diaplikasikan untuk tujuan
mitigasi bagi menampung keamatan hujan yang tinggi pada masa akan datang.

viii
TABLE OF CONTENTS
Page
TITLE PAGE
SUPERVISOR’S DECLARATION ii
STUDENTS’S DECLARATION iii
DEDICATION iv
ACKNOWLEDGEMENTS v
ABSTRACT vi
ABSTRAK vii
TABLE OF CONTENTS vii
LIST OF TABLES xii
LIST OF FIGURES xiv
LIST OF SYMBOLS xv
LIST OF ABBREVIATIONS xvi
CHAPTER 1 INTRODUCTION
1.1 Introduction 1
1.2 Problem Statement 3
1.3 Objectives 4
1.4 Scope of Study 4
1.5 Significance of Study 5
1.6 Thesis Structure 6
CHAPTER 2 LITERATURE REVIEW
2.1 Introduction
2.1.1 Flood in Malaysia
7
8
2.2 Hydrological Cycle 8
2.3 Rainfall Type
2.3.1 Convectional Rainfall
2.3.2 Orographic Rainfall
11
11
12

ix
2.3.3 Cyclonic Rainfall 12
2.4 Spatial and Temporal Rainfall Variability
2.4.1 Variability of Rainfall in Malaysia
12
13
2.5 Climate Change Effects
2.5.1 Extreme Precipitation Events due to Climate
Change
2.5.2 Extreme Rainfall Event in Johor
2.5.3 The Effects of Monsoon on Rainfall Variability
2.5.4 El-Nina and La Nina Effects on Rainfall Variability
2.5.5 El Nino
2.5.6 La.Nina
14
15
16
16
19
19
20
2.6 Return Period 20
2.7 Geographical Information System 20
2.8 Summary 21
CHAPTER 3 METHODOLOGY
3.0 Methodology 22
3.1 Study Area 24
3.2 Data Collecting
3.2.1 Satellite Data
3.2.2 Rainfall Data
25
25
26
3.3 Pre-processing
3.3.1 Data Transformation
3.3.2 Conversion and Clipping of Dataset
3.3.3 Data Extraction
27
27
29
32
3.4 Processing
3.4.1 Descriptive Statistics
3.4.2 Gumbel Distribution Function
35
35
36
3.5 Summary 37

x
CHAPTER 4 RESULT AND DISCUSSIONS
4.1 Rainfall Characteristics 30
4.2 Extreme Rainfall Events 41
4.3 Return Period of Annual Daily Maximum Rainfall 42
4.4 Summary 50
CHAPTER 5 CONCLUSION AND RECOMMENDATIONS
5.1 Conclusion 51
5.2 Recommendations for Future Research 52
REFERENCES 54
APPENDICES
A Annual Daily Maximum for Johor Bahru, Pontian, and
Kota Tinggi
59
B Annual Daily Maximum for Mersing, Batu Pahat, and
Muar
60
C Annual Daily Maximum for Segamat and Kluang 61
D Gumbel Distribution Function Analysis for Johor Bahru
and Pontian
62
E Gumbel distribution function analysis for Mersing and Kota
Tinggi
63
F Gumbel Distribution Function Analysis for Batu Pahat and
Muar
64
G Gumbel Distribution Function Analysis for Segamat and
Kluang
65
H Annual Monthly Maximum Rainfall Analysis for Johor
Bahru
66
I Annual Monthly Maximum Rainfall Analysis for Pontian 67
J Annual Monthly Maximum Rainfall Analysis for Kota
Tinggi
68
K Annual Monthly Maximum Rainfall Analysis for Mersing 69

xi
L Annual Monthly Maximum Rainfall Analysis for Batu
Pahat
70
M Annual Monthly Maximum Rainfall Analysis for Muar 71
N Annual Monthly Maximum Rainfall Analysis for Segamat 72
O Annual Monthly Maximum Rainfall Analysis for Kluang 73
P Annual Maximum Rainfall Analysis for Johor Bahru,
Pontian, Kota Tinggi, Mersing, Batu Pahat, Muar, Segamat,
and Kluang
74
xii
LIST OF TABLES
Table No.
Title Page
2.1 Observed trends and projections for the 21st century of key
hydrologic variables
10
2.2 Monsoon regimes in Malaysia 17
3.1 Population and area of major cities in Johor 24
3.2 Latitude and longitude for major cities in Johor 27
3.3 Coordinates for data clipping 29
4.1 Monthly rainfall for major cities in Johor 38
4.2 Annual rainfall for major cities in Johor 40
4.3 Historical extreme rainfall events of major cities in Johor 41
4.4 Equation of return period for major cities in Johor 49
4.5 Mean and standard deviation for all major cities in Johor 49

xiii
LIST OF FIGURES
Figure No. Title
Page
1.1 Flood in Segamat 2
1.2 Road cut off due to flooding 3
1.3 Specific study areas in Johor 5
2.1 Hydrologic Cycle 9
2.2 Illustration of convectional, orographic,and cyclonic rain 11
2.3 Heavy rains caused by monsoons 18
3.1 Summarized flow chart for research methodology 23
3.2 Maps of districts in every state in Malaysia 26
3.3 Global mapper platform 28
3.4 Rainfall data exported to GeoTIFF format 28
3.5 GeoTIFF export option 29
3.6 Data exportation in ArcGis 30
3.7 Raster data exportation in ArcGis 30
3.8 Clipping data in ArcGis 31
3.9 Execution of clipping data 31
3.10 Malaysia map in ArcGis 33
3.11 Adding new layer of major cities in Johor on map 33
3.12 Extract values to points in ArcGis 34
3.13 Rainfall depth extracted 34
3.14 Saving attributes of extracted data 35
4.1 Return period graph of Johor Bahru 42
4.2 Return period graph of Pontian 43

xiv
4.3 Return period graph of Kota Tinggi 43
4.4 Return period graph of Mersing 44
4.5 Return period graph of Batu Pahat 45
4.6 Return period graph of Muar 46
4.7 Return period graph of Segamat 47
4.8 Return period graph of Kluang 48

xv
LIST OF SYMBOLS
x Annual daily maximum rainfall
µ Mean of observed annual daily maximum
rainfall
σ Standard deviation of observed annual
daily maximum rainfall

xvi
LIST OF ABBREVIATIONS
TRMM Tropical Rainfall Measuring Mission
DID Department of Irrigation and Drainage Malaysia
FRMP Flood Risk Management Planning
NFRA National Food Reserve Agency
IPCC Intergovernmental Panel on Climate Change
MMD Malaysian Meteorological Department
ENSO Southern Oscillation phenomenon
GIS Geographical Information System
RS Remote sensing

1
CHAPTER 1
INTRODUCTION
1.1 INTRODUCTION
Malaysia has experienced series of floods since 1920s and one of the severest is
the December 2006 and January 2007 floods (Tompkins, Lemos, & Boyd, 2008). Most
floods that occur are as natural result of cyclical monsoons as Malaysia is located in the
South East Asia with seasonal monsoons of Southwest and Northeast Monsoons. In
December 2006 and January 2007, the Northeast Monsoon had brings heavy rain
through series of continuous extreme rainfall that caused destructive floods in the
southern region of Peninsular Malaysia particularly to Johor. The storms had occurred
in two separate phases in late December 2006 and early January 2007 with a total
precipitation in four days exceeding twice of the monthly rainfall in which some places
recorded a higher number. Extreme rainfall events are among the most disruptive
natural phenomena occurred in Malaysia caused by climate change. In the case of
extreme rainfall events, they adversely affect urban populations because the
infrastructures are often inadequate to accommodate flooding.

2
Figure 1.1: Flood in Segamat
Source: abushahid.wordpress.com (2015)
Johor on the other hand has faced a number of severe floods over several past
years and its vulnerability to these resulted from the rapid urban development of the
Johor. The impacts of river flooding are even more damaging and interrupt economic
activities and the livelihoods of people in the area. Severe flooding that generally occur
in the main settlements in Johor had occurred in 2006 and 2007. Heavy rain and
overflowing rivers have flooded hundreds of towns and villages in Southern Malaysia.
The floods took many lives as well as destroyed crops and cut off roads, power lines
and rail services. (The Star Archive, 2006).

3
Figure 1.2: Road cut off due to flooding
Source: media.straitstimes.com (2015)
In certain parts of the city, flooding due to excessive rainfall can be a severe
problem as the water is inundated for several days due to drainage congestion and the
pumping facilities to remove the stagnant water are insufficient. The roads that were cut
off hardens the situation as this makes it difficult to deliver aids quickly to the flood
areas The water depths in some areas are very high, which creates large infrastructure
problems for the city and can bring damage to existing property and goods.
1.2 PROBLEM STATEMENT
In Johor, many infrastructures like roads and highways were submerged due to
flooding even though the design of hydraulic structures has taken into account the
extreme rainfall depth. The existing system of drainage and infrastructures were
designed based on historical rainfall data, but the capacity of the drainage network will
not be sufficient enough with high intensive short duration rainfall which is expected to
change due to global climate alteration.

4
Thus, it is important that any drainage structure to be designed and constructed
in Johor should be resilient to the latest extreme rainfall events happened to cater the
predicted maximum rainfall intensity.
1.3 OBJECTIVES
The main objective of this study was to assess the variability of annual daily
maximum rainfall of Johor, Malaysia. And the specific objectives are:
i. To obtain daily satellite-based rainfall data for Johor area.
ii. To analyse annual rainfall, annual monthly maximum, and annual daily
maximum rainfall data
1.4 SCOPE OF STUDY
The scope of the work for this research are divided into four parts which are area
of study, the study period, the source of data and the data analysis. The study area is
Johor which located in the Southern part of Peninsular Malaysia. The specific study
areas that being selected are major cities inside Johor state which are Johor Bahru,
Pontian, Kota Tinggi, Mersing, Batu Pahat, Muar, Segamat, and Kluang.

5
Figure 1.3: Specific study areas in Johor
The study period for this research is 16 years (January 1998 – December 2013).
The source of data being used in this study is collected from Tropical Rainfall
Measuring Mission (TRMM) which is a research satellite to study rainfall for weather
and climate research.
On top of that, the methods used for data analysis are descriptive statistics and
Gumbel distribution function. Descriptive statistics is used to determine central
tendency (mean, median, and mode) and variability (standard deviation) of rainfall data
that were collected. Besides, Gumbel distribution function is used to analyse return
period of annual daily maximum rainfall.
1.5 SIGNIFICANCE OF STUDY
Based on the statistical analysis that has been carried out on daily rainfall data,
the maximum and minimum rainfall for every city can be determined. Thus, it can be
used to have better understanding on rainfall patterns in different parts of cities in Johor.

6
The proposed return period of annual daily maximum rainfall in this study can
be used to plan the infrastructures and drainage network .The outcomes of this paper
can be used to upgrade the capacities of hydraulic structures in Johor area to cater the
predicted high rainfall intensity. On top of that, the forecasted extreme rainfall events
can also help in making early preparation for flood and determining future flood risk
.
1.6 THESIS STRUCTURE
This research comprises of five chapters. The first chapter consists of
introduction section. It states the background, problem statement, objectives of study,
scope of study and lastly the significant of study. For chapter two, the key terms in-
purpose for this research are described and also the literature review that related and
suitable for this research. Chapter three explains the research methodology for research
data collected and the method of data analysis to be employed. For chapter four, the
results obtained from study area and year of study were presented and the analysis from
the result was discussed. Finally, chapter five comprises the conclusion from the overall
chapter and relates some recommendations for future work on research field.

CHAPTER 2
LITERATURE REVIEW
2.1 INTRODUCTION
The most destructive natural disaster experienced in Malaysia is flood. Flooding
is a natural disaster caused by climatological factors or climatic factors such as
temperature, rainfall, evaporation, wind movement and the nature of the earth (Balek,
1977). Throughout Malaysia, including Sabah and Sarawak, there is total of 189 river
basins with the main channels flowing directly to the South China Sea and 85 of them
are prone to recurrent flooding (89 of the river basins are in Peninsula Malaysia, 78 in
Sabah and 22 in Sarawak). The estimated area vulnerable to flood disaster is
approximately 29,800 km2 or 9% of the total Malaysia area, and is affecting almost 4.82
million people which is around 22% of the total population of the country (DID, 2009).
A flood can be defined as any high water flow that control over the natural or artificial
banks in any part of the river system. Therefore, when a river bank is overflowing, it
will generally become hazard to the society as the water extends over the flood plain
(Ching et al., 2013).

8
2.1.1 Flood in Malaysia
In Malaysia, floods and flash floods happen especially in the East Coast during
the monsoon season. Increased frequency of flooding in the country occur either
naturally or due to changes in monsoon corresponding to the increase in the urban
areas(Chan 1996; Rose & Peters, 2001). Flooding is usually caused either by continuous
rain by greater amounts than normal or overflow of river water to river banks or from
both situations (Balkema et al. 1993; Schulz et al. 1972).Significant flood events that
had happened in Malaysia occurred in 2006 and 2007. They had caused millions of lost
and damages in four states namely Negeri Sembilan, Melaka, Pahang and Johor.
Recurrent flooding that occurred will increase the shallowness of riverbed at
downstream areas (Bradley & Potter, 1992). Municipal buildings that were built on the
clay that is impermeable, quickly saturated and less absorb water will cause water to
spill over the banks of the river quickly in case of heavy rain (Smith & Ward, 1998).
Bank erosion which affects the thickness of sediment in the river also contributes to
flooding (Ward & Trimble, 2004). When floods occurred, it has terrible impacts on
people as it disrupts their daily activities and the impacts can last for a week or a year,
climate change is likely to make the situation even more challenging (NFRA, 2011). No
matter how hard a government or society tried to minimize or to stop it completely,
flooding is a natural event and it’s more likely to occur naturally (FRMP 2012).
2.2 HYDROLOGICAL CYCLE
Hydrological cycle can be interpreted as a set of water fluxes (hydrological
processes), which transfer water between reservoirs in the geosphere (hydrosphere
proper – oceans, seas, lakes, rivers, wetlands, and marshes; cryosphere - ice and snow;
lithosphere – groundwater, water in rocks, and Earth crust; and atmosphere – clouds)
and biosphere (water contained in living organisms, plants and animals).
9
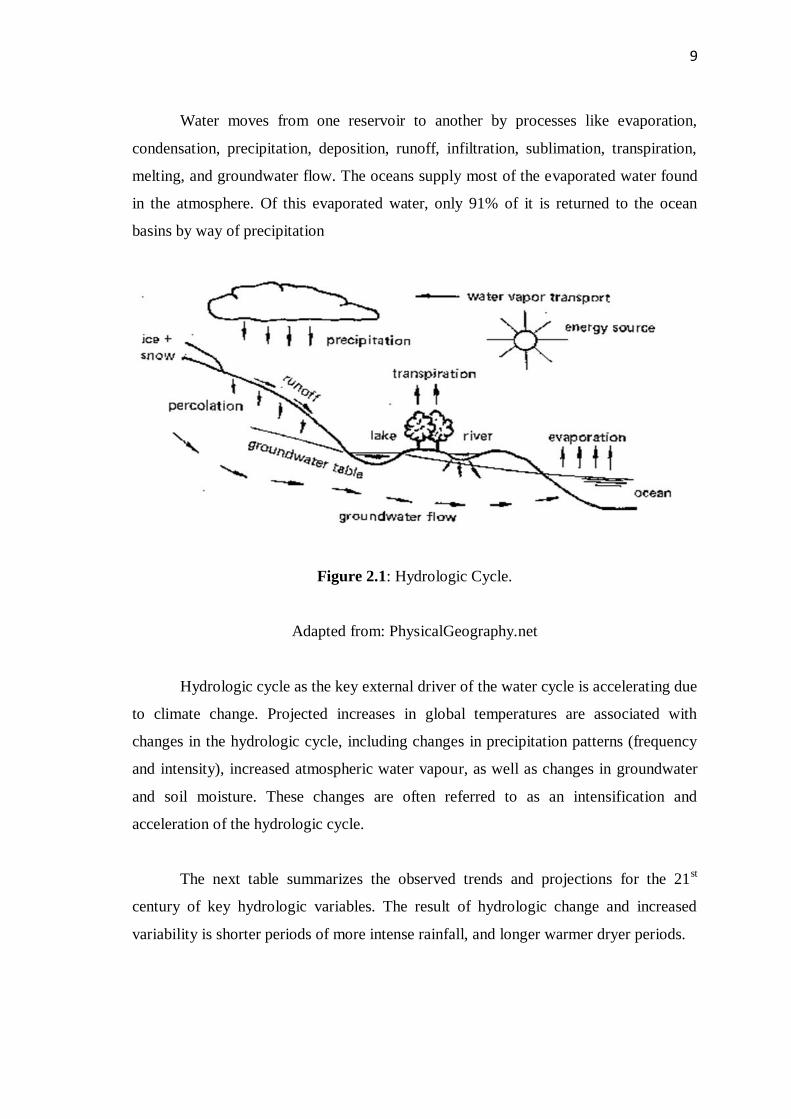
Water moves from one reservoir to another by processes like evaporation,
condensation, precipitation, deposition, runoff, infiltration, sublimation, transpiration,
melting, and groundwater flow. The oceans supply most of the evaporated water found
in the atmosphere. Of this evaporated water, only 91% of it is returned to the ocean
basins by way of precipitation
Figure 2.1: Hydrologic Cycle.
Adapted from: PhysicalGeography.net
Hydrologic cycle as the key external driver of the water cycle is accelerating due
to climate change. Projected increases in global temperatures are associated with
changes in the hydrologic cycle, including changes in precipitation patterns (frequency
and intensity), increased atmospheric water vapour, as well as changes in groundwater
and soil moisture. These changes are often referred to as an intensification and
acceleration of the hydrologic cycle.
The next table summarizes the observed trends and projections for the 21st
century of key hydrologic variables. The result of hydrologic change and increased
variability is shorter periods of more intense rainfall, and longer warmer dryer periods.

10
Table 2.1: Observed trends and projections for the 21st century of key
hydrologic variables
Key Variables
Observed Trends Projections for 21st
Century
Precipitation
Observed
Trend is unclear. General
increases in precipitation
over land from 30°
N to 85°N. Notable
decreases from 10°S to
30°N.
Increase (about 2% / °C) in
total precipitation. High
latitude areas generally
projected to increase. Many
low to mid- latitude areas
projected to decrease.
Atmospheric water vapour
content
Increasing in lower
atmosphere (lower
troposphere; about
1%/decade) in specific
humidity; little change in
relative humidity
Disproportionate
Increasing
Intensity of precipitation Disproportionate increase in
volume of precipitation in
heavy or extreme
precipitation events
Increasing (about 7% /°C)
Tropical cyclones Increases in intensity,
particularly in North
Pacific, Indian Ocean, and
Southwest Pacific
Increase in intensity.
Changes in frequency and
track are uncertain
Adapted from: IPCC, 2007a; National Centre for Atmospheric
Research. Personal Communication.

11
2.3 RAINFALL TYPE
Precipitation can be classified into three main types according to the air lifting
mechanism which are convectional, orographic, and frontal or cyclonic precipitation
Figure 2.2: Illustration of convectional, orographic, and cyclonic rain
Source: www.nirmancare.com (2015)
2.3.1 Convectional rainfall
Convectional rain is caused by the rising of moist air following its contact with
surface of the earth. It forms thunder clouds or cumulonimbus s it reaches the
condensation level. This types of rain overcast skies and bring heavy downpour that last
between one to two hours accompanied by strong winds and sometimes flash floods.
Convectively driven storms like tropical cyclones will bring intense precipitation. Wet
monsoons usually bring this convective rain which form continuous, heavy rain in the
area affected while high intensities convectional rains happened during inter monsoon
period.

12
2.3.2 Orographic Rainfall
Orographic rain falls mainly along the windward side of mountains, notably the
Titiwangsa Range that forms the backbone of Peninsular Malaysia. Orographic rain also
poured its fair share on the highlands in Sabah and Sarawak of which is spilled by water
laden clouds as they rise above the condensation level in the attempt to cross over a
mountain.
2.3.3 Cyclonic Rainfall
Cyclonic rainfall, which can pour continuously for days on end, is one of the
major causes of floods in Malaysia. Most of it falls during the Northeast monsoon
period and covers a wide area along the east coast of Peninsular Malaysia as well as
coastal areas in Sarawak. It is caused by the collision between the easterly and the
westerly trade winds that results in the ascension of moist air into the atmosphere and
condenses into rain.
2.4 SPATIAL AND TEMPORAL RAINFALL VARIABILITY
Understanding the spatial and temporal of rainfall variability is a crucial element
in gaining knowledge on water balance dynamics on various scales for water resources
planning and management. Peninsular Malaysia lacks of detailed quantitative studies
mostly because of the limited number of stations with long records and the problem of
missing data (Moten, 1993). Most studies were conducted in the 1980s and 1990s.
Nieuwolt (1982) who studied agro climatic study introduced a simple method to
quantify rainfall variability over time and related the results to agriculture.
The temporal and spatial characteristics of rainfall have been investigated, but
often restricted to small catchments, e.g. an urbanized area (Desa and Niemczynowicz,
1996) and a forested catchment (Noguchi and Nik, 1996). Annual rainfall maps are
derived by


![[XLS]eikbn.gov.myeikbn.gov.my/sistemonlineikbn/admin/nama_calon/MasterKo... · Web viewNOOR SHAHIRAH BINTI ABDULLAH NOR HIDAYAH BINTI RAWI NOR IZZATI AIMAN BINTI KHASIM NORATIKAH](https://img.dokumen.tips/doc/110x75/5ae41dce7f8b9a0d7d8e8ff2/xlseikbngov-viewnoor-shahirah-binti-abdullah-nor-hidayah-binti-rawi-nor-izzati.jpg)