Embed Size (px)
Citation preview

GCE AS Level Biology S21-B400U20-1
Assessment Resource 11
Biodiversity and Physiology of Body Systems Resource E
through the xylem of a plant. [4]
(ii) Explain how water moves by osmosis into the xylem of the root. [2]
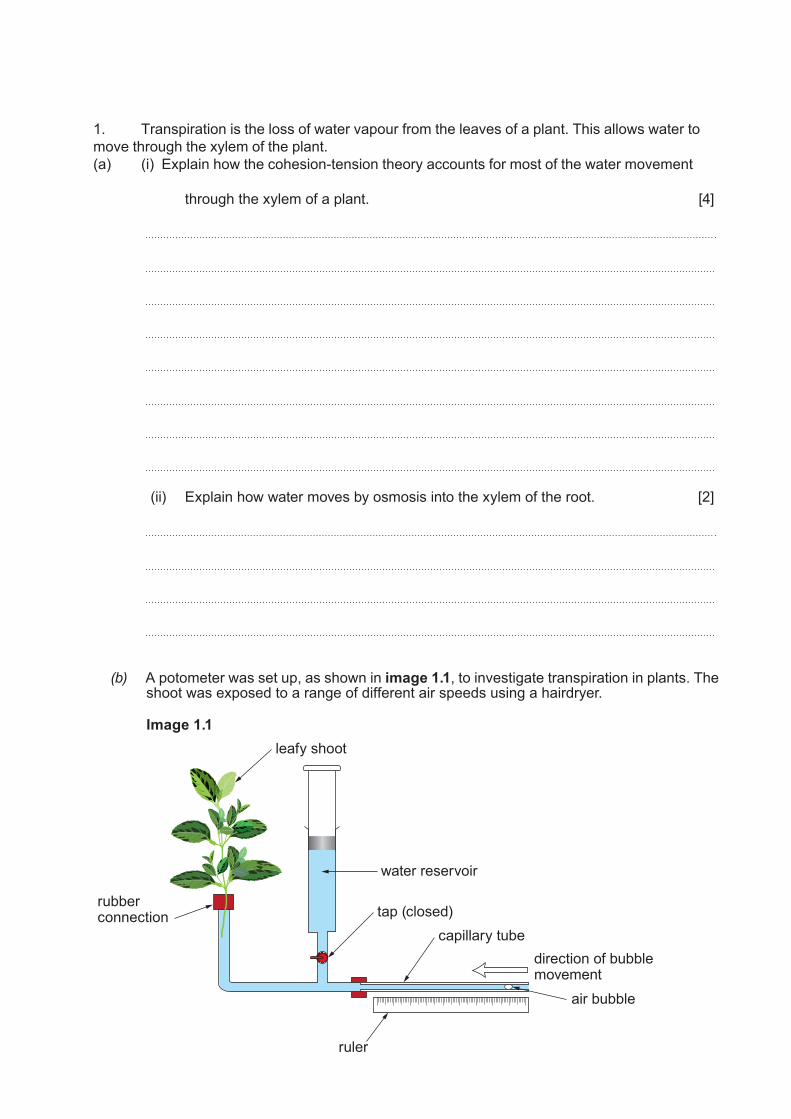
(b) A potometer was set up, as shown in image 1.1, to investigate transpiration in plants. Theshoot was exposed to a range of different air speeds using a hairdryer.
Image 1.1leafy shoot
water reservoir
tap (closed)capillary tube
direction of bubble movement
rubber connection
ruler
air bubble
1. Transpiration is the loss of water vapour from the leaves of a plant. This allows water to move through the xylem of the plant.(a) (i) Explain how the cohesion-tension theory accounts for most of the water movement

(i) Using the fast air speed, the air bubble in the capillary tubing moved 47 mm in 12minutes. The capillary tubing diameter was 1 mm. Calculate the volume of waterlost through transpiration from the shoot per hour using the formula πr2 h. [3]
π = 3.14 h = distance moved
Volume of water lost = . . . . . . . . . . . . . . . . . . . . . . . . . . . . . . . . . . . . . . . . . . . . . . . .mm3 hr –1
(ii) Explain why it would be incorrect to conclude that all the water taken up was lost intranspiration from the shoot. [1]
(iii) Explain how and why the results obtained would differ if a xerophytic plant wasused in the same experiment. [3]

(c) Table 1.2 shows the results of the experiment for three air speeds generated by thehairdryer.
Table 1.2
Air speed setting Distance moved by the bubble in 12 minutes / mm
slow 28
medium 35
fast 47
A student made the following conclusion from these results: ‘Increasing the air speed caused an increase in the distance the bubble moved.’
Suggest three reasons why it would not be possible to be confident in this conclusion. [3]
16
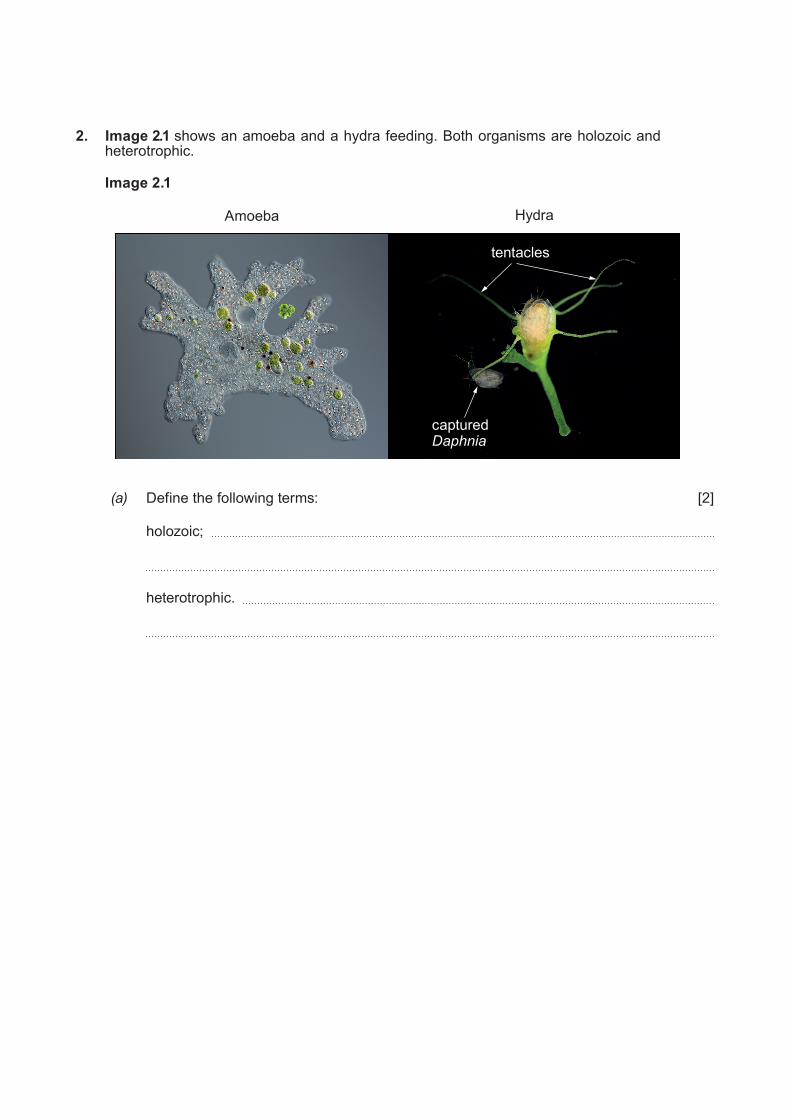
2. Image 2.1 shows an amoeba and a hydra feeding. Both organisms are holozoic andheterotrophic.
Image 2.1
Amoeba Hydra
tentacles
captured Daphnia
(a) Define the following terms: [2]
holozoic;
heterotrophic.

(b) The giant panda, Ailuropoda melanoleuca, is a bear which eats bamboo. It is also holozoicand heterotrophic. The giant panda is classified as a carnivore but eats mainly plants. Theancestors of giant pandas were originally carnivores and began consuming bamboo intheir diet around 7 million years ago. It is thought that they then switched to eating mainlybamboo about 2 million years ago.
(i) The binomial naming system uses the genus and species name for the giant panda.State the main reason for using this system of naming organisms. [1]
(ii) Im age 2.2 shows the skull of a giant panda.
Ima ge 2.2
Using image 2.2 and your own knowledge of dentition, state the evidence which supports the classification of giant pandas as carnivores. [3]

(iii) Describe how and explain why the gut of the panda differs from the gut of a cow.[4]
oesophagusoesophagus
stomach
stomach
caecumcaecum
anus
anus
rumen
I mage 2.3 shows the digestive tract of a cow and a giant panda.
I mage 2.3
(c) Cellulase producing bacteria have been found in the faeces of some giant pandas. Usingyour knowledge of digestion, suggest where in the gut the bacteria would need to belocated to provide the greatest benefit to the panda. Explain your answer. [3]
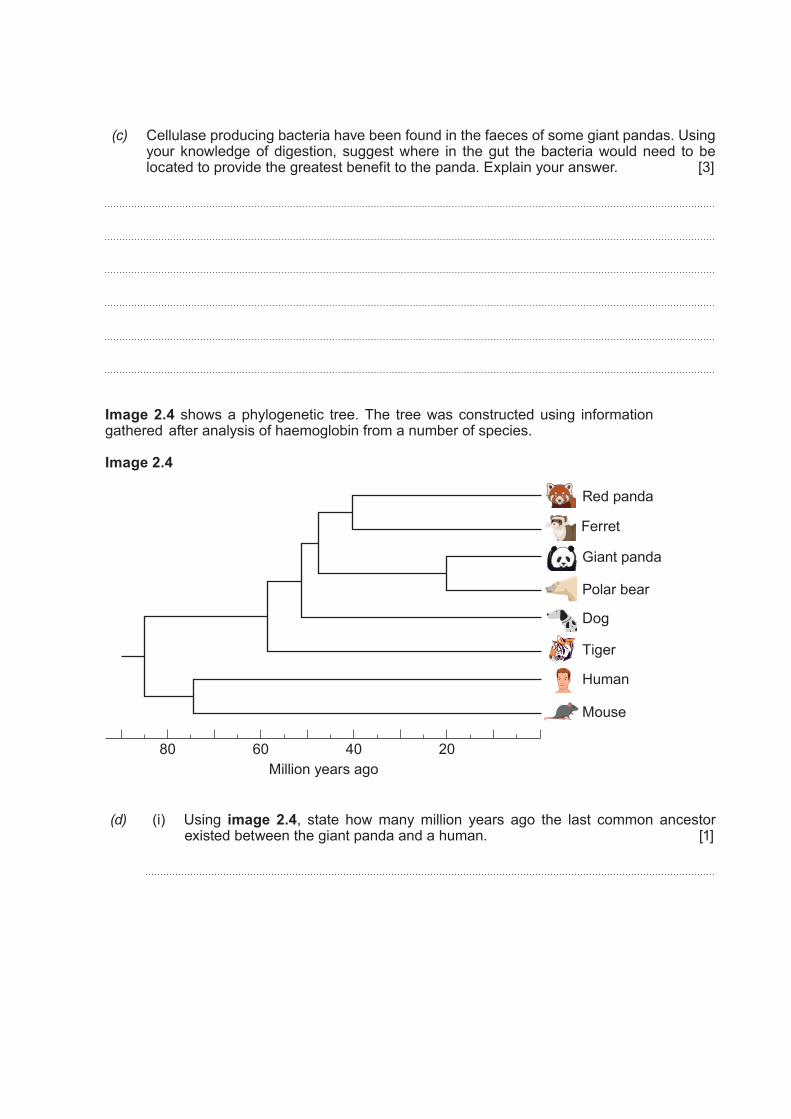
Image 2.4 shows a phylogenetic tree. The tree was constructed using information gathered after analysis of haemoglobin from a number of species.
Image 2.4
(d) (i) Using image 2.4, state how many million years ago the last common ancestorexisted between the giant panda and a human. [1]
20406080
Red panda
Ferret
Giant panda
Polar bear
Dog
Tiger
Human
Mouse
Million years ago

(ii) State the information that the analysis of the haemoglobin would provide, and howthis could have been used to construct the phylogenetic tree shown in image 2.4.
[4]
There are only around 1 000 giant pandas living in the wild. These are split between three areas in China as shown in image 2.5.
Image 2.5.
20
Panda distributionin 1800
Panda distributiontoday
Beijing
CHINA Xi’an
Chengdu
Zhengzhou
The separation of the populations of giant pandas was thought to have caused a reduction in the biodiversity of the species. Further studies have revealed that the biodiversity is high even though the number of individuals is low. The high biodiversity is caused by a high level of genetic polymorphism.
(e) State what is meant by a ‘high level of genetic polymorphism’. [2]