Embed Size (px)
Citation preview

1
Assessment & Quantification of Plastics Waste Generation in Major Cities
CENTRAL POLLUTION CONTROL BOARD (CPCB)
Ministry of Environment & Forests, Govt. of India January, 2015

2

3
C O N T E N T S
S.No. DESCRIPTION PAGE No.
EXECUTIVE SUMMARY 02-03
1. TERMS OF REFERENCE 03
2. OVERVIEW AND METHODOLOGY 03-07
3. FIELD SURVEY 08-60
4A NORTHERN REGION 08-24
4B SOUTHERN REGION 24-32
4C WESTERN REGION 32-43
4D EASTERN REGION 43-53
4E CENTRAL REGION 54-60
5. CURRENT INDIAN SCENARION FOR 61-70
COLLECTION, TRANSPORTATION AND
DISPOSAL OF PLASTIC WASTE
6. FINDINGS ON RECYCLABLE & 71-72
NON-RECYCLABLE CONTENTS
7. ANALYSIS OF SAMPLE 73-76
8. CONCLUSION & RECOMMENDATION 76-80
9. SUGGESTED ACTION PLAN & 81-92
GUIDELINE S FOR PLASTIC
WASTE MANAGEMENT

4
EXECUTIVE SUMMARY
Polymers or Plastics materials rapid growth in 1970s, 1980s and 1990s growing
at the rate of 2.5 times the GDP growth in India. The demand for plastic raw
material got more than doubled from 3.3 Million Metric Ton to 6.8 Million Metric
Tons in 2010 attributed mainly to rapid urbanization; spread of retail chains,
plastics based packaging from grocery to food & vegetable products to cosmetics
& consumer items. Plastics packages have its merits but due to its non-
biodegrability and improper collection system they become an eyesore alongwith
Municipal Solid Waste (MSW) due to its high visibility.
As the synthetic & conventional plastics (petro-based) are non-biodegradable in
nature, it remains in the dump-yards/ landfills for several years, if not collected
propsly. In India, with dense population in cities & urban areas, despite of all
efforts by Municipal Corporations/Local bodies, Source segregation of waste for
separation of biodegradable/non-biodegradable/recyclable waste has not been
effective so far & the fact is plastics carry bags are used for packing & disposal of
all kind of households, stained/soiled food or non food items & got mixed up with
them. If plastics bags or packaging can be sorted or segregated from the source
itself for beneficial purposes, the mixed contaminated & comingled waste would
not land up at dump yards in cities.
To assess and quantify the plastics waste generation and to reutilize the energy
content of the polymer in an ecological and acceptable way, a Study was carried out on “Assessment and Quantification of Plastics Waste Generation in Major Cities” in collaboration with CIPET. The scope of the work comprises of assessment, quantification of plastics waste in dump sites of major 60 cities and suggesting the viable and appropriate recycling technologies (Based on “Zero” waste concept) with following Terms of References (ToR).

5
1. TERMS OF REFERENCES (ToR) OF THE STUDY
• To assess the type, nature and quantum of plastics waste in the country
through field survey and physical assessment at the MSW sites at 60
towns and Cities.
• Establish a Co-ordination mechanism with local Municipal/Metro
corporations in identifying the dump grounds/ Localities of higher waste
generation for the physical assessment/characterization of MSW as per
the prescribed methodology.
• To report on the existing methodology for collection of waste by urban
local bodies/Municipal bodies in different states of the country.
• To suggest the viable and appropriate recycling technologies at major
cities with investment estimation for effective Plastics waste Management (based on “ Zero Waste Concept”)
• Suggest Road Map/Recommendations for Plastics Waste Management as
per the data available from the study for different towns and cities of the
country.
2. OVERVIEW AND METHODOLOGY The ASTM Method (D5231-92) method has been referred as guiding principle for
assessment and quantification of plastics waste at Dump sites. Accordingly, this
methodology was adopted to assess batch/samples of 1000Kg of fresh Municipal
Solid waste (MSW) arriving at dumpsites on different days from different sources
in vehicles like trucks/lorry. The 1000Kg of the sample is initially reduced to125
Kg by quartering technique, i.e.1000Kg are well mixed and divided into four
sections where each section comprises approximately of 250 Kg, from this
divided section the two opposite sections are discarded and the other two section
are taken for the next quartering step. (steps illustrated in Fig 1A, 2B, 3C).

6
FIGURE1A: SAMPLING STEP: 1
FIGURE 1B: SAMPLING STEP: 2
FIGURE 1B: SAMPLING STEP: 3
62.5
62.5
62.5
62.5
Sampling of Waste by Quatering Technique From Previously Selected 250 Kg.
125.0
125.0
125.0
125.0
Sampling of Waste by Quatering Technique From Previously Selected 500 Kg.
250.0
250.0
250.0
250.0
Sampling of Waste by Quatering Technique From Previously
Selected 1000 Kg.

7
The plastics constitute two major categories: (i) Thermoplastics and (ii)
Thermoset plastics. The plastics materials are categorized in seven types based
on properties & applications. In order to make the recycling easier, the
universally accepted standards has been developed to help consumers to
identify and sort out the main types of plastics with marking code. The symbols
defined by society of the plastic industry (SPI) USA are adopted as IS
14534:1998 of BIS are as follows:
PET HDPE PVC LDPE PP PS OTHER
From the sampled 125Kg of Municipal Solid Waste (MSW) the various types of
plastics like PET, PE Based (LDPE/HDPE), PVC, PP, PS/ OTHER has been
sorted out and segregated. Finally the segregated plastics are weighed and
quantified as depicted in Figure 2.
Assessment of Waste
Formal System
Preparation of 1000Kg of Sample
Reduction of MSW 500Kgs by Quantification Process
Informal System
Interaction with Rag Pickers & Kabadi’s
Collection of Data on Quantity of Plastics
Interaction with Municipal Corporation, identification of
Dumpsite

8
FIGURE 2: METHODOLOGY (PROCESS SEQUENCE) CHART
TABLE- A CLASSIFICATION OF PLASTICS WASTE
Reduction of MSW 250Kgs by Quantification Process
Reduction of MSW 125Kgs by Quantification Process
Segregation of Plastics
Post treatment Operations
PET PE PVC PP PS OTHERS
Weighing of Samples Collected
Disposal of Waste
Finding the Quantity of Plastics Waste
Information: Post treatment operations by Municipal
Corporation

9
Sr. No Source Code Name of plastics Few Applications
1.
PET
Polyethylene
Terephthalate (PET)
Drinking water Bottles, Soft
drink Bottles, Food jars, Jelly
pickles, Plastics Films,
Sheets
2.
&
HDPE LDPE
High Density
Polyethylene (HDPE)
Low Density
Polyethylene (LDPE)
Plastics bags ,Food
containers, woven sacks,
Bottles, Plastics Toys, Milk
Pouches & Shopping Bags,
Metalized Pouches
3.
PVC
Polyvinyl Chloride
(PVC)
Pipes, Hoses, Sheets, Wire,
cable insulations, Multilayer
Tubes
4.
PP
Polypropylene (PP)
Disposable Cups, Bottle caps,
Straws,
5.
PS
Polystyrene (PS)
Disposable Cups, glasses,
Plates, spoons, trays, CD
Covers, Cassette Boxes,
Foams
6.
OTHER
Thermoset,
Poly Carbonate (PC),
Poly urethane (PU)
FRP
CD, Melamine Plates,
Helmets, Shoe soles.
3. FIELD SURVEY (Field Survey Regions/ Locations) For the assessment and quantification of plastics waste generation in India, the
60 Cities were selected in 05 regions, Northern, Southern, Eastern & Western,
and Central regions.

10
4A. NORTHERN REGION comprises cities like Lucknow, Allahabad, Chandigarh, Delhi, Faridabad, Jammu, Srinagar, Shimla, Amritsar, Dehradun, Agra, Meerut, Varanasi, Kanpur, Patna, Ranchi, Jamshedpur, Dhanbad, Ludhiana. In almost all the cities the MSW generated from different
sources like door to door, community bin at the street corners and from markets
are collected by the municipal trucks or by the firms under contract to the
government and dumped in the open dump yard. The findings of the survey are
described city wise as given below.
TABLE: 01 STUDY OF LUCKNOW CITY: Plastics waste (PW) in Kg/ Metric Ton-(MT)
SERIAL OF DAYS
PET
HDPE/LDPE
PVC
PP
PS
OTHER
TOTAL
DAY 1 9.182 19.428 4.7702 13.9304 6.314 4.306 57.9306
DAY 2 3.988 36.972 3.802 6.704 0.668 3.458 55.592
DAY 3 2.448 45.732 3.146 4.144 1.38 2.254 59.104
DAY 4 3.052 41.028 4.042 6.23 0.942 4.274 59.56
DAY 5 4.394 48.162 1.422 5.512 1.136 2.31 62.936
AVERAGE 4.6128 38.264 3.4364 7.3041 2.0882 3.3204 59.03
In Lucknow, Dodouli Dumping yard has been selected for the assessment. The
assessment revealed that average total Plastic waste generation in Lucknow at
the time of study was about 59.03Kg/MT as given in Table 1. It has been worked
out from the above data that about 64% of total plastics waste is generated from
PE family of (HDPE/LDPE) materials. The Total MSW generated ( average) in
Lucknow was 1200 MT/ Day. During the period of survey, the Minimum Plastics
waste generation varies from 31.06 Kg/MT to 83.18 Kg/MT on different days of
the week.

11
TABLE: 02 STUDY OF ALLAHABAD CITY:PW (Kg/MT)
SERIAL OF DAYS
PET
HDPE/LDPE
PVC
PP
PS
OTHER
TOTAL
DAY 1 3.508 40.402 4.472 8.908 1.726 4.062 63.078
DAY 2 6.036 4.018 1.84 17.436 0 18.702 48.032
DAY 3 7.152 8.6 1.064 6.212 1.288 23.908 48.224
DAY 4 5.372 33.398 6.788 7.78 0.498 2.392 56.228
AVERAGE 5.517 21.605 3.541 10.084 0.878 12.266 53.89
In Allahabad, Badshi Bandh and Karamati chowki dumping grounds have been
selected for the study. The data given in table 2 indicates that average Plastics-
waste generation in Allahabad was about 53.89Kg/MT out of total MSW waste of
about 350 MT/day. Around 40% of total plastics waste is generated from HDPE
& LDPE materials. The minimum & maximum Plastics waste generation at
Allahabad have been assessed as 16.72 Kg/MT and 102.46Kg/MT respectively.
The burning of MSW and plastic waste use found at the dumping ground. No
mechanism of dumping or any other post-treatment operation was found.
TABLE: 03 STUDY OF CHANDIGARH CITY:PW(Kg/MT)
SERIAL OF DAYS
PET
HDPE/LDPE
PVC
PP
PS
OTHER
TOTAL
DAY 1 0.24 17.6 0.8 6.4 1.6 4.8 31.44
DAY 2 0.8 15.2 5.6 0.32 0.8 9.6 32.32
DAY 3 0 19.2 0.4 5.6 2.4 13.6 41.2
DAY 4 0 16.8 0.2 7.2 2 12 38.2

12
DAY 5 0 11.2 4 4 1.6 4 24.8
DAY 6 0 8 0 4 1.6 0 13.6
DAY 7 0 12.8 0.16 3.2 1.6 7.2 24.96
DAY 8 0.32 17.6 0 9.6 3.2 4 34.72
DAY 9 0.16 21.6 0.2 8.8 1.6 4.8 37.16
DAY 10 0.16 16 0.08 9.6 0.8 4.8 31.44
AVERAGE 0.168 15.6 1.144 5.872 1.72 6.58 30.98
In Chandigarh, the collection & segregation of MSW is being done by rag pickers
before dumping in the open dump yard. The city corporation in association with
CAW &ED society has built Sehay Saji Kaneehas to collect maximum plastic
waste generated at various resident areas from different parts of the city. In
addition to this, M/s Jaiprakash Associated ltd has setup a Green Tech Fuel
processing plant which has capacity of 500 MT/ Day to produce a product of RDF
(Refuse Derived Fuel).
Daddu Nagar site has been selected for the study. The average total Plastic
waste generation in Chandigarh was found to be about 30.98Kg/MT reported in
Table 3. Around 52% of total plastics wastes are generated from HDPE/LDPE
materials and 23% of unclassified/other plastics waste. The Total MSW
generated in this city was with an average of 264 MT/ Day. It has been reported
that plastic waste generation varies from 13.60 Kg/MT to 41.60Kg/MT on
different Weekdays.

13
TABLE: 04 STUDY OF DELHI CITY: PW(Kg/MT)
SERIAL OF DAYS
PET
HDPE/LDPE
PVC
PP
PS
OTHER
TOTAL
DAY 1 2.6026 85.245 1.205 8.381 6.757 2.946 107.138
DAY 2 5.981 79.786 1.045 3.869 7.56 1.008 99.256
DAY 3 1.94 79.56 0.852 6.72 6.42 1.192 96.684
DAY 4 3.522 75.024 1.304 2.925 9.210 3.293 95.28
DAY 5 1.416 67.349 2.632 9.33 17.221 9.298 107.253
AVERAGE 3.175 77.24 1.447 6.213 9.650 3.716 101.44 In Delhi, the quantity of plastic waste has been assessed as 10.14%, which
comprises of 76% of HDPE/LDPE, 7% of PVC and 10% of Polystyrene material,
described in Table 4. The Total MSW generated in this city was with an average
of 6800 MT/ Day. During the survey on different weekdays, the minimum plastic
waste generation was 87.23 Kg/MT and maximum was 118.74Kg/MT. The field
survey was carried out at Gazipur, East Delhi. It has been observed no post-
treatment operation for MSW is carried out in the city and 100% of MSW is
dumped as land-filling. Approximately, 200-250 rag pickers were voluntarily
collecting the valuable plastics waste that was generated throughout the day.
Further the compost fertilizer plant having the capacity of about 500MT was
established in the city, but currently the plant produces with an output of about
only 200 MT. Delhi, being the capital city requires urgent attention for efforts to
recycle the recyclable plastic waste such as PET, PE & PP & PVC etc. since the
quantum of waste would increase further in future. With over 10% of Plastics
Waste in MSW, waste management authorities/civic bodies should set-up
Plastics Waste Management Cell (PWMC) exclusively to deal with plastics waste
by adopting prevailing technologies.

14
TABLE: 05 STUDY OF FARIDABAD CITY: PW(Kg/MT)
SERIAL OF DAYS
PET
HDPE/LDPE
PVC
PP
PS
OTHER
TOTAL
DAY 1 8.736 104.054 0.32 2.36 4.3 1 120.77
DAY 2 15.368 74.4 1.648 1.144 6.984 0 99.544
DAY 3 14.444 87.65 1.656 7.79 6.996 0 118.54 AVERAGE 12.849 88.701 1.208 3.765 6.093 0.333 112.95
In Faridabad, the survey was conducted at Bandhwari Village, Gudam Road
which has the average total MSW was around 700 MT/Day out of the average
PW was generated about 112.95 Kg/MT. The classified data for different types of
plastics waste is represented in Table 5. The study data revealed that about 80%
of plastics waste was from HDPE/LDPE material, which is recyclable. The waste
management in Faridabad is carried by M/s. A.K.Enterprise (Hanjar Bio-Tech),
they have deployed rag pickers of about 150-200Nos.are employed in this
treatment plant. The MSW generated in Faridabad and Gurgaon are treated in
this plant. Apart from this the following post treatment plant are also currently
present at Faridabad city :-
• Compost plant for fertilizer of capacity 600MT/day.
• RDF, Bricks plant of capacity 300 MT/Day
• Plastics recycling unit
15
TABLE: 06 STUDY OF JAMMU CITY: PW (Kg/MT)
SERIAL OF DAYS
PET
HDPE/LDPE
PVC
PP
PS
OTHER
TOTAL
DAY 1 1.52 29.2 14.16 19.2 4.48 9.44 78
DAY 2 3.2 21.6 1.76 23.52 7.92 34.08 92.08
DAY 3 2.56 36.88 0.64 28.00 5.92 9.76 83.76
DAY 4 0.32 16.48 0.64 12.16 8.16 9.12 46.88
DAY 5 0.96 35.68 1.76 12.32 4.8 12.64 68.16
DAY 6 1.12 41.28 3.04 27.68 4.16 8.8 86.08
DAY 7 2.56 16.32 0.96 20.32 3.52 7.2 50.88
AVERAGE 1.7486 28.206 3.21 20.457 5.56 13.006 72.26
The data of Bhagwati Nagar dumping ground at Jammu generate an average
PW of about 72.26Kg/MT as shown in Table 6. Out of which, 66% comprise
HDPE/LDPE/PP materials with a minimum plastics waste generation 46.88
Kg/MT and with maximum of 92.08Kg/MT. The Total MSW generated in this city
was with an average of 300 MT/ Day. Although, the Jammu and Kashmir
Government has ban on the usage of the carry bags, but still it is observed that
huge quantity of plastics packaging materials are littered. Since proper dumping
yard is not available, the dumping of plastic carry bag has also ban observed in
Tawi River.

16
TABLE: 07 STUDY OF SRINAGAR CITY : PW(Kg/MT)
SERIAL OF DAYS
PET
HDPE/LDPE
PVC
PP
PS
OTHER
TOTAL
DAY 1 3.2 16.68 5.68 13.6 6.48 2.36 48
DAY 2 10.4 23.3 9.6 15.2 2.32 9.04 69.86
DAY 3 2.52 21.16 4.52 10.56 5.76 1.976 46.496
DAY 4 3.24 21.68 4.208 9.112 6.64 2.48 47.36
DAY 5 2.32 25.056 3.592 7.144 4.032 6.52 48.664
DAY 6 2.56 24.88 4.096 9.6 3.976 1.52 46.632
AVERAGE 4.04 22.126 5.2827 10.869 4.868 3.9827 51.17
In Srinagar, survey has been conduced at Achan Saidpura dump site. The study
data shows total MSW is about 550 MT/Day of which, the total average PW is
about 51.17Kg/MT. In which the types of plastics are classified and showed as
42% of HPDE/LDPE and 21% of PP waste material represented in Table 07.
During the survey the minimum plastic waste generation is in 4.7 Kg/MT and
maximum is 7.0 Kg/MT.

17
TABLE: 08 STUDY OF SIMLA CITY: PW(Kg/MT)
SERIAL OF DAYS
PET
HDPE/LDPE
PVC
PP
PS
OTHER
TOTAL
DAY 1 1.68 17.28 0.64 19.44 1.6 4.72 45.36
DAY 2 3.6 22.6 0.56 17.48 1.16 13.44 58.84
DAY 3 2.68 15.4 0.76 12.6 2.16 5.56 39.16
DAY 4 2.676 17.8 1.16 12.4 1 4.76 39.796
DAY 5 2.32 15.44 0.8 11.72 2.24 5 37.52
DAY 6 1.56 13.64 1.32
8.04 3.36 4.2 32.12
DAY 7 3.68 26.64 0.56 20.24 2.16 5.44 58.72
AVERAGE 2.599 18.400 0.829 14.56 1.954 6.160 44.502
In Simla, it is observed that separate system (incineration) is used for medical
waste. Two types of dust bins are provided at Simla, to collect the Bio-
degradable and Non-Biodegradable municipal solid waste (MSW). Survey has
been conduced at Darini ka bagicha dump site. The total MSW is about 50
MT/Day out of which the total average PW is about 44.502 Kg/MT. In which the
types of plastics are classified and showed the majority of 39.3% of HPDE/LDPE
and 32.3% of PP waste Material as indicated in Table 08. During the survey the
minimum plastic waste generation is in the range from 32.12 to 58.84 Kg/MT on
few weekdays.

18
TABLE: 09 STUDY OF AMRITSAR CITY: PW(Kg/MT)
SERIAL OF DAYS
PET
HDPE/LDPE
PVC
PP
PS
OTHER
TOTAL
DAY 1 0 13.92 0.8 15.52 3.2 1.44 34.88
DAY 2 2.24 28.32 1.76 13.28 5.6 15.52 66.72
DAY 3 1.28 20 1.76 9.92 1.92 0 34.88
DAY 4 0 26.24 0 20.8 2.4 3.04 52.48
DAY 5 1.6 18.56 0.8 12.8 1.44 5.44 40.64
DAY 6 3.04 21.12 2.24 23.2 2.4 3.36 55.36
DAY 7 0.64 15.04 0 11.52 2.56 1.76 31.52
DAY 8 1.44 18.72 1.12 14.24 2.24 0.96 38.72
AVERAGE 1.28 20.24 1.06 15.16 2.72 3.94 44.40
In Amristar, the plastics assessment and quantification study was conducted at
Bhagtawala dumping site. The findings on table 9 revealed that the total MSW
generation was about 550 MT/Day. The average PW was observed as
44.40Kg/MT, the majority of plastics waste found as carry bags and packaging
pouches which is of 45.5% belong to the classification of HDPE/LDPE material.
The field study revealed that the minimum plastic waste generation is
31.52Kg/MT and maximum of 66.72Kg/MT

19
TABLE: 10 STUDY OF DEHRADUN CITY: PW(Kg/MT)
SERIAL OF DAYS
PET
HDPE/LDPE
PVC
PP
PS
OTHER
TOTAL
DAY 1 8.484 43.154 6.912 9.61 1.86 2.178 72.198
DAY 2 9.14 36.212 2.574 4.554 2.406 5.33 60.216
DAY 3 10.358 43.374 4.616 6.2 1.56 3.318 69.42
DAY 4 5.102 38.974 7.412 6.14 4.34 2.31 64.278
AVERAGE 8.271 40.429 5.3785 6.626 2.5415 3.2839 66.53
The field study for assessing and quantifying the plastics waste has been carried
out at Sahastradhara dumping ground. The total MSW of Dehradun was about
220 MT/Day, out of which, the PW generation is 66.53Kg/MT, the majority of
plastics waste was observed as carry bags, packaging pouches and multilayer
films of about 61 % made up of HDPE/LDPE material. The findings of Dehradun
are reported in Table 10.
TABLE: 11 STUDY OF AGRA CITY: PW(Kg/MT)
SERIAL OF DAYS
PET
HDPE/LDPE
PVC
PP
PS
OTHER
TOTAL
DAY 1 10.33 42.724 5.972 8.484 1.122 11.014 79.646
DAY 2 8.786 42.688 7.624 6.746 1.24 7.672 74.756
DAY 3 8.746 45.064 8.226 10.162 0.18 9.82 82.198 AVERAGE 9.2873 43.492 7.274 8.464 0.8473 9.502 78.87
In Agra, the field survey was carried out at chhalesar dumping site, where the
dumping of average total MSW of about 520MT/Day.The data revealed that

20
about 78.87 Kg/MT of PW was generated as represented in table 11. However,
55 % plastics waste is generated from HDPE/LDPE materials consist of carry
bags, household items and multilayer films. The minimum plastics waste
generation is about 58.6 Kg/MT and Maximum of about 95.15 Kg/ MT.
TABLE: 12 STUDY OF MEERUT CITY: PW(Kg/MT)
SERIAL OF DAYS
PET
HDPE/LDPE
PVC
PP
PS
OTHER
TOTAL
DAY 1 6.49 41.106 6.924 7.114 0.658 3.588 65.88
DAY 2 6.152 42.46 6.0205 4.776 1.582 7.2485 68.24
DAY 3 4.88 42.244 3.022 5.328 0.626 6.614 62.714
DAY 4 1.552 41.218 4.612 6.758 2.484 3.402 60.026
AVERAGE 23.26 23.451 5.569 3.6658 3.2753 34.715 64.22 In Meerut, Lohia nagar Hapur Road, Mangat puram, Delhi Road dumping site
were selected for the plastics quantification field survey. The field study provided
the data, which represented an average PW of about 64.22 Kg/MT, where the
total MSW generated in the city is of about 52 MT/Day. The data for segregated
plastics waste is given in Table 12. The majority of plastics waste generated from
HDPE/LDPE and PET has 36.5% and 36.2% respectively. Further, data revealed
that the minimum quantity of plastics waste generation is about 51.37 Kg/ MT
and a maximum of about 81.81 Kg/MT.

21
TABLE: 13 STUDY OF VARANASI CITY: PW(Kg/MT)
SERIAL OF DAYS
PET
HDPE/LDPE
PVC
PP
PS
OTHER
TOTAL
DAY 1 4.48325 28.066 15.27 6.268 0.64 4.176 58.90
DAY 2 5.712 42.898 4.108 7.384 1.434 4.135 65.670
DAY 3 4.208 37.406 4.354 3.988 1.78 3.562 55.298
DAY 4 2.844 40.164 2.586 5.936 0.54 3.53 55.6
DAY 5 12.3775 13.038 4.588 10.058 2.216 10.2 52.47
AVERAGE 5.925 32.314 6.1812 6.7268 1.322 5.1205 57.59
The quantity of plastics waste generated through Sheer Govardhan and Tenura
Mau Dam at Varanasi are 57.59 Kg/MT. The total MSW generated at Varanasi
was about 450 MT/Day. However, it has been observed that major part of value
added plastics generated on HDPE/LDPE materials like carry bags, multilayer
plastics etc which is about 56% given in table 13. The minimum plastics waste
generated of about 23.68 Kg/MT and Maximum of about 94.44 Kg/ MT
TABLE: 14 STUDY OF KANPUR CITY: PW(Kg/MT)
SERIAL OF DAYS
PET
HDPE/LDPE
PVC
PP
PS
OTHER
TOTAL
DAY 1 4.3802 53.15 3.5102 7.0022 0.9582 2.9682 71.969
DAY 2 4.236 40.196 8.17 2.08 0.38 1.24 56.302
DAY 3 3.366 48.708 7.98 7.02 0.44 1.03 68.544
DAY 4 8.36 45.68 4.262 8.54 0.34 3.442 70.624
AVERAGE 5.0856 46.934 5.9806 6.1606 0.5296 2.1701 66.86

22
The field study at Kanpur city was conducted at Panci Bhausing dumping ground.
The total MSW generated at Kanpur was about 1600 MT/Day. The average total
PW generated was about 66.86 Kg/MT given in table 14, during the field survey it
is observed that the majority of plastic waste generated on HDPE/LDPE
materials like carry bags, bottles, and multilayer plastics. The minimum plastics
waste generated of about 51.78 Kg/MT and maximum of about 94.08 Kg/ MT
TABLE: 15 STUDY OF PATNA CITY: PW(Kg/MT)
SERIAL OF DAYS
PET
HDPE/LDPE
PVC
PP
PS
OTHER
TOTAL
DAY 1 1.052 27.312 6.934 1.702 4.494 3.660 45.154
DAY 2 1.322 34.8595 0.68 8.616 1.686 3.986 51.150
DAY 3 1.426 33.25 0.596 11.458 3.042 2.126 51.898
DAY 4 1.27 35.4065 0.6135 6.084 4.216 6.016 53.606
DAY 5 1.932 38.124 1.07 4.762 3.772 10.7615 60.4215
DAY 6 1.558 45.831 0.608 9.636 6.866 6.928 71.427
DAY 7 1.672 46.564 0.42 8.988 5.008 4.444 67.096
AVERAGE 1.4617 37.335 1.5602 7.3209 4.1549 5.4173 57.250
In Patna, the plastics assessment and quantification study was conducted at
Bairia. The findings revealed that the total MSW was about 220 MT/Day. The PW
was observed as 57.25 Kg/MT, out of which the majority of plastics waste found
as carry bags and packaging pouches which is of 65.15% made up of
HDPE/LDPE material. The field study reveals that the minimum plastic waste
generation 35.98 Kg/MT and maximum of 76.57Kg/MT. The data observed
during field study are resulted in table 15.

23
TABLE: 16 STUDY OF RANCHI CITY: PW(Kg/MT)
SERIAL OF DAYS
PET
HDPE/LDPE
PVC
PP
PS
OTHER
TOTAL
DAY 1 0.994 35.648 0.36 7.002 3.732 9.31 57.046
DAY 2 0.702 37.4105 0.896 6.472 3.844 6.986 56.3105
DAY 3 1.024 37.95 0.438 6.28 4.842 8.266 58.8
DAY 4 0.716 40.404 1.194 6.472 5.244 6.02 60.05
DAY 5 0.68 42.546 0.436 6.542 5.89 5.358 61.452
DAY 6 0.686 43.28 0.84 5.71 3.368 6.186 60.07
DAY 7 0.656 42.088 0.89 6.46 4.332 6.226 60.652
AVERAGE 0.7797 39.904 0.722 6.4197 4.4646 6.9074 59.20
The quantity of plastics waste generated through Jhiri Dump site at Ranchi are
59.20 Kg/MT. The total MSW generated at Varanasi is above 140 MT/Day.
Majority of the plastics waste was observed on HDPE/LDPE material which is
about 67.3% given in table 16. The minimum plastics waste generation is about
48.75 Kg/MT and maximum of about 67.59 Kg/ MT.
TABLE: 17 STUDY OF JAMSHEDPUR CITY: PW(Kg/MT)
SERIAL OF DAYS
PET
HDPE/LDPE
PVC
PP
PS
OTHER
TOTAL
DAY 1 2.3725 13.95 0.65 3.688 3.806 4.554 29.020
DAY 2 1.584 18.432 0.226 2 2.476 3.87 28.59
DAY 3 1.941 19.874 0.521 2.728 2.217 3.28 30.561
DAY 4 3.070 31.943 0.487 3.890 3.933 2.693 46.017
AVERAGE 2.242 21.05 0.471 3.077 3.108 3.599 33.55

24
In Jamshedpur, the field survey was carried out at Bhuiandhri Dump site and the
average PW generated about 33.55 Kg/MT. The total MSW generation at
Jamshedpur is about 28 MT/Day. The actual quantity of plastic waste worked out
from the survey is given in table 17. The data revealed that 6.68% of PET,
62.11% of HDPE/LDPE, 1.436 % of PVC, 9.23 % of PP, 9.23% of PS and finally
11.18% of unclassified plastics are produced. The minimum plastics waste
generation was about 26.34 Kg/MT and maximum of about 50.78 Kg/ MT.
TABLE: 18 STUDY OF DHANBAD CITY: PW(Kg/MT)
SERIAL OF DAYS
PET
HDPE/LDPE
PVC
PP
PS
OTHER
TOTAL
DAY 1 1.068 33.64 0.76 6.366 3.232 5.726 50.792
DAY 2 0.9445 35.665 0.51 6.032 3.168 6.88 53.1995
DAY 3 0.65 36.604 0.45 4.72 2.722 4.856 50.002
DAY 4 0.606 36.15 0.367 6.847 2.974 5.004 51.948
DAY 5 0.552 35.058 0.756 4.286 3.336 6.09 50.078
DAY 6 0.518 29.42 0.47 4.826 3.286 3.9291 42.449
DAY 7 0.574 35.65 0.28 5.808 4.37 5.944 52.626
AVERAGE 0.7018 34.598 0.5133 5.555 3.2983 5.4899 50.16
In Dhanbad, Telipada & Matkudiya dumping yard has been selected as the study
area for this project. The study revealed that average total plastic waste
generation in dhanbad was about 50.16Kg/MT represented in Table 18. It has
been worked out from the survey data about 69% of total plastics waste
generation from HDPE/LDPE materials. The Total MSW generated in this city
was with an average of 150 MT/ Day. During the survey the minimum plastic
waste generation 35.98 Kg/MT and maximum of 55.75 Kg/MT.

25
TABLE: 19 STUDY OF LUDHIANA CITY: PW(Kg/MT)
SERIAL OF DAYS
PET
HDPE/LDPE
PVC
PP
PS
OTHER
TOTAL
DAY 0.56 34.96 1.36 9.52 1.12 3.76 51.28
DAY 2 0.16 45.68 1.36 10.16 0.24 5.6 63.2
DAY 3 1.04 60.4 0.52 17.52 1.6 4.4 85.48
DAY 4 1.2 43.12 1.28 9.44 1.92 4.48 61.44
DAY 5 0.32 32.56 4.48 9.12 0.32 7.12 53.92
DAY 6 0.00 28.72 0.56 9.76 0.72 2.64 42.4
AVERAGE 0.547 40.91 1.593 10.92 0.987 4.667 59.62 Total MSW that is generated in Ludhiana city was about 850 MT/Day, The data
revealed that average plastics waste generation was about 59.62Kg/MT. The
study indicate that 40.91Kg/MT (68.6%) plastics waste obtained from
HDPE/LDPE material, the data reported in table 19. Further, it is observed that
the minimum plastics waste of about 42.40 Kg/MT and a maximum of 85.48
Kg/MT.
The average total municipal solid waste generated is compared with the
percentage of average plastics municipal solid waste obtained in each city is
shown in Chart 1.

26
Northern Region Chart TMSW & PW
0
1000
2000
3000
4000
5000
6000
7000
8000
Luck
now
Allaha
bad
Chand
igarh
Delhi
Farida
bad
Jammu
Srinag
ar
Shimla
Amritsar
Dehrad
unAgra
Meerut
Varana
si
Kanpu
r
Patna
Ranch
i
Jamsh
edpu
r
Dhanb
ad
Ludh
iana
CITIES
TMSW
IN M
T/D
AY
0
2
4
6
8
10
12
14
PW IN
PER
CEN
TAG
E
TMSWPW
CHART 1: NORTHERN REGION TMSW GENERATION Vs PW GENERATION
4B. SOUTHERN REGION: comprises of Chennai, Bangalore, Coimbatore, Kochi, Madurai, Port Blair, Thiruvananthapuram, Puducherry, Kavarati, Hyderabad, Vijayawada, Vishakhapatnam.
TABLE: 20 STUDY OF CHENNAI CITY: PW (Kg/MT)
SERIAL OF DAYS
PET
HDPE/LDPE
PVC
PP
PS
OTHER
TOTAL
DAY 1 9.06 89.94 1.25 3.67 2.32 0.56 106.8
DAY 2 2.74 82.19 4.16 7.87 1.34 0.52 98.82
DAY 3 2.34 62.64 3.18 7.97 2.66 0.68 79.47
DAY 4 1.49 85.73 1.89 3.2 3.36 0.92 96.59 AVERAGE 3.9075 80.125 2.62 5.6775 2.42 0.67 95.42

27
In Chennai the assessment and quantification of plastics waste was conducted at
Perungudi and Kodungaiyur dump sites having the total MSW of about
4500MT/Day, and the plastics were assessed as with an average of 95.42
Kg/MT. The collected MSW is directly dumped without any post treatment
operation. The survey data is represented in table 20, which reveals around 84%
of HDPE/LDPE waste comprising of carry bags, milk pouches and packing films.
The data obtained with a minimum of 79.47Kg/MT and a maximum of
106.80Kg/MT.
TABLE: 21 STUDY OF BENGALURU CITY: PW(Kg/MT)
SERIAL OF DAYS
PET
HDPE/LDPE
PVC
PP
PS
OTHER
TOTAL
DAY 1 2.1 90.8 1 0.64 0.88 1.7 97.12
DAY 2 0.94 67.8 0.74 0.9 0.64 1.52 72.54
AVERAGE 1.52 79.3 0.87 0.77 0.76 1.61 84.83
Total MSW that are generated in Bangalore city was about 3700 MT/Day. The
survey was conducted at Mavallipura Dumpsite which has the average PW
generation of 84.83Kg/MT Shown in Table 21. Around 93% of total plastics waste
generated from HDPE/LDPE/LLDPE materials with the minimum plastic waste
generation of 72.54 Kg/MT and Maximum of 97.12 Kg/MT.
TABLE: 22 STUDY OF COIMBATORE CITY: PW (Kg/MT)
SERIAL OF DAYS
PET
HDPE/LDPE
PVC
PP
PS
OTHER
TOTAL
DAY 1 2.78 71.09 1.66 4.6 3.42 0.26 83.81
DAY 2 4.32 88.85 1.75 5.26 4.69 0.77 105.64
AVERAGE 3.55 79.97 1.705 4.93 4.055 0.515 94.73

28
The study has been conducted in vellalur dumpsite at Coimbatore city. The
segregated plastics are given in Table 22. The total MSW in the city was about
700 MT/ Day with an average PW of 94.73 Kg/MT. The PW was obtained with a
minimum of 83.18 Kg/MT and maximum of 105.64 Kg/MT.
TABLE: 23 STUDY OF KOCHI CITY: PW (Kg/MT)
SERIAL OF DAYS
PET
HDPE/LDPE
PVC
PP
PS
OTHER
TOTAL
DAY 1 11.62 40.65 0.77 3.99 1.28 0.54 58.85
DAY 2 12.22 45.42 2.29 1.19 3.79 1.99 66.9
AVERAGE 11.92 43.035 1.53 2.59 2.535 1.265 62.88
In Kochi, the assessment and quantification of plastics waste was conducted at
Brahmapuram dump sites having the total MSW of about 150MT/Day and the
plastics were assessed as with an average of 62.88 Kg/MT. The survey data is
represented in table 23, which reveals the majority of plastics are PET,
HDPE/LDPE. The PET is of about 18.9% comprising of water bottles and others
and HDPE/LDPE is of about 68.4% which comprises of carry bags, milk pouches
and Packing films. The data obtained with a minimum of 58.85 Kg/MT and a
maximum of 66.90 Kg/MT. The collected MSW was directly dumped without any
post treatment operation. During survey it has been observed that the plastics
are segregated by the rag pickers and separated, dumped in the dump yards
without any disposal system.

29
TABLE: 24 STUDY OF MADURAI CITY: PW (Kg/MT)
SERIAL
OF DAYS
PET
HDPE/LDPE
PVC
PP
PS
OTHER
TOTAL
DAY 1 1.44 40.71 4 2.49 3.9 0.24 52.78
DAY 2 1.00 35.82 3.04 4.5 2.68 1.36 48.4
AVERAGE 1.22 38.265 3.52 3.495 3.29 0.8 50.59
In Madurai, the total collection of MSW was about 450 MT/Day. The quantified
average plastics waste in madurai city was observed as 50.59 Kg/MT and
reported in table 24. About 75% of HDPE/LDPE was observed in total PW. The
data generated with a minimum plastics waste of about 48.40 Kg/MT and with a
maximum plastics waste generation of about 52.78 Kg/MT.
TABLE: 25 STUDY OF PORT BLAIR CITY: PW (Kg/MT)
SERIAL OF DAYS
PET
HDPE/LDPE
PVC
PP
PS
OTHER
TOTAL
DAY 1 17 73.44 9.54 0.38 0.25 0.15 100.76
AVERAGE 17 73.44 9.54 0.38 0.25 0.15 100.76
Total MSW that are generated in Port Blair city was about 45 MT/Day. The
survey was conducted at Brokshadbad Dumpsite which has the average PW
generation of 10.07 Kg/MT. The findings during the study are reported in Table
P25.The PW generated from HDPE/LDPE/LLDPE is about 73.44 Kg/MT (around
72.8%).

30
TABLE: 26 STUDY OF THIRUVANANTHAPURAM CITY: PW (Kg/MT)
SERIAL OF DAYS
PET
HDPE/LDPE
PVC
PP
PS
OTHER
TOTAL
DAY 1 1.86 49.67 0.62 4.11 1.37 1.52 59.15
DAY 2 4.53 35.79 2.79 4.71 1.23 12.23 61.28
AVERAGE 3.195 42.73 1.705 4.41 1.3 6.875 60.22
In Thiruvananthapuram, the assessment and quantification of plastics waste was
conducted at Vilappilsala dump sites having the total MSW of about 250 MT/Day,
and the plastics were assessed as with an average of 60.22 Kg/MT. The survey
data is represented in table 26, which revealed there the majority of plastics in
HDPE/LDPE which is about 71%. Comprising of carry bags, milk pouches and
Packing films. The data obtained with a minimum PW of 59.15 Kg/MT and a
maximum of 61.28 Kg/MT.
TABLE: 27 STUDY OF PUDUCHERRY CITY: PW(Kg/MT)
SERIAL OF DAYS
PET
HDPE/LDPE
PVC
PP
PS
OTHER
TOTAL
DAY 1 4.28 91.56 2.44 4.96 5.64 0.62 109.5
DAY 2 4 85.52 2.24 4.06 3.6 0.4 99.82
AVERAGE 4.14 88.54 2.34 4.51 4.62 0.51 104.66
In Puducherry, Karuvadikuppam dumping yard has been selected as the study
area for this project. The study revealed that average total Plastic waste
generation in Puducherry was about 104.66Kg/MT represented in Table 27. It
has been worked out from the survey data about 84.5% of total plastics waste is
generated from HDPE/LDPE materials. The Total MSW generated in this city
was with an average of 250 MT/ Day. During the survey the minimum plastic
waste generation 99.82 Kg/MT and maximum of 109.50 Kg/MT

31
TABLE: 28 STUDY OF KAVARATTI CITY : PW(Kg/MT)
SERIAL OF DAYS
PET
HDPE/LDPE
PVC
PP
PS
OTHER
TOTAL
DAY 1&2 23.5 74.75 4.5 18.83 1 0.417 123
DAY 3 20.13 77.63 5.625 14.87 0.475 0.125 118.85 AVERAGE 21.815 76.19 5.063 16.85 0.738 0.271 120.92
In Kavaratti , the survey was conducted at Common Depository Place which has
the average total MSW generation was around 24 MT/Day out of the average
PW was generated about 120.92 Kg/MT. The data which are classified according
to the codes of plastics, represented in the table 28. The data showed that the
HDPE/LDPE plastics having the code of 2 &4 has the majority of about
62.55%.The field study obtained with a minimum figure of average PW of 111.50
Kg/MT and a maximum of 139.50 Kg/MT. An incinerator of 50 Kg capacity
installed for burning of plastic waste, near to the dump site.
TABLE: 29 STUDY OF HYDERABAD CITY: PW(Kg/MT)
SERIAL OF DAYS
PET
HDPE/LDPE
PVC
PP
PS
OTHER
TOTAL
DAY 1 4.975 22.103 1.650 5.075 0 3.000 36.81
DAY 2 7.05 39.35 5.85 4.575 0 8.135 64.96
DAY 3 3.975 25.475 2.225 2.1 0 3.95 37.73
DAY 4 4.9 32.8 3.95 2.825 0 5.875 50.35
AVERAGE 5.225 29.932 3.4188 3.6438 0 5.24 47.46

32
In Hyderabad, the survey was conducted at Jawaharnagar dumpsite, which has
the average total MSW generation was around 4200 MT/Day out of the average
PW was generated about 47.46Kg/MT. The classified data for different types of
plastics waste are represented in Table 29. From the study data it has been
observed about 63.21% of PW was obtained from the recycling codes of 2 and 4
which is of HDPE/LDPE Material.
In Hyderabad, the MSW collected from various locations of city are transported to
Jawaharnagar dumpsite where 50 families of rag pickers are living nearby
dumpsite and segregating the PW and selling to the reprocessors.
TABLE: 30 STUDY OF VIJAYAWADA CITY: PW(Kg/MT)
SERIAL
OF DAYS
PET
HDPE/LDPE
PVC
PP
PS
OTHER
TOTAL
DAY 1 4.432 52.148 3.264 5.044 1.188 0.2 66.276
DAY 2 2.584 61.416 1.128 12.932 4.488 2.112 84.66
DAY 3 4.996 52.352 2.844 5.352 1.728 0.4 67.672 AVERAGE 4.004 55.305 2.412 7.776 2.468 0.904 72.87
In Vijayawada, the survey was conducted at Pathapadu Pit No.10, which has the
average total MSW generation was around 600 MT/Day out of the average PW
was generated about 72.87 Kg/MT. The classified data for different types of
plastics waste is represented in Table 30. From the study data it has been
worked that about 76% of PW was obtained from the recycling codes of 2 & 4
which is of HDPE/LDPE Material. The waste was collected at the transfer
stations located at sinshnagar , Where about 100 Nos. of Ragpickers picks
valuable plastics and then the MSW is dumped in the dump yard and about 20
vermiculture plants are there which uses wet waste. In addition to that a fuel gas
Plant (Bio-Gas) operated by M/S. Shivram Energy system Pvt. Ltd is present
near to the dumpsite which is currently not working.

33
TABLE: 31 STUDY OF VISHAKHAPATTNAM CITY:PW(Kg/MT)
SERIAL OF DAYS
PET
HDPE/LDPE
PVC
PP
PS
OTHER
TOTAL
DAY 1 2.32 69.52 2.368 14.32 2.288 0.896 91.712
DAY 2 3.08 74.768 2.08 15.28 3.656 0.56 99.424
DAY 3 1.536 71.84 1.12 10.48 0.64 0.744 86.36
DAY 4 6.584 66.144 0.432 7.48 3.192 0 83.832
AVERAGE 3.38 70.568 1.5 11.89 2.444 0.55 90.33
The study data on Kapuluppada dumping ground of Vishakapattnam generated
an average PW of about 90.33 Kg/MT. The data is shown in table 31; Out of
about 78% comprise HDPE/LDPE materials with a minimum plastics waste
generation 83.83 Kg/MT and with maximum of 99.42 Kg/MT. The Total MSW
generated in this city was with an average of 334 MT/ Day. Near by dumpsite
M/S. Marine Eco-Industries is operating, where they collect and treat the medical
waste. The average total municipal solid waste generated is compared with the
percentage of average plastics municipal solid waste obtained in each city is
shown in Chart 2.

34
Sourthern Region Chart TMSW & PW
0500
100015002000250030003500400045005000
Chenna
i
Banga
lore
Coimba
tore
Kochin
Madura
i
Port Blai
r
Tiruva
nanda
puram
Pondic
herry
Kavara
tti
Hydera
bad
Vijaya
wada
Vishak
apatt
nam
CITIES
TMSW
IN M
T/D
AY
0
2
4
6
8
10
12
14
PW IN
PER
CEN
TAG
E
TMSWPW
CHART 2: SOURTHERN REGION TMSW GENERATION Vs PW GENERATION
4C. Western Region: The cities selected to carry out assessment and
quantification of Plastics waste in the western region of the country are
Ahmedabad, Daman, Dwaraka, Gandhinagar, Mumbai, Nashik, Panjim, Pune,
Rajkot, Silvassa, Surat, Vadodara, & Jaipur

35
TABLE: 32 STUDY OF AHMEDABAD CITY: PW (Kg/MT)
SERIAL OF DAYS
PET
HDPE/LDPE
PVC
PP
PS
OTHER
TOTAL
DAY 1 1.344 82.752 1.648 9.792 0.496 0 96.032
DAY 2 0 102.08 0 3.712 8.32 0 114.112
AVERAGE 0.672 92.416 0.824 6.752 4.408 0 105.07
The field study in Ahmadabad was carried out in co-operation with Ahmedabad
Municipal Corporation (AMC) in the place of Pirana dump site where the total
MSW is dumped @ 2300 MT/Day. The survey reported an average PW of about
105.07 Kg/Tons, shown in Table 32 in which 92.416 Kg/MT (88%) belongs to
code of 2 and 4, i.e. HDPE/LDPE Plastics waste comprises of carry bags, milk
pouches, packing items etc. The study revealed that the average PW produced
with a minimum and maximum of 96.032 Kg/MT and 114.11 Kg/MT respectively.
During the study it is observed that Organic waste is treated separately to
manufacture organic fertilizer. Refused Derived Fuel –RDF is also manufactured
in nearby plant & supplies to local industries. GAS based power plant is also
situated at site which helps to reduce the total quantity of Municipal solid waste
generated. RDF plants nearer to the dumpsite which is operated by M/S. EXCEL
under contract. Composting is done to promote derivation of organic manure
from waste and to reduce the quantity of waste going to landfill site and also to
help agricultural production; Waste to RDF (Refuse Derived Fuel) Plant by UPL
DJAI Power Ltd. This RDF is used in Boiler for substitute for Coal, Lignite, Wood,
Oil etc.
36
TABLE: 33 STUDY OF DAMAN CITY: PW (Kg/MT)
SERIAL OF DAYS
PET
HDPE/LDPE
PVC
PP
PS
OTHER
TOTAL
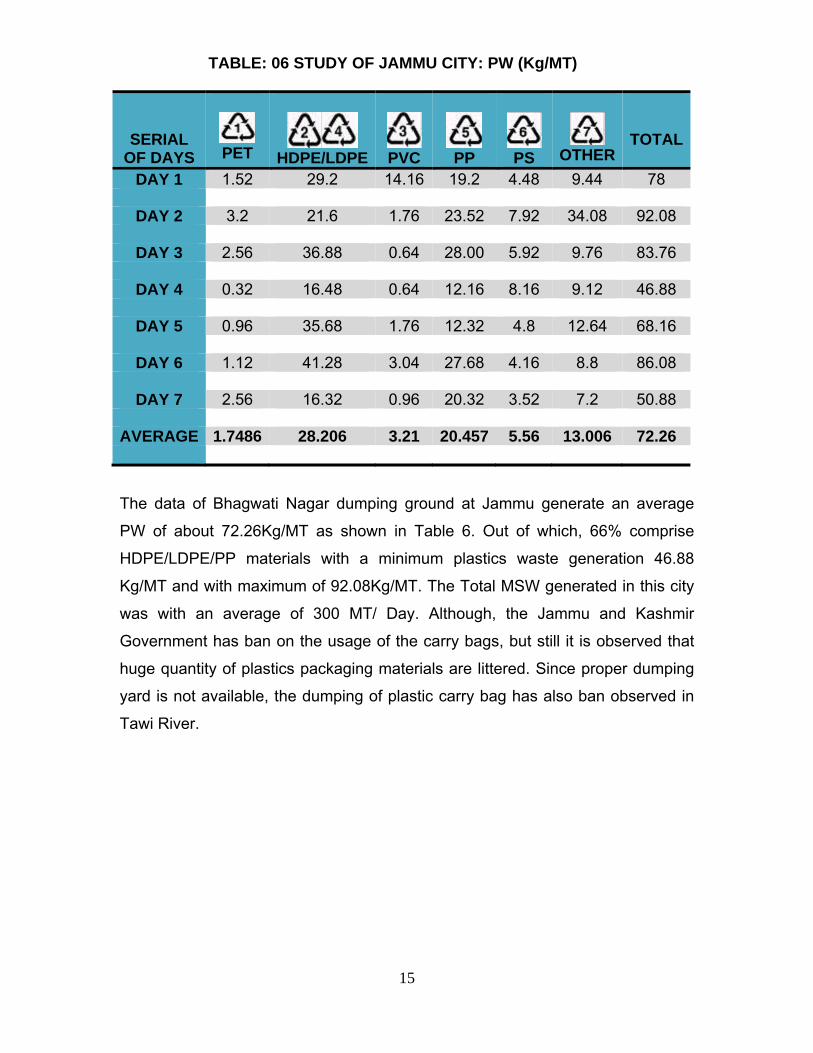
DAY 1 0 27.28 0.112 0 13.44 9.856 50.688
DAY 2 0.664 34.12 1.112 6.152 0.372 2.816 45.236
DAY 3 1.168 39.2 0 0.84 1.56 0.424 43.192
AVERAGE 0.611 33.53 0.408 2.331 5.124 4.365 46.37
In Daman, the field study on quantification of plastics waste was carried at the
back side of fort. The PW obtained during the survey was about 46.37 Kg/MT
where the TMSW generated @ 25 MT/Day the data’s shown in table 33.
It is observed during the study that the plastics waste littered more in the city and
only few number of collection points are available in the city and there is no
proper dumping ground available in the city, at present the TMSW generated in
the city are dumped at fort back side. The study reported that the HDPE/LDPE
plastics had more quantity of packing items which was about 75%.
TABLE: 34 STUDY OF DWARKA CITY:PW (Kg/MT)
SERIAL OF DAYS
PET
HDPE/LDPE
PVC
PP
PS
OTHER
TOTAL
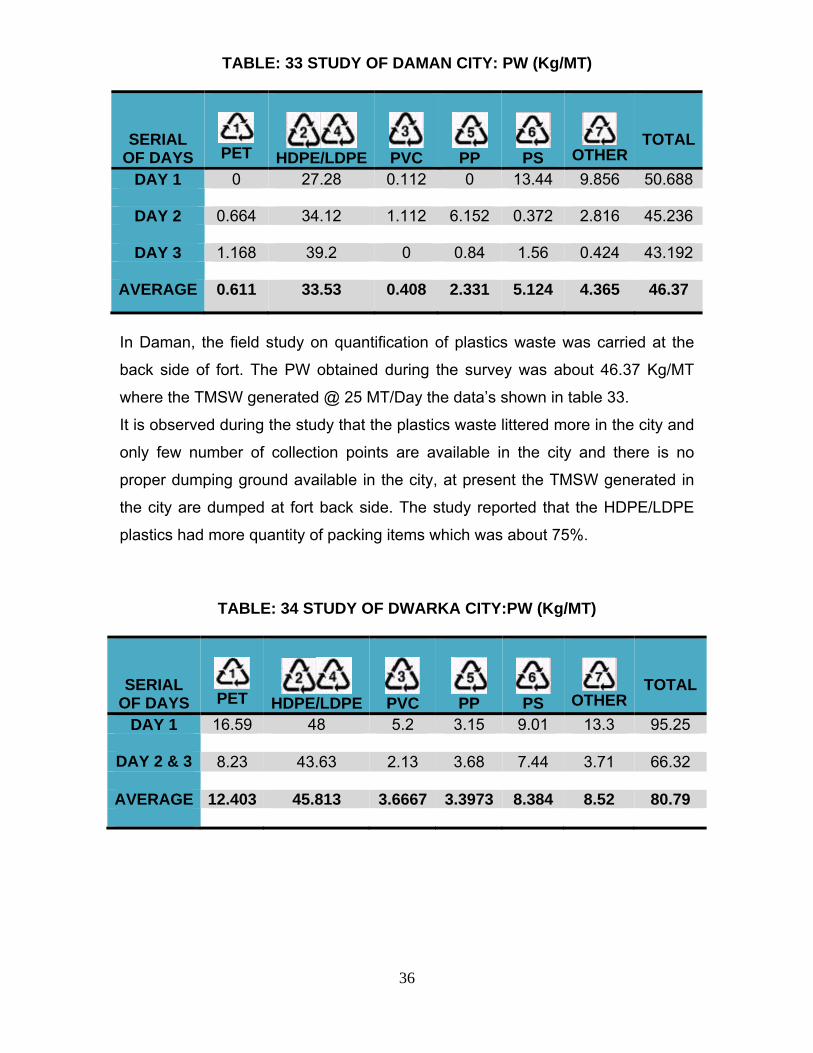
DAY 1 16.59 48 5.2 3.15 9.01 13.3 95.25
DAY 2 & 3 8.23 43.63 2.13 3.68 7.44 3.71 66.32 AVERAGE 12.403 45.813 3.6667 3.3973 8.384 8.52 80.79

37
In Dwarka, the study was carried out at Old Charakala Road (Vermi Plant
Compost) where the TMSW are dumped and they are used at vermin compost
plant. The Data obtained during the study are represented in Table 34. The Total
Municipal waste generated was about 18 MT/Day out of which the PW generated
was about 80.79 Kg/MT (8.07%). It is observed that lot of plastics films, carry
bags littered on the main roads, streets of the city.
TABLE: 35 STUDY OF GANDHINAGAR CITY: PW (Kg/MT)
SERIAL OF DAYS
PET
HDPE/LDPE
PVC
PP
PS
OTHER
TOTAL
DAY 1 0.76 55.34 1.802 3.02 4.16 0.12 65.20
DAY 2 0.87 35.21 0.68 0.506 0.331 0.91 38.50
DAY 3 0.675 24.51 0.35 1.05 13.54 0.35 40.48
AVERAGE 0.77 38.35 0.944 1.525 6.010 0.460 48.06
In Gandhinagar, the dumpsite located in Sector 28, Opp to Electronic Park City,
The average PW generated in Gandhinagar was about 48.06 Kg/MT. The MSW
of the Data obtained during the study is represented in Table 35. The Total
Municipal waste generated was about 97 MT/Day. The data obtained with the
minimum PW of about 28.14Kg/MT and the maximum PW of about 65.20 Kg/MT.
The field study report shows that, the MSW is directly dumped in the dumping
yard without any post treatment operations. The maximum PW obtained as
HDPE/LDPE waste like Carry bags, Packing Pouches etc.

38
TABLE: 36 STUDY OF MUMBAI CITY: PW (Kg/MT)
SERIAL
OF DAYS
PET
HDPE/LDPE
PVC
PP
PS
OTHER
TOTAL
DAY 1 6.234 37.65 2.32 9.984 0.832 4.548 61.57
DAY 2 3.45 54.34 3.23 5.78 2.63 4.72 74.15
DAY 3 2.79 69.39 0.79 1.49 2.17 2.24 78.89
DAY 4 3.17 30.31 1.425 0.61 0.235 0.43 36.18
DAY 5 2.68 28.08 3.324 2.816 4.88 13.01 54.8
DAY 6 2.776 60.17 2.252 1.328 1.82 2.94 71.29
AVERAGE 3.517 46.6517 2.224 3.668 2.095 4.648 62.813
The field study in Mumbai was carried out in two dumpsite located at Mulund and
Deoner. The MSW Collected at Deoner Dumpsite was three times more than
than Mulund Dumpsite. The Average PW studied at the both dumpsites is
reported in the Table 36. The Total Municipal solid waste collected at both the
dumpsites was about 6500 MT/Day. The average PW generated was about
62.81 Kg/MT. The dumpsite was observed with huge nos. of Rag pickers who
collects the valuable plastics waste like Polybags, PET Bottles, Sacks, Milk
Pouches, rubber & Foam slippers etc, and it’s observed that Metalized pouches
were not collected by rag pickers. TABLE: 37 STUDY OF NASIK CITY PW (Kg/MT)
SERIAL OF DAYS
PET
HDPE/LDPE
PVC
PP
PS
OTHER
TOTAL
DAY 1 1.108 47.00 0.648 5.244 2.396 0 56.39
DAY 2 & 3 1.349 50.25 0.355 4.24 3.77 0.075 60.04 AVERAGE 1.229 48.625 0.502 4.742 3.083 0.038 58.22

39
In Nasik, the survey was conducted at Patharadi, which has the average total
MSW generation was around 350 MT/Day out of the average PW was generated
about 58.22 Kg/MT. The classified data for different types of Plastics waste are
represented in Table 37. From the study data it has been worked that about
83.57% of PW was obtained from the recycling codes of 2 and 4 which is of
HDPE/LDPE Material.
In dumpsite of Nashik, the following post treatment plants are present (1) Inert
Processing unit (2) Bio Gas Plant unit (3) Pre sorting unit (4) Dead Animal
Incineration unit (5) Refused Derived Fuel unit (RDF) (6) Compost Manure Unit
(Finished product unit) the MSW collected from various location of city post
treated and corresponding outputs are produced.
TABLE: 38 STUDY OF PANJIM CITY PW (Kg/MT)
SERIAL OF DAYS
PET
HDPE/LDPE
PVC
PP
PS
OTHER
TOTAL
DAY 1 1.6 20.22 1.92 12.16 0.64 2.56 39.1
DAY 2 1.44 23.04 2.32 7.76 7.04 4 45.6
DAY 3 4.32 31.76 4.544 1.92 3.52 3.36 49.424
AVERAGE 2.453 25.01 2.928 7.28 3.733 3.31 44.71
In Panjim, the field study on quantification of plastics waste was carried at the
Animal welfare centre. The PW obtained during the survey was about 44.71
Kg/MT where the TMSW generated @ 25 MT/Day. The data obtained on the
segregated plastics are given in table 38. The majority of Plastics waste obtained
as Poly bags, Packaging plastics the average of about 55.9%.The average PW
resulted with a minimum of about 39.1Kg/MT and a Maximum of about 49.42
Kg/MT. In Panjim, the Bio-Compost Plants are present, almost all the municipal
solid waste generated in the city are treated after the completed segregated of
plastics and manure is produced as final product.

40
TABLE: 39 STUDY OF PUNE CITY PW (Kg/MT)
SERIAL OF DAYS
PET
HDPE/LDPE
PVC
PP
PS
OTHER
TOTAL
DAY 1 0.4 76.348 0.48 2.852 1.12 0 81.2
DAY 2 1 78.804 0 0.36 1.992 0 82.156
DAY 3 0.72 74.416 0.956 1.304 1.796 0.08 79.272
DAY 4 0 67.76 0 1.088 0.4 0 69.248 AVERAGE 0.530 74.332 0.359 1.404 1.327 0.020 77.969
In Pune, Fursangi Processing Plant, (Hanjar Bio-Tech Energy Ltd.) have been
selected as the study area for this project. The study revealed that average total
Plastic waste generation in Pune was about 77.96 Kg/MT represented in Table
39. It has been worked out from the survey data about 95% of total plastics
waste is generated from HDPE/LDPE materials. The Total MSW generated in
this city was with an average of 1300 MT/ Day. During the survey the Minimum
Plastic waste, generation is about 69.25 Kg/MT and Maximum of 91.09 Kg/MT.
Waste Collected from 85 wards of Pune city from various location are transferred
to 4 transfer stations located at different locations, Finally the MSW are
transported To Fursungi Processing Plant Operated by Hanjar Bio-Tech Energy
Ltd. supplied to vermi-compost plants-12 Nos. Currently, no dumping of waste is
done, all MSW are post treated, at Fursungi Processing Plant and produce
products like Plastics to Diesel, Plastics Recycled Granules, Sand, Refused
Derived Fuel, Compost Fertilizers.

41
TABLE: 40 STUDY OF RAJKOT CITY PW (Kg/MT)
SERIAL OF DAYS
PET
HDPE/LDPE
PVC
PP
PS
OTHER
TOTAL
DAY 1 8.1045 50.556 4.48 1.888 1.952 2.333 69.31
DAY 2 7.856 33.952 0.848 0.976 0.828 24.132 68.592
DAY 3 6.984 44.22 .332 0.664 3.66 9.076 69.936
AVERAGE 7.648 42.91 3.553 1.176 2.147 11.85 69.28
In Rajkot, the survey was conducted at 100 Ft Road & 80 Ft Road Dumpsites,
which has the average total MSW generation, was around 230 MT/Day out of the
average PW was generated about 69.28 Kg/Day. The data for different types of
Plastics waste are represented in Table 40. From the study data it has been
worked that about 62.06% of PW was obtained from the recycling codes of 2 & 4
which is of HDPE/LDPE Material. At dumpsite of Rajkot, the MSW collected from
various locations of city are transported to three different stations where PW is
segregated. The remaining MSW is finally transported to the dumpsite ground.
TABLE: 41 STUDY OF SILVASSA CITY PW (Kg/MT)
SERIAL OF DAYS
PET
HDPE/LDPE
PVC
PP
PS
OTHER
TOTAL
DAY 1 3.24 52.75 9.448 0.412 1.64 4.88 72.36
DAY 2 1.944 34.288 0.728 0.224 10.064 0.928 48.17
DAY 3 11.136 47.94 0 0 3.712 0 62.79
AVERAGE 5.440 44.993 3.392 0.212 5.139 1.936 61.107
In Silvassa, the field study on quantification of plastics waste was carried at the
khadoli Village. The PW obtained during the survey was about 61.12 Kg/MT

42
where the TMSW generated @ 35 MT/Day. The data obtained is reported in
table 41. There is no proper dumping ground available in the city, at present the
TMSW generated in the city collected zone wise and dumped at khadoli Village.
The study reported that the HDPE/LDPE plastics had more quantity of packing
items which was about 73.3%. The study data revealed that the average PW with
a minimum figure of 31.94 Kg/MT and maximum of 79.45 Kg/ MT.
TABLE: 42 STUDY OF SURAT CITY PW (Kg/MT)
SERIAL OF DAYS
PET
HDPE/LDPE
PVC
PP
PS
OTHER
TOTAL
DAY 1 0.887 131.67 1.524 0.678 1.622 2.3974 138.773
DAY 2 2.326 116.68 0.953 0.744 1.496 2.7288 124.920
DAY 3 0.561 105.07 0.246 0.628 1.066 2.798 110.3598
AVERAGE 1.258 117.8 0.908 0.683 1.397 2.644 124.68
In Surat, the survey was conducted at varachha and Anjana sites, which has the
average total MSW generation, was around 1200 MT/Day out of the average PW
was generated about 124.68Kg/MT (12.46%). The classified data for different
types of Plastics waste is represented in Table 42. From the study data it shows
that about 94.44% of PW was obtained from the recycling codes of 2 and 4 which
is of HDPE/LDPE Material. The Municipal Corporation has six different
transportation sites, where the MSW are collected from different zones and the
Plastics and foot wears are segregated before dumping in the dumping ground.
The Municipal Corporation has recruited rag pickers on each transportation site
for the segregation of value added plastics and other materials. As per
information received from Surat Municipal Corporation, the primary segregation
of Plastic waste is carried out by the waste collection and secondary segregation
is done at the transportation site. Finally the remaining MSW are dump at the
dumping ground.

43
TABLE: 43 STUDY OF VADODARA CITY PW (Kg/MT)
SERIAL OF DAYS
PET
HDPE/LDPE
PVC
PP
PS
OTHER
TOTAL
DAY 1 0 48.90 1.69 0.565 2.97 1.13 55.26
DAY 2 0.27 30.11 0.97 0.64 4.78 6.13 42.89
DAY 3 0.988 28.096 2.64 0.704 3.90 2.584 38.912
AVERAGE 0.42 35.70 1.76 0.64 3.883 3.280 45.69
The field study in Vadodara was carried out at Makarpura Tarsali Bye Pass NH.8
where the total MSW is dumped @ 600 MT/Day. The survey reported an average
PW of about 45.69 Kg/Tons, shown in Table 43 in which 36.65 Kg/MT (79%)
belongs to code of 2 and 4, i.e. HDPE/LDPE Plastics waste comprises of carry
bags, Milk Pouches, Packing items etc. The study revealed that the average PW
produced with a minimum and maximum of 33.22 Kg/MT and 67.57 Kg/MT
respectively.
TABLE: 44 STUDY OF JAIPUR CITY PW (Kg/MT)
SERIAL OF DAYS
PET
HDPE/LDPE
PVC
PP
PS
OTHER
TOTAL
DAY 1 3.349 31.83 6.043 9.56 9.26 11.75 71.79
DAY 2 0.89 37.11 0.320 7.632 3.059 8.552 57.56
DAY 3 0.440 19.00 0.357 3.827 2.045 9.555 35.226
DAY 4 0.699 15.49 1.059 4.280 0.683 5.091 27.307
DAY 5 4.600 16.259 3.765 16.288 3.579 14.109 58.600
DAY 6 1.560 16.083 7.309 15.133 2.240 8.755 51.080
AVERAGE 1.922 22.63 3.142 9.45 3.479 9.635 50.26

44
In Jaipur , the survey was conducted at Meena Transport Site which has the
average total MSW generation was around 310 MT/Day out of the average PW
was generated about 50.26 Kg/MT. The data which are classified according to
the codes of plastics, represented in the table 44. The data shows that the
HDPE/LDPE plastics having the code of 2 &4 has the majority of about 46%. The
field study obtained with a minimum figure of average PW of 17.68 Kg/MT and a
maximum of 79.78 Kg/MT. Scrap dealers collect the material of plastic which can
be recycled like LDPE, PP but the coloured PET bottles are left over in the
dumping site. It is observed that there is No post treatment Plant in Jaipur City.
The average total municipal solid waste generated is compared with the
percentage of average plastics municipal solid waste obtained in each city is
shown in Chart 3.
Western Region Chart TMSW & PW
0
1000
2000
3000
4000
5000
6000
7000
8000
Ahmed
abad
Daman
Dwaraka
Gandh
inaga
r
Mumba
i
Nashik
Panjim
PuneRajk
ot
Silvas
saSura
t
Vadod
araJa
ipur
CITIES
TMSW
IN M
T/D
AY
0
2
4
6
8
10
12
14
PW IN
PER
CEN
TAG
E
TMSWPW
CHART 3: WESTERN REGION
TMSW GENERATION Vs PW GENERATION 4D. In the EASTERN REGION of the country, the cities selected to carry out
assessment and quantification of Plastics waste are Asansol, Bhubaneswar,

45
Kolkata, Guwahati, Imphal, Gangtok, Aizwal, Itanagar, Kohima, Shillong and
Agartala.
TABLE: 45 STUDY OF ASANSOL CITY PW (Kg/MT)
SERIAL OF DAYS
PET
HDPE/LDPE
PVC
PP
PS
OTHER
TOTAL
DAY 1 7.451 34.98 4.032 7.124 6.8 2.952 63.34
DAY 2 2.712 36.66 11.675 3.491 3.738 2.52 60.80
DAY 3 3.954 33.87 5.544 2.52 4.99 5.28 56.16 AVERAGE 4.706 35.17 7.084 4.378 5.176 3.584 60.09
The Assessment and Quantification of plastics waste at Asansol was carried out
at Kalpahari, where the average TMSW generated at the rate of 210 MT/Day the
majority of plastics reported as HDPE, LDPE and PVC. Ethylene based plastics
obtained about 58.95%, Vinyl based plastics obtained about 12.5%. The total
average PW obtained about 60.09 Kg/MT with the Minimum average PW of
about 42.10 Kg/MT and Maximum of about 82.19 Kg/MT. The data obtained
during the survey are depicted in table 45. The solid waste management and
waste disposal has been put up effectively as a project by west Bengal state
government for the following five regions that includes Asansol and its adjoining
areas Raniganj, Durgapur, Asansol, Kulti and Tamulia. Each of these has their
own treatment plants where they segregate the biodegradable, non-
Biodegradable and recyclable waste.

46
TABLE: 46 STUDY OF BHUBANESWAR CITY PW (Kg/MT)
SERIAL OF DAYS
PET
HDPE/LDPE
PVC
PP
PS
OTHER
TOTAL
DAY 1 21.701 30.68 3.72 7.43 8.72 6.64 78.89
DAY 2 25.01 29.26 5.46 4.328 5.18 6.74 75.99
DAY 3 28.95 23.31 6.32 5.67 2.47 3.73 70.45
DAY 4 23.71 25.96 4.87 10.49 3.36 3.23 71.62
DAY 5 31.91 34.056 9.94 10.25 3.95 11.90 102.00
AVERAGE 26.26 28.65 6.061 7.64 4.74 6.45 79.79
The study data on bhuasuni dumping ground of Bhubaneswar generated an
average PW of about 79.79Kg/MT. Out of about 36% comprise HDPE/LDPE and
32.9% PET plastic waste with a minimum plastics waste generation 67.30 Kg/MT
and with maximum of 111.82 Kg/MT. The Total MSW generated in this city was
with an average of 400 MT/ Day. The generated data is shown in Table 46. In
Bhubaneswar the waste from the dumping ground is sent to ACC Cement kilns
for utilization of plastics as fuel in cement kilns. But the company is situated at
Bargadh i.e. about 500 km far from city. A parallel level of recycling unit is
operated in and around Malisahi Basti. It has been observed that hundred of
wholesale dealers, rag pickers and garbage lifters for sorting, segregating and
cleaning the waste for further recycling process.

47
TABLE: 47 STUDY OF KOLKATTA CITY PW (Kg/MT)
SERIAL OF DAYS
PET
HDPE/LDPE
PVC
PP
PS
OTHER
TOTAL
DAY 1 1.760 99.97 3.333 2.587 4.480 4.000 116.13
DAY 2 2.4 78.36 1.4 1.52 4.2 0.24 88.12
DAY 3 1.27 86.03 3.39 1.39 2.80 1.20 96.07
DAY 4 2.533 143.013 1.867 2.533 6.347 4.720 161.013
DAY 5 1.23 99.32 2.27 1.88 2.10 2.99 109.79
AVERAGE 1.797 102.98 2.526 2.015 3.97 2.8 116.09
In Kolkata, the assessment and quantification of plastics waste was conducted at
dump site located at Dhapa Check Post, Near Science City having the total MSW
of about 3670 MT/Day, and the plastics municipal solid waste were assessed as
with an average of 116.09 Kg/MT. The survey data is represented in table 47,
which reveals that the majority of plastics in HDPE/LDPE which is about 88.7%,
comprising of carry bags, milk pouches and Packing films. The data obtained
with a minimum PW of 78.40 Kg/MT and a maximum of 177.60 Kg/MT.

48
TABLE: 48 STUDY OF GUWAHATI CITY PW (Kg/MT)
SERIAL OF DAYS
PET
HDPE/LDPE
PVC
PP
PS
OTHER
TOTAL
DAY 1 8.8 29.28 0.808 6.48 1.4 1.2 47.97
DAY 2 3.392 29.52 0.00 1.64 3.208 2.32 40.08
DAY 3 10.88 22.13 2.48 1.68 1.52 6.33 45.02
DAY 4 13.84 32.04 1.12 1.6 6.64 1.02 56.26
DAY 5 6.392 34.14 2.18 2.98 4.12 2.34 52.15
DAY 6 7.102 39.59 3.02 4.13 3.18 2.96 59.98
DAY 7 7.392 34.12 0.00 2.8 4.102 2.62 51.034
AVERAGE 8.257 31.54 1.373 3.044 3.45 2.68 50.36
Total MSW that are generated in Guwahati city was about 204 MT/Day. The
survey was conducted at Boragoan Dumpsite which has the average PW
generation of 50.36 Kg/MT. Around 62.6 % of total plastics waste is generated
from HDPE/LDPE/LLDPE. The average PW obtained with the Minimum of 40.08
Kg/MT and Maximum of 59.98 Kg/MT. The classified average PW is given in
Table 48. In Borogaon dumpsite extreme segregation is done and plastics are
taken out from the municipal solid waste by the rag pickers. The plastics like PET
bottles, HDPE containers, bottle closures, PP disposable items , CD’s, packaging
plastics usually of thickness more than 40 microns are picked up, cleaned and in
bulk is sold to scrap dealers. More concern is about metalized plastics which are
not picked up and can be seen all round the dumpsites. The Assam Gas Cracker
Project is going to come up 2011-2012. Due to this many downstream plastics
industries are expected to come up. In Guwahati CIPET PWMC is working in full
swing with the vision to give complete solution for the disposal of waste plastics.
Other concerns like M/S. Jagriti industries are also working towards recycling of

49
plastics waste. In Guwahati a compost manufacturing plant is also erected at the
dumpsite.
TABLE: 49 STUDY OF IMPHAL CITY PW (Kg/MT)
SERIAL OF DAYS
PET
HDPE/LDPE
PVC
PP
PS
OTHER
TOTAL
DAY 1 10.85 33.13 1 3.37 7.21 2.94 58.5
DAY 2 10 30.79 0.9 5.445 1.2 0.67 49.005
DAY 3 11.67 25.36 2.33 2.28 1.02 2.34 45
DAY 4 14.34 29.96 1.32 1.4 4.39 1.38 52.79
AVERAGE 11.715 29.81 1.3875 3.1238 3.455 1.8325 51.32
In Imphal, the plastics assessment and quantification study was conducted at
Lamphel,. The finding reveals that total MSW was about 120 MT/Day. The PW
was observed as 51.32 Kg/MT out of the majority of Plastics waste found as
carry bags and packaging pouches which is of 58.45% belong to the
HDPE/LDPE material. The field study reveals that the Minimum Plastic waste
generation 45.00 Kg/MT and Maximum of 58.50 Kg/MT. The study data on
quantification of plastics waste is reported in Table 49. The contribution of
plastics waste towards the total solid waste generated is no more negligible. Any
programme like awareness programme regarding recycling and environment can
go a long way in sustaining the presence of plastics in this beautiful region.

50
TABLE: 50 STUDY OF GANGTOK CITY PW (Kg/MT)
SERIAL OF DAYS
PET
HDPE/LDPE
PVC
PP
PS
OTHER
TOTAL
DAY 1 19.925 16.68 7.06 24.66 5.56 4.54 78.42
DAY 2 19.43 26.08 9.945 28.00 4.00 7.115 94.56
DAY 3 16.00 29.45 11.5 26.67 6.50 8.12 98.25
DAY 4 21.00 22.23 8.00 26.00 4.555 5.005 86.79
AVERAGE 19.09 23.61 9.126 26.33 5.154 6.195 89.51
The MSW generated in Gangtok was about 26 MT/Day. The study data on Lower
Martham dumping ground of Gangtok generated an average PW of about 89.51
Kg/MT. Out of about 26.33% comprise PP waste consisting of Wheel covers,
Woven Sacks, Electrical Items Covers, Box Container Disposable Cups, 23.61%
of HDPE/LDPE waste consists of Polybags, Packing Items etc, 19.09% of PET
Bottles. The survey data resulted with a minimum plastics waste generation
78.43 Kg/MT and maximum of 98.25 Kg/MT. The data of the field study on
plastics quantification is shown in table 50. The Sikkim Government has banned
the carry bags but still it is observed that the quantities of plastics packaging
materials are littered in Gangtok. At Lower Martham Dumpsite, two types of
MSW waste is collected namely dry and wet waste. The extreme segregation is
done at the dumpsite and all types of plastics waste is sold to the scrap dealers
of Silliguri. Compost treatment plant is not in working condition nearer to
dumpsite.

51
TABLE: 51 STUDY OF AIZWAL CITY PW (Kg/MT)
SERIAL OF DAYS
PET
HDPE/LDPE
PVC
PP
PS
OTHER
TOTAL
DAY 1 20.025 15.02 5.085 26.06 6.27 7.115 79.575
DAY 2 15.025 17.11 11.575 15.21 10.27 9.615 78.805
DAY 3 15.52 14.52 8.59 18.56 9.92 9.695 76.805
DAY 4 10.025 22.52 5.085 28.575 8.77 7.745 82.72
AVERAGE 15.15 17.30 7.589 22.10 8.807 8.543 79.48
In Aizawal, the field survey was carried out at Tuirial dumping site, where the
dumping of average total MSW of about 107 MT/Day. The data reveals that
about 79.48 Kg/MT of PW was generated represented in table 51. However
21.6% plastics waste is generated from HDPE/LDPE materials consists of carry
bags, household Items & multilayer films, 19.04% plastics waste is generated
from PET. The minimum plastics waste generated of about 76.81 Kg/MT and
Maximum of about 82.72 Kg/ MT.
TABLE: 52 STUDY OF ITANAGAR CITY PW (Kg/MT)
SERIAL OF DAYS
PET
HDPE/LDPE
PVC
PP
PS
OTHER
TOTAL
DAY 1 14.02 30.2 0.27 3.11 4.39 2.16 54.15
DAY 2 12.89 30.27 1.02 3.12 3.96 1.02 52.28
DAY 3 11.86 33.06 0.96 2.06 5.12 1.06 54.12 AVERAGE 12.923 31.177 0.75 2.7633 4.49 1.4133 53.52
Karsengsa Place has been selected as study area. The average total Plastic
waste generation in Itanagar was found about 53.52 Kg/MT reported in Table 52.

52
Around 59.3% of total plastics waste is generated from HDPE/LDPE materials.
The Total MSW generated in this city was with an average of 102 MT/Day.
During the survey the minimum plastic waste generation 52.28 Kg/MT and
maximum of 54.15 Kg/MT.
TABLE: 53 STUDY OF KOHIMA CITY PW (Kg/MT)
SERIAL OF DAYS
PET
HDPE/LDPE
PVC
PP
PS
OTHER
TOTAL
DAY 1 10.5 30.24 0.67 2.5 4.5 10.65 59.06
DAY 2 9.23 32.3 2.5 3.08 0.39 2.5 50
DAY 3 10.75 21 0 12 2.09 1.83 47.67
DAY 4 6 27.7 2.3 1.4 2.76 3.62 43.78
AVERAGE 9.12 27.81 1.3675 4.745 2.435 4.65 50.13
The quantification of plastics waste carried out at Kohima Dumping ground, the
study revealed that average total plastic waste generation in Kohima was about
50.13 Kg/MT shown in Table 53. Around 55.4% of total plastics waste is
generated from HDPE/LDPE materials. The Total MSW generated in this city
was with an average of 45 MT/ Day. During the survey the minimum Plastic
waste generation 43.78 Kg/MT and Maximum of 59.06 Kg/MT.

53
TABLE: 54 STUDY OF SHILLONG CITY PW (Kg/MT)
SERIAL OF DAYS
PET
HDPE/LDPE
PVC
PP
PS
OTHER
TOTAL
DAY 1 11.87 31.1 0 2.2 8.14 3.1 56.41
DAY 2 9.97 33.3 0.98 1.1 5.2 2.01 52.56
DAY 3 14.66 29.53 1.92 2.12 4.02 2.52 54.77
DAY 4 8.23 33.12 3.11 2.33 4.98 1.93 53.7
AVERAGE 11.18 31.76 1.50 1.93 5.585 2.39 54.36
In Shillong, the assessment and quantification of plastics waste was conducted
at Borapani dump site having the total MSW of about 97 MT/Day, and the
plastics was assessed as with an average of 54.36 Kg/MT. The survey data is
represented in table 54, which shows that majority of plastics are PET,
HDPE/LDPE. The PET is of about 20.57% comprising of water bottles & Medical
bottles and HDPE/LDPE is of about 58.43% which comprises of carry bags, milk
pouches and Packing films. The data obtained with a minimum of 52.56 Kg/MT
and a maximum of 56.41 Kg/MT. The collected MSW was directly dumped
without any post treatment operation. During survey it is observed that the
plastics are segregated by the rag pickers and separated dumped in the dump
yards without any post operations.

54
TABLE: 55 STUDY OF AGARTALA CITY PW (Kg/MT)
SERIAL OF DAYS
PET
HDPE/LDPE
PVC
PP
PS
OTHER
TOTAL
DAY 1 3.915 40.5 1.91 1.91 1.165 6.05 55.45
DAY 2 0.00 60.55 0 0.55 3.50 1.8 66.4
DAY 3 2.72 43.96 0.72 .96 0.32 2.52 52.2
DAY 4 3.365 41.8 1.355 2.41 0.87 4.615 54.415
AVERAGE 2.5 46.703 0.995 1.701 1.46 3.75 57.13
In Agartala, the dumping site was selected for the plastics quantification field
survey, which is located Happania. The field study provided the data, which
represented an average PW of about 57.13 Kg/MT, where the total MSW
generated in the city is of about 102 MT/Day. The data of segregated plastics
waste is given in Table 55. The majority of plastics waste generated from
HDPE/LDPE and Unclassified plastics has 81.7% and 6.56% respectively.
Further it revealed from data, that the minimum quantity of plastics waste
generation is about 52.20 Kg/ MT and a maximum of about 66.40 Kg/MT. The
segregation of plastics waste is done at the dumpsite. Other degradable MSW is
utilized in compost plant which is installed at the dumpsites and operated by M/S.
Prayag group with municipal corporation Agartala. The segregated PW is sent to
Kolkata. The Agartala Municipal Corporation has provided bins of three colours
to many residential areas for collection of different types of waste, so that plastics
may be reduced at the dumpsite. As the people are not properly aware, the
practice of separation of degradable and Non-degradable is not practiced. Hence
some awareness programme may also help to resolve the issue of waste plastics
in Agartala.
The average total municipal solid waste generated is compared with the
percentage of average plastics municipal solid waste obtained in each city is
shown in Chart 4.

55
Eastern Region Chart TMSW & PW
0
500
1000
1500
2000
2500
3000
3500
4000
Asans
ol
Bhuba
neswar
Kolkata
Guwah
ati
Imph
al
Gangtok
Aizwal
Itana
gar
Kohim
a
Shilon
g
Agarta
la
CITIES
TMSW
IN M
T/D
AY
0
2
4
6
8
10
12
14
PW IN
PER
CEN
TAG
E
TMSWPW
CHART 4: EASTERN REGION MSW GENERATION Vs PW GENERATION
4E. In the CENTRAL REGION of the country, the cities selected to carry out
assessment and quantification of plastics waste are Bhopal, Jabalpur, Nagpur,
Raipur, Indore

56
TABLE: 56 STUDY OF BHOPAL CITY PW (Kg/MT)
SERIAL OF DAYS
PET
HDPE/LDPE
PVC
PP
PS
OTHER
TOTAL
DAY 1 0.68 39.07 2 14.4 1.12 0.52 57.79
DAY 2 0.416 45.872 0.68 16.832 0.2 1.04 65.04
DAY 3 0.072 32.008 1.384 32.624 0 0.76 66.848
DAY 4 0.144 61.944 4.048 12.68 2.04 0.712 81.568
DAY 5 0 41.76 3.632 11.72 1.24 0.12 58.472
AVERAGE 0.2624 45.131 2.3488 17.651 0.92 0.6304 65.94
In Bhopal, the average quantity of plastic waste has been assessed as 65.94
Kg/MT, which comprises of 68.44% of HDPE/LDPE, 26.76% of PP and 3.56% of
PVC material, described in Table 56. The field survey was carried out at Bhanpur
dumpsite where the TMSW dumped at the rate of 350 MT/Day. It has been
observed that no post-treatment operation for MSW is done in the city and 100%
of MSW is dumped as land-filling. The Bhopal Municipal Corporation and
MPPCB stabilized compact packer for the welfare of rag pickers. Approximately
250 Rag pickers collects the valuable plastics waste generated though out the
day.

57
TABLE: 57 STUDY OF JABALPUR CITY PW (Kg/MT)
SERIAL OF DAYS
PET
HDPE/LDPE
PVC
PP
PS
OTHER
TOTAL
DAY 1 0.304 44.23 2.88 10.88 1.72 1.34 61.35
DAY 2 0.1824 39.90 1.44 9.568 0.793 0.712 52.59
DAY 3 0.648 51.28 1.92 4.80 1.248 1.84 61.736
DAY 4 0.00 47.51 2.912 4.80 0.72 4.32 60.26
DAY 5 0.00 28.33 0.76 2.017 0.443 1.877 33.42
DAY 6 0.00 41.79 4.72 3.6 1.08 2.36 53.55
DAY 7 0.32 30.8 1.2 4.32 0.824 1.872 39.336
AVERAGE 0.207 40.55 2.261 5.713 0.975 2.045 51.75
In Jabalpur, the dumping site was selected for the plastics quantification field
survey, which is located at Rental. The field study provided the data, which
represented an average PW of about 51.75 Kg/MT, where the total MSW
generated in the city is of about 400 MT/Day. The data for segregated plastics
waste is given in Table 57. Further it revealed from the data, that the minimum
quantity of plastics waste generation is about 33.42 Kg/ MT and a maximum of
about 61.74 Kg/MT.

58
TABLE: 58 STUDY OF INDORE CITY PW (Kg/MT)
SERIAL OF DAYS
PET
HDPE/LDPE
PVC
PP
PS
OTHER
TOTAL
DAY 1 2.552 43.2 0.92 24.46 3.968 3.064 78.168
DAY 2 2.08 48.8 0.8 18.88 2.4 4.4 77.36
DAY 3 3.024 38.08 1.04 30.05 5.536 1.728 79.46
DAY 4 1.128 33.52 12.95 27.39 2.112 8.00 85.104
DAY 5 15.84 39.016 3.84 38.51 18.16 4.784 120.15
AVERAGE 4.924 40.52 3.91 27.86 6.44 4.39 88.05
In Indore, the field study on quantification of plastics waste was carried at
Devgudariya Trenching ground Nemavar road. The PW obtained during the
survey was about 88.05 Kg/MT where the TMSW generated @ 720 MT/Day.
The data obtained is resulted in table 58. There is no post treatment operations
are performed in indore city. The study reported that the HDPE/LDPE & PP
consumptions are more yields about 46.1% and 31.64% respectively. The study
data revealed that the average PW resulted with a minimum figure of 77.36
Kg/MT and maximum figure of 120.15 Kg/ MT.

59
TABLE: 59 STUDY OF NAGPUR CITY PW (Kg/MT)
SERIAL OF DAYS
PET
HDPE/LDPE
PVC
PP
PS
OTHER
TOTAL
DAY 1 6.272 53.96 1.00 8.464 7.152 0.616 77.46
DAY 2 4.80 52.16 2.64 9.56 4.24 0.472 73.87
DAY 3 0.00 66.00 1.456 5.28 3.20 0.96 76.89
DAY 4 1.632 43.2. 11.52 7.44 6.96 0.72 71.47
DAY 5 5.28 44.16 5.968 6.352 3.544 2.40 67.70
DAY 6 1.96 47.18 4.192 7.616 6.80 1.68 69.42
DAY 7 2.40 42.40 01.88 4.656 4.248 2.496 58.08
AVERAGE 3.19 49.87 4.09 7.05 5.16 1.33 70.70
In Nagpur, Municipal Corporation and State Pollution control Board jointly
stabilized composite fertilizer Plant which is operated by M/S. Hanjar Bio-Tech
Ltd. Further a plant operated by GIL for compacting the old municipal waste.The
quantification of plastics waste survey was conducted bhadewadi dumping yard
The Nagpur city collects the average MSW of about 650MT/Day, Out of that
70.70 Kg/MT was produced as average PW. The data resulted during the study
is given in Table 59. The data shows the minimum PW of about 58.08 Kg/ MT
and the maximum of about 77.46 Kg/MT.

60
TABLE: 60 STUDY OF RAIPUR CITY PW (Kg/MT)
SERIAL OF DAYS
PET
HDPE/LDPE
PVC
PP
PS
OTHER
TOTAL
DAY 1 1.496 106.1 4.624 34.8 6.328 2.97 156.3
DAY 2 1.728 88.384 7.104 46.8 8.048 1.04 153.1
DAY 3 1.264 123.8 2.152 22.84 4.608 4.91 159.56
DAY 4 2.52 45.68 3.768 25.9 2.744 1.112 81.73
DAY 5 2.04 22.93 0.528 51.78 3.904 0.184 81.37
DAY 6 2.04 19.31 0.68 17.31 4.56 2.45 46.34
DAY 7 1.376 14.26 2.776 37.01 5.66 2.98 64.06
AVERAGE 1.78 60.06 3.09 33.78 5.12 2.23 106.07
In Raipur, the plastics assessment and quantification study was conducted at
Sarona, Ring road No.1, near Kharun River, The findings revealed that the total
MSW was about 224 MT/Day. The PW was observed as 106.07 Kg/MT out of the
majority of plastics waste found as carry bags and packaging pouches which is of
56.62% belongs to the classification of HDPE/LDPE material. The field study
reveals that the minimum plastic waste generation is about 46.34 Kg/MT and
maximum of 159.56 Kg/MT. The study data on quantification of plastics waste is
reported in Table 60. The average total municipal solid waste generated is
compared with the percentage of average plastics municipal solid waste obtained
in each city is shown in Chart 5.

61
Central Region Chart TMSW & PW
0
100
200
300
400
500
600
700
800
Bhopal Jabalpur Nagpur Raipur Indore
CITIES
TMSW
IN M
T/D
AY
0
2
4
6
8
10
12
PW IN
PER
CEN
TAG
E
TMSWPW
CHART 5: CENTRAL REGION
TMSW GENERATION Vs PW GENERATION

62
CONSOL IDAT ED C HART OF TMSW & PMSW
0
1000
2000
3000
4000
5000
6000
7000
8000
Kav
aratti
Dwarak
a
Dam
an
Pan
jim
Gan
gtok
Jamsh
edpur
Silva
ssa
Port B
lair
Kohim
a
Shim
la
Mee
rut
Gan
dhinag
ar
Shilong
Itan
agar
Agartala
Aizwal
Imphal
Ran
chi
Koch
in
Dhan
bad
Guwah
ati
Asa
nso
l
Deh
radun
Patna
Raipur
Rajko
t
Tiruva
nan
dap
uram
Pondicherry
Chan
digarh
Jammu
Jaipur
Vishak
apattnam
Nas
hik
Bhopal
Allah
abad
Jabalpur
Bhuban
eswar
Mad
urai
Varan
asi
Agra
Srinag
ar
Amritsar
Vad
odara
Vijay
awad
a
Nag
pur
Coim
batore
Faridab
ad
Indore
Ludhiana
Surat
Luck
now
Pune
Kan
pur
Ban
galore
Ahmed
abad
Kolkata
Hyd
erab
ad
Chen
nai
Mumbai
Delhi
0
5
10
15
20
25
30
TMSW
PMSW
CONSOLIDATED CHART FOR TOTAL MSW and PW GENERATED AT 60 MAJOR CITIES OF INDIA
CHART 6: MSW GENERATION Vs PW GENERATION OF 60 CITIES

61
5. CURRENT INDIAN SCENARIO FOR COLLECTION, TRANSPORTATION AND DISPOSAL OF PLASTIC WASTE
The study observed that, the main practice used for waste collection is that the
municipal and hired vehicles operated in various zones of the city on daily basis to
collect the waste from the community bins. In this system, residents deposit their
waste into the nearest community bins located at street corners at specific intervals.
Waste generated in households is generally accumulated in small containers (often
plastic buckets) and then disposed of into community bins. The waste is loaded into
the vehicles from the community bins and finally, the waste is transferred to the
disposal site. Before unloading the waste that is collected from the community bin,
the vehicles were weighed on the weigh bridge located near the disposal site or in
other areas. The weighing exercise was carried out on major cities and the daily
waste quantity was computed and waste generation in kg/capital/day was calculated
based on the urban population.
HOUSE-TO-HOUSE COLLECTION SYSTEM House-to-house collection is system is adapted in few cities. In those cities that use
house-to-house collection the waste that are collected from houses, offices, small
shops and small markets. Here people are required to deposit their wastes in
communal containers/ community bins (stationary or haul types), from which it is
collected by municipal crews, handcarts and tricycles are used for waste collection
from individual houses at a specific time in the morning, when residents deposit the
stored waste into the handcarts. The waste in the handcarts is either transferred to
community bins or directly transferred to vehicles going to the disposal site. Few
cities like Kanpur, Ahmedabad, Hyderabad, Chennai, Surat, Nashik, Panjim,
Vijayawada, Vishakapattnam, Nagpur and Pondicherry has implemented house to
house collection system. This collection method will be promoted as an improvement
to the existing system in various cities and towns.

62
TRANSFER STATIONS SYSTEM The cities like Hyderabad, Thiruvananthapuram, Surat, Vadodara, Rajkot and Panjim
have established transfer stations systems. Transfer refers to the movement of
waste or materials from collection points to disposal sites. Transportation of waste
from collection point to disposal sites is carried out by using different types of
vehicles depending on the distances to be covered by them. Larger vehicles carry
the waste from the collection points to the disposal sites. Comparatively small
vehicles discharge waste at transfer stations where the wastes are loaded into larger
vehicles for transportation to the disposal sites. In metro cities transfer stations
located at different places to support intermediate transfer of waste from the
surrounding areas up to the dumping grounds. Transfer stations are centralized
facilities where waste is unloaded from smaller collection vehicles and re-loaded into
larger vehicles.
CHART 7: COLLECTION & TRANSPORTATION OF MSW CAN BE SCHEMATICALLY SHOWN AS
TREATMENT AND DISPOSAL There is no processing of waste being done in most of the cities. The entire waste,
which is collected, is taken for dumping to the disposal site. At present there is no
sanitary landfill site in most of the cities. The disposal is carried out following the
method of crude dumping where the waste is neither spread nor covered. In some
House to House Collection
Community Bins
Transportation Vehicles
Transfer stations
Disposal of waste to Dumpsite/Land Fill

63
areas the garbage waste is recklessly burnt in open dump yards placed on the main
highway road.
Land filling of mixed waste like non-biodegradable, inert waste and other waste that
are not suitable either for recycling or for biological processing is dumped together
with recyclable material. Waste processing facilities are not available with proper
capacity except few cities.
WASTES PROCESSING BY ENERGY RECOVERY OR COMPOSTING In Metro cities like Kanpur, Bangalore, Hyderabad, Ahmedabad and Kolkata, Solid
Waste processing plants established near the dump site to produce Refuse Derived
Fuels (RDF) plant ( Energy recovery) by some of the private agencies, which
involves the mechanical processing of household waste using screens, shredders
and separators to recover recyclable materials and to produce a combustible
product. This system involve the removal of inert and compostable materials
followed by pulverization to produce a feedstock which can be incinerated in power
stations, pyrolysis and gasification systems, co-incinerated in other industrial
combustion processes or fluidized bed plant. In cities like Delhi, Hyderabad, Pune
the vermi- composting practices has been adapted. Vermi-compost is the degraded
organic matter (cast or excreta) by worm activity, and the process of converting
organic fraction of the MSW into vermi-compost. The conversion of solid waste into
vermi-compost is done with Low cost solution
which improves the soil fertility, resulting in better agricultural yield in the region.
But plastics waste were found to be simply dumped in most of the dumpsites &
forming “Hill like” structures in Dump ground, which one may call as “Plastics Hill”.
On the positive note, most of these waste of Plastics Hill can be recycled provided
there is an organized, scientific Framework in the form of an “Industry” which not
only converts these waste into value added granules or products but also clears out
the “so-called” plastics explosion in cities.
RECYCLING OF PLASTIC WASTE- TYPES & AVAILABLE OPTIONS: The recycling of plastics is possible through different methods the polymers have
become increasingly multi-component through the use of multi-layers, laminates and
composites. Many polymers are rarely additive free, normally they contain additives,

64
formulates and modifiers such as fillers, pigments, antioxidants and flame-retardants,
hence it pose difficulties in processing.
Recycling is the process of transforming materials into secondary resources for
manufacturing mew products. The waste recycling leads to less utilization of raw
materials, saves on landfill space, reduces the amount of energy required to
manufacture new products.
The methodologies for recycling of plastics waste are classified as follows:
1. Primary Recycling (Conversion of waste plastics into products having
performance level comparable to that of original products made from virgin
plastics).
2. Secondary Recycling (Conversion of waste plastics into products having less
demanding performance requirements than the original material).
3. Tertiary Recycling (The process for producing chemicals/fuels/ Similar
Products from waste plastics).
4. Quaternary Recycling (The process for recovering energy from waste plastics
by incineration).
1. Mechanical Recycling Mechanical recycling involves processing of waste into a product which
characteristics similar to those of original product. This process involves the
following steps.
1. Collection and Segregation:
The plastics materials has varying density, hence they are
segregated/separated by floatation process.
2. Cleaning and Drying:
The post consumer plastics waste requires proper cleaning and drying.
3. Sizing :
The cleaned plastics waste products should be sized; the dried flakes are fed
into an extruder where they are heated to melting state and forced through the
die converting into a continuous polymer product or strands.
4. Pelletizing :
The strands are cooled by water and cut into pellets, which produces
reprocess granules.

65
5. Fabrication into end product :
Reprocessed granules used as raw materials for producing end products.
CHART 8: FLOW CHART FOR MECHANICAL RECYCLING
1. Chemical Recycling Chemical or Feed stock recycling is a process, in which a plastic or polymer is
broken down into its basic components/constituents i.e. Monomer. This process is
called depolymerization. The monomers may be used as raw materials for
manufacturing a new polymer. The types of Chemical recycling processes are,
Pyrolysis This technology is used for Extracting Fuel from the Non-Recyclable
plastics. Pyrolysis is the chemical decomposition of condensed substances that
occurs spontaneously at high enough temperatures.
Pyrolysis is a special case of thermolysis and is most commonly used for organic
materials, being then one of the processes involved in charring. The pyrolysis of
wood, which starts at 200-300 °C (390-570 °F), occurs for example in fires or when
Virgin Material
Processing Machine Product Good
Product
Processing Waste Rejects
Rechip
Recompound Extrude
Cooling
Regular Granules

66
vegetation comes into contact with lava in volcanic eruptions. In general, pyrolysis of
organic substances produces gas and liquid products and leaves a solid residue
richer in carbon content. Extreme pyrolysis, which leaves mostly carbon as the
residue, is called carbonization.
Pyrolysis differs from other high-temperature processes like combustion and
hydrolysis in that it does not involve reactions with oxygen, water, or any other
reagents. However, the term has also been applied to the decomposition of organic
material in the presence of superheated water or steam (hydrous pyrolysis), for
example in the steam cracking of oil.
Anhydrous pyrolysis can also be used to produce liquid fuel similar to diesel from
plastic and rubber waste.
Pyrolysis is a process of thermal degradation in the absence of oxygen.
Plastic/Rubber waste is treated in a cylindrical chamber at temperature of 370 °- 420
°C. Specially developed Catalyst gently cracks the Polymer and converts plastics/
Rubber into Gas. Majority of gas gets condensed into Fuel and no condensed gas is
either stored or re-used for Heating.
The essential steps in the Pyrolysis process involves:
• Elimination of Moisture by Pre-drying the material
• Indirect heating the plastic / Rubber with gradual increase in temperature.
• Converting the plastics/Rubber to gas with the help of catalytic converter.
• Careful condensation and Fractionation of pyrolysis vapours to produce
fuel.
Input Material
Mixed Plastic Scrap in any form /Rigid/Film
Carry bags (even less than 20 microns) / oven sacks
Mono /Multilayer pouches and sachets
PU Foam /EPS/FRP
All kinds of Rubber Waste
Tyre scrap from Bi-cycles to Heavy Vehicles
Cable husk / Carpets / Shoe soles etc…

67
Output Material Fuel Oil
Carbon Black Ash (option to convert into activated Carbon)
INPUT
OUTPUT PLASTICS RUBBERS
Light oil 60-65% 40-45%
Heavy oil 10-15% 10-15%
Gas 20% 20%
Ash content 5% 25%
TABLE: B PERCENTAGE OF INPUT AND OUTPUTS
Product and its application: Furnace Oil also known as Fuel Oil or Bunker Oil. It is an industrial fuel used in
generation of electricity and heat in many manufacturing units. It is majorly used in
Power, Fertilizer and Steel manufacturing units in India. It is traded on major
commodity exchanger
Hydrogenation: An important method of chemical recycling is hydrolysis. The breaking down of
plastics into their constituent raw materials by hydrolysis is of course, possible if
the plastic contains that groups which can be hydrolyzed. Since hydrolysis is the
reverse of condensation, it is clear that plastics which can be hydrolyzed are all
those made by condensation. Whether hydrolysis is practical or not is solely a
question for the reaction conditions.
The polycondensation products which also include plastics produced by
polyaddition, encompass such as polyamides, polyesters, polycarbonates,
polyureas and polyurethanes. Hydrolysis involves the specific reaction of the water
molecule at the point of linkage with the starting materials (this is the reverse of the
reaction that produced the polymer originally), so that the starting materials used

68
originally are recovered directly. The groups of plastics mentioned above as being
hydrolysable are all resistant to hydrolysis under normal conditions use. Hydrolysis
must be induced under extreme conditions.Moreover, hydrogenation promotes the
removal of hetro atoms, such as Chlorine (Cl), Nitrogen (N), Sulphur (S) in the form
of volatile compounds.
Gasification: Gasification is a recycling method where plastics are processed into gases such as
carbon monoxide (CO), Hydrogen (H2) and Hydrogen chloride. These gases are
then used as the chemical raw material for the production of chemicals such as
methanol and ammonia. Almost all types of plastics, including those containing
chlorine can be recycled under the gasification method. However, the profitability of
a gasification process largely depends on the value and application of synthesis gas.
The gases can be used for synthesis of various chemicals such as methanol,
ammonia or acetic acid.
3. Incineration Incineration is the term used for the combustion and reduction to an inert residue
of any combustible waste. Incineration can be used as a means of plastic waste
disposal and incinerators may be used to produce steam for domestic heating and
the generation of electricity. In the incinerator the combustion takes place at high
temperature (around 7000°C) in the presence of the requisite amount of oxygen.
Since the plastics present in waste consists mainly of carbon and hydrogen, the
product obtained after combustion should consist mainly of carbon dioxide and
water.
Incineration is not usually favored as a method of disposal because of very high
capital, maintenance and operating costs, unreliability and adverse
environmental impact. Problems are added when incineration is combined with
generation of steam and the output to be controlled to suit customer demand.
PVC has received considerable criticism since HCI gas is evolved on combustion for
long term use, the incineration may be a favored and economical method to dispose
of all the plastics exclusive of PVC from the incinerator to safeguard it from the

69
problems associated with evolution of HCI, the other plastics could be readily utilized
as high energy fuel, because they have considerably high caloric value.
UTILIZATION OF PLASTICS WASTE IN DIFFERENT FIELDS A. Road Construction
The plastic waste (Bags, Cups, Thermocloe) made out of PE, PP, & PS are
separated, cleaned and shredded into small pieces by passing through 4.35mm
sieve. The aggregate (granite) is heated to 170 C in the mini hot mix plant and
shredded plastic waste is added, it’s get softened and coated over the aggregate.
Immediately the hot bitumen of 160 C is added and mixed well. As the polymer and
the bitumen are in the molten state they get mixed and the blend is formed at the
surface of the aggregate. The mixture is transferred to the road for laying.
Steps for Road construction
Wet Process Blending of plastic waste by direct mixing of shredded polymer with hot bitumen at
160◦C. Mixing of higher percentage of polymer is difficult, because of difference in
viscosities of molten polymer and bitumen. Powerful mechanical stirrer required for
effective mixing. Also required addition of stabilizers and proper cooling
Dry Process Waste polymer is added on the hot aggregate (170◦C).The polymer gets coated over
the aggregate uniformly. The bitumen is added; mixing of bitumen with polymer
takes place at the surface of the aggregate around 155-163◦C. With the increase in
surface area of contact, mixing of polymer with bitumen is better. Hence, blend with
better binding property is formed.
Collection Cleaning Shredding
Mixing of Shredded waste with aggregate (Granite)
Addition of aggregate with bitumen
Transferred to the road for laying

70
B. Cement Kilns The recycling of plastics waste for recovery of energy is the use of plastics waste as
an alternative to fusible fuel in Cement Kilns. Any material having calorific value of at
least 2,500 kcals are accepted as an alternative fuel in cement kilns, provided it is
available at a cost less than the normal fossil fuel: plastics waste, which have quite
high calorific values, offer a viable alternative fuel. As Cement Kilns are operated at
a very high temperature in the range of 1500°C or more. Use of plastics Waste in
Cement Kilns of generation of any toxic emission due to the burning of plastics
waste. In fact, Cement Kilns can be utilized for burning of some hazardous waste
and for recovering precious energy out of it for production of cement. Energy
Recovery depends on the types of plastics waste and the relative ease / difficulty in
total or partial segregation from other plastics and / or other waste materials.
Mechanical recycling includes a wide variety of processing techniques and a broad
range of processing methods. Pure grade production scrap may only have to be
reground and reprocessed, mixed plastics have to be mechanically separated and, if
contaminated, also adequately washed and cleaned. All these steps increase the
cost depending on the degree of contamination. After collection of the portions that
can be recycled by mechanical recycling, there remain numerous very small, heavily
contaminated articles, multi layered composites or cross-linked products, which are
mostly unattended and are allowed to remain in the waste stream causing solid
waste problem. The best way of reutilizing these portions is to properly incinerate
them instead of dumping them diffusely on landfills. This recovers their calorific
values and at the same time disposes of the waste without causing any
environmental hazards. The unattended plastics waste in the Municipal solid waste
stream through co-processing in Cement Kilns (Energy Recovery) using in Blast
Furnaces and conversion of all types of mixed plastics waste into Industrial Fuel.
6. FINDINGS ON RECYCLABLE & NON RECYCLABLE CONTENTS: The present study on Assessment and quantification of plastics waste generation in
MSW in 60 major cities of India suggests that out of total plastics Waste,
thermoplastics content is about 94% ( RECYCLABLE) and rest 06% belong to family

71
of others including thermoset plastics ( Non-Recyclable) The consolidated details of
classification of different constituents of plastics waste are tabled below:
TABLE: C Consolidated PERCENTAGE OF CLASSIFIED PLASTICS WASTE
S.NO CODES DESCRIPTION TOTAL
PERCENTAGE OBTAINED
1 PET 8.66
2 HDPE/LDPE 66.91
3 PVC 4.14
4 PP 9.9
5 PS 4.77
6 OTHERS 6.43
The above data reveals that the Polyethylene Terephthalate (PET) corresponds to
the identification code “1” is about 8.66% (5.69 Kg/MT), High density
Polyethylene/Low density Polyethylene (HDPE/LDPE) Corresponds to the
identification code “2 & 4” is about 66.91% (43.94Kg/MT), Polyvinyl Chloride (PVC)
Corresponds to the identification code “3” is about 4.14% (2.72 Kg/MT),
Polypropylene (PP) corresponds to the identification code “5” is about 9.90%
(6.50Kg/MT), Polystyrene (PS) Corresponds to the identification code “6” is about
4.77% (3.13 Kg/MT) and other unclassified plastics/ Non-Recycling plastics/ Rubbers
etc having the identification code “7” obtained about 6.43% (4.22 Kg/MT).

72
CHART 9: PERCENTAGE OF CLASSIFIED PLASTICS WASTE
The data indicates that the majority of the plastics waste (PW) obtained about 66%
generated by HDPE/LPDE materials which is of mixed plastic wastes like Polybags,
Multilayer pouches used for packing food items, Ghutkas etc. The households are
the biggest source of plastics waste.
The mechanical recycling requires extensive sorting is necessary to separate the
packaging waste and the isolation of pure plastics was found to be too difficult.
The containers, films and other oversized items which consist of Polyethylene,
Polypropylene and Polystyrene can undergo mechanical recycling. But the mixed
plastics, any blended material or other multilayer films should be prepared for
chemical or feedstock recycling. In the chemical recycling process, contamination
and heterogeneity are not a problem. The multilayer components which consists of
2-3 layers of different plastics, will find difficult on the mechanical recycling. Hence
the monomer recovery makes logistics and economic sense for the multilayer
pouches which are littered in more quantity and keep piling up on garbage leads
unhygienic condition. It is also observed that these multilayer/ Metalized pouched are
not lifted by the rag pickers, because collecting them is not profitable and non-
recyclable hence thrown/dumped in the dumpsite.
7. ANALYSIS OF SAMPLES GARBAGE SAMPLING AND ANALYSIS The chemical and physical characteristics of garbage were analyzed for confirming
the plastics waste materials. The samples were collected from the fresh MSW of
dump ground analyzed by using Differential Scanning Calorimeter (DSC) make of
Perkin Elmer. The samples are tested as per ASTM D: 3417, the temperature rise of
20° C/ min with the supply of nitrogen is maintained. The results obtained are
depicted in (Figure -3A, 3B, 3C, 3D, 3E) The other plastic waste consist of
thermoplastics like Poly Carbonate (PC), Poly urethane (PU), Nylon and thermosets

73
like Melamine formaldehyde (MF), Phenolics (PF) or (phenol formaldehydes), Urea-
formaldehyde (UF) , Fibre reinforced plastics (FRP) which are not recyclable.
FIGURE 3A: ANALYSIS GRAPH: MAHAK SILVER GUTHKA
FIGURE 3B: ANALYSIS GRAPH: X-RAY STERILISATION BAG

74
FIGURE 3C: ANALYSIS GRAPH: DERMI COOL POWDER

75
FIGURE 3D: ANALYSIS GRAPH: ANCHOR TOOTH PASTE
FIGURE 3E: ANALYSIS GRAPH: SUN FEAST PACK

76
PLASTICS WASTE ASSESSMENT AT THIRUVANANTHAPURAM
PLASTICS WASTE ASSESSMENT AT PUDUCHERRY
PLASTICS WASTE ASSESSMENT AT HYDERABAD
8. CONCLUSION & RECOMMENDATIONS: Based on the field study by CIPET
& CPCB team at 60 cities, plastics waste (PW) content –Minimum &
Maximum % during different weekdays. Also,an average value of PW content
% has been worked out, taking into consideration the consolidated data of all
week days of the study in different cities. The final summary of data is
tabulated as follows:

77
S. No.
Name of City Total Municipal Solid Waste
(Tonnes per day)
Plastic Waste
(Percentage of Municipal Solid
Waste)
Plastic Waste
(Tonnes per day)
2010-11 2010-11 2010-11
1. Kavaratti 2 12.09 0.24
2. Dwarka 18 8.08 1.45
3. Daman 25 4.64 1.16
4. Panjim 25 4.47 1.12
5. Gangtok 26 8.95 2.33
6. Jamshedpur 28 3.36 0.94
7. Silvassa 35 6.11 2.14
8. Port Blair 45 10.07 4.53
9. Kohima 45 5.01 2.26
10. Shimla 50 4.45 2.23
11. Meerut 52 6.42 3.34
12. Gandhinagar 97 4.81 4.66
13. Shillong 97 5.44 5.27
14. Itanagar 102 5.35 5.46
15. Agartala 102 5.71 5.83
16. Aizwal 107 7.95 8.50
17. Imphal 120 5.13 6.16
18. Ranchi 140 5.92 8.29
19. Kochi 150 6.29 9.43
20. Dhanbad 150 5.02 7.52
21. Guwahati 204 5.04 10.27
22. Asansol 210 6.01 12.62
23. Dehradun 220 6.67 14.66

78
24. Patna 220 5.73 12.60
25. Raipur 224 10.61 23.76
26. Rajkot 230 6.93 15.93
27. Thiruvanandapuram 250 6.02 15.06
28. Pondicherry 250 10.46 26.15
29. Chandigarh 264 3.10 8.18
30. Jammu 300 7.23 21.68
31. Jaipur 310 5.03 15.58
32. Vishakhapatnam 334 9.03 30.17
33. Nashik 350 5.82 20.38
34. Bhopal 350 6.59 23.08
35. Allahabad 350 5.39 18.86
36. Jabalpur 400 5.18 20.70
37. Bhubaneswar 400 7.98 31.92
38. Madurai 450 5.06 22.77
39. Varansi 450 5.76 25.92
40. Agra 520 7.86 40.89
41. Srinagar 550 5.12 28.14
42. Amritsar 550 4.44 24.42
43. Vadodara 600 4.57 27.41
44. Vijayawada 600 7.29 43.72
45. Nagpur 650 7.07 45.96
46. Coimbatore 700 9.47 66.31
47. Faridabad 700 11.29 79.03
48. Indore 720 8.81 63.40
49. Ludhiana 850 5.96 50.68

79
The total MSW generated in 60 cities was about 50592 MT/Day out of which the
average plastics Municipal solid waste generated was about 6.92 Kg/MT i.e. an
average of about 6.92% of Plastics municipal solid waste is generated. The number
of cities that ranges from 0-5%, 5-10% and more than 10% are listed in the following
Table D.
TABLE D: RANGE OF PW GENERTION
SR.NO DESCRIPTION NO.OF CITIES
1. 0-5% PW 09
2 5-10% PW 42
3 >10% PW 09
Study team is of the opinion that 20 cities where plastics waste (PW) content is more
than 7.5 %,( Delhi, Chennai, Bangalore, Kolkata, Ahmadabad, Pune, Surat, Indore,
50. Surat 1200 12.47 149.62
51. Lucknow 1200 5.90 70.84
52. Pune 1300 7.80 101.35
53. Kanpur 1600 6.67 106.66
54. Ahmedabad 2300 10.50 241.50
55. Kolkata 3670 11.60 425.72
56. Bangalore 3700 8.48 313.87
57. Hyderabad 4200 4.75 199.33
58. Chennai 4500 9.54 429.39
59. Mumbai 6500 6.28 408.27
60. Delhi 6800 10.14 689.52
Total MSW 50592
Average PW generation
6.92 3501.00

80
Faridabad, Coimbatore, Agra, Bhubaneswar, Visakhapatnam, Rajkot, Raipur,
Aizwal, Portblair, Gangtok, Kavarati, Dwarka) there is an urgent need to establish
Waste recycling or treatment centre adjacent /nearby dumpsites involving Municipal
Corporations & private recyclers in PPP mode.
As per the field study, it is assessed that majority of plastics waste content (about
66% ) belong to HDPE/LPDE or PP materials which are of mixed plastic waste like
Polybags, Multilayer pouches used for packing food items, etc. & their source is
mainly from households /residential localities, Apartments etc.
The mechanical recycling of these wastes is feasible provided extensive sorting &
separation, cleaning of waste are done effectively before putting into mechanical
recycling by which granules/pellets can be produced. The containers, films and other
oversized items which consist of Polyethylene, Polypropylene and Polystyrene can
also undergo mechanical recycling in a better manner. There are few Mechanical
recycling plant manufacturer in developed countries like Germany, Italy, France etc.
who claim to have developed expertise in converting multilayer packaging waste into
granules effectively.
It is recommended that to begin with, at least in 20 cities ( mentioned above, where
PW content is more than 7.5% ), municipality/civic authority should take the
responsibility for setting up mechanical waste recycling plant nearer to each
dumpsite and engage agencies or groups working in waste management including
rag pickers and ensure that open burning of plastic waste is not permitted. These 20
cities must have plastics Waste Management Cell (PWMC) to take initiative & act
upon to set up Mechanical Recycling Plant.

81
9. Suggested Action Plan & Guidelines for Plastic Waste Management: Plastic are non-biodegradable, synthetic polymers derived primarily from petro-fossil
feedstock and made-up of long chain hydrocarbons with additives and can be
moulded into finished products excluding compostable plastic or polymer confirming
IS/ISO 17088:2008. These polymers are broken in presence of suitable catalyst, into
monomers such as ethylene, propylene, vinyl, styrene and benzene. These
monomers are then chemically polymerised into different categories of plastics.
9.1 Categories of Plastics : The main category of plastics include :
A. Recyclable Plastics (Thermoplastics): PET, HDLE, LDPE, PP, PVC, PS etc.
B. Non-Recyclable Plastic (Thermoset & others): Multilayer & Laminated
plastics, PUF, Bakelite, Polycarbonate, Melamine, Nylon etc.
1) As per BIS Codification in Rule 8 (b) Plastic Waste (Management and
Handling) (Amendment) Rules, 2011, there are seven categories of plastics:
S.No. Symbol Scientific Name Used in
1.
Polyethylene Terephthalate
Water Bottles, PET Bottles etc.
2.
High Density Polyethylene
Milk/detergent Bags, Carry bags, Container etc.
3.
Polyvinyl Chloride Cables, Pipes, Floorings etc.
4.
Low Density Polyethylene
Carry bags, films
5. Polypropylene Medicine bottles, cereal liners, Packaging films etc.
6.
Polystyrene Foam Packaging, Tea cups, Ice cream cups etc.
7.
Others Thermoset plastics, Multilayer & Laminated Plastics, PUF Bakelite, Polycarbonate, Melamine, Nylon etc.

82
9.2 Usage of Plastic and Plastic Waste:
Plastic products have become an integral part in everybody’s daily life. Its production
crosses the 150 million tons per year globally and in India, approximately 8 Million
tonnes plastic products are consumed every year (2008). It has broad range of
application in films, wrapping materials, shopping and garbage bags, fluid
containers, clothing, toys, household and industrial products, and building materials.
Once plastic is discarded, and remain on landscape for several years. Mostly, plastic
waste are recyclable but, recycled products are more harmful to the environment as
thus contains additives and colours. The recycling of a virgin plastic material can be
done 2-3 times only, because after every recycling, the plastic material deteriorates
due to thermal pressure and its life span is reduced. Hence recycling is not a safer
and permanent solution for plastic waste disposal. It is estimated that approximately
70% of plastic packaging products are converted into plastic waste in a short span.
Approximately 5.0 million tons per annum (TPA) plastic waste is generated in
country, which amounts to 15342 tons per day (TPD).
9.3 Environmental issues on disposal of plastic waste :
Indiscriminate littering and unorganised recycling/reprocessing and non-
biodegradability of plastic water raises the several environmental issues, it include;
• Release of fugitive emissions during polymerization process.
• Release of harmful gases such as Carbon Monoxide, Formaldehyde etc.
during product manufacturing.
• Land become infertile due to indiscriminate plastic waste disposal.
• Release of toxic emissions such as Carbon Monoxide, Chlorine, Hydrochloric
Acid, Dioxin, Furans, Amines, Nitrides, Styrene, Benzene, 1,3 –butadiene,
CCl4 and Acetaldehyde on burning of plastics waste including polyvinyl
chloride (PVC)
• Leaching of toxic metals into underground water such as Lead and Cadmium
pigments due to indiscriminate dumping of plastic waste on land.
• Multilayer, metalised pouches and other thermoset plastic pose disposal
problems.

83
• Sub-standard plastic carry bags, thin packaging films etc. pose problem in
collection and recycling and reuse.
• Indiscriminate and littered plastic waste pose anaesthetic look and choke the
drain.
• Soiled and mixed plastics waste interferes its beneficial utilisation.
• Unsound of plastic waste and running of recycling industries in non-
conforming areas release fugitive emissions.
9.4 Technologies for Plastic Waste Management (PWM): It has been observed that disposal of plastic waste is a serious concern due to
improper collection and segregation system. However, a few technologies have
been developed to minimize its adverse effect on the environment. Currently
Worldwide accepted technology used for the plastic disposal in incineration,
though it is not preferred option in India because it releases toxic gases like
chlorinated dioxins and furans, raising several environmental issues. CPCB put
efforts to consolidate innovative technical options for safer disposal of plastic
waste these are described in the following paragraphs. It is worth to note that
before adopting any technology, it is necessary to the description of technologies
are mentioned below:
9.4.1 Utilisation of Plastic Waste in Road Construction:
(i) Description of road laying process;
The process of road laying using waste plastic is designed and the technique is
being implanted successfully for the construction of flexible roads at various
places in India. A brief description of the process mentioned in the Table 1.

84
Table 1: Protocol for description of road laying process
S.No. Description Executing Agency 1. Collection and segregation of plastic waste (Expect
chlorinated/brominated plastic waste) Municipal Corporation, Nagar Parishad & Nagar and Gram Panchayat
2. Transportation and storage of plastic waste Municipal Corporation, Nagar Parishad & Nagar and Gram Panchayat
3. Cleaning and sun drying of plastic waste Municipal Body or PWD 4. Shredding of plastic waste (2 to 4 MM size) Municipal Body or PWD 5. Heating of stone aggregate (160°c-170°c) Municipal Body or PWD 6. Adding of shredded plastic waste (5 to 10% w/w for 30
to 40 seconds) Municipal Body or PWD
7. Coated aggregate is mixed with hot bitumen (Temp. 155 °c to 163 °c)
Municipal Body or PWD
8. The mix-plastic aggregate bitumen mix (130-140 °c) The mix can be used for road laying
(ii) Advantages of polymer-Bitumen Roads:
• Stripping and pothole formation: Bitumen film is often stripped off the
aggregates because of the penetration of water, which results in pothole
formation. This is accelerated during the movement of vehicle. When polymer
is coated over aggregate, the coating reduces its affinity for water due to non-
wetting nature of the polymer and this resists the penetration of water. Hence
the penetration of water is reduced which resists stripping and hence no
pothole formation takes place on these roads.
• Leaching: Polymer will not leach out of the bitumen layer, even after laying
the road using waste plastics-bitumen aggregate mix.
• Effect of Bleeding: Waste polymer-bitumen blend shows higher softening
temperature. This increase will reduce the bleeding of bitumen during the
summers.
• Effect of Fly Ash: Roads made from plastic-bitumen mix inhibits leaching of
toxic compounds into soil.

85
9.4.2 Co-processing of plastic waste as Alternative Fuel and Raw Material (AFR) in cement kilns and power plants:
Co-processing refers to the use of waste materials in industry process such as
cement and power stations or any other large combustion plants. Co-processing
indicate substitution of primary fuel raw material by waste, recovering industry
and material from waste. Waste material such as plastic waste used for co-
processing are referred to as alternative fuels and raw material (AFR). Co-
processing of plastic waste offers advantages for cement industry as well as for
the Municipal Authorities responsible for waste management. In other hand,
cement producers or power plants can save fossil fuel and raw material
consumption, contributing more eco-efficient production. In addition, one of the
advantage recovery method used in existing facility, eliminating the need to
invest on other plastic waste practices and to secure land filling. The protocol for
Co-processing of plastic waste is given at Table 2.

86
Table 2 : Protocol for Co-processing of plastic waste
S.No. Item Description Action to be taken by
1. Collection of plastics waste
Concerned Municipal Authority should create a system for collection of plastics waste from dustbin/Dhallaos through Public Private Partnership (PPP) mode on any other feasible method.
Municipal Corporation, Nagar Nigam, Nagar Parishad & Cantonment Boards.
2. Segregation & Pre-processing of plastic waste
Collected plastic can be reprocessed/sorted for recyclable and non-recyclable. The Non-recyclable plastic waste will be transported to nearest cement kilns and power plant for co-processing by concerned Municipal Authority in consultation with concerned State Pollution Control Board (SPCB)/Pollution Control Board(PCC).
Municipal Corporation, Nagar Nigam, Nagar Parishad & Cantonment Boards.
3. Identification of cement factory
Mapping of cement kilns and power plant for accepting co-processing of plastic waste in same State or neighbouring State. An agreement shall be signed between Municipal Corporations and Cement kilns.
State Pollution Control Boards & Pollution Control Committees and Municipal Bodies
4. Modification for feeding plastic waste (PW) in cement kilns.
Cement industry/power plant to set-up storage facility, shredder, conveyor-belt, one hopper, one winch-machine and one double-flap damper.
Concerned Cement industries/power plant
5. Setting-up of laboratory for plastics waste analysis
Cement industry/power plant shall set-up a minimum lab facility to analyses plastics waste before sending for co-processing. The instrumentation include Thermo-Gravimetric Analyser, Bomb-Calorimeter and C, H, N & S analyser.
Concerned Cement industries/power plant
6. Monitoring of emission by cement industry/SPCBs
Cement industry/power plant shall monitor the stack emission in respect of routine parameters and hazardous air pollutants (HAPs).
Concerned Cement industries/power plant
7. Forwarding progress Report to CPCB
Forwarding quarterly progress report of Co-processing of plastic waste to CPCB.
SPCBs/PCCs and Cement industries/power plant

87
9.4.3 Conversion of plastic waste into liquid RDF (oil):
Firstly, plastic waste is segregated mechanically from municipal solid waste
(MSW). This method is not full-proof, as alongwith plastic waste, other lighter
material is also segregated. Therefore, the segregated plastic waste is again
sent through conveyer belt fixed with optical segregation device for 100%
source segregation of plastic waste. Then, the mixed plastic waste is
converted into the more useable i.e. Liquid RDF through catalytic pyrolysis.
The process is termed random Depolymerisation as the degradation of bonds
to break down into monomers occurs randomly. This process is utilized for the
degradation of plastic to lower hydrocarbons. The random Depolymerisation is
carried out in a specially designed Reactor, in absence of oxygen and in the
presence of certain catalytic additives. The maximum reaction temperature is
350 °C. The entire feed material is converted into either of the products: Liquid
RDF, gases and some sludge. There is no effluent generated in the process
and the unused hot air from the reactor is released through chimney Steps
involved in conversion of plastic waste into fuel RDF (Fuel) are given below :
• Mechanical segregation of plastic waste from mixed MSW
dumpyard/storage;
• Transportation of Segregated plastic waste through conveyor belt
for optical segregation;
• Optical segregation of plastic waste (only HD, LD, PP and
multilayer packagings except PVC;
• Shredding of plastic waste and dislodging dust and impurities;
• Transportation of bsegregated (100% plastic waste) into feeding
hopper (reactor);
• Feeding of plastic waste into reactor for random depolymerisation in
prtesence of additives;
• Collection of liquid RDF (Fuel);
• Collection of rejects and solid waste (charcoal).
• Process flow diagram is shown at Annexure-1

88
Observations:
The quantity of plastic waste from MSW is approximately 4% and various depending
on plastic waste content (quantity and concentration) in MSW sample. The catalyst
added whereby the pyrolysis requires less energy and results in the formation of
more branch hydrocarbons. The products of the process is reused as fuel in the
process thus making the process economically viable and also help in minimising air
pollution. The Oil (liquid RDF) has properties similar to LDO and can be safely used
as an alternative to LDO in industries the conserving the already depleting natural
resources. The by-products from the process like sludge and gas can be reused.
The sludge can be reused as fuel in cement industries while the gas reused in the
system as a fuel.
9.4.4 Plasma Pyrolysis Technology (PPT) Plasma Pyrolysis is a state of the art technology, which integrates the thermo-
chemical properties of plasma with the pyrolysis process. The intense and versatile
heat generation capabilities of Plasma Pyrolysis Technology enable it to dispose of
all types of plastic waste including polymeric, biomedical and hazardous waste in a
safe and reliable manner. Pyrolysis is the thermal disintegration of carbonaceous
material in oxygen-starved atmosphere. When optimized, the most likely compounds
formed are methane, carbon monoxide, hydrogen carbon dioxide and water
molecules. In plasma pyrolysis, firstly the plastics waste is fed into the primary
chamber at 850 °C through a feeder. The waste material dissociates into carbon
monoxide, hydrogen, methane, higher hydrocarbon etc. Induced draft fan drains the
pyrolysis gases as well as plastics waste into the secondary chamber where these
gases are combusted in the presence of excess air. The inflammable gases are
ignited with high voltage spark. The secondary chamber temperature is maintained
at 1050 °C. The hydrocarbon, CO and hydrogen are combusted into safe carbon
dioxide and water. The process conditions are maintained such that it eliminates the
possibility of formation of toxic dioxins and furans molecules (in case of chlorinated
waste). The conversion of organic waste into non-toxic gases (CO2, H2O) is more
than 99%. The extreme conditions of plasma kill stable bacteria such as bacillus
stereo-thermophilus and bacillus subtilis immediately. Segregation of the waste is

89
not necessary, as the very high temperature ensure treatment of all types of waste
without discrimination.
Environment Related Observations
Stack emission monitoring of different categories plastic waste such as 100%
Polyethylene Waste 80% polyethylene + 20% PVC waste was carried out by VIMTA
Lab. It has been observed that the emission of toxic pollutants such as dioxins and
furans from the plasma pyrolysis system developed by FCIPT is lower than the
norms set for incinerator.
9.4.5 Recycling of plastic through environmentally sound manner:
The main goal for developing green recycling of waste plastic was to design an
extruder, which would have “Zero Significant Adverse Environmental Impact “. This
has been achieved by assigning right motor of minimum capacity, selecting optimum
L/D ratio, heat sealing and right temperature for the processes and trapping all the
emission in pollution control gadget and treating the pollutant to produce byproducts.
The extrusion & palletisation processes have been redesigned to make the pollution
from the process to a minimum level and as a result to enhance the efficiency of the
process. The details of process Flow Chart is given below:

90
Process Flow-chart of the “Green Recycling Process” – The Pilot Plant
Approx. temp. 175°C
Approx. temp. 190-200°C
Approx. temp. 225°C
Approx. temp. 240°C
Properly Cleaned & Aggiomerated Plastic Waste
Heating & Fed Through hopper
Extruder
Pollution Control &
Pollution Treatment Device
Pollution free emission to atmosphere
Acid Byproduct
Die zone
Water Cooling
Palletizing
Plastic Granules
Feed Zone
Compression Zone
Metering Zone

91
3.0 Action Plan for PWM:
A time-bound action points as per the provisions of Rule 6 of Plastic Waste
(Management & Handling) (Amendment) Rules, 2011 is mentioned at table: 3
below:-
Table 3 : Time Bound Action Plan for PWM S.
No. Action Points Time
Required Infrastructure Requirement Implementing
Authority
1. Setting-up of plastic waste system such as Safe, collection, storage, segregation
Within 6 months
Establishment of separate bin Concerned Municipal Authority such as Municipal Cooperation, Municipal Council, Nagar or Gram Panchayat.
2. Safe, collection, storage, segregation
Immediate Segregation of plastic waste from Municipal Solid Waste (MSW)
Concerned Municipal Authority such as Municipal Cooperation, Municipal Council, Nagar or Gram Panchayat
3. Transportation, processing and disposal of plastic waste
Immediate Transportation of segregated plastic waste to disposal site
Concerned Municipal Authority such as Municipal Cooperation, Municipal Council, Nagar or Gram Panchayat
4. Create awareness among all stakeholders about their responsibilities including house holders or owners or occupiers
Within 6 months
• Mobile vans • Newspapers
ads • Television • FM Radio
Concerned Municipal Authority such as Municipal Cooperation, Municipal Council, Nagar or Gram Panchayat
5.
Engage agencies or groups working in waste management
Within one year
Visiting to successful waste management sites such as Kanpur, Gwalior, Surat, Rajkot etc.
Concerned Municipal Authority such as Municipal Cooperation, Municipal Council, Nagar or Gram Panchayat
6. Ensure that open burning of plastic waste is not permitted
Immediate Constitution of Vigilance Squad Concerned Municipal Authority such as Municipal Cooperation, Municipal Council, Nagar or Gram Panchayat

92