Embed Size (px)
Citation preview

LINKS is a DFID-Funded
Programme Managed by
Tetra Tech
This report was prepared by
Dalberg Advisors and
Dalberg Research
T R A N S P O R T IN G A G R IC U L T U R A L IN P U T S A N D P R O D U C E B E T W E E N K E Y M A R K E T S IN N IG E R IA
F IN A L R E P O R T
1 0 J U L Y 2 0 2 0
Assessment on the transport impacts of Covid-19 lockdown

Executive Summary (1/3)
2
Context
• The Nigeran government’s response to the COVID-19 crisis aims to balance the country’s economic and health needs. The Government implemented various health measures, suchas closing national borders and opening Emergency Operation Centres. The Central Bank of Nigeria introduced several interventions to tackle the economic effects of COVID-19;it established a EUR 121 million credit facility for affected households and MSMEs, cut interest rates and extended the mortarium on principal repayments intervention facilities.
• However, the implementation of national COVID-19 policy differs across states in Nigeria. While the federal government established overarching crisis-response guidelines, states governments have the autonomy to determine specific enforcement mechanisms. The misalignment of federal rules and sub-national implementation has resulted in unclear interstate movement regulations, resulting in a challenging operating environment for trade and inland logistics operators.
• It is within this context that this study was commissioned to undertake a rapid assessment of the impact that Nigerian state-level responses to Covid-19 are having on the ability and cost to trade in agriculture goods (inputs for production and final products) to and from Northern Nigeria. This exercise is critical, as COVID-19 threatens to further undermine food security in Northern Nigeria. According to FSIN research, 5 million people (~5% of the region’s population) are already in food ‘crisis’. Rising unemployment and falling incomes as a result of COVID-19 will likely exacerbate this trend.
Key findings
COVID-19 has had a significant impact on all factors investigated (costs, time, volumes and behavioural change), resulting in a challenging environment for logistics operators. Findings are presented with an acknowledgement that the period situation on the ground is constantly evolving.
Costs
• Across all North-South routes, average trip costs rose more for formal transporters (27%) vs. informal transporters (16%). This is likely driven by stricter standards imposed on formaloperators. Informal transporters experienced the highest cost increases on long trade routes from Kano, Sokoto to Lagos, Port Harcourt, potentially due to inexperience with long-haul travel.
• While we cannot tie this directly to transport disruptions, we note that food costs have risen in outlying regions vs major wholesale centers. For example, between May 2019-2020the spread in maize prices between Kano and Lagos increased by 30 NGN / kg; and the spread between Kano and Maiduguri increased by 45 NGN / kg
• Prices have increased significantly across all routes, with bribes being cited as the most frequently cited source of cost increases. Interviewees report an increase in the number ofpolice checkpoints (as many as 1 every 100km) and bribes at each checkpoint (an average of 7 bribes being paid across each route).
• Bribes were considered a comparatively bigger problem on Kano to Port Harcourt, Maiduguri to Enugu, Port Harcourt & Lagos and Sokoto to Port Harcourt routes. Kano is a major centre for the production and export of agricultural products like hides and skins, which may not have been classified as "essential” goods constraining transportation of these goods. Maiduguri’s challenges may have been linked to security challenges and transporters looking to reach Internally Displaced Person’s (IDP) camps markets.
• Transporters view costs associated with bribes similarly, but smaller transporters indicated that they are significantly impacted by a broader range of challenges.
Source: FSIN, Global Report on Food Crises, 2020

Executive Summary (2/3)
3
Time
• Transporters reported an average 68% increase in journey time, mainly driven by delays at and proliferation of checkpoints. Generally, transporters are spending <1hour at police checkpoints, while having to cross an average of 11 checkpoints per trip.
• Most significant increases were along routes to Lagos, specifically Kaduna to Lagos (103%), Jigawa to Lagos (80%),& Sokoto to Lagos (79%). This is likely due to high trafficvolumes along theseroutes.
• The majority (90%)of shippers also indicated facing increased challenges with goods arriving on time.
• Changes in road conditions were not a key contributor to transit time increases between February and May. Incidents with bad roads and blockages fell by 16 and 7 percent, respectively.
Volumes
• The total number of trips completed across all routes decreased by 47%, also linked to delays at checkpoints, implying reduced earning capacity for transporters.
• Transporters also noted an increased difficulty in finding backhaul cargo which may also contribute to the decline in the volume of goods being transported. Larger transporters appear more affected by difficulty in finding backhaul cargo, which may be as a result of reduced flexibility in pricing and types of cargo transported.
Behaviour changes
• Across the value chain, actors are facing supply-demand coordination issues. Transporters report falling demand and consequent difficulties maintaining their customer base, while shippers emphasize the difficulties in linking with transporters, who are transitioning to working with different customers.
• Only 43% of transporters have adopted significant health and safety practices. Many of those who have not, cited insufficient knowledge of rules and regulations.
• Route changes and reduced spending on maintenance were cited as the key behavioural changes in response to the restrictions.
Source: FSIN, Global Report on Food Crises, 2020

Executive Summary (3/3)
4
Interviewees highlighted key drivers and impacts of Agri-logistics challenges, that require a response from actors across the value chain. These include; Decentralized policy-development and enforcement; Limited data-collection; Inconsistent communication of COVID-19 response rules and limited coordination of demand-side actors and unpredictable downstream impacts. To provide tailored and actionable recommendations, we mapped intervention strategies against key findings. Since the impacts of COVID-19 were particularly acute along Priority Agri-Trade Corridors (PATCs) that are interlinked to key markets in Kano, Kaduna, Jigawa, Abuja, Enugu etc., we focused our recommendations on hubs along that route.
Recommendations
• Immediate action could safeguard the logistics sector and ultimately the agricultural sector as a whole, to lessen potential shocks that lie ahead. With demand pressures likely toworsen, the agri-logistics sector will continue to face significant challenges. The government and other industry players are in a unique position to consider additional measuresthat could cushion the sector and mitigate risks by considering some of the following interventions:
1. Interventions to address cost drivers:
• Tactical: Enforcement Integrity - 1) Mitigate prevalence of corruption at checkpoints 2) Procedure streamlining – reduce process bottlenecks at checkpoints to reduce
time spent at checkpoints 3) Streamline messaging– ensure messaging is clear and consistent with regards to requirements.
• Strategic: 1) Coordinated policy setting and execution - Better coordination between state and federal actors in policy-making and enforcement, by using data on the
impacts on transport & agricultural sectors 2) Data driven response strategies, leveraging digital technology - leveraging data-driven decision-making / early-warningsystem at key Agri-nodes and value chain stages to facilitates a tailored response strategy.
1. Interventions to address market coordination gaps:
• Tactical: 1) Coordinate re-opening of key markets to mitigate supply chain bottlenecks 2) Improve knowledge and information sharing for actors across the VC 3) Facilitate
coordination between shippers and transporters; Safeguard fertilizer availability.
• Strategic: 1) Value chain coordination -Coordination among demand-side actors through digital channels and Collaboration with donors and private-sector to mitigate
demand-side pressures, particularly for farmers and marketers along the value chain.
3. Interventions to address workforce protection:
• Tactical: 1) Leverage grassroots communications channels to ensure messaging reaches all levels 2) Support logistics workers with occupational health and tailored
guidelines regarding safety measures .
• Strategic: 1) Communication optimisation - Open and reciprocal channels of communication between the logistics sector & ground-level actors on broader COVID-19
rules, local contexts and safety measures.

Contents
5
I
Research FindingsII
Context , Objectives and Approach
III Recommendations
IV Annex A & B

Nigeria’s economy is still in recovery from the last recession, andthe pandemic presents new challenges
6
Source: NCDC, Updates on COVID-19, 2020; World Bank, Current Health Expenditure (%of GDP), 2017; US International Trade Administration, Nigeria,2014; World Bank Data Bank, Hospital beds per capita, 2019’ WHO Workforce Alliance, Nigerian Healthcare, 2015; Punch, Nigeria has less than 500 ventilators for coronavirus patients, 2020
Straining health systems, challenging public health emergency response, and exacerbating holistic health risks
Raising food insecurity, in conjunction with existing gaps in the agriculturalsector
Complicating education systems, particularly as parents and learners adapt to home-based learning with little to no resources
Causing restrictions on mobility of people and goods, which introduces a range of demand-side shocks that impact consumption and ultimately economic growth
Country Context
Economic context
• Manufacturing, trade and agriculture contribute over 50% to Nigeria’s GDP. These sectors are also dominated by MSMEs – agricultural MSMEs contributed 97% to total agriculture GDP, while trade and manufacturing MSMEs contributed 59% and 55% (2017).
• MSMEs are more likely to experience greater shocks with difficult recovery journeys to overcome the business impacts of COVID-19. This is due to limited access to finance, decreased consumption and low digitization limiting agility capacity. In the last recession, workforce employment from MSMEs fell from 84% to 77% in 2017.
• Additionally, Nigeria’s economy is heavily reliant on the oil and gas sector– 90% of FX reserves is from oil exports. Therefore the oil price decline is expected to have a significant impact on the economy, particularly on government’s fiscal capacity to mitigate COVID-19 impact.
• According to FSIN research, ~5 million people (5%) of the region’s population are already in food ‘crisis’. Rising unemployment and falling incomes as a result of COVID-19, will likely exacerbate this.
Health context
• Nigeria’s healthcare system is underfunded. Total health expenditure in2016 was USD18bn for 180 million people, compared to South Africa’sUSD26bn for 56 million people.
• Due to its underfunding Nigeria’s healthcare sector does not have adequate capacity to manage a widespread outbreak, with only 8 hospital beds and 4 physicians per 10,000 people, and ventilator capacity of <500.…along with many other critical complexities
Constraining global trade, resulting in local value chains being disrupted as supply repercussions cascade

Given the economic context, Nigeria’s national response to theCOVID-19 crisis aims to balance economic and health needs
7Source: NCDC, 100 Days of Nigeria COVID-19 Response, 2020; CBN, “CBN policy measures in response to COVID 19 outbreak and spillovers”, 16/03/2020
Public funding systems are already activated to mitigate the economic impacts of COVID-19. However, Nigeria’s high government debt and debt-service ratio, coupled with declining tax revenues and oil prices will limit the government’s fiscal capacity to implement additional interventions
Response Strategies: focused on mitigating the immediate impact and minimizing the depth of the shocks that COVID-19 will bring in the future, particularly for most vulnerable small businesses
Public Health
Government Policy
Private &civil society actors
• Established Presidential Task Force on COVID-19 (PTF-COVID-19).
• Launched a Level 3 Emergency Operations Centre within the NCDC in Feb 2020 to coordinate Nigeria’s emergency response andscale-up testing capacity by increasing the number of testing centres from 4 to 30, with a combined capacity of 10,000 tests daily.
• Trained over 13,000 health works in infection prevention and control (IPC).
• Mobilized NGN N100 billion for healthcare loans to pharmaceutical companies and healthcare practitioners to build capacity.
• Created NGN 50 billion fund managed by the NIRSAL Microfinance Bank targeted at households and SMEs that are mostvulnerable given the shocks of COVID-19. Potential beneficiaries include airline service provides, hoteliers, healthcare, etc.
• Extended existing intervention facilities through the Central Bank of Nigeria (CBN) for one year, and reduced interest rates reduced from 9% to 5% for intervention facilities for a period of one year, effective as of 1 March 2020.
• Committed NGN1 trillion in loans through the Central Bank to boost local manufacturing and production across critical sectors.
• Created the Nigerian Private Sector Coalition Against COVID-19, in collaboration with the CBN to mobilize private-sector resources to support the government’s response to the crisis and raise public awareness.
• Many small businesses are also supporting the provision of PPE and other sanitary equipment such as masks, sanitizers, etc.
• Ongoing discussions to determine private sector interventions to propose in partnership with the such as telecommunications companies cutting data prices and removing charges on mobile money transactions.

However, the implementation of national COVID-19 policies has varied between states
8(1) guardian.ng, (2) thenationonlineng.net, (3) thenationonlineng.net, (4) vanguardngr.com, (5) covid19.ncdc.gov.ng, (6) businessday.ng, (7) guardian.ng, (8) channelstv.com, (9) punchng.com,(10) thisdaylive.com (11) Jigawa State New Media Office, (12) premiumtimesng.com, (13) punchng.com, (14) guardian.ng, (15) thenationonlineng.net, (16) punchng.com, (17) vanguardngr.com
Interstate border closures
Full lockdown imposed
Interstate borderclosures AND fulllockdown imposed
Jigawa
• Partial lockdown with first Kazaure and other Local Government Areas going into full lockdown from mid-April9. The state government has generally tried to pre-empt outbreaks, imposing a lockdownon Kazauru after just one confirmed case11
• Temporary border closures from 27th
March12
• Jigawa state has had ~2% of theconfirmed caseload acrossNigeria5
Kaduna
• Curfews and lockdowns imposed from March26th. Offices, businesses and places of worship have largely been closed since then7
• Temporary border closures from April 28th to Katsina and Kano states8
• Kaduna state has ~2.5% of theconfirmed caseload acrossNigeria5
Kano
• Full lockdown from mid-April until early June. Despite taking action relatively early – e.g. closingschools1 and all public gatherings2 from 23rd March – Kano has been badly hit by COVID-19 and had to impose severe lockdowns3
• Temporary border closures from 27th
March4
• Kano state had the third highest case load of all federal states, with ~7%of the confirmed caseload across Nigeria5 amid worries that cases wentundetected6
SokotoKatsina
Jigawa
Yobe Borno
Adamawa
Kaduna
Plateau
Nasarawa
Kebbi
Niger
Kwara
Oyo
Osun
OndoEdo
Kogi
Delta
Bayelsa
Cross River
Benue
Taraba
Zamfara
Kano
BauchiGombe
Ekiti
Enugu
Ebonyi
Imo Abia
Akwa Ibom
Anambra
Rivers
FCT
Ogun
Lagos
Key marketsFood/beverage processing
Other prioritystates
• Lagos – Epicentre of Nigeria’s COVID-19 outbreak, with ~45% of the country’s confirmed cases5. Lagos and adjacent states went into full lockdown from 30th March until 4th May, but did not shut interstate borders13
• Borno – Strict countermeasures despite relatively low caseload5.Temporarily imposed full lockdown and border closures from 13th April14
• Rivers – Minor outbreak5, likely due to swift action by state government to impose a partial lockdown and shut interstate borders from 24th
March15
• Sokoto –Low caseload, with ~1%of nationally reported cases5. Closed interstate borders for non-essential transport from27th March16
• Enugu – Among least affected states, with only 35 cases as of 12th June5. Shut interstate borders from 31stMarch17
National response
• The federal government of Nigeria also imposed a nationwide curfew and ban on personal interstate travel from 4th May9 (extended on May 18th through to June 1st)10

This study aims to understand the potential impacts of government responses on agricultural supply chains
9
• The transportation network in Nigeria is greatly impacted by the Covid-19 lockdowns and associated effects. Even for essential goods, severe queuing time for lorries has been reported and an added complexity to cross borders (new documentation needed etc.).
• Dalberg’s recent quantitative assessment also shows limitations in
fertilizer distribution for this planting season and longer delivery times of produce to designated market. Both issues will impact the ability to make money forseveral low-income groups.
• From our contacts at international FMCGs active in all Nigerian states, we have also heard reports of 60% cost increases and between 50% to 100% longer transportation time.
• To meet the objectives of LINKS and support livelihoods in Northern Nigeria, it is therefore critical to understand the scale of the impact of COVID-19 restrictions on the cost of trade, and design appropriate policy solutions.
• Develop an understanding of how key agricultural supply chains in Kano, Kaduna and Jigawa (KKJ) have been affected or are likely to be affected as a result of governmental response to the COVID-19 pandemic:
o Understand how cost, time and volume of agriculture transportation has changed since restrictions were implemented in Nigeria
o Identify behaviour change
o Determine key factors influencing these changes (including policy)
• Develop evidence-based recommendations for addressing these changes
• The COVID-19 situation continues to evolve rapidly, and many restrictionsimposed by state and federal governments hindering the flow of cargo aregradually being relaxed.
o As a result, our findings and recommendations are framed to take
into account the rapidly evolving circumstances, and focus on building resilience for businesses to withstand future shocks.
The objectives of the DFID LINKS programme are at risk given the current COVID-19 pandemic. To solidify achievements to date and design an effective policy response, recent data about on-the-ground realities is urgently needed.
The Agri-logistics sector is particularly vulnerable to state-level COVID-19 responses; localised rules impact the movement of goods across state lines. A detailedanalysis of the response phase will help identify the key weakness and capabilities of Nigeria’s crisis-response. It will also propose ways in which the governmentcan strengthen its existing strategies.
Context Objectives

A range of research techniques were used to evaluate the impact of COVID-19 responses on the agri-logistics sector
10
Baselining of key indicators before covid-19
Analysis of changes in and factors affecting key indicators
across keynodes
Observed behaviouralchanges
Policy recommendations
• Establish baseline time and cost for transport of 20MTand 30MT loads between key nodes before COVID-19 •
restrictions, and baseline cargo volumes transported.
Study component Description Research techniques
Source: Dalberganalysis
We conducted 23 in-depth interviews and surveyed ~150 logistics services providers to collect data on time, cost and volume in order to understand the impact of the pandemic and restrictions. Our research findings are discussed in detail in the slides that follow.
• Analyse changes in time, cost and volume of cargo transported across key nodes (including which value chains are most atrisk).
• Investigation of key factors driving time and cost increases for transport (including policy, number and location of police barriers agencies present, etc.
• Desk research – review of newspaper articles, state andfederal government agency websites, etc.
• Documentation of experiences and challenges faced by truck drivers and motor-boys across key routes.
• Interviews conducted with transporters and shippers.
• Identify behavioural change in transporters and shippers as a result of COVID-19 (including health and crime concerns of drivers, etc.).
• Interviews conducted with agricultural producers and traders, transporters, shippers and truck drivers.
• Documentation of experiences and challenges faced by truck drivers and motor-boys across key routes (including behavioural changes made to adjust to new realities).
• Produce evidence-backed recommendations built on findings from analysis above with a focus on agriculture supply chains.
• Desk research – review of best practices.• Input from stakeholders including value chain actors,
ecosystem actors (such as research institutes and associations), and policy experts.
1 • Desk research - literature review of past studies and reports
on logistics inNigeria.Telephone surveys and interviews with transporters, truck drivers and customers (e.g. agribusinesses, etc.) to a establish baseline.
2
3
4

11
We evaluated 11 routes from key trading centres in the North, bringing goods to the South
Focus states
States crossed enroute
Key routes being investigated
Katsina
Jigawa
Yobe
Borno
Adamawa
Kebbi
Niger
Kwara
Oyo
Edo
Kogi
Bayelsa
Cross River
Benue
Taraba
Zamfara
Kano
BauchiGombe
Enugu
Ebonyi
Akwa Ibom
Rivers
Zuba
Zaria
Mokwa
Auchi
BeninAwka
Anambra
Imo Aba
Jebba
Kontagora
Jega
Ilorin
Ogbomosho
Lagos
Kagara
Tegina
Ibadan
Ogun
Ogere
Yelwa
Ibeto
Port Harcourt
Damaturu
Potiskum
Jos
Keffi
Nasarawa
Lokoja Okene
Olora
Biu
Jere
Maiduguri
Mubi
Sokoto
Yabo
Gusau
Funtua
Kwona Mutua
Tafawa Balewa
Plateau
Pankshin
Yelwa
Ogoja
Abakaliki
Tafa
Kaduna
Makera
Akure
Ondo
Lafia
Zaki Biam
Makurdi
Abaji
Shuwari
Delta
Warri
Wudil Kwanar Dogora
Niger
Kwara
Nasaraw a
Abuja
Osun
Ilesha
Route origins
Route destinations
Kano to Lagos
Kano to Enugu
Kano to PortHarcourt
Sokoto to Lagos
Sokoto to Enugu
Sokoto to PortHarcourt
Maiduguri to Lagos
Maiduguri to Enugu
Maiduguri to Port Harcourt
Jigawa to Lagos
Kaduna to Lagos
Routes
Main bridges
Key markets

While we interviewed various actors across the agri-logistics value chain, we encountered some challenges gathering insights
12
Respondents Limitations
Source: Dalberganalysis
Number of interviews by stakeholder type
12
6
31 1
• Survey sample sizes for shippers and transporters differ across routes. To prevent findings from being skewed towards certain routes, we validated trends through interviews and desk-research.
• Some transporters were unavailable for interviews from our previous list of respondents, while others refused to participate. As data-collection had started, we had to recruit more respondents. Transporters who declined to take part in the interviews were mainly from Maiduguri.
• Interviews with truck assistants were slower than expected; several faced delays returning to their start points and were unavailable for evening calls. As a result, follow up interviews conducted days later may have been less accurate.
• Data on the volume of goods transported before COVID-19 was based on transporter recall. Numbers may be slightly over or underestimated for small transporters who move a variety of commodities from different shippers
• Most of the recruited transporters own between 1-3trucks. Since the sample size is small, answers may bebiased towards small scale transporters.
Logsitics Processors Ecosystem Agreggators FMCG/Retail
Number survey of respondents by occupation and route
Total 50 107
Shippers Transporters TruckAssistants
JIG toLG 6 3 3
KAD toLG 3 13 3
Kano to EN 3 10 3
Kano toLG 7 17 3
Kano to PH 8 10 3
MAI toEN 2 5 3
MAI toLG 4 17 3
MAI toPH 2 10 3
SOK TO EN 4 5 3
SOKto LG 4 7 3
SOKto PH 7 10 3
33

Contents
13
I
Research FindingsII
Context , Objectives andApproach
III Recommendations
IV Annex A & B

Overview: Emerging Agri-logistics challenges could aggravate the threat of demand and supply side shocks if left unmitigated
14Source: Dalberg analysis, survey and interviews
Impact elementDegree
of impactImpact Potential effects without interventions
Costs (Apr- May)
High largely due to localized pricing spikes after the start of lockdown, with some indication that these might be stabilizing. Increases in bribes were nearly universal, although the contribution of this to total costs is not known. Increased labour costs and security costs were also common.
• Agri-sector is already vulnerable to demand-side pressures and increased food produce costs will exacerbate this.
• Higher logistics costs, combined with other factors may impact low-margin producers and deter them from producing.
• Disruptions may result in low affordability of agricultural inputs, particularly as devalued currency and higher-cost logistics may make inputs more expensive.
Transit time(May)
Very High as data indicates an average increase of 3 days in transit. On average there are 11 checkpoints along the selected routes with most drivers spending about an hour or more at each checkpoint.
• Untimely delivery of inputs is impacting the planting season for key valuechains in the North, as inputs move from South to North.
• Inland logistics bottlenecks resulting in raw materials not reaching ports timeously for export.
• Reduced revenue earning capacity of transporters, is threatening business viability and may result in job losses/business closures.
Volumes (May)
High, due to reduced volumes of trips and produce transported. However, in some instances, transporters were able to switch to transporting other produce in response to customer demand and changing restrictions.
• Erratic transportation of goods creating more chaos in Agri-value chains already requiring enhancedcoordination.
• Not all transporters have been able to adapt i.e. may not have suitable transportation to switch to transporting other goods and thus have they realised loss of income.
Behavioural Changes (May)
Medium as transporters report some, but not drastic changes to their operating procedures to adapt There remains room to reinforce adoption of safety standards in thesector.
• Given the high-exposure of transporters, adoption of safety standards is critical. They not only risk being infected but transmitting the virus across states.

Overview: By route, decline in trip volumes emerged to be the most consistent significant impact noted
Note: See Slide 18 for baseline prices per route. 1. We asked whether drivers encountered each of 5 types of delays along the route (floods, bad roads, bridge issues, traffic, and other) along the route, and assigned a score of 1 if a given delay occurred once, or 2 if it occurred more than once. The Index shown is the sum of these scores across all 5 delay types, so an Index of 1 means on average, one type of delay occurred once per journey. An Index of 2 or above indicates significant issues – either two (or more) types of delays were encountered, or one (or more) delay was encountered multipletimes.
Legend Low-Moderate impact High Impact VeryHigh ImpactOverview of impact across Cost, Transit and Volumes by Route
Route Cost Transit time VolumesCurrent
roaddelays index1
Increase forinformal (Apr)
Increase forformal (Apr)
Average no.ofbribes paid
Baseline time(one way)
Days in May (avg. one way)
No. checkpoints (avg)
% No. oftrips (avg)
No. of trips(avg)
Kano to Lagos 10-20% 30%+ 3 3 days +1 day 12 -25 – 50% -1 2.1
Kano to Enugu 10-20% 20-30% 8 2 days +1 day 9 -25 – 50%-1
1.5
Kano to PortHarcourt 10-20% 20-30% 8 3 days +1 day 8 -25 – 50% 0 1.3
Sokoto to Lagos 10-20% 20-30% 43 days
+2 days 8 -50-100% -2 1.2
Sokoto to Enugu 10-20% 20-30% 6 3 days +3 days 7 -50-100% -4 1.0
Sokoto to PortHarcourt 10-20% 20-30% 9 3 days +2 days 9 -25 – 50%-1
0.4
Maiduguri to Lagos 0-10% 10-20% 113 days +2 days
11 -50-100%-2
1.0
Maiduguri to Enugu 10-20% 20-30% 10 3 days+2 days
7 -25 – 50%-1
0.4
Maiduguri toP. Harcourt 10-20% 20-30% 5 3 days+2 days
16 -50-100%-1
0.7
Jigawa to Lagos 10-20%20-30%
4 3 days +3 days 12 -25 – 50% -4 0.3
Kaduna to Lagos 10-20% 30%+ 6 3 days +3 days 5 -50-100% -3 0.5

16
Overview: Delays and bribe payments are particularly acute for transporters travelling from Kano to the South
Observations:
• In the North, Potiskum and Kwanar Dogora were the hardest-hit by a combination of COVID-19 related challenges (bribes, time delays). In the South, Okene, Makurdi and Akure were particularly affected. These towns sit along critical trade routes that interlink with other routes and key markets across 16 states; these routes are identified as Priority Agri-Trade Corridors- PATCs for prioritization in addressing trade constraints.
• Transporters travelling from North-East routes seem most affected by severe delays, likely due to security related issues
• Lagos, Enugu and Jos checkpoints have the highest number of bribes.
Katsina
Jigawa
Yobe
Borno
Adamawa
Kebbi
Niger
Kwara
Edo
Kogi
Bayelsa
Cross River
Benue
Taraba
Zamfara
Kano
BauchiGombe
Enugu
Ebonyi
Akwa Ibom
Rivers
Zuba
Zaria
Mokwa
Auchi
BeninAwka
Anambra
Imo Aba
Jebba
Kontagora
Jega
Ilorin
Lagos
Kagara
Tegina
OyoOgbomosho
Ibadan
Ogun
Ogere
Yelwa
Ibeto
Port Harcourt
Damaturu
Potiskum
Jos
Keffi
Nasarawa
Lokoja Okene
Biu
Jere
Maiduguri
Mubi
Sokoto
Yabo
Gusau
Funtua
Kwona Mutua
Tafawa Balewa
Plateau
Pankshin
Yelwa
Ogoja
Abakaliki
Tafa
Kaduna
Makera
Akure
Ondo
Lafia
Zaki Biam
Makurdi
Abaji
Shuwari
Delta
Warri
Wudil Kwanar Dogora
Focus states
States crossed enroute
Key routes being investigated
Key food trade routes (Priority Agri-Trade Corridors- PATCs)
Key commercialhubs
Areas where drivers paid at least 15 bribes & spent >4hours at checkpoints
Areas where drivers paid an average of 15 or more bribes
Areas where drivers spent >4 hours at checkpoints
Key markets (including Dawano market, Kano)
Niger
KwaraAbuja
Ekiti
OloraOsun
Ilesha

Pre-survey cost findings in late April, an introductory data collection exercise revealed price increases across all major routes
17
Price increases from March to April by route and provider segment%increase in price, from March 1st to late April as reported by FMCG stakeholders
in interviews, based on smallsample
Kano toLagos
Kano toEnugu
Kano to Port Harcourt
Sokoto toLagos
Sokoto toEnugu
Sokoto to Port Harcourt
Maiduguri to Lagos
Maiduguri to Enugu
Maiduguri to Port Harcourt
Jigawa to Lagos
Kaduna to Lagos
AVERAGE
18%
16%
Informal transporters1
16%
17%
20%
16%
16%
15%
8%
12%
14%
20%
27%
18%
28%
Formal transporters2
26%
28%
32%
30%
27%
29%
24%
26%
32%
Source: Dalberg analysis, survey and interviews(1) Informal transporters would typically be driving a fully depreciated truck, without scheduled maintenance or insurance for vehicle or cargo and with drivers that have no formal training. (2) Formal transporters are here defined as having all legally required documentations in place and so confirming to, e.g. ISO 9001:2015.Source: Contacts in the Nigerian FMCG sector. Data based on rapid sampling conducted in early May.
Observations:
• Prices for agricultural logistics have increased significantly following the COVID-19 outbreak and resulting government restrictions, across all routes and provider segments (by an average of 21%).
• Across all routes, the price increase was higher for licensed transporters than for unlicensed transporters. This could be due to a fall in supply that coincided with strict lockdowns that made fully compliant logistics near impossible.
• Interviewees attribute price increase to constrained route coverage capacity as drivers are reluctant to ply certain routes due to fear of harassment at police checkpoints and difficulty in finding backhaulcargo:
o “We stopped offering services because our drivers were being harassed, at some point the border between Kano and Kaduna was completely closed and our drivers were stuck.”
o “There was reduced demand for manufacturing and constructioninputs like steel which we would transport back as factories wereshut down.”
• For logistics companies who may have taken dollar-denominated loans, financing costs would have increased due to the Naira devaluation which would reflect in pricing to customers as a result of increases in their operating costs.In an already depressed market, price spikes will likely be absorbed by producers,
processors and retailers, as demand is increasingly constrained

Pre-survey data shows that transportation costs from the North to South have risen for informal and formal truck operators
18Source: Dalberg analysis, survey and interviews
Change in costs for informal transporters pre and during COVID-19Average cost on the 1st of March and cost increase by late April (‘000 NGN/trip)
33
26
44
53
215
281
270
43
246
50292
40
39
267
265 43
39
350
314
39
214
Kano to Lagos
Kano toEnugu
Kano to Port Harcourt
Sokoto to Lagos
Sokoto toEnugu
Sokoto to Port Harcourt
Maiduguri to Lagos
Maiduguri to Enugu
Maiduguri to PortHarcourt
Jigawa to Lagos
Kaduna to Lagos
226
Average cost pre covid 19 (1st of March)
Cost increase March-lateApril
Observations:
• Informal transporters travelling from Kano and Sokoto to Lagos and Port Harcourt saw the highest increase in costs. This is likely driven by these providers’inexperience travelling longer distances and the high number of checkpoints along these routes, which increase the likelihood of bribes and delays.
• Among formal transporters, trucks travelling from Maiduguri, Sokoto and Kano to Lagos and Port Harcourt experienced a substantial increase in costs. This ispotentially due to frequent checkpoints across longer routes compared to routes bringing goods to smaller trading cities such as Enugu.
• Note: This data was obtained from key informant interviews from FMCG logistics experts. Survey data on revenue per trip was characterized by low response rates, high volatility, and data quality issues, driven by a general unwillingness of respondents to share exact figures, and is thus not shown.
Change in costs for formal transporters pre and during COVID-19Average cost on the 1st of March and cost increase by late April (‘000 NGN/trip)
96
101319
88
297
369
88
308
110380
97
101
82442
90319
110464
369
275 88
Kano to Lagos
Kano toEnugu
Kano to Port Harcourt
Sokoto to Lagos
Sokoto toEnugu
Sokoto to Port Harcourt
Maiduguri to Lagos
Maiduguri to Enugu
Maiduguri to PortHarcourt
Jigawa to Lagos
Kaduna to Lagos
369
Average cost pre covid 19 (1st of March)
Cost increase March-lateApril
20%
18%
16%
17%
15%
16%
8%
16%
12%
14%
20%
16%
32%
30%
28%
29%
26%
27%
18%
28%
24%
26%
32%
27%
%increase %increase

While we cannot link this directly to transport disruptions, we note a widening in spreads of food prices between central & outlying regions
191. Calculated by finding the difference in the price of maize between the origin and the destination for 2019. The change in price difference 2019-2020 was found by subtracting the 2019 from the 2020 price difference. Source: FEWS NET, 2020, Dalberg analysis, survey and interviews.
Change in maize price spread between central and outlying locations in Nigeria, 2019 vs2020Difference in maize price (‘000 NGN/tonne) between origin and destination
45
40
50
55
65
15
10
-5
20
52
45
20
45
Giwa (Kaduna) vsLagos
Kano vsLagos
15
Gujungu (Jigawa) vs Lagos
Saminaka (Kaduna) vs Lagos
65
Biu(Borno) vs Lagos
Gujungu (Jigawa) vs Ibadan
Kano vs Ibadan
Saminaka (Jigawa) vs Ibadan
92
95
25 80
15 80
15 30
0 10
Kano vs Maiduguri (Borno)
30 75
Price difference between locations in May 2019
Change in price difference2019-2020
Observations:
• Using maize as a proxy commodity to understand supply chain dynamics between routes, the spread in the price of maize increased significantly on longer trade routes from Northern regions to Lagos. Between May 2019-2020 the difference in maize prices between Giwa, Gujungu, Kano, Saminaka and Lagos increased by an average of 83%. Higher prices are likely set to cover the cost of COVID-19 related travel delays on longer journeys.
• The price of maize has risen in the North-East, indicating increasing transportation costs to trade centres. Price differences between Kano-Maiduguri have widened, and price of maize has risen in Maiduguri relative to Lagos and Ibadan. This trend is likely driven by:
o Maiduguri markets serve as key commercial hubs for Borno states and the heightened levels of conflict in Borno, are causing delays for transporters from other trade centres, such as Kano and hampering cross-border trade with export markets such Cameroon
o High prices of staple crops in the North-East relative to the rest of the country, as a result of poor transport infrastructure, high demand and low supply.
• On shorter journeys (i.e. from Kano and Saminaka to Ibadan), price differences are marginal, implying minimal cost increases along these routes. This trend may be facilitated by the strong trade linkages between the Bodija market in Ibadan, the grain market in Saminaka, and the Dawanu marketKano.
I.e. in May 2019, maize cost 40k NGN more in Lagos than Kano. Now, the difference has increased to 75k NGN

The most commonly-cited increased cost item is for bribes at police checkpoints related to COVID-19 restrictions
20Source: Dalberg analysis, survey and interviews, All Africa.Com Nigeria: Extortion Bazaar - How Corrupt Security Personnel, States' Officials Help Violate Interstate Travel Ban
Observations:
• Of those who indicated an increase in bribes and fees, 98% noted that this cost increase wassignificant
o Interviewees echoed this, stating that interstate border closures have resulted in additional bribes being paid at checkpoints and roadblocks to avoid harassment and significant delays. This is despite communication from the Federal Ministry of Agriculture and Rural Development (FMARD) to allow free passage of foods, perishable farm products, livestock and farm inputs.
• Bribes were viewed as a comparatively bigger problem on Sokoto to Lagos andEnugu, Maiduguri to Lagos and Enugu, Jigawa to Lagos and Kaduna to Lagos routes.
o Interviewees also noted an inconsistency in interpretation and implementationof the Ministry’s directive by the various state governments.
• We have obtained non-survey data on the approximate breakdown of costs for more formalized transporters. This data did not include the costs of bribes, so we cannot yet determine how the increases reported by drivers will contribute to overall cost increases. The approximate breakdown is:
o 30-35% of the total cost is driven by petrol. While the price of petrol may have fallen for many, the delays seen en route have the potential to increase fuel consumption (and thuscost) overall
o 20-25% is driven by maintenance; some respondents noted an increase here
o 10-15% is personnel cost; respondents noted a general increase here, and the delays seen would also be expected to drive this up further
o 10-15% is spares and consumables; some respondents noted an increase here
o 15-20% is overhead and margin. Given that delays appear substantial in our survey, this cost may be driven up as fewer trips are completed, resulting in a higher overhead burden per trip
Changes in key cost components on selected routesNumber of transporters who answered that cost associated which each category of
expenses had increased following the lockdown (N=107)
93
47 45
25 25
4 2
InsuranceCost ofpetrol
Fees or bribes at police
checks or roadblocks
Securitycosts
Wages for assistants
or mechanics
Cost ofspare parts
Overnightcosts
87% 44% 42% 23% 23% 4% 2%% of
respondents
Note that 32 respondents indicate the cost of petrol has declined; this is the only cost item reported as generally decreasing and this could have buffered other cost increases
“The driver said he spends about N50,000 bribing policemen, soldiers and other security operatives….,“ transporter from Kaduna to Onitsha
All Africa.Com, May 2020

An average of 7 bribes were paid by transporters travelling across each route, with instances where up to 20 bribes were paid at one checkpoint
21
Observations:
• From a total of 169 reports, across the 11 routes, transporters indicated that they paid an average of 7 bribes along each route.
o In some instances at one checkpoint drivers indicated ranges as high as 10 -20 bribes that were paid
o This echoes interviewee observations that there are inconsistencies in the implementation of the FMARD’s directive to allow free movement of agricultural produce across states, as well as state border closures, creating loopholes for police officers to collect bribes.
• Locations with the highest number of bribes paid include Potaskum, Benue, Kogi, Abaji, and Lagos, some of which align with where transporters are being delayed for longer at checkpoints.
Number of bribes paid at checkpoints by routeAverage number of bribes paid by respondents when travelling across each route
(N=331)
1Data was collected as respondents travelled across the 11 routes and on average respondents crossed 13 checkpoints (a total of 169 reports provided)Source: Dalberg analysis, survey and interviews , All Africa.Com Nigeria: Extortion Bazaar - How Corrupt Security Personnel, States' Officials Help Violate Interstate Travel Ban
Kaduna to Lagos 6
Sokoto toEnugu 6
Maiduguri to PortHarcourt 5
Kano toLagos 3
Jigawa to Lagos 4
Sokoto toLagos 4
AVERAGE 7
Range
Maiduguri to Lagos 11 0-20
Maiduguri to Enugu 10 0-20
Sokoto to Port Harcourt 9 0-16
Kano toEnugu 8 1-20
Kano to Port Harcourt 8 0-20
0-15
0-15
2-10
0-15
1-10
0-7
0-15
“We are classified as essential services but still encounter challenges at checkpoints particularly when returning back,
and at night officers are trying to get whatever they can from you. We give our delivery guys a letter from the Ministry but depends on who you encounter at the
checkpoint”
- Agribusinessowner“Almost all security outfits in the country - the police, the military, the Nigerian Vigilante Group, the Federal Road Safety Corps, the Nigeria Security and Civil Defence Corps and even officials of states' COVID-19 taskforces and employees of the construction company, RCC, participated in the free-for-all shakedown of mainly commercial motorists flouting the presidential order.” All Africa.Com, May 2020

Transporters view costs associated with bribes similarly, but smaller transporters are impacted by a broader range of challenges
22
1 54 respondents in total provided data on fleet sizes. (1) Small transporters refers to transporters with fewer than 5 lorries. (2) Larger transporters are here defined as transporters with a fleet size of >5 lorries . Source: Dalberg analysis, survey and interviews, Premium Times -Nigeria: Extortion Bazaar - How Corrupt Security Personnel, States' Officials Help Violate Interstate Travel Ban
Observations:
• ~90%of transporters noted an increase in costs associated with bribes at police checks and roadblocks.
• Smaller transporters appear to be affected by a broader range of challenges.
o 47% of smaller transporters noted an increase in cost of security (as opposed to 14% of larger transporters). Larger transporters may already have in place security measures and so may not have experienced significant cost increases, despite facing increased security challenges following theoutbreak.
o Smaller transporters who may be overusing their vehicles to maximise revenue during this period may also have to use black-market channels to access spare parts and mechanics, which typically charge higher prices (particularly given restrictions on the number of days spare part markets are allowed to open).
o Larger transporters would also have more formalisedfleet maintenance procedures, can also benefit fromeconomies of scale when purchasing spare parts, andwould have more routes to absorb increases in costswhich limits their vulnerability to changes in cost.
• However with only 7 transporters indicating having more than5 lorries we are unable to draw firm conclusions.
29%
Fees or bribes at police
checks or roadblocks
91%
Wages for Security assistants or costs mechanics
86%
Cost of Overnight Cost of spare parts costs petrol
Insurance
47% 47%
14%
36%
14%23%
14%
4% 0% 4% 0%
Breakdown of challenges faced by transporter typeProportion of transporters who experienced an increase in each challenges following
the COVID-19 outbreak and resulting restrictions (N=541)
Small transporters1 (N=47)
Larger transporters2 (N=7)
“During a recent trip, when my truck broke down, I had to go and pick up the mechanic from his house, and since I was
desperate, I had to pay whatever it cost and obviously he was sourcing parts at a premium.”
- Producer (with own fleet of trucks)
“At the boundary between Ogun and Ondo State on the Sagamu- Benin Expressway, there was a cluster of about 10 checkpoints made up of officials of the FRSC, different units of the Nigeria Police, military personnel, officials of the COVID-19 taskforces of both states and a checkpoint manned by employees of the road construction firm, RCC."
Premium Times, May 2020

Transporters reported an average 68% increase in journey time, mainly attributed to delays at and proliferation of checkpoints
23Source: Dalberg analysis, survey and interviews
Transit time increases in Feb vs May by routeNumber of days and %increase in transit time reported by shippers and
transporters (N=157)
Observations:
• On average, most routes recorded a two-day rise in transittime one way, which is an average increase of ~4 days for areturn trip.
o “You may find at a checkpoint, queues that are 2-4kmlong, and each truck will have to be individually screenedby the police to determine what it is carrying before it isallowed to pass, this can result in delays of up to a week.”
• Most significant increases were along routes to Lagos,specifically Kaduna to Lagos (103%), Jigawa to Lagos (80%), &Sokoto to Lagos (79%). This is likely due to high trafficvolumes along these routes.
• Stakeholder interviews indicate that significant volumes ofagriculture produce are transported from Northern states toLagos and with mainly inputs being transported back to theNorthern states fromLagos.
o “We experienced that it took 10 days to turn around ourtrucks on trips to Lagos.’”
• Delays along routes to Lagos, Enugu and Port Harcourt havefar-reaching consequences for food security as such cities aremajor consumption, aggregation and redistribution centres foragri-produce to neighbouring states.
Transit time increases have significant impacts on logistics costs; left unmitigated, these could result in loss of business for transporters, as costs will impact viability
%Change
104%
64%
83%
59%
81%
105%
83%
59%
46%
51%
37%
71%
Transit time (Feb) Tr ansit time increa se
Jigawa to Lagos 3 3
Maiduguri to Lagos 3 2
Sokoto to Enugu 3 3
Maiduguri to Port Harcourt 3 2
Maiduguri to Enugu 3 2
Kaduna to Lagos 3 3
Sokoto to Lagos 3 2
Sokoto to PortHarcourt 3 2
Kano to Lagos 3 1
Kano to Enugu 2 1
Kano to PortHarcourt 3 1
AVERAGE 3 2

The majority (90%) of shippers also indicated they were facing more challenges with goods arriving on time
24
Perceptions on challenges faced by shippers across key routesNumber of survey respondents who noted an increase in each challenge following the
COVID-19 outbreak and resulting restrictions (N=50)
45 45
39
21 20
Goods arriving safely and undamaged
Finding someone to ship
goods
Other (primarily concerns
around demand)
Goods arriving on time
Negotiating an acceptable price
Despite not being asked explicitly, 20 respondents indicated concerns around finding demand. Some shippers have started selling goods at different locations, whilst others have reduced labour hours to match demand
Source: Dalberg analysis, survey and interviews, KPMG -How COVID-19 has changed Nigeria’s consumer goods & industrial markets –KPMG
90% 90% 78% 42% 40%% of
respondents
Observations:
• 45 (~90%of) shippers reported increasing difficulty in finding a transporter to ship their good, and with goods arriving on time. This echoes survey findings that transporters experienced significant (as much as 3-day increases in journey time) across all routes being investigated (slide 16). This appeared to be a comparatively bigger problem for transporters travelling across Kano to Lagos, Enugu & PH, Sokoto to Lagos & Enugu and Jigawa to Lagos routes.
• 90% of shippers also indicated increase difficulty in finding transporters to ship their goods. This appeared to be a comparatively bigger problem for transporters travelling across Kano to Enugu, Sokoto to Lagos, PH & Enugu, Maiduguri to PH and Jigawa to Lagos routes.
• These trends align with routes where transporters are experiencing the greatest increase in transit times (such as Jigawa to Lagos and Sokoto to Enugu) and spending longest at checkpoints (e.g. Sokoto to Port Harcourt).
• These trends also emphasize our interview findings that higher transportation costs may be driven by constrained coverage capacity (slide 12) and significant delays in journey time experienced by transporters (slide16).
• A significant number (40%) of shippers also indicated concerns around finding demand for their agriculture produce.
“Even the ways companies distribute their goods to the final consumers have also been affected by the pandemic. To this end, companies will no longer rely on the traditional channels of moving & selling their products to their consumers.” KPMG, May
2020

Survey data indicates that delays and cost increases experienced by transporters are heightened at COVID-19 checks at state borders
25
Perceptions on challenges faced by transporters across key routes%of survey respondents who noted an increase in each challenge following the
COVID-19 outbreak and resulting restrictions (N=107)
20%10%
39%
8%
71%26%38%
24%
58%
22%
54% 52%
37% 34%
7%
Finding goodsto transport onyour wayback
Crossing state borders
Protecting yourself and your goods on the road
Finding petrol or spareparts
Dealing withpolice checksand roadblocks
Source: Dalberg analysis, survey and interviews
Observations:
• 54% of respondents indicated a significant increase in difficulty crossing state borders (compared with only 7% who indicated an increase in difficulty dealing with police checks and roadblocks).
• Survey data also reveals an increase in proliferation and time spent at checkpoints, which may lead us to conclude that the checkpoints where people are experiencing significant challenges and resulting delays are those at inter-state borders which have arisen due to COVID-19 restrictions.
• Crossing state borders appears to be a comparatively bigger problem across the Jigawa to Lagos, Kaduna to Lagos, Sokoto to Lagos and Sokoto to Enugu routes.
• Transporters also indicated significant challenges in finding goods to transport back and in finding petrol or spare parts.
Much moredifficult
More difficult
Easier / no change
“Each state has its own rules, so as you travel between states you have to deal with their rules accordingly”
-Transporter“Though many of the checkpoints were just a few metres apart, the heaviest clusters of checkpoints on the route were at state boundaries. Here, the bribe is usually doubled to N1000 at each checkpoint before they were allowed through."
All Africa.Com, May 2020

Generally transporters are spending <1hour at police checkpoints, while they have to cross an average of 11 checkpoints per trip
26Source: Dalberg analysis, survey and interviews
15%13%16%
80%84%
20%
67%93%
7%
Jigawa to Lagos Kaduna to Lagos Kano toEnugu
74% 79%
26%
0%
Kano toLagos
74%
22%
Sokoto to Port Harcourt
4%
Kano toPort Harcourt
Sokoto to Enugu Sokoto to Lagos
96%
4% 0%
Maiduguri to Port Harcourt
31%
87%
52%
17%
26%
Maiduguri to Lagos
20%
13%
Maiduguri to Enugu
21%
59%
Time spent at checkpoints across each routeShare of respondents indicating how much time they spent at a checkpoint when travelling across each route
<1 Hour 1 - 4 Hours >4 Hours
Observations:
• Data was collected as respondents travelled across the 11 routes and on average respondents crossed 13 checkpoints (a total of 149 reports provided).
• 71% of respondents spent less than an hour at police checkpoints when travelling across key routes, however various routes and locations appeared more challenging including Maiduguri to Lagos and Enugu, and Sokoto to Port Harcourt routes.
• Longer time delays were particularly noted at inter-state borders. Based on survey results, longer time spent at checkpoints does not appear to be driven by worsening road conditions between February and May.
• The locations where multiple respondents indicated spending >4 hours at checkpoints include Zuba, Akure, Kano and Maiduguri.

Changes in road conditions appear to have had only a marginal impact on the transit time increases between February and May
27Source: Dalberg analysis, survey and interviews
-15
-7
7
-7
-1
-1
7
2
2
0
Other
Bad roads
Blockage on theroad
Flooded Road
Damaged Bridge
%Increase%Decrease
Observations:
• Although Southern Nigeria faced heavy rainfall in February-May, deteriorating road conditions were not a major contributor to increased travel times during thisperiod.
• In May, transporters reported that incidents with bad roads and blockages either fell or did not happen
• Respondents noted a marginal rise in flooded roads and damagedbridges between the months, while ‘other’ incidents were rare
“Roads are generally in bad condition so this was no more
challenging than usual.” Transporter
Causes of travel disruptions between February – MayDifference in #of respondents indicating road conditions affected their journey time
Happened one time
Happened more than onetime

Total number of trips completed across all routes decreased by 47%, with transporters mainly attributing this to delays at checkpoints
28Source: Dalberg analysis, survey and interviews
“The long delays at checkpoints resulted in less business, and fewer round trips, but we also just struggled to get
customers.” Logistics Operator
The decrease in the number of completed trips implies reduced revenue earning capacity for transporters.
Observations:
• Transporters indicated an overall reduction in trips between Feb and May. Given low volumes of baseline trips, small reductions likely have significant implications for transporter revenues.
• 80 of the total respondents indicated that the number of trips had decreased by between 1-5 trips, with 50% of these reporting a reduction by 3-5 trips.
• Transporters along Lagos & Sokoto routes reported the highest reductions in the number of trips completed, one way, likely due to high traffic volumes and a higher number of inter-state checkpoints.
• Logistics operators cited a few contributing factors to the reduced trip volumes including:
• Increased transit times resulting in delays in completing trips.
• Further delays in the loading of trucks as a result of bottlenecks in the supply chains, i.e. slower fill-up of trucks.
• Lower demand from customers for transporting goods, due to market closures and other disruptions.
Change in No. of Trips per Transporter in Feb vs May by routeAverage change in no. of trips, from Feb vs May vs Trips in May (N =107)
%Change
-76%
-73%
-62%
-58%
-57%
-47%
-52%
-43%
-44%
-22%
-17%
-47%
-4
-4
-3
-2
-2
-1
-1
-1
-1
-1
0
-2
6
6
4
4
3
3
3
3
2
3
3
4
Jigawa toLagos
Sokoto toEnugu
Kaduna to Lagos
Sokoto toLagos
Maiduguri to Lagos
Maiduguri to Enugu
Maiduguri to PortHarcourt
Kano to Enugu
Sokoto to Port Harcourt
Kano toLagos
Kano to Port Harcourt
Average
Change in trips in May
Average Trips in Feb

The reduced number of trips completed can also be attributed to challenges securing backhaul cargo from South to North
291 54 respondents in total provided data on fleet sizes. (1) Small transporters refers to transporters with fewer than 5 lorries. (2) Larger transporters are here defined as transporters with a fleet size of >5 lorries . Source: Dalberg analysis, survey and interviews
Jigawa to Lagos
Kano to Port Harcourt
Sokoto to Enugu
Sokoto toLagos
Sokoto to Port Harcourt
Kaduna to Lagos
Kano to Lagos
Maiduguri to Lagos
Maiduguri to PortHarcourt
Maiduguri to Enugu
Kano toEnugu
AVERAGE
92%
83%
88%
88%
80%
77%
92%
Perception of challenges faced in finding backhaul cargo by route (N =102)Proportion of transporters who experienced an increase in difficulty finding backhaul
Observations:
• >90% of transporters noted an increase in difficulty finding backhaul cargo, however the Jigawa to Lagos, Kano to Porth Harcourt, Sokoto to Enugu, Port Harcourt and Lagos routes appear to bemost affected.
• This may explain some of the price hikes we observe amongst transporters who indicated that they travelled along these routes in May (slide 12), as interviewees noted that often when transporters are unsure about finding backhaul cargo, they would increase their prices for the one-way trip to accommodate this risk.
• Of the large transporters identified, all of them noted an increase in difficulty finding backhaul cargo (vs 89% of small transporters). This may be due to less flexibility in pricing, contract obligationsand cargo type.
Breakdown of difficulty in finding backhaul cargo by transporter type (1 N = 54)Proportion of transporters who experienced an increase in difficulty finding backhaul “The market closures and increased delays at ports have
created disruption in the flow of goods. So finding backhaul cargo is more challenging as usual places don’t always have requirement for our services' is significant delays at loading zones such that sometimes you end up waiting for days”
Logistics Operator
89% 100%
11%
Small transporters
0%
Large transporters
Increase in difficulty
No change
s
3
10
4
5
15
12
15
14
10
4
10
9
No. ofrespondent
100%
100%
100%
100%
100%

93% of respondents indicated a decline in demand for their goods compared to trips made within the last month to May 2019
30
Perceptions of demand compared to similar period 2019, by route% of respondents indicating changes in loads by route (N=103)
Observations:
• A significant number of drivers (95/107) indicated a decline in demand for their services when compared to this time last year.
• This likely implies that changes in demand being noted are largely contributing to lower volumes (less trips and backhaul cargo). This may also be a contributing factor to the decrease in the number of trips and challenges securing backhaul.
• Some attributing factors cited in stakeholder interviews to the reduced demand include:
• Market closures disrupting trade.
• Unwillingness by customers to transport goods due to lack of clarity on rules / avoiding the risk of goods being impounded.
• Limitations on goods that can be transported as per COVID-19 regulations.
-100
-92
-75 17
-94 6
-86 14
-100
-93
-92
-100
-100
-93 7
-93 4
Kano toLagos
Jigawa to Lagos
Maiduguri to Enugu
Kaduna to Lagos
Kano toEnugu
Kano to Port Harcourt
Maiduguri to Port Harcourt
Maiduguri to Lagos
Sokoto toEnugu
AVERAGE
Sokoto toLagos
Sokoto to Port Harcourt
Less demand
More demand
Source: Dalberg analysis, survey and interviews
“Getting customers has been challenging, especially because some customers do not want to risk losing their goods as they
are not sure about the regulations, so we are finding fewer and fewercustomers”
TransporterShippers indicated challenges finding transporters (slide 17) and transporters also
indicating fewer customers. This might be indicative of market linkages challenges,with restrictions having potentially disrupted transporters and shippers linkages

While 28% more transporters were transporting crops in June, there was reduced movement of livestock and other products
31Source: Dalberg analysis, survey and interviews
Types of goods transported in Feb vs May by routeNo. of transporters transporting goods by type of goods (N = 107)
Observations:
• More transporters (13) reported that they transitioned from transporting livestock/other goods to crops in June. Crops cited mainly included less perishable grains such as rice and wheat. It is likely that transporters shifted to crops in response to demand-side pressures (due to overstocking/hoarding) and also because these were less risky permitted essential goods compared to livestock and other goods.
• Nearly half the transporters that initially transported livestock in February, reported that they did not transport livestock in June. Key attributing factors to the reduced movement of livestock are the delays in transit time and closure of markets. Stakeholders also indicated that livestock trading had also largely moved out of large markets and to on-farm sales.
• Similarly there was a fall in the movement of “other goods” from February to June. This can be attributed to the fact that these goods were likely classified non-essential goods.
4742
29
60
2519
Crops Animals Other
+28%
-40%
-34%
Feb
May
9
3
7
2
9
233 3
910 10
1
3
8
34 4 4
Jigawa to Lagos
Kaduna to Lagos
Kano to Enugu
Sokoto to Lagos
Kano to Lagos
Maiduguri Maiduguri Maiduguri to Enugu to Lagos to Port
Harcourt
Kano to Port
Harcourt
Sokoto to Enugu
Sokototo PortHarcourt
Crops Transported in Feb vs May by routeNo. of Transporters transporting crops by route (N =107)
“We are losing other sources of business because they are not essential goods and the market closures also mean we are struggling to find regular business, but every now and
again you hear of something and youchase that”
Logistics owner and producer
Feb
May
5 5

The movement of pepper, millets and onions has risen, while tomato, beans and some grains transportation volumes have fallen
32Source: Dalberg analysis, survey and interviews
Given that a large share of tomatoes and rice production comes from Northern states, the resultant impact on livelihoods on lack of access to markets could be
devastating for rice and tomatoes producers.
-100%
173%
26%
200%
0%
-2%
-34%
-50%
-24%
-37
57
75
88
-4
-34
-30
Tomatoes
0
Beans
Millet
Pepper
Onion
Grains
Soya Beans
Maize
Rice -86
Types of crops transported in Feb vs May by route (N= 56)Change in volumes of crops transported (MT)
Highly perishables
Non-perishables
“Already while you are transporting tomatoes you can lose 50% to wastage, now with the delays, losses would be even higher, and it is
just not worth it”
Agri- producer & truck owner
Perishables
Observations:
• Pepper, millet and onion transportation volumes have risen. This is partially driven by transporters diversifying their loads to include new crop varieties, given reduced transportation of livestock/other produce. Traders also indicated that the spike in onions and peppers is due to seasonality. Since onions are harvested in February-April, shippers may have increased volumes to reduce post-harvest losses from lockdown measures.
• Transporters indicated lower volumes of highly perishable Agri-produce (tomatoes) along all routes. Insights from interviews indicated that a large share of tomatoes for export and local consumption come from Northern states. As tomatoes are highly perishable, longer transit times likely disincentivised movement. The end of harvesting season for some tomato varieties and market closures, may have exacerbated this trend.
• Interviewees highlighted that reduced volumes in rice and grains are likely due to the increased costs of transportation that may have made local produce less competitive to import via Lagos.

Decline in volume of livestock being transported was attributed to falling demand in livestock and market disruptions
33
Observations:
• Across 6 out 7 routes with adequate survey data, volumes of livestock being transported declined following the COVID-19 outbreak and resulting government response. The most significant decreases are observed in the Kano to Lagos and Maiduguri to Port Harcourt routes.
• Our findings also indicate significant price and journey time increases in the Kano to Lagos route, which may be contributing to the decline in volumes of livestock being transported.
• From stakeholder interviews, we identified that volume of livestock transported fallen as a result of declining demand in livestock products and market disruptions:
o As the COVID-19 pandemic spread, many state governments including Lagos imposed restrictions on market open-days for bigger food markets, which significantly impacted trade volumes in livestock. Producers indicated that if they made it to market open days trade volumes were quite low as buyers did not come to the market.
o As a result of uncertainty regarding market trading days, some producers were also reluctant to transport livestock to the markets, in order to avoid losses ad unrecoverable costs.
o Additionally, meat and poultry products have a relatively
short shelf life and so are not purchased in bulk, particularly in Nigeria where electricity supply to homes is not constant.
Changes in volume of livestock being transported across selected routes: Feb
vs May%decrease in volume of livestock transported between past month and February;
Preliminary data, likely subject to change once more data is compiled1,2 (N=38)
RouteVolume
Decrease
Maiduguri to PortHarcourt 50%+
Kano to Lagos 50%+
Kano to Enugu 25-50%
Sokoto to PortHarcourt 25-50%
Kano to PortHarcourt 0-25%
Sokoto to PortHarcourt 0-25%
Legend: Low (0-25%) Moderate (25-50%) High (50%+)
“We are now rearing animals that we should have long sold, because there are no customers, one farmer told us of how a transporter lost his
livestock as it was being transported”
Producer
Source: Dalberg analysis, survey and interviews , The Poultry Site(1) Of the 11 routes covered only 7 routes provided sufficient data on livestock volumes
“Now in this situation, most of our farmers have lost between 35 and 40 percent of their resources because sometimes you cannot sell but they keep producing, Anything that affects poultry affects other sectors of agriculture,"
Poultry site, May 2020

Findings indicate a range of behavioural changes to mitigate impact of lockdown restrictions, although these are mostly impermanent
34Source: Dalberg analysis, survey and interviews
81
38
33
8
8
Nothing
Reduce number of trips
Changing route
Reduce spending onmaintainance
Traveling with assistants
Changes adopted in response to challenges encountered (N = 107) Frequency of responses indicating changes in behavior in response to COVID-19 Challenges
Observations:
• Most transporters indicated that they had not made major changes in response to Covid-19 challenges they had encountered.
• Those that had made changes indicated that they were changing routes or reducing spend on maintenance of vehicles. Reduced spend on vehicles is risky for transporters both in terms exacerbating wear and tear of vehicles and increasing risk of roadaccidents.
• Travelling with assistants although not mentioned frequently, is likely a response to longer travel times, to allow drivers to switch. Where this was not in place before, the longer transit times necessitated this adaptation.
“It is quite difficult to find alternative routes with good roads, so you have no choice but to use the routes that are congested or risk destroying your
vehicle on bad roads”
Logistics operator
Just staying at home 1
Where transporters made changes to mitigate impact of the lockdown, these are likely to have cost implications for transporters.

~50% of transporters surveyed indicated that they had begun working with a different type of customer
35
41% 47%
93%
59% 53%
I have started workingwith larger customers
8%
I have started working with
smaller customers
Many of my regular customers
have stopped working with me
Observations:
• Almost 50% of transporters surveyed noted reduced patronage from their regular customers following the COVID-19 outbreak and resulting lockdown. This challenge was more pronounced amongst transporters covering the Jigawa to Lagos (100%) and Kaduna to Lagos (77%) routes.
• From stakeholder interviews we identified a reduction in demand for agri-logistics and transportation services, particularly for fresh produce largely attributed to:
o Restrictions on the number of days out of the week that bigger food markets can operate, which significantly affected demand foragriculture products.
o Nationwide lockdowns and movement restrictions disrupting ability of farmers to get to their farms, and access affordable inputs.
o Uncertainty around government classification of ‘essential’ produce led to producers holding on to due to fear of goods being seized at checkpoints.
• 41% of respondents also noted that they had started working with smaller companies, suggesting an increased demand for last-mile logistics.
o As bigger food markets were closed, producers were tasked with supplying their produce directly to customers (e.g. through neighbourhood markets).
Changes in customer type, experienced by transporters%of survey respondents who stated that they had experienced changes in the
types of customers they were now serving in June, (N=107)
No
Yes
Source: Dalberg analysis, survey and interviews.
“As market conditions change you adapt and try to get business where you can.We were not prepared for this so one had to take
whatever business they got, big and small”
Producer and truck owner

To compensate for the reduced number of trips and longer transits, some transporters have maximised utilisation of truck capacity
36Source: Dalberg analysis, survey and interviews
Perceptions of load sizes compared to similar period 2019, by route%of respondents indicating changes in loads by route (N= 107)
Observations:
• Overall, 36% of total respondents indicated that they had retained similar loads compared to the same time last year and, an additional 28% managed to get fuller loads. However, 79% of transporters reported that they are using the same number of trucks compared to same time last year. This is likely to the fact that majority (67%) of truck owners have between 1-2 trucks.
• The increase in fullness of loads may be an indicates transporters maximising earnings for trips that they do manage to complete given unpredictable nature of business volumes in the COVID-19 context.
-40
-27
-17
20
-20
-15 6
Maiduguri to Enugu
Maiduguri to Lagos
Maiduguri to PortHarcourt
Sokoto to Enugu
Sokoto toLagos
Sokoto to Port Harcourt
AVERAGE
Fewer trucks
More trucks
Truck utilization compared to similar period 2019, by route%of respondents indicating changes in utilization by route (N= 89)
-53
-25
-50
100
-13
-40 20
20
42
50
20
-32 32
Jigawa to Lagos 67 Jigawa to Lagos 100
Kaduna to Lagos -31 15 Kaduna to Lagos
Kano toEnugu -64 9 Kano toEnugu 33
Kano toLagos -35 35 Kano toLagos -25 25
Kano to Port Harcourt 57 Kano to Port Harcourt
Maiduguri to Enugu
Maiduguri to Lagos
Maiduguri to PortHarcourt
Sokoto to Enugu
Sokoto toLagos
Sokoto to Port Harcourt
AVERAGE
Emptier
Fuller

Adoption of health protection measures seems inconsistent, with some transporters indicating insufficient knowledge of rules and regulations
37Source: Dalberg analysis, survey and interviews(1) Of the 11 routes covered only 7 routes provided sufficient data on livestock volumes
22% 35% 43%
Significant impact
Some impact
No impact
Changing my behaviour to protect my health and the health of my family %(N =107)Observations:
• Enquiries regarding knowledge of Covid-19 health and safety practices show that a significant number of transporters are yet to adopt safer practices.
o 22% or 24 of the transporters indicated that they had not
adopted any change impact on their behaviour since the lockdown.
o An additional 35% or 37 transporters indicated that they had made some adjustment but not significant.
o Given the high-exposure of transporters, adoption of “high-safety standards” is critical. They not only risk being infected but transmitting the virus across states.
o This also needs to be strongly enforced by authorities to mitigate wide-spread impact within this sector
o Stakeholder interviews also seem to indicate that rural farmers and transporters are of the view that Covid is not affecting rural communities
• The responses the regarding level of knowledge might be linked to the lack of change in behaviour by some drivers.
As the preferred mode of transport for essential goods, road transportation it is heavily relied upon for the continued supply of food, medicine, and other essential products. It
will be critical to reinforce safety standards within this sector to mitigate risk of wide-spread high transmission rates within this sector
16% 43% 41%
I know what coronavirus rules and regulations apply to me and my behaviour %(N =107)
Agree
Neither agree nor disagree / no opinion
Disagree
“We have not really conducted training as such on -COVIDsafety standards for drivers, we issued with PPE andgave
them brochures that explain but they already know”
Logistics operator
“ Corona yana Abuja”, essentially alluding to their belief that corona is in Abuja and not with them.”
Producer and transporter

Respondents were unwilling to provide an opinion on their perceptions of interactions with enforcement authorities
38
29%
57%
14%
Disagree 30%
Agree 26%
No opinion 45%
On my trips, I am surprised by different rules in different states(% of respondents) (N=107)
Small transporters Large transporters
Government officials generally enforce the coronavirus rules fairly(% of respondents) (N=107)
“You never know, what to expect on the road, it really depends who you encounter at the checkpoints and who
you can callon”
-Truck driver
Observations:
• Both large and small transporters appeared unwilling to comment on enforcement practices they experienced (~50%).
• Larger transporters alluded to fair practices by authorities more than smaller transporters. This may be because larger transporters would have formal means of identification and may have contacts that could assist at checkpoints.
• From interviewees we also observed that larger transporters (and manufacturers and FMCGs) were unwilling to comment on government enforcement. This could be out of fear of retaliation.
“We have had no trouble at all with authorities, we plan all our logistics ahead and at times get escorted to cross
checkpoints when we experiencechallenges”
- International Logistics Company
86%
14%
No opinion 45%
Agree 26%
Small transporters Large transporters
Source: Dalberg analysis, survey and interviews(1) Of the 11 routes covered only 7 routes provided sufficient data on livestock volumes
0%
Disagree 30%

Interviewees highlighted the key drivers and impacts of agri-logistics challenges, that require a response from actors across the VC (1/2)
39
Proximate causes of transport challenges Potential mitigationstrategies
1. Coordinated policy setting and execution -Better coordination between state and federal actors in policy-making and enforcement, by leveraging data and integrating response teams for a more coordinatedapproach.
2. Communication optimisation - Open and reciprocal channels of communication between the logistics sector & ground-level actors on broader COVID-19 rules, local contexts and safety measures.
3. Value chain coordination - Coordination amongdemand-side actors through digital channels.
1Federal Ministry of Agriculture and Rural DevelopmentSource: Agronigeria-COVID-19: Nanono Instates Joint Task Team to Facilitate Easy Movement of Food, Agric Inputs
Decentralized and reactive policy-development and enforcement
Lack of coordinationamong demand-sideactors
Limited data-collection and knowledge management
• Given the varied impacts of COVID-19 across states, the government has adopted adecentralised crisis management and policy-setting approach. This has resulted incontradictory rules and inconsistent enforcement at a sub-national level; permitrequirements and classifications for staff (e.g. drivers, truck crews) are unclear anddefinitions of essential goods vary between states. FMARD1 has established a multi-stakeholder taskforce, to mitigate these risks and to facilitate easy movement of Foodand Agric Inputs. However, this was a reactive measure in response to emerging sectorchallenges. The establishment of a semi-permanent capability at the PTF level wouldallow a more proactive approach and mitigate future risk should COVID impact worsenand as government works towards recovery. Additionally, this would likely ensureproactive and effective prioritisation of Agriculture needs in times of crisis
• As the crisis unfolds, there is a lag in the collection of micro-economic impact data toinform policy setting. Our engagements with experts in relevant Ministries indicatedthat this level of data collection remains limited. Consequently, policy setting is largelybased on health data (e.g. transmission rates), with insufficient/lagging information onmicro-economic impacts such as price changes, stock levels etc. This createsvulnerability to unforeseen isolated shocks that can have detrimental effects.
Inconsistent communication of COVID-19 response rules
• Nigeria’s COVID-19 policies and specific rules governing the agri-logistic sector areineffectively communicated to ground-level actors (i.e. drivers and checkpoint officials).Policy changes are often last-minute and unclear. This leads to inefficiencies, such asdelays at checkpoints, reduced transportation of certain crops/products and a lack ofawareness of broader safetymeasures.
• Lack of coordination among actors along the value chain leads to challenges inidentifying demand for various inputs/products, as well as market dislocation. Bothshippers and transporters have reported working with different types of customers anddifficulty coordinating with eachother.
While adjustments have been made to improve implementation of COVID-19 response strategies, and the impact lessened as measures have been relaxed, the risk remains of the necessity to revert back to stricter lockdown measures. Likewise, the sector recovery from COVID-19 impacts will require strong policies and capabilities in place to coordinate this.

Interviewees highlighted the key drivers and impacts of agri-logistics challenges, that require a response from actors across the VC (2/2)
40
Proximate impacts of transport challenges Potential mitigationstrategies
1. Data-driven response strategies - Data-driven decision-making / early-warning system at key agri nodes and value chain stages to facilitates a tailored responsestrategy.
2. Coordinated policy setting and execution –stronger consideration of end-to-end value chain requirements for optimal policy impact.
3. Value chain coordination - Collaboration with donors and private-sector actors to mitigate demand-side pressures, particularly for farmers and marketers along the value chain.
Unpredictable downstream impacts
• Given the lag in data on the impacts of COVID-19 on agricultural logistics across thevalue chain, the downstream impacts of the crisis remain unclear. For example, reducedtransportation can potentially deplete food stocks in major centres, reduce inputsavailable for planting season, undermine food security and exacerbate conflict risks inaffected areas.
Supply pressure
Demand pressure
• The COVID-19 crisis has exacerbated existing demand-side pressures in Nigeria. Risingfood costs, income loss and currency depreciation will likely threaten food security,reduce food consumption and overall demand for food transportation.
• Given low consumer affordability, retailers will likely absorb rising logistics costs. Thiscould threaten the commercial viability of retailers and reduce their logistics needs.
• Disruptions may result in low affordability of agricultural inputs, particularly as devaluedcurrency and higher-cost logistics may make inputs more expensive. This can deter low-income producers from cultivating produce and further exacerbate food shortages
• Trade shocks will gradually exacerbate demand-side pressures. Exports will likelydecrease due to delays in products reaching ports, reduction in cargo transportation andfalling demand from export markets. 80% of Africa’s agricultural exports go to regionsseverely affected by COVID-19. Imports could also be affected. While Nigeria has thehighest consumption of rice in Africa, imports from Asia are likely to fall in light of thecrisis.
• Forecasts indicate that falling demand in the transport & logistics sector couldpotentially trigger a decline in the size of labour-force. Labour loss may further increasedue to COVID-19 safety requirements and the heightened health risks faced byemployees.
• Interviewees further empathized that a reduction in the labour force could potentiallyinflate labour costs and reduce the supply of logistics provision. They cited wages asone of the drivers of cost increases, as shown on slide 13.
The reality of food scarcity is not farfetched within the Nigerian context and poor management of agricultural sector challenges will exacerbate this and broader economic challenges Nigeria is alreadyfacing.
Source: McKinsey & Company, Safeguarding Africa’s food systems through and beyond the crisis, 2020, Agronigeria-COVID-19: Nanono Instates Joint Task Team to Facilitate Easy Movement of Food, Agric Inputs

Contents
41
I
Research FindingsII
Context , Objectives andApproach
III Recommendations
IV Annex A & B

Interventions proposed are aimed at addressing challenges related to cost drivers, market coordination gaps and workforce protection
42
Bribes cited as a major contributor of transportation cost increases at inter-state cross-border check points
Lack of clarity on and disparate implementation of interstate movement regulations
Significant delays experienced at inter-state cross-border check points resulting longtransit times
Transporters indicated reduced demand for services due to less volumes of certainproduce, market closures and lack of backhaul cargo
Shippers indicating difficultiesfinding transporters to transport their goods
Lack of clarity in regards to market open days and trading requirements
Cost increases noted for North bound routes, with Lagos bound being the most affected
Findings Opportunity Areas for Intervention
Cost
drivers
Mark
et
co
ord
ination
gaps
Tactical Strategic
• Enforcement Integrity - mitigate prevalence of corruption at checkpoints by standardising trade requirements
• Streamlining trade procedures– reduce process bottlenecks at checkpoints along key agri-trade routes to reduce delays at checkpoints
• Streamline messaging– ensure messaging is clear and consistent with regards to requirements formovement of goods across key trade routes
Coordinated policy setting and execution -Better coordination between state and federal actors in policy-making and enforcement, by using data on the impacts on transport &agricultural sectors.
Data driven response strategies, leveraging digital technology - leveraging data-driven decision-making / early-warning system at key Agri-nodes and value chain stages to facilitates a tailored responsestrategy..
1. Coordinate re-opening of key markets tomitigate supply chain bottlenecks
2. Improve knowledge and information sharing for actors across the VC
3. Safeguard fertilizer and inputs availability to mitigateaffordability constraints due to logistics cost increases
Value chain coordination Coordination among demand-side actors through digital channels and Collaboration with donors and private-sector to mitigatedemand-side pressures, particularly for farmers and marketers along the valuechain

Reinforcement of occupational safety standards is key to mitigate risk of high infection and transmission rates in the logistics sector
43
Communication optimisation Openand reciprocal channels ofcommunication between the logistics sector & ground-level actors on broader COVID-19 rules, local contexts and safety measures.
Opportunity Areas for Intervention
Tactical Strategic
Limited behaviour modification to adopt Covid safety measures
Limited knowledge of Covid safety measures for logistics operators
Findings
Work
forc
e
Pro
tect
ion
• Leverage grassroots communications channels to ensure messagingreaches all levels
• Support logistics workers with occupational health and tailored guidelines regarding safety measures .

LINKS can serve a catalyst towards solution development, leveraging existing platforms to convene key actors
44
Opportunity AreasforIntervention
Recommendations PriorityPotential impact&
feasibility
1. Standardise interstate border checkpoint procedures
• LINKs could work with the Joint-task-team-to-facilitate-easy-movement-of-food-agric-inputs, to establish a coalition focused on standardizing procedures across the Priority Agri-Trade Corridors (PATCs). PATC states can standardise the requirements for movement ofessential goods / agri-goods at all checkpoints in terms of the paperwork that is required,and the format that is accepted. For example a standard pass can be issued for transportersacross the PATC states to allow for ease of movement of goods across these states
• Where possible use of technology to issue and process documents should be adopted e.g.technologies such QR codes, with consideration for ease of implementation across allstates
Key actors: FMARD Joint Taskforce, Ministry of Police Affairs, Nigeria Governors Forum,Federal Ministry of Industry, Trade and Investment
• Will require coordination
between agencies in the States
and Local GovernmentAreas
• Significant stakeholder
management will be required to
obtain buy-in and political
commitment to standardising
processes
2. Reduce steps in the border checking process• Reducing time spent at borders will require streamlining processes to enhance efficiency.
Border control processes can be consolidated to remove potentially redundant and/orduplicative steps that can be consolidated into fewer steps. For example security checkprocesses and border clearance for goods can be consolidated into a single step process atall Border Checkpoints vs the current structure where multiple officials check multipletimes.
• LINKS could potentially commission a rapid study of low-hanging fruits to identify processinefficiencies and optimisation opportunities to guide implementation. Interventions tosustain and enhance the efficiency of logistics operations are critical in avoiding substantialdisruption todistribution networks.
Key actors: FMARD Joint Taskforce, Ministry of Police Affairs, Nigeria Governors Forum,Federal Ministry of Industry, Trade and Investment, Road Construction Companies (RCCs),Nigerian Vigilante Group, the Federal Road Safety Corps, the Nigeria Security and CivilDefence Corps
• Changes are of low complexity, but obtaining buy-in could be challenging. May be met with resistance as this may potentially reduce control different agencies exert over different processes and “shakedown opportunities”
• Strong process change management will also be required to ensure changes are embedded / adopted
• Enforcement Integrity -mitigate prevalence of corruption at checkpoints
• Procedure streamlining–reduce process bottlenecks at checkpoints to reduce time spent at checkpoints
M LLegend H
Tactica
l

Supporting the development of a communication strategy to enhance credibility and reliability of COVID-19 messaging is key
45
Opportunity AreasforIntervention
Recommendations PriorityPotential impact&
feasibility
3. Centralise and standardize messages
• LINKS could work with FMARD Joint Taskforce to develop a streamlined sector-specificcommunication strategy that can look to enhancing credibility and reliability ofmessaging. Such a strategy should look to identify the different types of messages andappropriate dissemination mechanisms for those messages i.e. what should becommunicated at PTF level vs FMARD or NGF level.
• The strategy should articulate communication protocols more specifically for the logisticssector, as input into the broader PTF communication strategy. Messages should becategorised accordingly in terms of broad directional movement of goods messages thatshould be communicated at PTF level vs those that should be more tailored andcommunicated by the FMARD Joint Taskforce.
• The FMARD task force could serve as the single source of messaging regarding all
Agriculture value chain matters so that it is consistent and reliable. To enable this adigital platform can be established where regular industry updates are posted.
• In addition, LINKS could also support with developing guidelines and formats forcommunication e.g. standard format for government gazettes on regulations affecting thelogistics sectors. Messaging can be nuanced to factor in state-specific requirements butthis should be consolidated into single government gazettes and issued as the onlyrecognizable and reliable information.
• Additionally to ensure compliance with FMARD guidelines ongoing inspections andreports must be provided to FMARD to enable timely correction of challenges
Key actors: FMARD Joint Taskforce, Presidential Task Force, Nigeria Governors Forums,Ministry of Police
• Strong sponsorship from PTF to
ensure alignment in messaging as
it is cascadeddownwards
• Stakeholder alignment in the
development of streamlining and
ownership of messaging will be
key
• Streamline messaging–ensure messaging is clear and consistent with regards to requirements for movement of goods across key traderoutes
M LLegend H
Tactica
l

DFID can facilitate a more coordinated approach across the value chain to mitigate market dislocation impacts
46
Opportunity AreasforIntervention
Recommendations PriorityPotential impact&
feasibility
4. Synchronise the opening of key markets across Nigeria to manage localized supply-chain
bottlenecks that are likely to persist until the end of 2020—or into 2021
• LINKS could lobby PATC states to establish a coalition to coordinate/synchroniseimplementation of lockdown restrictions. This can include synchronising market open daysacross states and related border closures. This can also extend to include North Eastern stateskey markets.
• DFID can support FMARD with the development of a standardised schedule/per lockdownstage that specifies market closures and opening times, informed by various supply chaindynamics across key trade routes. Working with farmer associations and extension agents tocoordinate market activities and ensure farmers/ shippers are well informed will be key
Key actors: FMARD Joint Taskforce, Market authorities, Farmers Associations, PTAC state agenciesand Local GovernmentAreas.
• Key immediate term method to
stimulate demand.
• Will requirecoordination
between markets.
• May be challenging to selectguiding-market schedule and ensure adherence, given differing trade priorities and patterns across states/cities.
5. Enhance access to market information for actors across the value chain to ease supply chainbottlenecks
• DFID Nigeria can facilitate partnerships between government and key VC actors to closeemerging market linkage gaps. There are VC actors that can be incentivized to leverage theirplatforms to help close these gaps and better coordinate shippers and transporters.
• VC actors DFID can engage include Babban Gona AFEX, Kobo 360, Farmcrowdy, Lori
Systems, and the Central Bank of Nigeria to share their databases of extension agents, brokers,farmers and operators to help provide information to connect buyers, sellers and transportersacross key markets.
• Additionally these actors can help create a data sharing platform that provides real-timeupdates on agricultural data on crop prices, demand levels, market closures etc. FMARD JointTaskforce should be encouraged to lead information gathering efforts and work with industryassociations to share tailored updates with networks of transporters and farmers via communitynetworks, newsletters, SMS or Facebook.
Key actors: FMARD Taskforce, CBN, Private companies (Lori Systems), Industry associations
• Reduces burden of data-collection by leveraging existing data sources. In light of COVID-19, public and private actors will likely cooperate.
• Synthesising the data may be time-consuming.
• Coordinate re-openingof
key markets to mitigate supply chain bottlenecks.
• Improve knowledgeand
information sharing for actors across the VC to close emerging market linkage gaps
M LLegend H
Tactica
l

DFID could encourage actors to better coordinate the distribution of inputs to mitigate impact of increasing logistics costs on availability
47
Opportunity AreasforIntervention
Recommendations PriorityPotential impact&
feasibility
6. Prioritise facilitating delivery of inputs ahead of the 2020-21 planting season in Northern
Nigeria
• To prepare for the upcoming plating season in Northern Nigeria, safeguarding availability
of fertilizer and other inputs (particularly those that are imported) will be key to reducing
the risk of food shortages in the region. Given likely impact of the currency devaluation on
cost of inputs, it will be key to mitigate logistics exacerbating these costs.
• DFID could lobby actors in the distribution of inputs VC to better coordinate the logistics
to mitigate impact of increasing logistics costs on availability of inputs. Better coordination
of logistics can also help ensure transporters have backhaul cargo as most inputs move
South to North
• DFID could play a role in supporting government to mitigate potential shortfalls in
availability by leveraging databases that may be put in place with partners (seerecommendation 5) to support with tracking distribution and creating feedback loops with
farmers to ensure adequate reach. Additionally such platforms can be leveraged to help
ensure that these inputs reach farmers in a timely manner, limiting the risk associated with
delays
• DFID can also proactively identify aid agencies (e.g. USAID WATH), government actorsand initiatives that are already safeguarding efforts and support with enhancingdistribution into more remote areas (key producing markets) in the North (KKJ states).
• DFID can outline opportunities for collaboration with identified actors to enhance theavailability of quality fertilizer, to compensate for planting season shortages. For example,it can provide recommendations to the Ministry of Agriculture on how to partner with theFertiliser Financing Mechanism (AFFM) to expand the reach of the $2.2m trade-creditguarantee project which aims to provide fertiliser suppliers in Nigeria.
Key actors: FMARD Joints Taskforce, Donors, Agencies in the States and Local Government
• Need to implement quickly, in light
of upcoming plantingseason.
• Easy to identify relevant agencies
and actors.
• Scare funding may reduce the
scalability of initiatives.
• Safeguard fertilizerand inputs availability to mitigate affordability constraints due to logistics cost increases
M LLegend H
Tactica
l

Strengthening the network database and using sector specific channels is key to ensuring Covid-19 messaging reaches grassroots levels
48
Opportunity AreasforIntervention
Recommendations PriorityPotential impact&
feasibility
7. Optimise reach of Covid-19 messagingby leveraging existing communication channels
• DFID can work with industry associations to identify key communication channels forground-level actors i.e. market traders, checkpoint officers, drivers and integrate theseinto existing communicationschannels.
• As part of the development of the communications strategy DFID could outline abroader range of channels that can be leveraged to ensure wider reach. This can includetapping into extension agents, farmer associations and social media platforms such assuch as Facebook, SMS, Whatasapp or calls as well as radio stations that ground-levelactors often rely on for information.
• Actors such as National Union of Road Transport Workers or the Federation ofAgricultural Commodities Association of Nigeria, AFEX, Babban Gona, Farmcrowdy andCellulant have existing VC-actor databases and established channels that can be tappedinto.
Key actors: Union of Road Transport Workers or the Federation of Agricultural CommoditiesAssociation of Nigeria, Farmer Associations, Private Companies, Agencies in the States andLocal Government Areas
• Relatively easy toimplement
with support from relevant
industry actors
• Updated information on rules
and guidelines however, make
be difficult toaccess
• Leverage grassroots communications channels to ensure COVID-19rules reach ground-level actors.
M LLegend H
Tactica
l

DFID could engage experts to support with the development of occupational health and safety guidelines that are sector specific
49
Opportunity AreasforIntervention
Recommendations PriorityPotential impact&
feasibility
8. Develop tailored messaging for the logistics sector
• DFID can support the development of worker protection guidelines specific to thelogistics sectors that can be widely distributed. Such guidelines should considerguidelines for employee screening, safety precautions at different “high risk zones”, adpositive response plans / measures that logistics sector operators can take advantageof.
• Given that transporters can find themselves affected by COVID-19 symptoms enroute,it will be important to ensure they have adequate information regarding how to safelyaccess medical services in different cities/towns.
• Extensive distribution of this information and translation into as many languages aspossible will be critical to ensure messages are impactful, and they result in widespreadbehaviour modification.
• For more formal operators/ owners of larger fleets, these guidelines could include riskassessment and management tools. These can enable companies/ truck owners toassess their COVID-19 related risks and put in place plans and controls to mitigatethose risks
Key actors; Industry Associations, Occupational Health and Safety Experts, FMARD, Joint Taskforce, Farmer Associations, Extension service agents
• Relatively limited complexity in
terms of development of tools.
Increasing complexity may be in
regards to disseminating tools and
tracking changes in behaviours
(adoption levels)
• Support logistics workers with occupational health and tailored guidelines regarding safety measures.
M LLegend H
Tactica
l

Harmonisation of policy setting and responses is key to safeguarding the agriculture sector during and beyond the crisis
50
Support government to establish clear COVID-19 operational guidelines. Standardization and streamlining of trade
Coordinated policy procedures and enforcement rules can contribute to expediting movement of goods while mitigating health and
setting and execution security risks. This can include implementing processes that allow low-risk critical supplies to quickly pass clearancecontrols, standard operating hours across all checkpoints for critical supplies to allow business continuity and greater
Better coordination between use of ICT reduce contact while increasing efficiencystate and federal actors inpolicy-making and enforcement, Support government to establish a central food security Data-Center with digital tools and data-gathering capabilities
by using data onthe impacts to manage food availability, accessibility, and affordability in a robust manner. This should serve to enable the PTF to
and links to transport & be proactive in identifying “hot spots” of shortages or hoarding, and in intervening where necessary. Such a Center
agricultural sectors. should be focused on tracking ongoing indicators to ensure continuity of the agricultural and food system and identifynecessary interventions to mitigate risks. Additionally looking forward to the next harvesting and planting seasons, a Data Center could track availability and distribution of agricultural inputs, ensure that critical value-chain actors (such as seed inspectors, extension agents, and traders) are able to work safely, and ensure that key produce markets are open.
Encourage government to consider partnering with private sector and donor VC actors to enhance micro- data collection capacity, particularly those with the capabilities to do so e.g. Kobo 360. additionally there are existing platforms that collect overlapping data that government could leverage to enhance quality of input data e.g. Famine Early Warning Systems Network. Partnership will also help strengthen these capabilities within via skills transfer to government and involved private sector actors
Lobby government to establish a semi-permanent national food-security response unit. Expand or build on the COVID-19 Presidential taskforce and Joint Task Team to Facilitate Easy Movement of Food, Agric Inputs capabilities to include /establish a food-security or agricultural response unit as a centralized strategic and planning hub, with sub-unit focused on various elements of food security. Elevation to the PTF level combined with representation from relevant Agriculture, Trade and Enforcement Ministries within such a unit would be key as well to ensure decisions are comprehensive and that critical food security matters are prioritised. Such a structure should also look beyond the COVID-19 impact but recovery as well.
Enhancing response coordination will present some level of difficulty for DFID given the need for intervention at a national level. However, the interventions not only present opportunities to mitigate immediate risk, but to also develop capabilities that can be leveraged for recovery and growth beyond the crisis.
Opportunity AreasforIntervention Recommendations Potential Impact
Stra
tegic
Medium complexity / impact Low complexity / high impactLegend High complexity/ Low impact
Impactopportunity
Feasibility

Enhancing effectiveness of messaging is important to mitigate corruption and encourage adoption of safer practices
51
Communication optimisationOpen and reciprocal channels of
communication between the
logistics sector & ground-level
actors on broaderCOVID-19
rules, local contexts and safety
measures.
Leverage localized and VC actor communication channels, to ensure broader reach of communication particularly to various ground-level actors (i.e. SHF, traders, checkpoint officers, drivers). Strengthening databases and developing long-term mechanisms to identify and engage VC actors will be key in the event of future crisis or national level coordination requirements.
Centralize dissemination of information on policies for the agriculture and logistics sector to enhance credibility by establishing a single source of true information. To reduce uncertainty around transport rules and prevent delays, DFID can work with ministries to develop a credible, centralized information source that provides up-to-date insights about transport restrictions. Guidelines should be synchronized at a federal level and cascaded down to the state level. This initiative should help mitigate corruption at checkpoints across the Agri-logistics sector.
Tailor messaging to the logistics sector. National policy updates and communications should be sector-specific and tailored to the needs of the logistics sectors. These should include updates to industry safety protocols, coordination and implementation at state-specific implementation. Additionally reporting measures should be activated to ensure visibility of compliance with protocols
To reduce logistics bottlenecks, DFID can leverage existing communications channels to disseminate credible information on COVID-19 rules to the logistics sector and ground-level actors. Communication optimisation, however, requires centralisation of information at a national level, which may be challenging.
Potential ImpactOpportunity Areasfor
InterventionRecommendations
Stra
tegic
Medium complexity / impact Low complexity / high impactLegend High complexity/ Low impact
Impactopportunity
Feasibility

Enhanced coordination between demand-side actors could alleviate the effects of COVID-19 across the value chain
52
Value chain Encourage data-sharing. Encourage actors along the VC to share data on publicly available platforms e.g. social mediaplatforms. This could include data on measures to mitigate COVID-19 challenges as well as market data such as
coordination commodity prices, stock availability, market open days etc. LINKS could work with companies such as Lori Systems,
Coordination among demand- and leverage insights from its logistics platform, to establish a database of price reports to facilitate trade and
side actors through digital financing.
channels and collaboration with Establish feedback loop platforms with value chain actors. Establish mechanisms for engagement with private sector donors and private-sector to actors via existing community or sector channels, including industry associations like the National Association of Road mitigate demand-side pressures, Transport Owners (NARTO), Nigeria Agro-Input Dealer Association (NAIDA) etcparticularly for farmersand
marketers along thevalue chain. Safeguard fertilizer availability. To mitigate demand-side pressures on the sector, DFID can work with logistics, donorsand government partners to enhance availability of quality fertilizer, to compensate for planting season shortages.
Encourage shift to last-mile logistics. Lockdown measures have increased demand for last-mile delivery and E-commerce. This creates a longer-term opportunity for smaller and informal operators to adapt their business models to new demands. While business models may not be reformed immediately, LINKS can increase awareness of the potential for the smaller transporters and connect them to potential customers (retailers and traders).
Trade Financing and Inventory Support to mitigate demand side pressures: Challenging times such as this pose significant risks to the availability of financing as banking and non-banking financial institutions limit credit provision to the most liquid and stable businesses and reduce the risk appetite undertaken in previous periods. This means that the processing companies and other exporting agents in the ecosystem will witness a significant decline in the trade and inventory credit available to conduct business effectively. Two key recommendations will be the provision of credit lines to companies and FMCG processors operating in the country and the execution of export credit guarantee structures. These solutions will provide the dual benefit of sustaining the operations of the companies and ensuring that they continue to procure the commodities needed as a nation. In addition, the provision of the export support, vis-à-vis the provision of guarantee and/or insurance to exporters operating in the country, will help to create FOREX in the system.
Potential Impact
DFID can promote data-sharing and collaboration between private and public sector actors across the value chain, to mitigate demand-side pressures. This requires engagement with a variety of stakeholders to ensure the effective implementation of initiatives.
Opportunity AreasforIntervention Recommendations
Stra
tegic
Medium complexity / impact Low complexity / high impactLegend High complexity/ Low impact
Impactopportunity
Feasibility

Contents
53
I
Research FindingsII
Context , Objectives andApproach
III Recommendations
IV Annex A & B

Annex A: Several learnings emerged from this first test of the survey -we recommend some design adjustments for any future rounds
54Source: Dalberganalysis
Sampling Method
Include marketers/ traders to the survey sample• Transporters were unable to provide accurate information on changes in the price of goods transported. Since traders factor in
transport costs when setting prices, adding them to the survey sample would have deepened our understanding of the impact of changing logistics costs.
• Speaking with traders from the trade centres in the North and South may have given us more complete data on price differences and baseline costs across key trade routes.
Share quantitative survey with logistics aggregators and value chain actors• As an alternative to adding another sample, private companies that collect this data can also be leveraged as a source of
secondary data. This can be achieved via a structured quantitative survey questionnaire via email, to give them ample time to share more complete and specificdata-points.
Research Design Areas of improvement
Survey Design
Reduce the number of questions• Given that interviews will likely need to remain telephonic, shortening the questionnaire would be advisable to enhance
completeness particularly for a large sample size of respondents. Asking fewer, more specific questions would reduce duplication (and produce less conflicting data points) and enhance internal consistency of the survey tools.
• In shortening the questionnaire consideration may want to be given as to which questions as best positioned with which sample audience.
Interviews
Timing of interviews• Recommend that interviews lag behind the survey process. Conducting interviews halfway through the survey process would
enable researchers to probe emerging trends and clarify specific issues with interviewees

Annex B: Our desk research produced a mix of intervention approaches, which we evaluated for their potential impact and feasibility
55
Coordination
• Government provides information and support services to mitigate and / or remove bottlenecks/ reduce health risk.
Direct Involvement
• Government intervenes directly, redeploying government resources to close emerging gaps and constraints.
Subsidisation
Intervention approaches1
• Financial support to subsidisecosts for key actors along keyagri-value chain actors.
Evaluated based on initial assessment of feasibility and impact opportunity2
Impact
opport
unit
y
(IO
)
Feasi
bili
ty(F
)
Agri-logisticsInterventions
Will this intervention help the bottom line of logistics
providers directly and restore regular logistics services?
Agri-Value Chain Will this intervention stimulate demand for logistics in
interventions the value chain in a way that helps logistics providers?
Cost neutrality Can the intervention be achieved at acceptable cost?
RelevanceCan the learnings be extrapolated for the Nigerian
context?
Ease of implementation
Is the level of effort required to achieve outcomes
reasonable?
Source: Dalberg analysis, survey and interviews
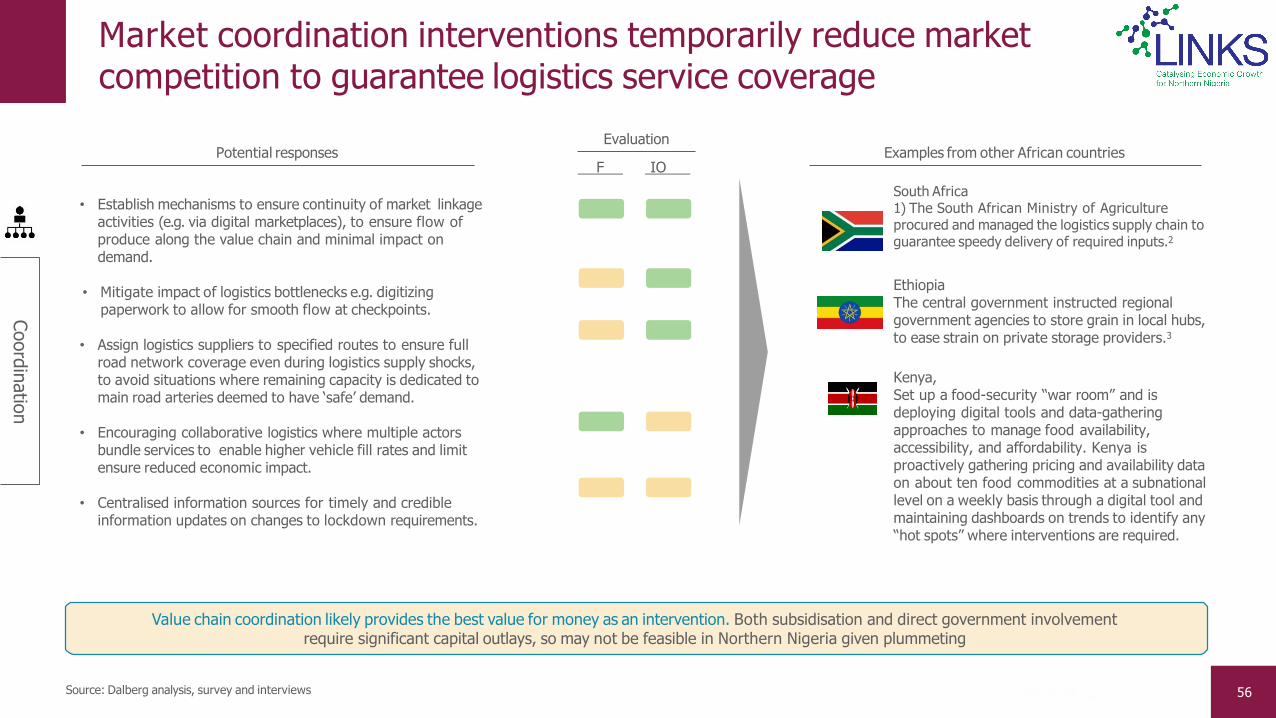
Market coordination interventions temporarily reduce market competition to guarantee logistics service coverage
56
Coord
inatio
n
• Establish mechanisms to ensure continuity of market linkage activities (e.g. via digital marketplaces), to ensure flow of produce along the value chain and minimal impact on demand.
• Mitigate impact of logistics bottlenecks e.g. digitizingpaperwork to allow for smooth flow at checkpoints.
• Assign logistics suppliers to specified routes to ensure full road network coverage even during logistics supply shocks, to avoid situations where remaining capacity is dedicated to main road arteries deemed to have ‘safe’ demand.
• Encouraging collaborative logistics where multiple actors bundle services to enable higher vehicle fill rates and limit ensure reduced economic impact.
• Centralised information sources for timely and credible information updates on changes to lockdown requirements.
South Africa1) The South African Ministry of Agriculture procured and managed the logistics supply chain to guarantee speedy delivery of required inputs.2
EthiopiaThe central government instructed regional government agencies to store grain in local hubs, to ease strain on private storage providers.3
Potential responsesEvaluation
F IOExamples from other African countries
Value chain coordination likely provides the best value for money as an intervention. Both subsidisation and direct government involvement require significant capital outlays, so may not be feasible in Northern Nigeria given plummeting
Source: Dalberg analysis, survey and interviews
Kenya,Set up a food-security “war room” and is deploying digital tools and data-gathering approaches to manage food availability, accessibility, and affordability. Kenya is proactively gathering pricing and availability data on about ten food commodities at a subnational level on a weekly basis through a digital tool and maintaining dashboards on trends to identify any “hot spots” where interventions are required.

Direct interventions have been a mix of health measures and value chain interventions to mitigate demand-side and operational logistics impact
57
Dire
ctIn
volve
ment
• Distribution of PPE directly to workers and enforcing adoption of safety measures in work spaces (e.g. masks for drivers, ancillary workers, etc.) to ensure limited risk of transmission.
• Redeploy public resources towards ensuring logistics continuity, e.g. by deploying publicly owned vehicles for ag logistics or assigning soldiers to infrastructure maintenance.
• Temporarily converting public facilities to grain storage to mitigate potential loss of produce and allowing farmers to share these services.
• Pioneering rapid adoption of digitization along the value chain and promoting use e.g. digital payments to replace cash at weighbridges, borders, digital ID tags to identify verified drivers and ‘trusted traders’ and digital cargo registration forms instead of in-person paperwork.
Potential responsesEvaluation
F IO
RwandaFaced with shortages of agricultural labourers due to movement restrictions, the Rwanda Agriculture Board (RAB) has deployed 113 tractors to farms across Rwanda to help on farm and with logistics.4
EthiopiaThe central government instructed regional government agencies to store grain in local hubs, to ease strain on private storage providers.3
CameroonEssential goods are now eligible for digital pre-registration at ports and major inspection hubs in Cameroon, allowing fast-tracking.3
Examples from other African countries
End-to-end approaches that take into consideration the impact across the agricultural value chain, are effective in identifying specific interventions at different stages of the value chain to mitigate disruption.
Source: Dalberg analysis, survey and interviews

Subsidisation seeks to let market forces guide resource deployment, but shields the worst-hit groups from hardship via temporary payments
58
Subsid
isatio
n
• Subsidise logistics companies, e.g. by setting income guarantees for logistics routes.
• Distribute emergency funds directly to smallholder farmer to mitigate increased costs for inputs and logistics.
• Distribute subsidies to manufacturers and / or distributors or essential agricultural goods, such as inputs and farm equipment.
• Subsidize costs of PPE to ensure business owners acquire PPE for theirworks.
• Buy and distribute agricultural inputs to smallholder communities cut off from regular supply.
KenyaPresident Kenyatta has announced that~USD 65M in e-vouchers will be distributed to~200,000 Kenyan smallholder farmers to subsidise input purchases.1
CameroonEssential goods are now eligible for digital pre-registration at ports and major inspection hubs in Cameroon, allowing fast-tracking.3
Potential responsesEvaluation
F IOExamples from other African countries
Subsidisation has mostly focused on smallholder farmers and vulnerable workers, to ensure that the most economically vulnerable groups are protected from the negative side effects of lockdowns. However, it is less likely to be feasible in Nigeria given government’s limited fiscal capacity
Source: Dalberg analysis, survey and interviews