Embed Size (px)
Citation preview
Cardiol Clin 25 (2007) 15–33
Assessment of Ventricular Functionwith Cardiovascular Magnetic Resonance
Thomas F. Walsh, MDa, W. Gregory Hundley, MD, FACC, FAHAa,b,*aDepartment of Internal Medicine, Wake Forest University School of Medicine,
Bowman Gray Campus, Medical Center Boulevard, Winston-Salem, NC 27157-1045, USAbDepartment of Radiology, Wake Forest University School of Medicine, Bowman Gray Campus,
Medical Center Boulevard, Winston-Salem, NC 27157-1045, USA
Management of patients who have cardiovas-cular disorders depends on assessments of globaland regional left ventricular (LV) and right
ventricular (RV) function. The high spatial andtemporal resolution of cardiovascular magneticresonance (CMR) images makes it well-suited for
use in the assessment of RV and LV function.This article reviews CMR methods used to assessregional and global ventricular function.
Image acquisition techniques
Gradient echo
Gradient echo, also known as fast low-angle
shot or FLASH [1] imaging, is the most exten-sively studied technique for assessing ventricularwall motion, volumes, and ejection fraction [2].
With gradient-echo imaging, the movement ofthe blood pool provides bright contrast againstthe gray appearance of the myocardium [3]. Previ-
ous studies have demonstrated the utility of gradi-ent-echo imaging in the assessment of RV and LVvolumes, mass, and ejection fraction [4–10].
Dr. Hundley is supported in part by National
Institutes of Health R21CA109224, and R21/
R33CA121296, and an industrial grant from Bracco
Diagnostics.
* Corresponding author. Department of Internal
Medicine (Cardiology Section), Wake Forest University
School of Medicine, Bowman Gray Campus, Medical
Center Boulevard, Winston-Salem, NC 27157-1045.
E-mail address: [email protected]
(W.G. Hundley).
0733-8651/07/$ - see front matter � 2007 Elsevier Inc. All r
doi:10.1016/j.ccl.2007.01.002
True fast imaging with steady-state free precession
Fast imaging with steady-state precession re-focuses the signal between excitations resulting inheightened blood pooldmyocardial tissue con-
trast [11]. This technique can be used to acquirecine images with short repetition (!3 millisec-onds) and echo (!1.5 milliseconds) times [12–
16]. As can be seen in Fig. 1, the contrast betweenthe LV endocardial surface and blood pool ap-pears high even when LV systolic function is
reduced [17].
Echo planar imaging
Gradient echo planar imaging (EPI) sequencesacquire single snapshots of LV wall motion during
40- to 60-millisecond intervals. By placing theseacquisitions in series, LV wall motion can bevisualized in near real time. Importantly, chemical
shift artifacts, and the relatively long temporalresolution of current techniques (60 milliseconds)inhibit identification of end systole for determi-
nation of ejection fraction and LV end systolicvolume when heart rates are high [18].
Sensitivity-encoding scheme
With the sensitivity-encoding scheme (SENSE),the resonance signal is encoded by spatially varyingthe receiver sensitivity of the phased array elements[19]. Using simultaneous signal acquisition with
multiple parallel receiver coils, the speed of datacollection is not limited by sequential data fromgradient encoding acquisitions. For this reason,
scan times can be reduced by a factor related tothe number of coils in the array [20,21]. In one study
ights reserved.
cardiology.theclinics.com
16 WALSH & HUNDLEY
Fig. 1. Gradient echo and steady-state free precession. Images from a patient who presented to an emergency room with
chest pain. The top panel is a gradient echo also known as a fast low-angle shot (FLASH) image. The bottom panel
illustrates the superior image quality of SSFP. (From Moon JC, Lorenz CH, Francis JM, et al. Breath-hold FLASH
and fast imaging with steady-state precession cardiovascular imaging: left ventricular volume differences and reproduc-
ibility. Radiology 2002;223:789–97; with permission.)
by Pruessmann and colleagues [22], a temporal res-olution of 13 milliseconds was acquired with threeparallel slices. This technique may lead to furtherimprovements in providing real-time images of car-
diovascular function.
Tissue tagging
With myocardial tissue tagging, radiofre-quency pulses are used to create regular darkbanks of selective saturation before initiation of
the remainder of the imaging sequence. Conse-quently, motion of material can be tracked as thesaturation bands deform [4]. Using this technique,
termed spatial modulation magnetization(SPAMM), myocardial contraction or relaxationcan be quantified. Tagging bands usually disap-
pear after 400 to 500 milliseconds. Therefore atagging grid can be obtained, followed by asaturation pulse (termed: complimentary spatial
modulation magnetization [CSPAMM]) to createa negative grid in the second or diastolic portionof the imaging acquisition (Fig. 2) [23–25].
Displacement encoding with simulated echos
Recently, a new technique termed displace-ment encoding with simulated echoes (DENSE)has been described that allows one to track
myocardial motion data using phase-recon-structed images. Similar to tagging, DENSE usesspatial modulation of magnetization to position
encode magnetization at a point in time andfollow tissue displacement during a subsequentportion of the cardiac cycle [26,27]. Compared
with CSPAMM, DENSE allows one to differenti-ate LV regional function within the endocardium,midmyocardium, and epicardium (Fig. 3).

17VENTRICULAR FUNCTION WITH CMR
Fig. 2. Tagging of the left ventricle. Images of a patient without (A) and with (B) tagging during the diastolic phase of
a normal left ventricle at rest. (C, D) are comparative images at peak stress. There is akinesea of the anterior, anterior–
septal, and septal walls indicating ischemia. (From Wahl A, Paetsch I, Roethemeyer S, et al. High-dose dobutamine–
atropine stress cardiovascular MR imaging after coronary revascularization in patients with wall motion abnormalities
at rest. Radiology 2004;233:210–6; with permission.)
Phase contrast MRI
Measurement of motion with MRI also can bedone through velocity phase mapping [28–32].With this method, the change in phase of the net
magnetization inside each pixel is related to thevelocity of the tissue in the direction parallel tothe magnetic field. With this technique, the entire
cardiac cycle can be evaluated without an elabo-rate pulse sequence, as it is insensitive to T1 relax-ation [33–38]. To date, this technique has received
limited use because of lengthy scan times andtime-consuming analyses of the acquired imagedata.
Rest measures of right and left ventricular volume
and ejection fraction
Left ventricular volume and ejection fraction
There are several different methods available
for measuring left ventricular volume and ejectionfraction with CMR. The two most commoninclude the Simpson’s rule technique and area-
length technique. With the Simpson’s rule tech-nique, LV volumes are determined by summingthe endocardial area within multiple short axial
slices spanning the base to the apex of the heartand multiplying each area determination by slicethickness (Fig. 4) [5,39,40]. This technique is
Fig. 3. Short axis displacement encoding with simulated echoes images of the left ventricle. These figures were obtained in
single breath hold in a healthy volunteer. The far left figure is of amagnitude reconstruction of the short axis view of the left
ventricle. Themiddle figure is a two-dimensional displacement map computed from a phase-reconstructed image with each
vector in themap representing the end–diastolic to end–systolic motion of themyocardium as depicted in a single pixel. The
far right figure demonstrates circumferential shortening as computed from the displacement field as a color-codedmyocar-
dial strain map. (FromKim D, Gilson WD, Kramer CM, et al. Myocardial tissue tracking with two-dimensional cine dis-
placement-encoded MR imaging: development and initial evaluation. Radiology 2004:230:862–71; with permission.)

18 WALSH & HUNDLEY
Fig. 4. Gradient echo images of sequential multiple slices of the left ventricle in short-axis planes (from base to apex) are
displayed for determining left ventricle volume by Simpson’s rule. Endocardial area in each segment is measured at end
diastole (top row) and end–systole (bottom row). Left ventricular volume is calculated by the summing the endocardial
area within each slice and multiplying by the slice thickness. Left ventricular ejection fraction equals (end–diastolic
volume�end–systolic volume)/end–diastolic volume.
advantageous, because one can calculate LV vol-umes without using formulae that require assump-
tions about LV shape. For this reason, theSimpson’s rule technique is useful in patients whohave cardiomyopathy or regional wall motion
abnormalities.The area length techniques are based on
formulae that assume the left ventricle exhibits
the shape of a prolate ellipse. With the single-plane or biplane area-length methods, only one ortwo slice acquisitions are required, and imageanalysis time is short [41,42]. Because patients
who have distorted LV geometry caused by di-lated cardiac chambers or resting regional wallmotion abnormalities do not exhibit left ventricles
in the shape of a prolate ellipse, LV volume deter-minations may be less precise than those gener-ated with the Simpson’s rule method [43]. With
both methods, LV ejection fraction is calculatedby subtracting end–diastolic volume from end–systolic volume and dividing by end–diastolic
volume.Assessments of LF volumes measured with the
Simpson’s rule technique have been validated with
cadaver studies. In 1985, Rehr and colleagues [39]used cadaver hearts and created latex casts of ex-
cised human left ventricles to compare CMR mea-surements derived from scanning the casts withactual volume measurements from the casts them-
selves. They found excellent correlation betweenCMR-determined measurements and cast mea-surements (r ¼ 0.997, standard error of the esti-
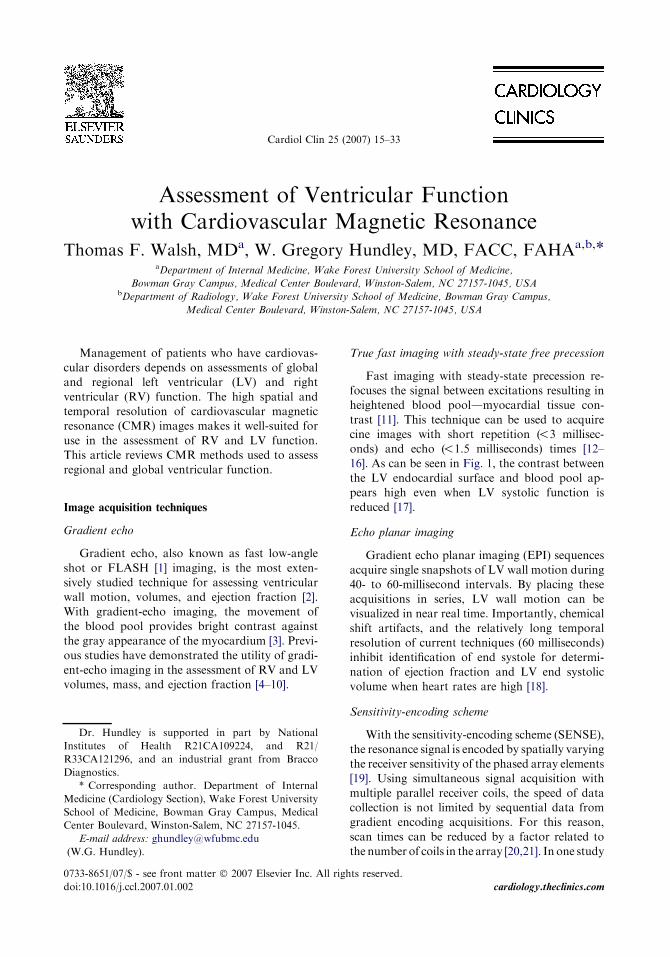
mate equal to 4.3 to 4.9 mL over a range of 26to 190 mL [Fig. 5]). Other studies have performedsimilar analyses from autopsy series and foundexcellent correlations also [5].
Data from animal models have confirmed thefindings in phantom and cadaver studies. Kellerand colleagues [44] examined canine hearts and
found a close correlation (r ¼ 0.98) between LVmass and volumes measured with CMR and thosecalculated by the volume of displacement method.
In another study by Koch and colleagues [45],eight porcine hearts were explanted and preparedby removal of the atria. The correlation between
measures obtained from both ventricles and theCMR-derived measures was greater than 0.99.Multiple studies have been performed in canine,
19VENTRICULAR FUNCTION WITH CMR
porcine, rat, and mice models to confirm excellent
correlation between CMR-calculated ventricularvolumes and actual volumes measured by timedvolume collections [46–49].
Assessment of LV volumes and EF with CMR
using cine gradient echo techniques in people invivo with both normal and abnormal LF mor-phology is highly reproducible and exhibits low
intraobserver and interobserver variability [50–53]. Ventricular volumes, mass, and ejection frac-tion also can be assessed with a high degree of
accuracy in patients who have congestive heartfailure. As small as a 5% difference in LV ejectionfraction with 90% power and a ¼ 0.05 can bedetected in subjects who have impaired LV
function.Because of the heightened reproducibility and
low variance of this method, small sample sizes
can be used when a change in LV volumes or EFby CMR serve as a study endpoint. In comparisonwith sample sizes required through the use of
area-length methods acquired through other in-vasive and noninvasive imaging modalities, CMRmeasures have been demonstrated to be more
precise and reproducible [54]. For this reason,studies using CMR measures of LV volumes andejection fraction require sample sizes that are
Fig. 5. Cardiovascular magnetic resonance of human
casts. Relation between volume calculated using MRI
and true volume (superimposed on regression line relat-
ing the two) for the images obtained using normal reso-
lution. Regression line is calculated using all 15 casts.
(From Rehr RB, Malloy CR, Filipchuk NG, et al. Left
ventricular volumes measured by MR imaging. Radiol-
ogy 1985;156:717–9; with permission.)
80% to 90% smaller then the sample sizes neededwith other modalities [54].
The white blood imaging technique used toassess LV volumes may influence the calculated
measures derived from CMR. One study compar-ing short axis cine magnetic resonance (MR)images with steady-state free precession and
gradient-echo techniques indicated that LV ejec-tion fraction was lower and LV mass, end-systolic,and stroke volumes were higher in the steady-state
free precession technique when compared with themeasures from the gradient-echo sequences. Theheightened contrast between the blood and myo-
cardial border are thought to be the source ofthese discrepancies [55].
Right ventricular volume and ejection fraction
Because of the shape and location of the rightventricle beneath the sternum, quantification of
RV volumes and ejection fraction is difficult withechocardiography or radionuclide ventriculogra-phy. With CMR, there are no limitations imposed
by body habitus, and thus, as with LV functionalmeasures, RV volumes and ejection fraction canbe determined accurately [56–60]. In studies with
normal volunteers, there has been low intraob-server, interobserver, and interstudy variability(5% to 6%) [61].
Two studies have reported normative CMR
values for the right ventricle. Rominger andcolleagues [60] reported an average RV end–dia-stolic volume index of 78 plus or minus 15 mL/m2,
an average end–systolic volume index of 30 plusor minus 9 mL/m2, and an average ejection frac-tion of 62% plus or minus 6% in 52 healthy volun-
teers aged 18 to 58 years. Lorenz and colleagues[61] found similar results in 75 healthy participantsranging in age from 8 to 55 years. In this study, the
RV end–diastolic volume index averaged 75 plusor minus 13 mL/m2, and the RV ejection fractionaveraged 61% plus or minus 7%.
Assessment of left ventricular regional function
Wall motion
CMR is an excellent technique for visualizingwall motion. Using various white blood imaging
techniques, cine loops can be constructed during3- to 4-second periods of breath holding. BecauseCMR can acquire images in virtually any tomo-
graphic plane, standard apical (long axis, four-chamber, and two-chamber) and short-axis (basal,middle, and apical) views of LV wall motion can

20 WALSH & HUNDLEY
be obtained without limitation imposed by bodyhabitus (Fig. 6).
Wall thickening
Two primary methods have been described for
the assessment of LV wall thickening: the centerline method and myocardial tissue tagging [62–64]. With the center line technique, a line is cre-ated in the center of the myocardium equidistant
from the epicardial and endocardial borders. Per-pendicular to the center line, multiple chords areevenly distributed circumferentially around the
LV myocardium at specified intervals, with thelength of each chord identifying local wall
thickness (defined as the ratio of the length ofthe chord at end systole to end diastole) [37]. Aftermyocardial infarction (MI), this technique has
been used to identify abnormal thickening associ-ated with the site and extent of the infarct [48,65].This technique also has been used during dobut-amine MR stress testing to identify abnormal
thickening in association with myocardial ische-mia. The sensitivity of detecting luminal narrow-ings of greater than 50% in one, two, and three
epicardial arteries was 88%, 91%, and 100%, re-spectively [66]. A limitation of this technique isthe fact that when the imaging slice is not posi-
tioned perpendicular to the long axis of the leftventricle, local wall thickness (and consequently,
Fig. 6. Method for obtained standard views. (A) Illustration of a method for obtaining three short-axis (basal, middle,
and apical) and three apical (long-axis, four-chamber, and two-chamber) cardiovascular magnetic resonance views of the
left ventricle. In all images, the myocardium is gray, and the blood pool white. The white dotted lines on the coronal
locator, long-axis view, and basal short-axis view indicate the slice positions for obtaining the subsequent views demar-
cated by the black arrows. (B) The 18 myocardial segments are demarcated by white lines. (From Hundley WG, Morgan
TM, Neagle CM, et al. Magnetic resonance imaging determination of cardiac prognosis. Circulation 2002;106(18):
2328–33; with permission.)

21VENTRICULAR FUNCTION WITH CMR
wall thickening) may be overestimated. Addition-ally, through-plane myocardial motion is not ac-counted for as the heart translates from diastoleto systole [66].
Tagging can be used to monitor wall thicken-ing throughout the cardiac cycle. By tracking theside-to-side separation of tag lines or tag line
intersections or the change in distance betweenline pairs, myocardial shortening or elongationcan be observed [67]. With this approach, it is pos-
sible to measure wall thickness across the LVmyocardium [67,68].
Left ventricular strain
Measurements of LV strain are useful in that
they are not dependent on volume loading orpreload in the determination of ventricular re-laxation [69]. Strain analysis can be used to char-
acterize regional deformation of the myocardium.Strain can be defined as the percent change inlength per unit of initial length. Normal strains
can be analyzed in radial (Err), longitudinal (Ell),and circumferential (Ecc) axes. Shear strains are
defined in the plane between two coordinateaxes in which the strain between the circumferen-tial and longitudinal axis is Ecl; the strain betweenthe circumferential and radial axis is Ecr; and the
strain between the longitudinal and radial axis isElr [67,70]. To date, strain has been assessedwith both CSPAMM and DENSE techniques.
Using sonomicrometric measurement techniques,measurements of myocardial thickening andstrain by tagged MR imaging have been validated
[71]. In a recent study examining LV diastolic dys-function in patients who had type 2 diabetes mel-litus and normal LV ejection fractions, it was
found that peak LV systolic circumferential andlongitudinal shortening values were lower in thepatients who had diabetes compared with normalcontrols [72]. In hypertensive patients who have
LV hypertrophy, it has been found that intramu-ral myocardial strain is abnormal [73]. Investiga-tors in other studies have used myocardial strain
assessments and tissue tagging to evaluate patientswho have myocardial ischemia, infarction, hiber-nating or stunned myocardium, or postinfarction
remodeling (Fig. 7) [74,75].
Fig. 7. Magnetic resonance (MR) tagging used for regional strain analysis. The left ventricle is divided into 32 small cu-
boids by means of a combination of MR tagging along five cardiac short- and four long-axis planes. Each cuboid is con-
structed from four subendocardial and four subepicardial node points. Strains are expressed in local cardiac coordinate
system for each subepicardial and subendocardial node point. Axes are radial (R) using the direction perpendicular to
wall; fiber (F), tangent to surface and parallel to local fiber direction at either epicardium or endocardium; and cross-fiber
(X), tangent to surface and perpendicular to F. (From Bogaert J, Maes A, Van de Werf F, et al. Functional recovery of
subepicardial myocardial tissue in transmural myocardial infarction after successful reperfusion: an important contribu-
tion to the improvement of regional and global left ventricular function. Circulation 1999;99(1):37; with permission.)
22 WALSH & HUNDLEY
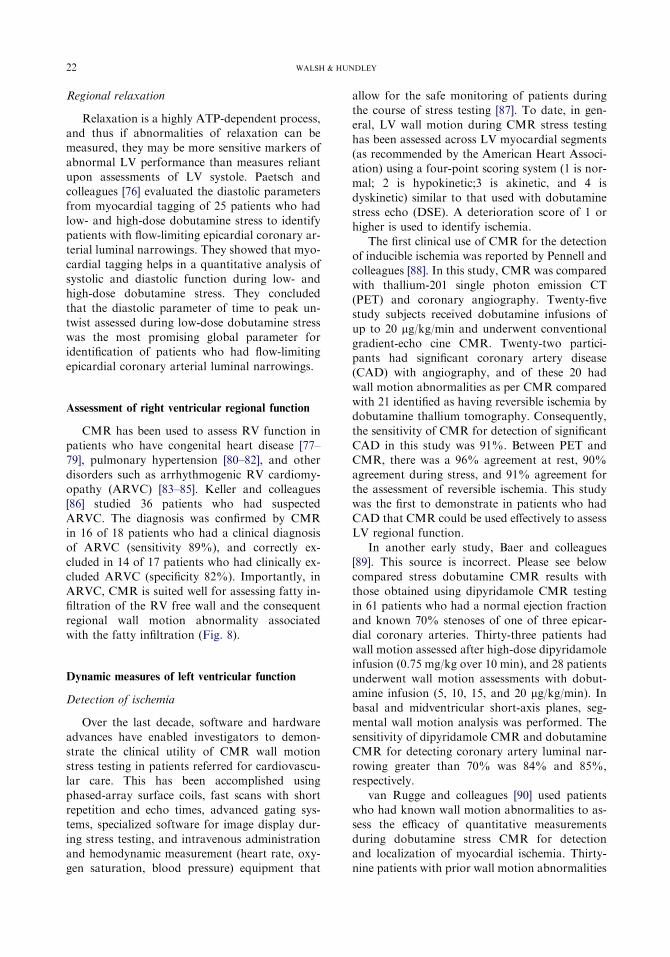
Regional relaxation
Relaxation is a highly ATP-dependent process,and thus if abnormalities of relaxation can bemeasured, they may be more sensitive markers of
abnormal LV performance than measures reliantupon assessments of LV systole. Paetsch andcolleagues [76] evaluated the diastolic parametersfrom myocardial tagging of 25 patients who had
low- and high-dose dobutamine stress to identifypatients with flow-limiting epicardial coronary ar-terial luminal narrowings. They showed that myo-
cardial tagging helps in a quantitative analysis ofsystolic and diastolic function during low- andhigh-dose dobutamine stress. They concluded
that the diastolic parameter of time to peak un-twist assessed during low-dose dobutamine stresswas the most promising global parameter foridentification of patients who had flow-limiting
epicardial coronary arterial luminal narrowings.
Assessment of right ventricular regional function
CMR has been used to assess RV function inpatients who have congenital heart disease [77–79], pulmonary hypertension [80–82], and other
disorders such as arrhythmogenic RV cardiomy-opathy (ARVC) [83–85]. Keller and colleagues[86] studied 36 patients who had suspected
ARVC. The diagnosis was confirmed by CMRin 16 of 18 patients who had a clinical diagnosisof ARVC (sensitivity 89%), and correctly ex-
cluded in 14 of 17 patients who had clinically ex-cluded ARVC (specificity 82%). Importantly, inARVC, CMR is suited well for assessing fatty in-filtration of the RV free wall and the consequent
regional wall motion abnormality associatedwith the fatty infiltration (Fig. 8).
Dynamic measures of left ventricular function
Detection of ischemia
Over the last decade, software and hardwareadvances have enabled investigators to demon-
strate the clinical utility of CMR wall motionstress testing in patients referred for cardiovascu-lar care. This has been accomplished using
phased-array surface coils, fast scans with shortrepetition and echo times, advanced gating sys-tems, specialized software for image display dur-
ing stress testing, and intravenous administrationand hemodynamic measurement (heart rate, oxy-gen saturation, blood pressure) equipment that
allow for the safe monitoring of patients duringthe course of stress testing [87]. To date, in gen-eral, LV wall motion during CMR stress testing
has been assessed across LV myocardial segments(as recommended by the American Heart Associ-ation) using a four-point scoring system (1 is nor-mal; 2 is hypokinetic;3 is akinetic, and 4 is
dyskinetic) similar to that used with dobutaminestress echo (DSE). A deterioration score of 1 orhigher is used to identify ischemia.
The first clinical use of CMR for the detectionof inducible ischemia was reported by Pennell andcolleagues [88]. In this study, CMR was compared
with thallium-201 single photon emission CT(PET) and coronary angiography. Twenty-fivestudy subjects received dobutamine infusions ofup to 20 mg/kg/min and underwent conventional
gradient-echo cine CMR. Twenty-two partici-pants had significant coronary artery disease(CAD) with angiography, and of these 20 had
wall motion abnormalities as per CMR comparedwith 21 identified as having reversible ischemia bydobutamine thallium tomography. Consequently,
the sensitivity of CMR for detection of significantCAD in this study was 91%. Between PET andCMR, there was a 96% agreement at rest, 90%
agreement during stress, and 91% agreement forthe assessment of reversible ischemia. This studywas the first to demonstrate in patients who hadCAD that CMR could be used effectively to assess
LV regional function.In another early study, Baer and colleagues
[89]. This source is incorrect. Please see below
compared stress dobutamine CMR results withthose obtained using dipyridamole CMR testingin 61 patients who had a normal ejection fraction
and known 70% stenoses of one of three epicar-dial coronary arteries. Thirty-three patients hadwall motion assessed after high-dose dipyridamoleinfusion (0.75 mg/kg over 10 min), and 28 patients
underwent wall motion assessments with dobut-amine infusion (5, 10, 15, and 20 mg/kg/min). Inbasal and midventricular short-axis planes, seg-
mental wall motion analysis was performed. Thesensitivity of dipyridamole CMR and dobutamineCMR for detecting coronary artery luminal nar-
rowing greater than 70% was 84% and 85%,respectively.
van Rugge and colleagues [90] used patients
who had known wall motion abnormalities to as-sess the efficacy of quantitative measurementsduring dobutamine stress CMR for detectionand localization of myocardial ischemia. Thirty-
nine patients with prior wall motion abnormalities

23VENTRICULAR FUNCTION WITH CMR
Fig. 8. Cardiovascular magnetic resonance imaging for the diagnosis of arrhythmogenic right ventricular dysplasia.
T1-weighted turbo spin–echo sequences show the high signal intensity (bright) region within the right ventricular
(RV) anterior wall in a left ventricular (LV) short-axis (A) and axial (B) view (arrows). Signal intensity of this region
is comparable to that of subcutaneous fat. With application of a fat suppression pulse, the bright signal of the fatty in-
filtrates disappear, again comparable with subcutaneous fat (C) (arrow). End–systolic (D) and end–diastolic (E) frames
from a cine gradient echo sequence demonstrate the RV dilation and the impaired inward motion and systolic thickening
of the RV anterior wall (arrows). (From Keller D, Osswald S, Bremerich J, et al. Arrhythmogenic right ventricular dys-
plasia: diagnostic and prognostic value of cardiac MRI in relation to arrhythmia free survival. Int J Card Imaging
2003;19:537; with permission.)
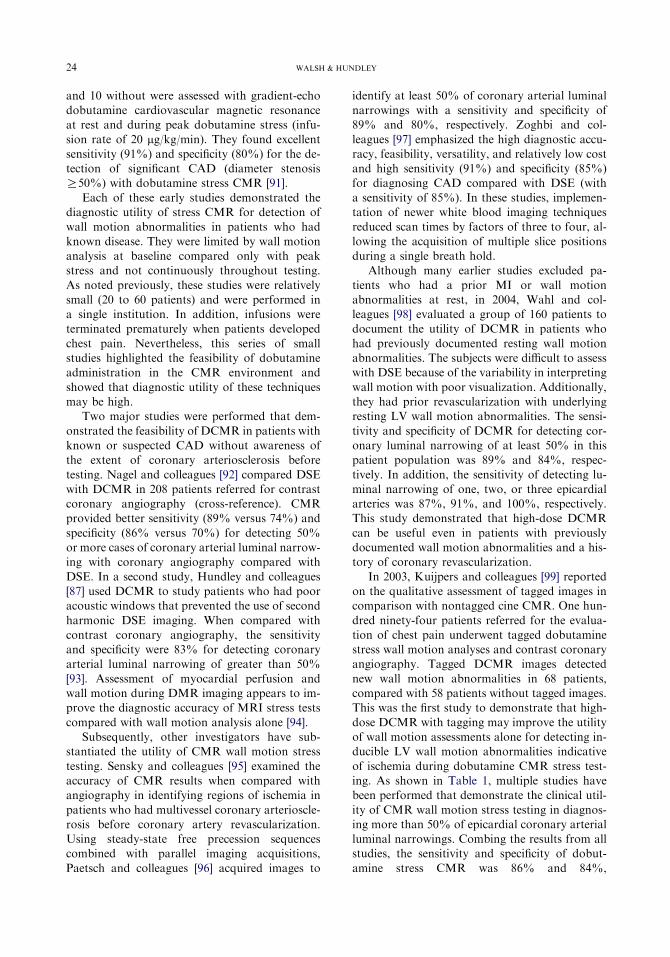
24 WALSH & HUNDLEY
and 10 without were assessed with gradient-echodobutamine cardiovascular magnetic resonanceat rest and during peak dobutamine stress (infu-
sion rate of 20 mg/kg/min). They found excellentsensitivity (91%) and specificity (80%) for the de-tection of significant CAD (diameter stenosisR50%) with dobutamine stress CMR [91].
Each of these early studies demonstrated thediagnostic utility of stress CMR for detection ofwall motion abnormalities in patients who had
known disease. They were limited by wall motionanalysis at baseline compared only with peakstress and not continuously throughout testing.
As noted previously, these studies were relativelysmall (20 to 60 patients) and were performed ina single institution. In addition, infusions wereterminated prematurely when patients developed
chest pain. Nevertheless, this series of smallstudies highlighted the feasibility of dobutamineadministration in the CMR environment and
showed that diagnostic utility of these techniquesmay be high.
Two major studies were performed that dem-
onstrated the feasibility of DCMR in patients withknown or suspected CAD without awareness ofthe extent of coronary arteriosclerosis before
testing. Nagel and colleagues [92] compared DSEwith DCMR in 208 patients referred for contrastcoronary angiography (cross-reference). CMRprovided better sensitivity (89% versus 74%) and
specificity (86% versus 70%) for detecting 50%or more cases of coronary arterial luminal narrow-ing with coronary angiography compared with
DSE. In a second study, Hundley and colleagues[87] used DCMR to study patients who had pooracoustic windows that prevented the use of second
harmonic DSE imaging. When compared withcontrast coronary angiography, the sensitivityand specificity were 83% for detecting coronaryarterial luminal narrowing of greater than 50%
[93]. Assessment of myocardial perfusion andwall motion during DMR imaging appears to im-prove the diagnostic accuracy of MRI stress tests
compared with wall motion analysis alone [94].Subsequently, other investigators have sub-
stantiated the utility of CMR wall motion stress
testing. Sensky and colleagues [95] examined theaccuracy of CMR results when compared withangiography in identifying regions of ischemia in
patients who had multivessel coronary arterioscle-rosis before coronary artery revascularization.Using steady-state free precession sequencescombined with parallel imaging acquisitions,
Paetsch and colleagues [96] acquired images to
identify at least 50% of coronary arterial luminalnarrowings with a sensitivity and specificity of89% and 80%, respectively. Zoghbi and col-
leagues [97] emphasized the high diagnostic accu-racy, feasibility, versatility, and relatively low costand high sensitivity (91%) and specificity (85%)for diagnosing CAD compared with DSE (with
a sensitivity of 85%). In these studies, implemen-tation of newer white blood imaging techniquesreduced scan times by factors of three to four, al-
lowing the acquisition of multiple slice positionsduring a single breath hold.
Although many earlier studies excluded pa-
tients who had a prior MI or wall motionabnormalities at rest, in 2004, Wahl and col-leagues [98] evaluated a group of 160 patients todocument the utility of DCMR in patients who
had previously documented resting wall motionabnormalities. The subjects were difficult to assesswith DSE because of the variability in interpreting
wall motion with poor visualization. Additionally,they had prior revascularization with underlyingresting LV wall motion abnormalities. The sensi-
tivity and specificity of DCMR for detecting cor-onary luminal narrowing of at least 50% in thispatient population was 89% and 84%, respec-
tively. In addition, the sensitivity of detecting lu-minal narrowing of one, two, or three epicardialarteries was 87%, 91%, and 100%, respectively.This study demonstrated that high-dose DCMR
can be useful even in patients with previouslydocumented wall motion abnormalities and a his-tory of coronary revascularization.
In 2003, Kuijpers and colleagues [99] reportedon the qualitative assessment of tagged images incomparison with nontagged cine CMR. One hun-
dred ninety-four patients referred for the evalua-tion of chest pain underwent tagged dobutaminestress wall motion analyses and contrast coronaryangiography. Tagged DCMR images detected
new wall motion abnormalities in 68 patients,compared with 58 patients without tagged images.This was the first study to demonstrate that high-
dose DCMR with tagging may improve the utilityof wall motion assessments alone for detecting in-ducible LV wall motion abnormalities indicative
of ischemia during dobutamine CMR stress test-ing. As shown in Table 1, multiple studies havebeen performed that demonstrate the clinical util-
ity of CMR wall motion stress testing in diagnos-ing more than 50% of epicardial coronary arterialluminal narrowings. Combing the results from allstudies, the sensitivity and specificity of dobut-
amine stress CMR was 86% and 84%,

25VENTRICULAR FUNCTION WITH CMR
respectively, for identifying at least 50% of epicar-dial coronary arterial luminal narrowings withcontrast coronary arteriography.
Detection of viability
CMR also has been used for identifying leftventricular myocardial segments that, because of
myocardial stunning or hibernation, display ab-normal wall motion at rest and will improve incontractility after coronary arterial revasculariza-
tion procedures. Early studies examining viabilitycompared CMR with other modalities includingDSE and radioisotope studies. Development of
tagging has enabled better quantitative assessmentof LV wall thickening indicative of viability.Recently, there have been several studies looking
Table 1
Sensitivity and specificity analysis for stress dobutamine
cardiovascular magnetic resonance in detection of
R50% coronary arterial luminal narrowings
Author/
year
Dose
(mg/kg/
min)
Number
of
patients Sensitivity Specificity
Pennell,
et al
1992
[88]
20 25 91 d
van
Rugge,
et al
1993
[66,90]
20 45 81 100
van
Rugge,
et al
1994
[91]
20 39 91 80
Nagel,
et al
1999
[92]
20 208 86 86
Baer,
1994
[89]
20 35 84 -
Nagel,
1999
[92]
40 þatropine
172 86 86
Hundley,
et al
1999
[87]
40 þatropine
163 83 83
Wahl,
2004
[98]
40 þatropine
160 89 84
Summary 847 86 84
at specific characteristics of the myocardium,including movement of individual layers, circum-ferential shortening, and wall thickening, all ofwhich represent important determinants of poten-
tial recovery after revascularization.After an MI, the transmural extent of necrosis
and decrease in LV ejection fraction can vary
considerably. Using CMR tagging to regionallyquantify fiber strains, wall thickening, and ejec-tion fraction, Bogaert and colleagues [100] as-
sessed 12 patients who had single-vessel disease1 week and 3 months after successful reperfusionof a first transmural anterior MI. Improved sube-
picardial fiber shortening at the 3-month markwas associated with an improved regional LVwall motion and global LV ejection fraction.
Geskin and colleagues [101] demonstrated that
myocardial function recovery at 8 weeks after MIwas predicted by an increase in circumferentialshortening in resting dysfunctional segments dur-
ing dobutamine infusion. In a group of 20 patientswith first reperfused MI, they noted that midmyo-cardial response and subepicardial response to do-
butamine were predictive of subsequent functionalrecovery, but improvement in subendocardiallayers was not.
Using tissue tagging, Sayad and colleagues[102] demonstrated how low-dose dobutamineCMR analysis of LV thickening predicts future re-covery of systolic thickening after revasculariza-
tion of epicardial coronary arteries, supplyingregions of hibernating and stunned myocardium(Fig. 9). In a group of 10 patients with segmental
wall motion abnormalities at rest, they found thatCMR had a sensitivity of 89%, a specificity of93%, a negative predictive value of 82%, and
a positive predictive value of 96% for recoveryof segmental function after revascularization.Although not the focus of their study, the authorsalluded to the excellent correlation between
end–systolic wall thickness at peak dobutamineinfusion and after revascularization.
Dendale and colleagues [103] evaluated the fea-
sibility of stress CMR use for the detection ofviability after acute MI. CMR images were ana-lyzed for wall motion abnormalities during low-
dosage dobutamine stimulation in 37 patientswho had recent MI. The authors concluded thatlow-dosage dobutamine CMR is a safe and accu-
rate predictor recovery of wall motion abnormal-ities after MI, but this study was limited by thelack of quantitative analysis of the CMR images.
In a quantitative analysis, Saito and colleagues
[104] showed that CMR was as effective as DSE

26 WALSH & HUNDLEY
Fig. 9. Contractile reserve. (A) Plot of end–systolic wall thickening at rest, peak dobutamine, and after revascularization
in all 43 abnormal segments. Squares represent the three segments that had contractile reserve with dobutamine, but no
recovery of function after revascularization. Triangles represent the segment without contractile reserve, but this im-
proved after revascularization. No segment with end–systolic wall thickness less than 7 mm had contractile reserve or
improved after revascularization. (B) Regression line for end–systolic wall thickening at peak dobutamine and after
revascularization. (From Sayad DE, Willett DL, Hundley WG, et al. Dobutamine magnetic resonance imaging with
myocardial tagging quantitatively predicts improvement in regional function after revascularization. Am J Cardiol
1998;82(9):1149–51, A10; with permission.)
for identifying myocardial viability in subjects
who had LV dysfunction at rest. DobutamineCMR and stress echo had similar results in 86%of the patients for detecting myocardial viability.Sensitivity (76%) and specificity (86%) with
CMR compared well with the sensitivity (66%)and specificity for DSE (100%). The sensitivityof DCMR with tagging was noted to be 76%,
whereas that of DSE was 66%. The specificity ofDCMR was 86%, and that of DSE was 100%.The accuracy of DCMR was 78%; that of DSE
was 72%.Dobutamine CMR has been compared with
metabolic assessment of viability obtained duringradionuclide studies. Baer and colleagues [89] re-
ported that implementation of dobutamine stressprovided further information regarding viabilitythan resting LV end–diastolic wall thickness.
End–diastolic wall thickness at rest and dobut-amine-induced systolic wall thickening assessedby DCMR were compared with positron emission
tomography (PET). They concluded that DCMRwas a better predictor of residual metabolic activ-ity, with sensitivity of 81%, specificity of 95%,
and positive predictive accuracy of 96%, thanPET, with a sensitivity of 72%. specificity of89%, and positive predictive accuracy of 91%.
Delayed hyperenhancement techniques also
have been used to identify myocardial necrosisand an absence of myocellular viability. In severalsmall studies of 10 to 30 subjects, delayed en-hancement imaging has been compared with
dobutamine wall motion analyses for predictingthe return of LV systolic function after coronaryarterial revascularization [105–108]. In the most
widely referenced of these studies, Wellnhoferand colleagues [108] compared recovery of systolicthickening as measured by CMR with delayed-
enhancement imaging in 29 patients. Increasedthickening during dobutamine CMR was morelikely than delayed enhancement to identify im-provement in contractility after revascularization
in myocardial segments with the transmural ex-tent of infarction less than 50%. For those withno or extensive infarcts, the techniques had simi-
lar efficacy.
Prognosis
Assessments of LV wall motion and ejection
fraction can be used to predict long-term progno-sis. In 2002, Hundley and colleagues [110] re-ported on the utility of dobutamine CMR for
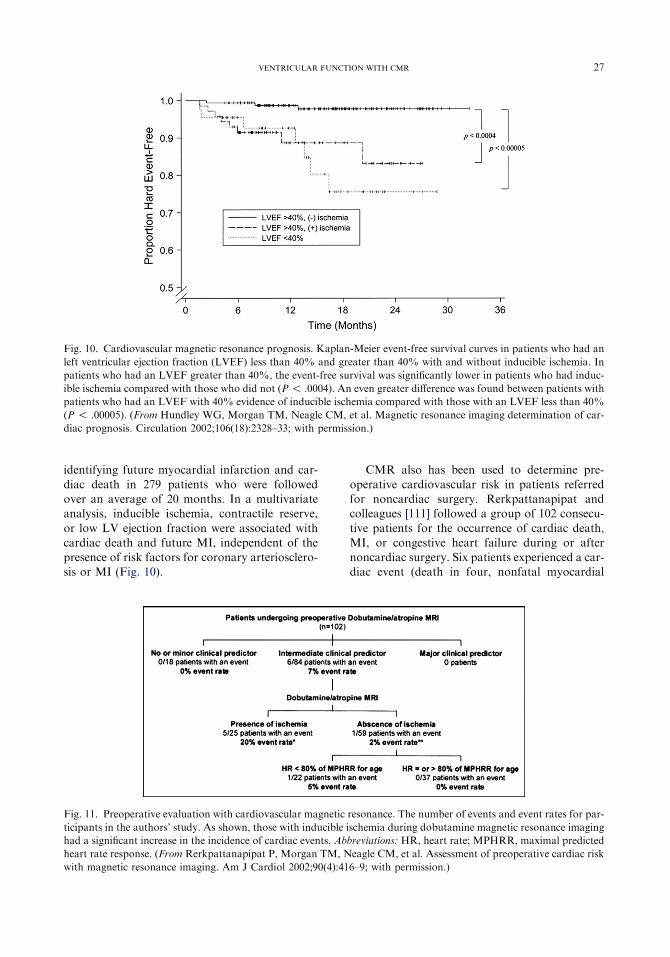
Fig. 10. Cardiovascular magnetic resonance prognosis. Kaplan-Meier event-free survival curves in patients who had an
left ventricular ejection fraction (LVEF) less than 40% and greater than 40% with and without inducible ischemia. In
patients who had an LVEF greater than 40%, the event-free survival was significantly lower in patients who had induc-
ible ischemia compared with those who did not (P ! .0004). An even greater difference was found between patients with
patients who had an LVEF with 40% evidence of inducible ischemia compared with those with an LVEF less than 40%
(P ! .00005). (From Hundley WG, Morgan TM, Neagle CM, et al. Magnetic resonance imaging determination of car-
diac prognosis. Circulation 2002;106(18):2328–33; with permission.)
27VENTRICULAR FUNCTION WITH CMR
identifying future myocardial infarction and car-
diac death in 279 patients who were followedover an average of 20 months. In a multivariateanalysis, inducible ischemia, contractile reserve,
or low LV ejection fraction were associated withcardiac death and future MI, independent of thepresence of risk factors for coronary arteriosclero-sis or MI (Fig. 10).
CMR also has been used to determine pre-
operative cardiovascular risk in patients referredfor noncardiac surgery. Rerkpattanapipat andcolleagues [111] followed a group of 102 consecu-
tive patients for the occurrence of cardiac death,MI, or congestive heart failure during or afternoncardiac surgery. Six patients experienced a car-diac event (death in four, nonfatal myocardial
Fig. 11. Preoperative evaluation with cardiovascular magnetic resonance. The number of events and event rates for par-
ticipants in the authors’ study. As shown, those with inducible ischemia during dobutamine magnetic resonance imaging
had a significant increase in the incidence of cardiac events. Abbreviations: HR, heart rate; MPHRR, maximal predicted
heart rate response. (From Rerkpattanapipat P, Morgan TM, Neagle CM, et al. Assessment of preoperative cardiac risk
with magnetic resonance imaging. Am J Cardiol 2002;90(4):416–9; with permission.)

28 WALSH & HUNDLEY
Fig. 12. Exercise cardiovascular magnetic resonance (CMR). Diagrammatic representation of an exercise bike used for
CMR stress studies made from nonferromagnetic materials (left panel). In the right panel, a treadmill positioned outside
of the magnetic resonance scanner. With this treadmill approach, heightened diagnostic accuracy is achieved when
images are collected within a minute of exercise cessation.
infarction in one, and congestive heart failure inone) during surgery or in their postoperative
course. Five of 26 patients who had evidence ofinducible ischemia during DCMR underwent re-vascularization before surgery (one sustained an
event, and four did not). In patients who had in-termediate clinical predictors of events as definedby the American College of Cardiology and theAmerican Heart Association, evidence of induc-
ible ischemia during CMR imaging was associatedwith a significant increase in perioperative cardiacevents (Fig. 11).
Exercise stress testing
As with echocardiography, it may be possibleto implement exercise instead of pharmacologicstress to obtain imaging. Studies have been con-
ducted looking at both the bicycle and treadmillexercise as stress agents. Bicycle exercise has theadvantage of reduction in stress protocol duration
and acquisition of data regarding functionalcapacity. In one study, Roest and colleagues[112] studied 16 healthy volunteers (eight womenand eight men, mean age 18� 2 years) with bicycle
exercise in the supine position on a MR-compati-ble bicycle ergometer at 1.5 T. By breath holdingat end expiration, image blurring was avoided
because of respiratory motion for all short-axisimages. Stroke volume and ejection fraction in-creased in both ventricles in response to exercise;
as would be expected, the end–systolic volume ofthe two ventricles decreased, while the end–diastolic volumes remained the same This study
demonstrates that exercise CMR, in normal pa-tients, can be used to assess physiologic changes
in both the left and right ventricles simultaneously(Fig. 12).
Although the previous study used supine bi-
cycle exercise, Rerkpattanapipat and colleagues[109] used upright treadmill in 27 patients whohad images obtained less than 1 minute after exer-cise (see Fig. 12). Ischemia was appreciated in 14
patients, with good overall sensitivity and specific-ity of detecting epicardial artery luminal narrow-ings greater than 50% of 79% and 85%,
respectively. This study was limited, however, inthat comprehensive coverage of the myocardiumwas not achieved, and results were acquired on
a small number of subjects. Further studies areneeded in this area to determine the clinical utilityof exercise-induced wall motion abnormalities for
the assessment of patients who have cardiovascu-lar disease.
Summary
Several imaging techniques are available forassessing global and regional LV and RV functionduring cardiovascular MRI examinations. These
techniques can be used to provide accurate andreproducible measures of ventricular volumes andejection fraction. In those who can undergo
CMR, it may be the most accurate noninvasiveimaging test for determining LV or RV volumesor ejection fraction.

29VENTRICULAR FUNCTION WITH CMR
CMR also can be used to provide informationabout regional LV function including: wall mo-tion, thickening, and strain. To date, these re-gional function measures have been acquired at
rest and with stress, and they have been shown tobe useful for identifying myocardial ischemia,injury, and viability. In addition, changes in
regional function observed during dobutaminestress CMR are useful for assessing cardiacprognosis and preoperative cardiac risk assess-
ment for noncardiac surgery.
References
[1] Haase A, Frahm J,Mathaei D. Rapid three-dimen-
sional MR imaging using the FLASH technique
J Comput Assist Tomogr 1986;67:256–66.
[2] Balaban R. The physics of image generation by
magnetic resonance. In: Manning WJ, Pennell DJ,
editors. Cardiovascular magnetic resonance. 1st
edition. Philadelphia: Churchill Livingstone; 2002.
p. 3–17.
[3] Mirowitz S, Eilenberg S, White R. Cardiac MR
imaging techniques and strategies. In: Gutierrez F,
Brown J, Mirowitz S, editors. Cardiovascular mag-
netic resonance imaging. Chicago: Mosby; 1992.
p. 17–22.
[4] Masood S, Yang GZ, Pennell DJ, et al. Investigat-
ing intrinsic myocardial mechanics: the role of MR
tagging, velocity phase mapping, and diffusion
imaging. J Magn Reson Imaging 2000;12:873–83.
[5] Longmore DB, Klipstein RH, Underwood SR,
et al. Dimensional accuracy of magnetic resonance
in studies of the heart. Lancet 1985;1(8442):1360–2.
[6] SemelkaRC, Tomei E,Wagner S, et al. Normal left
ventricular dimensions and function: interstudy re-
producibility of measurements with cine MR imag-
ing. Radiology 1990;174(3 Pt 1):763–8.
[7] Debatin JF, Nadel SN, Paolini JF, et al. Cardiac
ejection fraction: phantom study comparing cine
MR imaging, radionuclide blood pool imaging,
and ventriculography. J Magn Reson Imaging
1992;2(2):135–42.
[8] Germain P, Roul G, Kastler B, et al. Interstudy
variability in left ventricular mass measurement.
Comparison between M-mode echography and
MRI. Eur Heart J 1992;13(8):1011–9.
[9] Sandstede J, Lipke C, Beer M, et al. Age- and gen-
der-specific differences in left and right ventricular
cardiac function and mass determined by cine mag-
netic resonance imaging. Eur Radiol 2000;10(3):
438–42.
[10] Salehian O, Schwerzmann M, Merchant N, et al.
Assessment of systemic right ventricular function
in patients with transposition of the great arteries
using the myocardial performance index: compari-
son with cardiac magnetic resonance imaging.
Circulation 2004;110(20):3229–33.
[11] Nitz W. Fast and ultrafast nonecho–planar MR
imaging techniques. Eur Radiol 2002;12(12):
2866–82.
[12] Oppelt A, Graumann R, Barfuss A, et al. FISP:
a new fast MRI sequence. Electromedica 1986;3:
15–8.
[13] Zur Y, Wood ML, Neuringer LJ. Motion-insensi-
tive, steady-state free precession imaging. Magn
Reson Med 1990;16:444–59.
[14] Duerk JL, Lewin JS, Wendt M, et al. Remember
true FISP? A high SNR, near 1-second imaging
method for T2-like contrast in interventional
MRI at .2 T. J Magn Reson Imaging 1998;8:203–8.
[15] Chung YC, Merkle EM, Lewin JS, et al. Fast T(2)-
weighted imaging by PSIF at 0.2 T for interven-
tional MRI. Magn Reson Med 1999;42:335–44.
[16] Wendt M,Wacker F, Wolf KJ, et al. [Keyhole-true
FISP: fast T2-weighted imaging for interventional
MRT at 0.2 T]. Rofo 1999;170:391–3 [in German].
[17] Barkhausen J, Ruehm SG, Goyen M, et al. MR
evaluation of ventricular function: true fast imaging
with steady-state precession versus fast low-angle
shot cine MR imaging: feasibility studyRadiology
2001;219:264–9.
[18] Fischer H, Ladebeck R. Echo-planar imaging im-
age artifacts. In: Schmitt F, Stehling MK,
Turner R, editors. Echo-planar imaging: theory,
technique, and application. New York: Springer;
1998. p. 179–210.
[19] Weiger M, Pruessmann KP, Boesiger P. Cardiac
real-time imaging using SENSE: sensitivity-encod-
ing scheme. Magn Reson Med 2000;43:177–84.
[20] Pruessmann KP, Weiger M, Bornert P, et al.
Advances in sensitivity encoding with arbitrary
k-space trajectories. Magn Reson Med 2001;46:
638–51.
[21] Weiger M, Pruessmann KP, Leussler C, et al. Spe-
cific coil design for SENSE: a six-element cardiac
array. Magn Reson Med 2001;45:495–504.
[22] PruessmannKP,WeigerM, Boesiger P. Sensitivity-
encoded cardiac MRI. J Cardiovasc Magn Reson
2001;3:1–9.
[23] Huang J, AbendscheinD,Davila-RomanVG, et al.
Spatio–temporal tracking of myocardial deforma-
tions with a 4-D B-spline model from tagged MRI.
IEEE Trans Med Imaging 1999;18:957–72.
[24] Fischer SE, McKinnon GC, Maier SE, et al. Im-
proved myocardial tagging contrast. Magn Reson
Med 1993;30:191–200.
[25] Fischer SE, Stuber M, Dam J, et al. Late diastolic
tag persistence with slice followed echo planar im-
aging. In: Proceedings of the 4th ScientificMeeting,
New York: International Society of Magnetic Res-
onance 1; 1996:297.
[26] Aletras AH, Wen H. Mixed echo train acquisition
displacement encoding with stimulated echoes: an
optimized DENSE method for in vivo functional
imaging of the human heart. Magn Reson Med
2001;46:523–34.

30 WALSH & HUNDLEY
[27] Kim D, Gilson WD, Kramer CM, et al. Myocar-
dial tissue tracking with two-dimensional cine dis-
placement-encoded MR imaging: development
and initial evaluation. Radiology 2004;230(3):
862–71.
[28] Rumancik W, Naidich D, Chandra R, et al. Car-
diovascular disease: evaluation with MR phase im-
aging. Radiology 1988;166:63–8.
[29] Pelc LR, Sayre J, Yun K, et al. Evaluation of myo-
cardial motion tracking with cine-phase contrast
magnetic resonance imaging. Invest Radiol 1994;
29:1038–42.
[30] Jung B, ZaitsevM, Hennig J, et al. Navigator gated
high temporal resolution tissue phase mapping of
myocardial motion. Magn Reson Med 2006;55:
937–42.
[31] Markl M, Schneider B, Hennig J. Fast phase con-
trast cardiac magnetic resonance imaging: im-
proved assessment and analysis of left ventricular
wall motion. J Magn Reson Imaging 2002;15:
642–53.
[32] Jung B, Foll D, Bottler P, et al. Detailed analysis of
myocardial motion in volunteers and patients using
high temporal resolution MR tissue phase map-
ping. J Magn Reson Imaging 2006;24:1033–9.
[33] van Dijk P. Direct cardiac NMR imaging of heart
wall and blood flow velocity. J Comput Assist
Tomogr 1984;8:429–36.
[34] Wedeen VJ. Magnetic resonance imaging of myo-
cardial kinematics. Technique to detect, localize,
and quantify the strain rates of the active human
myocardium. Magn Reson Med 1992;27:52–67.
[35] NaylerGL, FirminDN, LongmoreDB. Blood flow
imaging by cine magnetic resonance. J Comput As-
sist Tomogr 1986;10:715–22.
[36] Petersen SE, Jung BA, Wiesmann F, et al. Myocar-
dial tissue phase mapping with cine phase–contrast
MR imaging: regional wall motion analysis in
healthy volunteers. Radiology 2006;238:816–26.
[37] Van der Geest RJ, Reiber JH. Quantification in
cardiac, MRI. J Magn Reson Imaging 1999;10:
602–8.
[38] Wedeen VJ, Weisskoff RM, Reese TG, et al. Mo-
tionless movies of myocardial straindrates using
stimulated echoes. Magn Reson Med 1995;33:
401–8.
[39] Rehr RB, Malloy CR, Filipchuk NG, et al. Left
ventricular volumes measured by MR imaging-
Radiology 1985;156:717–9.
[40] ChuangML,HibberdMG, Salton CJ, et al. Impor-
tance of imaging method over imaging modality in
noninvasive determination of left ventricular vol-
umes and ejection fraction: assessment by two-
and three-dimensional echocardiography and
magnetic resonance imaging. J Am Coll Cardiol
2000;35:477–84.
[41] Cranney GB, Lotan CS, Dean L, et al. Left ventric-
ular volume measurement using cardiac axis nu-
clear magnetic resonance imaging. Validation by
calibrated ventricular angiography. Circulation
1990;82:154–63.
[42] Lawson MA, Blackwell GG, Davis ND, et al. Ac-
curacy of biplane long-axis left ventricular volume
determined by cine magnetic resonance imaging
in patients with regional and global dysfunction.
Am J Cardiol 1996;77:1098–104.
[43] Martin ET, Fuisz AR, Pohost GM. Imaging car-
diac structure and pump function. Cardiol Clin
1998;16:135–60.
[44] Keller AM, Peshock RM,Malloy CR, et al. In vivo
measurement of myocardial mass using nuclear
magnetic resonance imaging. J Am Coll Cardiol
1986;8(1):113–7.
[45] Koch JA, Poll LW, Godehardt E, et al. Right
and left ventricular volume measurements in an
animal heart model in vitro: first experiences with
cardiac MRI at 1.0 T. Eur Radiol 2000;10(3):
455–8.
[46] Nahrendorf M, Hiller KH, Hu K, et al. Cardiac
magnetic resonance imaging in small animal
models of human heart failure. Med Image Anal
2003;7(3):369–75.
[47] Caputo G, Tscholakoff D, Sechtem U, et al. Mea-
surement of canine left ventricular mass by using
MR imaging. AJR Am J Roentgenol 1987;148:
33–8.
[48] Holman ER, Vliegen HW, van der Geest RJ, et al.
Quantitative analysis of regional left ventricular
function after myocardial infarction in the pig
assessed with cine magnetic resonance imaging.
Magn Reson Med 1995;34:161–9.
[49] RudinM, Pedersen B, Umemura K, et al. Determi-
nation of rat heart morphology and function in
vivo in two models of cardiac hypertrophy by
means of magnetic resonance imaging. Basic Res
Cardiol 1991;86(2):165–74.
[50] Pattynama PM, Lamb HJ, van der Velde EA, et al.
Left ventricular measurements with cine and spin
echo MR imaging: a study of reproducibility with
variance component analysis. Radiology 1993;
187:261–8.
[51] Semelka RC, Tomei E, Wagner S, et al. Interstudy
reproducibility of dimensional and functional mea-
surements between cine magnetic resonance studies
in the morphologically abnormal left ventricle. Am
Heart J 1990;119:1367–73.
[52] Stratemeier EJ, Thompson R, Brady TJ, et al. Ejec-
tion fractiondeterminationbyMR imaging: compar-
ison with left ventricular angiography. Radiology
1986;158:775–7.
[53] Shapiro EP, RogersWJ, Beyar R, et al. Determina-
tion of left ventricular mass by MRI in hearts de-
formed by acute infarction. Circulation 1989;79:
706–11.
[54] Meyer S, Curry G, Donsky M, et al. Influence of
dobutamine on hemodynamics and coronary blood
flow in patients with and without coronary artery
disease. Am J Cardiol 1976;38:103–8.

31VENTRICULAR FUNCTION WITH CMR
[55] Lee VS, Resnick D, Bundy JM, et al. Cardiac func-
tion: MR evaluation in one breath hold with real-
time true fast imaging with steady-state precession.
Radiology 2002;222:835–42.
[56] Boxt LM, Katz J. Magnetic resonance imaging for
quantitation of right ventricular volume in patients
with pulmonary hypertension. J Thorac Imaging
1993;8:92–7.
[57] Doherty NE III, Fujita N, Caputo GR, et al. Mea-
surement of right ventricular mass in normal and
dilated cardiomyopathic ventricles using cine mag-
netic resonance imaging. Am J Cardiol 1992;69:
1223–8.
[58] Katz J, Whang J, Boxt LM, et al. Estimation of
right ventricular mass in normal subjects and in
patients with primary pulmonary hypertension by
nuclear magnetic resonance imaging. J Am Coll
Cardiol 1993;21:1475–81.
[59] Pattynama PM, Lamb HJ, van der Velde EA, et al.
Reproducibility of MRI-derived measurements of
right ventricular volumes and myocardial mass.
Magn Reson Imaging 1995;13:53–63.
[60] Rominger MB, Bachmann GF, Pabst W, et al.
Right ventricular volumes and ejection fraction
with fast cine MR imaging in breath-hold tech-
nique: applicability, normal values from 52 volun-
teers, and evaluation of 325 adult cardiac
patients. J Magn Reson Imaging 1999;10:908–18.
[61] Lorenz CH,Walker ES, Morgan VL, et al. Normal
human right and left ventricular mass, systolic
function, and gender differences by cine magnetic
resonance imaging. J Cardiovasc Magn Reson
1999;1:7–21.
[62] Azhari H, Sideman S,Weiss JL, et al. Three-dimen-
sional mapping of acute ischemic regions using
MRI: wall thickening versus motion analysis. Am
J Physiol 1990;259:1492–503.
[63] Henschke CI, Risser TA, Sandor T, et al. Quantita-
tive computer-assisted analysis of left ventricular
wall thickening and motion by two-dimensional
echocardiography in acute myocardial infarction.
Am J Cardiol 1983;52:960–4.
[64] Lieberman AN, Weiss JL, Jugdutt BI, et al. Two-
dimensional echocardiography and infarct size: re-
lationship of regional wall motion and thickening
to the extent of myocardial infarction in the dog.
Circulation 1981;63:739–46.
[65] Holman ER, van Jonbergen HP, van Dijkman PR,
et al. Comparison of magnetic resonance imaging
studies with enzymatic indexes of myocardial ne-
crosis for quantification of myocardial infarct
size. Am J Cardiol 1993;71:1036–40.
[66] van Rugge FP, Holman ER, van derWall EE, et al.
Quantitation of global and regional left ventricular
function by cine magnetic resonance imaging dur-
ing dobutamine stress in normal human subjects.
Eur Heart J 1993;14:456–63.
[67] Reichek N. MRI myocardial tagging. J Magn
Reson Imaging 1999;10:609–16.
[68] Wang J, Urheim S, Korinek J, et al. Analysis of
postsystolic myocardial thickening work in selec-
tive myocardial layers during progressive myocar-
dial ischemia. J Am Soc Echocardiogr 2006;19(9):
1102–11.
[69] Edvardsen T, Rosen BD, Pan L, et al. Regional
diastolic dysfunction in individuals with left ventri-
cular hypertrophy measured by tagged magnetic
resonance imagingdthe Multi-Ethnic Study of
Atherosclerosis (MESA). Am Heart J 2006;
151(1):109–14.
[70] Lima JA, Jeremy R, Guier W, et al. Accurate sys-
tolic wall thickening by nuclear magnetic resonance
imaging with tissue tagging: correlation with sono-
micrometers in normal and ischemic myocardium.
J Am Coll Cardiol 1993;21:1741–51.
[71] Yeon SB, Reichek N, Tallant BA, et al. Validation
of in vivo myocardial strain measurement by mag-
netic resonance tagging with sonomicrometry
J Am Coll Cardiol 2001;38:555–61.
[72] Fonseca CG, Dissanayake AM, Doughty RN,
et al. Three-dimensional assessment of left ventric-
ular systolic strain in patients with type 2 diabetes
mellitus, diastolic dysfunction, and normal ejection
fraction. Am J Cardiol 2004;94(11):1391–5.
[73] Palmon LC, Reichek N, Yeon SB, et al. Intramural
myocardial shortening in hypertensive left ventric-
ular hypertrophy with normal pump function.
Circulation 1994;89:122–31.
[74] Bogaert J, Bosmans H,Maes A, et al. Remotemyo-
cardial dysfunction after acute anterior myocardial
infarction: impact of left ventricular shape on re-
gional function: a magnetic resonance myocardial
tagging study. J Am Coll Cardiol 2000;35:1525–34.
[75] Marcus JT, Gotte MJ, Van Rossum AC, et al.
Myocardial function in infarcted and remote re-
gions early after infarction in man: assessment by
magnetic resonance tagging and strain analysis.
Magn Reson Med 1997;38:803–10.
[76] Paetsch I, Foll D, Kaluza A, et al. Magnetic reso-
nance stress tagging inischemic heart disease. Am
J Physiol Heart Circ Physiol 2005;288:H2708–14.
[77] Rebergen SA, Ottenkamp J, Doornbos J, et al.
Postoperative pulmonary flow dynamics after Fon-
tan surgery: assessment with nuclear magnetic res-
onance velocity mapping. J Am Coll Cardiol
1993;21:123–31.
[78] Holmqvist C, Oskarsson G, Stahlberg F, et al.
Functional evaluation of extracardiac ventriculo-
pulmonary conduits and of the right ventricle
with magnetic resonance imaging and velocity
mapping. Am J Cardiol 1999;83:926–32.
[79] FogelMA. Assessment of cardiac function bymag-
netic resonance imaging. Pediatr Cardiol 2000;21:
59–69.
[80] Saito H, Dambara T, Aiba M, et al. Evaluation of
cor pulmonale on a modified short-axis section of
the heart by magnetic resonance imaging. Am
Rev Respir Dis 1992;146:1576–81.

32 WALSH & HUNDLEY
[81] Pattynama PM, Willems LN, Smit AH, et al. Early
diagnosis of cor pulmonale withMR imaging of the
right ventricle. Radiology 1992;182:375–9.
[82] Boxt LM.MR imaging of pulmonary hypertension
and right ventricular dysfunction.MagnReson Im-
aging Clin N Am 1996;4:307–25.
[83] Casolo GC, Poggesi L, Boddi M, et al. ECG-gated
magnetic resonance imaging in right ventricular
dysplasia. Am Heart J 1987;113:1245–8.
[84] Blake LM, Scheinman MM, Higgins CB. MR fea-
tures of arrhythmogenic right ventricular dysplasia.
Am J Roentgenol 1994;162:809–12.
[85] McKenna WJ, Thiene G, Nava A, et al. Diagnosis
of arrhythmogenic right ventricular dysplasia/car-
diomyopathy. Task Force of the Working Group
Myocardial and Pericardial Disease of the Euro-
pean Society of Cardiology and of the Scientific
Council on Cardiomyopathies of the International
Society and Federation of Cardiology. Br Heart J
1994;71:215–8.
[86] Keller D, Osswald S, Bremerich J, et al. Arrhyth-
mogenic right ventricular dysplasia: diagnostic
and prognostic value of cardiac MRI in relation
to arrhythmia-free survival. Int J Card Imaging
2003;19:537–43.
[87] HundleyWG,HamiltonCA,ThomasMS,etal.Util-
ity of fast cine magnetic resonance imaging and dis-
play for the detection of myocardial ischemia in
patients not well-suited for second harmonic stress
echocardiography. Circulation 1999;100:1697–702.
[88] Pennell DJ, Underwood SR, Manzara CC, et al.
Magnetic resonance imaging during dobutamine
stress in coronary artery disease. Am J Cardiol
1992;70(1):34–40.
[89] Baer FM, Theissen P, Smolarz K, et al. Dobut-
amine versus dipyridamole magnetic resonance to-
mography: safety and sensitivity in the detection of
coronary stenosis. Z Kardiol 1993;82:494–503.
[90] van Rugge FP, van der Wall EE, de Roos A, et al.
Dobutamine stress magnetic resonance imaging for
detection of coronary artery disease. J Am Coll
Cardiol 1993;22:431–9.
[91] van Rugge FP, van der Wall EE, Spanjersberg SJ,
et al. Magnetic resonance imaging during dobut-
amine stress for detection and localization of
coronary artery disease. Quantitative wall motion
analysis using a modification of the centerline
method. Circulation 1994;90:127–38.
[92] Nagel E, Lehmkuhl HB, Bocksch W, et al. Nonin-
vasive diagnosis of ischemia-induced wall motion
abnormalities with the use of high-dose dobut-
amine stress magnetic resonance imaging: compar-
ison with dobutamine stress echocardiography.
Circulation 1999;99:763–70.
[93] Wahl A, Roethemeyer S, Paetsch I, et al. High-dose
dobutamine stress MRI for follow-up after coro-
nary revascularization procedures in patients with
wall motion abnormalities at rest. J Cardiovasc
Magn Reson 2002;4:22–3.
[94] Wahl A, Roethemeyer S, Paetsch I, et al. Simulta-
neous assessment of wall motion and myocardial
perfusion during high-dose dobutamine stress
MRI improves diagnosis of ischemia in patients
with known coronary artery disease. J Cardiovasc
Magn Reson 2002;4:136–7.
[95] Sensky PR, Jivan A, Hudson N, et al. Coronary
artery disease: combined stress MR imaging
protocoldone-stop evaluation of myocardial per-
fusion and function. Radiology 2000;215:608–14.
[96] Paetsch I, Jahnke C, Wahl A, et al. Comparison of
dobutamine stress magnetic resonance, adenosine
stress magnetic resonance, and adenosine stress
magnetic resonance perfusion. Circulation 2004;
110:835–42.
[97] Zoghbi WA, Barasch E, Dobutamine MRI. A seri-
ous contender in pharmacological stress imaging?
Circulation 1999;99(6):730–2.
[98] Wahl A, Paetsch I, Roethemeyer S, et al. High-dose
dobutamine–atropine stress cardiovascular MR
imaging after coronary revascularization in pa-
tients with wall motion abnormalities at rest. Radi-
ology 2004;233:210–6.
[99] Kuijpers D, Ho KY, van Dijkman PR, et al.
Dobutamine cardiovascular magnetic resonance
for the detection of myocardial ischemia with the
use of myocardial tagging. Circulation 2003;
107(12):1592–7.
[100] Bogaert J,MaesA, Rademakers FE. Functional re-
covery of subepicardial myocardial tissue in trans-
mural myocardial infarction after successful
reperfusion: an important contribution to the im-
provement of regional and global left ventricular
function. Circulation 1999;99(1):36–43.
[101] GeskinG,KramerCM,RogersWJ, et al. Quantita-
tive assessment of myocardial viability after infarc-
tion by dobutamine magnetic resonance tagging.
Circulation 1998;98(3):217–23.
[102] Sayad DE, Willett DL, HundleyWG, et al. Dobut-
amine magnetic resonance imaging with myocar-
dial tagging quantitatively predicts improvement
in regional function after revascularization. Am J
Cardiol 1998;82(9):1149–51, A10.
[103] Dendale PA, Franken PR, Waldman GJ, et al.
Low-dosage dobutamine magnetic resonance im-
aging as an alternative to echocardiography in the
detection of viable myocardium after acute infarc-
tion. Am Heart J 1995;130(1):134–40.
[104] Saito I, Watanabe S, Masuda Y. Detection of via-
ble myocardium by dobutamine stress tagging
magnetic resonance imaging with three-dimen-
sional analysis by automatic trace method. Jpn
Circ J 2000;64(7):487–94.
[105] MotoyasuM, SakumaH, IchikawaY, et al. Predic-
tion of regional functional recovery after acute
myocardial infarction with low-dose dobutamine
stress cine MR imaging and contrast-enhanced
MR imaging. J Cardiovasc Magn Reson 2003;
5(4):563–74.

33VENTRICULAR FUNCTION WITH CMR
[106] Kaandorp TA, Bax JJ, Schuijf JD, et al. Head-to-
head comparison between contrast-enhanced
magnetic resonance imaging and dobutamine
magnetic resonance imaging in men with ischemic
cardiomyopathy. Am J Cardiol 2004;93(12):
1461–4.
[107] Rerkpattanapipat P, Little WC, Clark HP, et al.
Effect of the transmural extent of myocardial scar
on left ventricular systolic wall thickening during
intravenous dobutamine administration. Am J
Cardiol 2005;95(4):495–8.
[108] Wellnhofer E, Olariu A, Nagel E, et al. Magnetic
resonance low-dose dobutamine test is superior to
SCAR quantification for the prediction of func-
tional recovery. Circulation 2004;109(18):2172–4.
[109] Rerkpattanapipat P,Darty SN,HundleyWG, et al.
Feasibility to detect severe coronary artery stenoses
with upright treadmill exercise magnetic resonance
imaging. Am J Cardiol 2003;92(5):603–6.
[110] Hundley WG, Morgan TM, Neagle CM, et al.
Magnetic resonance imaging determination of car-
diac prognosis. Circulation 2002;106(18):2328–33.
[111] Rerkpattanapipat P, Morgan TM, Neagle CM,
et al. Assessment of preoperative cardiac risk with
magnetic resonance imaging. Am J Cardiol 2002;
90(4):416–9.
[112] Roest AA, Kunz P, Lamb HJ, et al. Biventricular
response to supine physical exercise in young adults
assessed with ultrafast magnetic resonance imag-
ing. Am J Cardiol 2001;87:601–5.