Embed Size (px)
Citation preview

ASSESSMENT OF UPLAND EROSION PROCESSES AND FARMER’S
PERCEPTION OF LAND CONSERVATION IN DEBRE-MEWI WATERSHED,
NEAR LAKE TANA, ETHIOPIA
A Thesis Presented to the Faculty of Graduate School
of Cornell University
in Partial Fulfillment of the Requirements for the Degree of
Masters of Professional Studies
By
Assefa Derebe Zegeye
May 2009

© 2009 Assefa Derebe Zegeye

ABSTRACT
Soil erosion is affecting global food security. Though it is a natural process, its
rate has increased significantly during the last century mainly by human activity. In
developing countries in order to combat erosion, many soil and water conservation
practices have been proposed but only a few, if any, are implemented by farmers on a
long-term basis. Therefore, this study sets out to evaluate upland erosion and evaluate
the effectiveness of practices used by farmers and the farmers’ perception about
erosion and control practices and to identify factors affecting farmers’ land
conservation decision-making processes. The watershed chosen was Debre-Mewi
located south of Bahir Dar, 30 km from Lake Tana. In this study, the paper presents
and discusses the results of the 15 surveyed agricultural fields and personal interview
of 80 households conducted in the Debre Mewi watershed. To quantify the amount of
soil loss due to rill erosion in the watershed, each rill’s dimensions were carefully
measured to determine its volume and hence to obtain average magnitudes and rates of
soil erosion for the fields. The result showed that the average soil loss in the surveyed
fields was 36t/ha provided that the contribution of inter-rill erosion assumed to be 25%
of the actual soil loss (taken from different literatures). Sediment measured from the
control plot of AARC experimental station located within surveyed fields was
estimated as 38.3 t/ha whereas using USLE model predicted 39 t/ha. Thus, all three
methods gave similar results. The knowledge and perceptions of the farmers about
erosion problems and mitigation measures, their reasons for not carrying out periodic
maintenance and construction of new conservation measures and conservations
practices that are widely used by the farmers are also discussed in this paper.

BIOGRAPHICAL SKETCH
Assefa Derebe was born in 1975 in the Amhara Regional State, Achefer
District, Ethiopia. He is married and has two children (a daughter and a newborn
boy). He was a teacher of mathematics and director of secondary schools for at least
10 years. He was also the chief administrator of Achefer Woreda before he joined the
Cornell Masters program conducted at Bahir Dar University.
He received his Diploma in Mathematics at Gonder Teacher’s College in 1997
and BSc at Bahir Dar University in 2003.
He has deep-rooted interest to study erosion modeling, soil and water
conservation, soil physics and hydrology.

In the name of GOD.
This work is dedicated for Haimanot Amare (my wife), Dessalegn Yizengaw (my dear
friend) and Meklit Assefa (3 yrs) (my daughter), who were the main initiator to join
this program and to complete this work with your patience, love, support and prayer.
Therefore, I dedicate this work for you with love.

vi
ACKNOWLEDGEMENTS
Above all, always and forever I thank my God for helping me throughout my
life and especially during my studies. Then, my thanks directly extends to Cornell
University for granting me financial support during the course time and finalizing this
study. I would like to thank the Bahir Dar University also who prepared this joint
program with collaboration to Cornell University that enabled me to get this chance.
My special thanks go to professors (Tammo S. Steenhuis, Stephen D. DeGloria,
Dwight Bowman, Robert W. Blake, Angela Neilan, Charles F. Nicholson, Dawit
Solomon and Amy S Collick) at Cornell University who gave me all the intended
courses with their gorgeous methodologies. I learned many teaching techniques from
them that I should practice it through out my life.
I would like to express my deepest gratitude to Professor Tammo S. Steenhuis,
for his supervision, valuable guidance, intellectual encouragement and critical and
constructive comments. I want to express my maximum respect to him. My
appreciation extends to Professor Blake, animal scientist at Cornell University, He has
taught me many things and has given a great deal of constructive feedback, valuable
and very critical comments on the structure and organization of this thesis. I am also
deeply indebted to Dr. Selamyihun Kidanu, his comments, advice and supports during
proposal writing and selection of research theme, modification of questionnaire, in
general his guidance how to start and finish the study were great to me. His
intellectual encourages and help are unforgettable. A special word of thank goes also
to Dr. Amy S Collick, Coordinator of this joint program. I do appreciate her
comments, editing and organizing this thesis. She gave us very helpful trainings
regarding to thesis writing and her valuable experiences.
The fieldwork for this research was carried out in Adet Woreda, Ethiopia. I
would like to acknowledge the support of Adet Agricultural Research Center (AARC).

vii
Especially I appreciate Ato Tadele Amare who never got tired of supporting me by
providing different resources and relevant data collected from the study site with his
valuable advices. Dr. Farzad Dadgari, SWHISA worker, has also a special place in this
study for his support during the proposal writing and supervising the fieldwork. His
comments were very constructive.
I am grateful to all (2007-2009) CU-BDU students for their encouragements
during the thesis writing. I have had an enjoyable time with you during the entire
study program.
Finally yet importantly, I have appreciated the endeavor and courage of my
wife Haimanot Amare, and my dear friend Dessalegn Yizengaw (Canada) and all my
family, especially my mother-in-law, Alem Gobezie, her support cannot be expressed
in words. Without her support, I would have hardly finished the entire program. I am
extremely happy to have a family like you.

viii
TABLE OF CONTENTS
BIOGRAPHICAL SKETCH .....................................................................................IV
ACKNOWLEDGEMENTS .......................................................................................VI
TABLE OF CONTENTS ....................................................................................... VIII
LIST OF FIGURE ....................................................................................................... X
LIST OF TABLES .................................................................................................... XII
ABBREVIATIONS .................................................................................................. XIV
1 INTRODUCTION ................................................................................................ 1
2 STUDY AREA ...................................................................................................... 8
2.1 Description of the study sites ........................................................................... 8
2.2 Climate ............................................................................................................. 10
2.3 Soil .................................................................................................................... 11
2.4 Farming system ............................................................................................... 12
3 METHODOLOGY ............................................................................................. 13
3.1 Erosion measurement and prediction ........................................................... 13 3.1.1 Measurement of rill erosion ........................................................................... 13 3.1.2 Prediction of soil loss .................................................................................... 15
3.2 Infiltration, Bulk density and Water holding capacity ............................... 16
3.3 Farmers’ perceptions of SWC measures ...................................................... 17
3.4 Methods of data analysis ................................................................................ 19 3.4.1 Rill erosion .................................................................................................... 19 3.4.2 Social Survey Analysis .................................................................................. 21
4 RESULTS AND DISCUSSION ......................................................................... 22
4.1 Physical properties of soil in the sampled fields .......................................... 22

ix
4.1.1 Bulk density ................................................................................................... 22 4.1.2 Moisture Content (MC) ................................................................................... 23 4.1.3 Infiltration ...................................................................................................... 23
4.2 Rill erosion ...................................................................................................... 24 4.2.1 Soil loss due to rill erosion under different situations ................................... 24 4.2.2 Classification of rills ...................................................................................... 26 4.2.3 Nature of rill erosion in crop types ............................................................... 28 4.2.4 The nature of rill erosion in different slope positions ................................... 33 4.2.5 Estimation of soil loss using USLE ............................................................... 34
4.3 Effects of different physical factors on soil erosion and processes ............ 38 4.3.1 Effects of rainfall to soil erosion ................................................................... 38 4.3.2 Effects of run-on to soil erosion .................................................................... 40 4.3.3 Effects of crop cover to soil erosion .............................................................. 41 4.3.4 Effects of soil texture on erosion processes .................................................. 44
5 FARMERS’ PERCEPTION OF LAND CONSERVATION ......................... 46
5.1 Household and farm characteristics ............................................................. 46
5.2 Perceptions of erosion as a problem ............................................................. 50
5.3 Causes of Soil erosion, Soil fertility and Productivity decline .................... 51
5.4 Farmers’ conservation practices in the watershed ...................................... 53
5.5 Farmers’ perception, acceptance and adoption of SWC measures ........... 56
5.6 Factors Affecting Adoption of the Introduced SWC Technologies ........... 58
6 RECOMMENDATIONS ................................................................................... 60
7 CONCLUSIONS ................................................................................................. 62
8 REFERENCES ................................................................................................... 64
APPENDIX A: TABLES ........................................................................................... 71
APPENDIX B: QUESTIONNAIRE ......................................................................... 87

x
LIST OF FIGURE
Figure 1: Location of the area of Debre Mewi watershed, Ethiopia .............................. 8
Figure 2: Location of surveyed fields and villages where respondents were selected ... 9
Figure 3: Partial view of Debre Mewi watershed (photo by Assefa D. July 2008) ..... 10
Figure 4: Mean monthly rainfall, humidy and mean monthly temperature for the Adet
weather station for the years 1996-2005, seven km from the Debre Mewi
watershed .............................................................................................................. 11
Figure 5: A single plot divided in to five transects to show how to measure rills ....... 14
Figure 6: Photographs of rill dimension measurements: depth on the right and width
on the left (photo by Assefa D. 2008) .................................................................. 15
Figure 7: Infiltration rate (IR mm/hr) of two locations at down slope (DS) and mid
slope fields ............................................................................................................ 24
Figure 8: Photograph to show on-site effects of erosion features (rills and sheet) in one
of surveyed fields in Debre Mewi watershed, Ethiopia. ...................................... 28
Figure 9: Photographs of the severity of erosion damage with onsite effect (A) and
offsite effect (B) of erosion (photographs taken during the survey, 2008), Debre
Mewi watershed, Ethiopia .................................................................................... 28
Figure 10: Stuffing activity of tef fields by animals, Debre Mewi watershed, Ethiopia
.............................................................................................................................. 30
Figure 11: Photograph to show rill erosion feature in tef fields, Debre Mewi, Ethiopia
.............................................................................................................................. 30
Figure 12: Erosion rate in tons /ha over the growing season as a function of slope
position; where DS is down slope, MS is middle slope and US is upper slope.
AAD is area actual damaged due to rill formation in m2/ha. ............................... 34
Figure 13: Average soil loss for the 15 upland agricultural fields in the Debre-Mewi
watershed, the light shaded columns is the cumulative soil loss for the season.

xi
The black boxes are the soil losses for the individual storms; the line with
diamonds is the cumulative rainfall. ..................................................................... 39
Figure 14: Graph of crop cover versus soil loss rate .................................................... 42
Figure 15: Photograph of active gully formation in the Debre Mewi watershed,
Ethiopia ................................................................................................................. 50
Figure 16: Side effects of cultural ditches, the left side is improperly designed and the
right side indicates the overflowing of concentrated runoff . ............................... 55

xii
LIST OF TABLES
Table 1: Soil physical characteristics in the surveyed fields taken in the rainy season.
.............................................................................................................................. 23
Table 2: Classification of rills and their contribution in soil loss ................................. 25
Table 3: General descriptions of rill erosion magnitudes in the Debre Mewi watershed
measured in two months of July and August ........................................................ 27
Table 4: Rill magnitudes in different crop types .......................................................... 31
Table 5: Multiple comparisons (LSD, ANOVA) to show significant differences of
variables among crop cover types (T is crop type, AAD is area of actual ........... 32
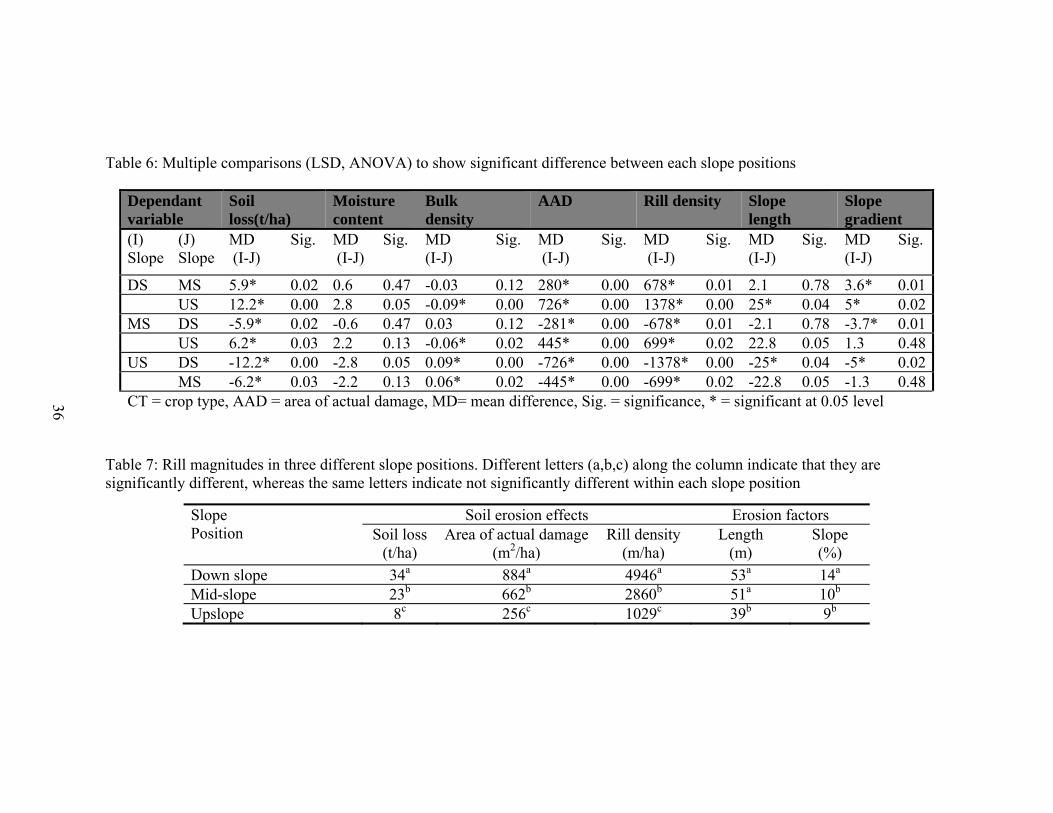
Table 6: Multiple comparisons (LSD, ANOVA) to show significant difference
between each slope positions ................................................................................ 36
Table 7: Rill magnitudes in three different slope positions. Different letters (a,b,c)
along the column indicate that they are significantly different, whereas the same
letters indicate not significantly different within each slope position .................. 36
Table 8: Comparison between measured and predicted soil loss in Debre Mewi
watershed (see appendix A Table A3 how each parameters were estimated) ....... 37
Table 9: Contribution of run-on on rill formation and soil loss ................................... 41
Table 10: Relationship between soil loss and crop cover (cc). .................................... 43
Table 11: Laboratory analysis result of the plough layer soil property at six
representative locations in Debre Mewi watershed by AARC in 2008. ............... 44
Table 12: Characteristics of total households and their livestock in the four villages of
the watershed (HH stands for household) ............................................................ 47
Table 13: The percentage of respondents who owned livestock and farm size ........... 48
Table 14: Perception of respondents for soil erosion as a problem .............................. 51
Table 15: Farmers’ response to the causes of soil erosion, fertility and productivity
decline ................................................................................................................... 52

xiii
Table 16: Farmers’ conservation practices in the Debre Mewi watershed, Ethiopia ... 54
Table 17: Indicators of acceptance and adoption of SWC technologies ...................... 57
Table 18: Farmers’ reasons for not adopting the newly introduced SWC measures .. 58

xiv
ABBREVIATIONS
AAD Area of Actual Damage
AARC Adet Agricultural Research Center
BD Bulk Density
CC Crop Cover
DA Developmental Agent
DS Downslope
HH Household
IR Infiltration Rate
masl meter above sea level
MoA Ministry of Agriculture
MC Moisture content
MS Midslope
RF Rainfall
SCRP Soil Conservation Research Program
SWC Soil and Water Conservation
SWHISA Sustainable Water-Harvesting and Institutional Strengthening in
Amhara
US Up Slope
1
CHAPTER ONE
1 INTRODUCTION
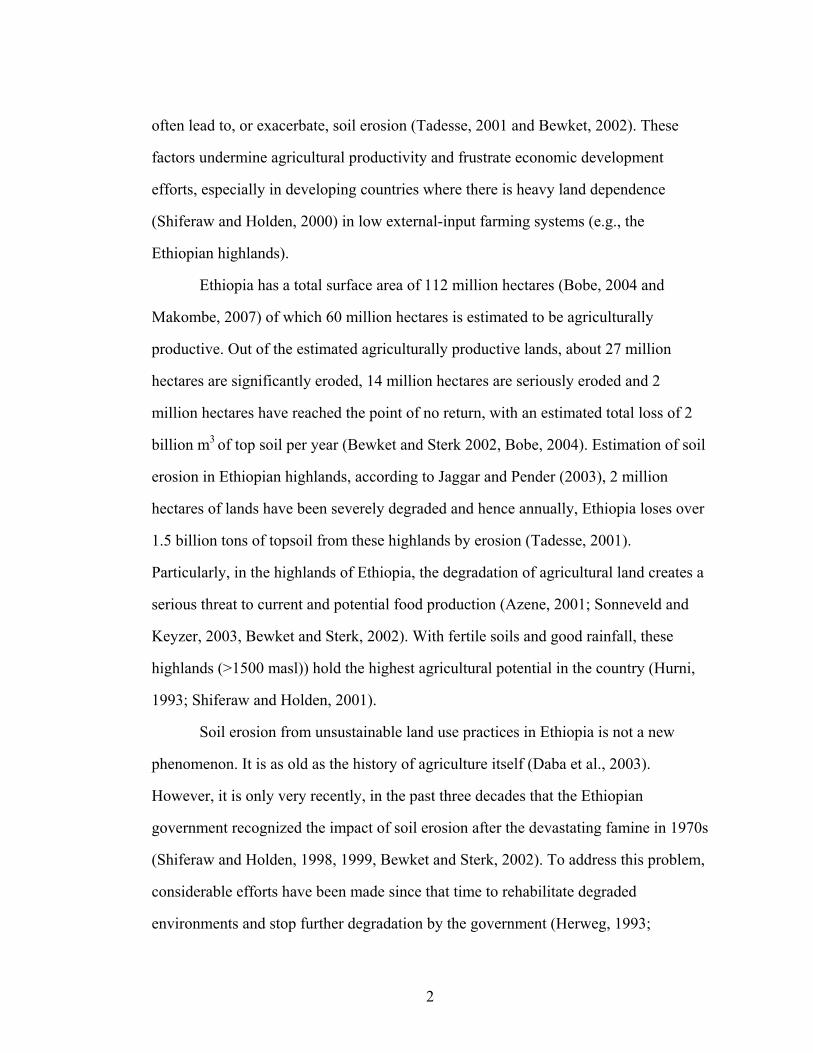
Soil erosion is recognized as one of the world's most serious environmental
problems (Pimentel et al., 1995, Shiferaw and Holden, 1999). Globally, about 80% of
the current degradation of agricultural land is caused by soil erosion (Angima et al.,
2003). Erosion by water, at a global scale, is the main soil degradation process in
agricultural areas (Bewket and Sterk 2002). It generates strong environmental impacts
and major economic losses from decreased agricultural production and from off-site
effects on infrastructure and water quality by sedimentation processes (Zinabu et al.,
2002; Daba, 2003; Haregeweyn et al., 2005; Amsalu et al., 2007). Morgan (1996),
summarized the maximum annual rates of soil erosion in cultivated fields ranging from
200t/ha in China, to 30t/ha in Belgium.
Soil erosion creates severe limitations to sustainable agricultural land use, as it
reduces on-farm soil productivity and causes food insecurity (Tadesse, 2001;
Sonneveld, 2002; Beshah, 2003, Moges and Holden, 2006, Bewket, 2007). In most
developing countries, including Ethiopia, human activity triggers these losses
(Mohammad et al., 2001, Belyaev et al., 2004, Bewket and Sterk, 2005, Hurni et al.,
2005). This is associated with rapid population growth, inadequate attention to the
basic natural resources (soils, water and vegetation), and the need to maximize
production to meet the needs of the growing population (Shiferaw and Holden, 1999,
2000, Bewket, 2002, Feoli et al., 2002). This situation is more serious in poor
developing countries like Ethiopia (Feoli et al., 2002), where subsistence production
predominates. The Ethiopian farmer, who on average cultivates one hectare of food
crops and keeps some livestock, is nowadays dependent on natural conditions and
cannot tolerate further deterioration of soil productivity (Sonneveld and Keyzer, 2003).
Increasing population, intense land cultivation, uncontrolled grazing, and deforestation
2
often lead to, or exacerbate, soil erosion (Tadesse, 2001 and Bewket, 2002). These
factors undermine agricultural productivity and frustrate economic development
efforts, especially in developing countries where there is heavy land dependence
(Shiferaw and Holden, 2000) in low external-input farming systems (e.g., the
Ethiopian highlands).
Ethiopia has a total surface area of 112 million hectares (Bobe, 2004 and
Makombe, 2007) of which 60 million hectares is estimated to be agriculturally
productive. Out of the estimated agriculturally productive lands, about 27 million
hectares are significantly eroded, 14 million hectares are seriously eroded and 2
million hectares have reached the point of no return, with an estimated total loss of 2
billion m3 of top soil per year (Bewket and Sterk 2002, Bobe, 2004). Estimation of soil
erosion in Ethiopian highlands, according to Jaggar and Pender (2003), 2 million
hectares of lands have been severely degraded and hence annually, Ethiopia loses over
1.5 billion tons of topsoil from these highlands by erosion (Tadesse, 2001).
Particularly, in the highlands of Ethiopia, the degradation of agricultural land creates a
serious threat to current and potential food production (Azene, 2001; Sonneveld and
Keyzer, 2003, Bewket and Sterk, 2002). With fertile soils and good rainfall, these
highlands (>1500 masl)) hold the highest agricultural potential in the country (Hurni,
1993; Shiferaw and Holden, 2001).
Soil erosion from unsustainable land use practices in Ethiopia is not a new
phenomenon. It is as old as the history of agriculture itself (Daba et al., 2003).
However, it is only very recently, in the past three decades that the Ethiopian
government recognized the impact of soil erosion after the devastating famine in 1970s
(Shiferaw and Holden, 1998, 1999, Bewket and Sterk, 2002). To address this problem,
considerable efforts have been made since that time to rehabilitate degraded
environments and stop further degradation by the government (Herweg, 1993;
3
Yeraswork, 2000, Amsalu and Graaff, 2004, Bewket, 2006). By this action, huge areas
were covered with terraces, and millions of trees were planted (Yeraswork, 2000;
Tadesse, 2001).
Water action during soil erosion comprise the following processes: (1) splash
erosion, which occurs when soil particles are detached and transported as a result of
the impact of falling raindrops; (2) sheet or inter-rill erosion, which removes soil in
thin layers and is caused by the combined effects of splash erosion and surface runoff;
(3) rill erosion, which is the transport or detachment of soil particles caused by
concentrations of flowing water; and (4) gully erosion, which occurs when flow
concentration increases and the incision becomes deeper and wider than rills
(Mwendera & Mohamed Saleem, 1997; Mwendera et al., 1997; Morgan, 2005; Mitiku
et al., 2006).
Visible erosion features, such as rills, gullies and concentrated accumulations,
are features that often indicate hot spots, those parts of an area that are seriously
affected by soil erosion (Mitiku et al., 2006). Rills are very shallow channels that are
formed by the concentration of surface runoff along depressions or low points in
sloping lands. Rill erosion is the very visible mechanism of soil loss from sloping,
cultivated land Soil erosion that occurs in areas between rills by the action of raindrops
(causing splash erosion) and surface runoff (causing sheet erosion) is called inter-rill
erosion. Compared to sheet erosion, rill has an entirely different characteristic. It
removes a considerable amount of topsoil greater than sheet/inter-rill erosion (Nyssen
et al., 2004). Through rills, eroded particles are transported quickly over a large
distance. Large particles are more effectively transported. Rills differ from gullies in
that they are temporary features and can be easily destroyed during plowing, whereas
gullies are more permanent features in the landscape. Rills and gullies constitute an
“embryonic” drainage system (Mitiku et al., 2006), which, if unchecked, will develop

4
eventually in to badlands. This may involve irreversibility of the land to put it back
into crop production in agricultural systems that are based on animal-drawn
implements for cultivating the land (Mitiku et al., 2006).
Rill erosion is a result of surface runoff and associated sheet wash, which is a
process that selectively removes fine material and organic matter that are very
important determinants of land productivity (Bewket and Sterk, 2003). The shearing
power of the water can detach, pick up and remove soil particles making these
channels the preferred routes for sediment transport. Hence, rill erosion is probably the
most important form of soil loss in cultivated fields because in the absence of these
channels, which serve the purpose of transporting detached materials, inter-rill erosion
will be negligible (Bewket and Sterk, 2003).
The evaluation of soil erosion was undertaken through measurement of rill
erosion features (Bewket and Sterk, 2003, Belyaev et al., 2004, Casalí et al., 2006).
This method is used to estimate the amount of material removed from the field by
concentrated runoff. As suggested by Bewket and Sterk (2003), for practical
conservation planning purposes rill survey is a key. Most quantitative research on soil
erosion has dealt with soil loss rates due to rill and inter-rill erosion, mostly from
runoff plots; and the magnitude of soil erosion and its effect has been extrapolated
based on plot level and catchment level to larger spatial scales (Bewket and Sterk,
2003, Nyssen et al, 2004, Belyaev et al., 2004). These methods have their own
drawbacks when the results are extrapolated and conclusions are made about the wider
landscape (Brazier, 2004).
Plot studies measure only the movement of soil over a relatively small area,
which is not entirely related to the real-life situation where deposition takes place
further down the slope. This is likely to lead to an overestimation of on-site soil loss
from small plots (Mwendera et al., 1997, Brazier, 2004). Moreover, plots are often

5
sited where erosion is known to occur (Brazier, 2004). The physical constraints of plot
boundaries are also a potential problem. Most plot sites fail to recreate the conditions
found within the field, as boundaries eliminate any flow paths in and out of the plot
and interrupt the movement of sediment by splash along the plot margins (Wainwright
et al., 2000, Brazier, 2004).
Catchment-level studies measure the actual loss of soil from the land and take
into account the deposition of sediment on the land surface. However, there are also
problems associated with catchment-level data; the calculation of erosion rates from
recordings of river sediment loads requires the specification of a sediment delivery
ratio, the value of which is unknown for most catchments (Brazier, 2004).
Furthermore, measuring sediment at the outlet of the watershed does not indicate from
which land use in the watershed such amount of sediment came from. It reflects an
aggregate output across the whole area and cannot provide details of re-deposition or
redistribution within the watershed. This limitation is further discussed by Bewket and
Sterk (2003), who argued that as erosion does not occur in a uniform fashion across
the whole plot, it shows extreme spatial variation with variations in rainfall energy,
gradient and length of slopes, inherent soil characteristics affecting its erodibility and
land use and land management practices. Therefore, this method may mislead one to
consider soil loss in terms of mass per unit area to plan appropriate SWC measures.
On the other hand, field surveys of rills have an integral role to play in the sustainable
management of agricultural lands in particular. Without involving expensive
instrumentation and sophisticated modeling of soil loss, this strategy may yield more
economical (and efficient) solutions in local areas than the application of the existing
generation of erosion models (Herweg, 1996; Bewket and Sterk, 2003). It must also be
treated as a means in itself to aid soil conservation (Herweg 1996) and to inform
6
catchment managers and decision/policy makers. Hence, assessment of soil loss by
surveying rill erosion plays a great role for soil and water conservation planning.
Effective control of soil erosion is a critical component of natural resource
management when the aim is to achieve sustainable agriculture and acceptable
ecosystem integrity (Pimentel et al. 1995; Tamene et al, 2006). Farmers’ perception of
land degradation by erosion is a key social factor that is also important in deciding
options for controlling soil losses (Graaff, 1993). Some authors who studied in
different parts of Ethiopian highlands reported that farmers are more likely to adopt
conservation measures in plots that are highly prone to soil erosion, such as plots
where slopes are steep and erosion features are visible (Shiferaw and Holden, 1998;
Bekele and Drake 2003; Gebremedhin and Swinton 2003). Amsalu and Graaff (2006)
concluded that under the current conditions in the Ethiopian central highlands, soil and
water conservation interventions should consider farmers’ conservation knowledge
and practices to improve the possibility of acceptance and adoption of the
recommendations. Farmers rather frequently reject newly introduced SWC
technologies even when they are aware that the measure protect and improves
productivity of their lands.
Based on the literature cited above, it is obvious that the newly introduced
SWC technologies need to be evaluated not only for their technical efficacy but also
for the probability of their sustainable adoption and utilization by the land users. The
latter requires identification of barriers to and facilitators of adoption of the
technologies. Once the barriers and facilitators are identified, recommendations can be
made on appropriate steps that need to be taken to enhance the adoption of the
technologies and to effect sustainable land use (Amsalu and Graaff, 2006).
Understanding farmers’ knowledge and their perception and factors that influence their
land management practices are of paramount importance for promoting sustainable
7
land management. During the qualitative phase of this study, we attempted to
understand farmers’ knowledge and perception on soil erosion processes, soil fertility,
acceptance and adoption of the newly introduced soil and water conservation (SWC)
measures and other relevant data used for the study.
The overall goal of this research is to determine the severity of soil erosion and
to identify factors affecting the decision making process of farmers in their land
conservation practices. The specific objectives are (1) to document the severity and
rate of soil loss due to rill erosion; (2) to identify the high-risk erosion areas in the
watershed (hot spots) using pictures; (3) to understand the farmers’ perception and
awareness of erosion processes and SWC measures as a land management practice; (4)
to examine the local farmers’ acceptance and adoption of land conservation
technologies; and (5) to identify factors affecting their land conservation decisions.
The study was carried out in the Debre Mewi watershed south of Bahir Dar.
The research involved a rill survey methodology on different slope positions and crop
types. Semi-structured questionnaire and some soil samples were also used. Finally,
soil loss obtained from rill measurements was compared with USLE model and
sediment collected from the control plot of the Adet Agricultural Research Center
(AARC) experimental station in the study site.

8
CHAPTER TWO
2 STUDY AREA
2.1 Description of the study sites
This paper is based on a survey conducted during the months of July to
October 2008 in the Debre Mewi watershed located between 11o20’13’’ and
11o21’58’’ N and 37o24’07’’ and 37o25’55’’ E which is situated within two kebele
administrations, Debre Mewi (Yilmana Densa Woreda) and Fereswoga (Bahirdar
Zuria Woreda). The watershed is located about 500 km north of Addis Ababa, capital
of Ethiopia, and 30 km south of Lake Tana at Bahir Dar Town, the capital of Amhara
Regional State in the northern Ethiopian highlands (Figure 1). The elevation ranges
between 1950 and 2309 m.a.s.l. Thus, the area experiences semi-humid climate. The
slope gradient of the watershed ranges from 8 to 30%.
Figure 1: Location of the area of Debre Mewi watershed, Ethiopia
The total area of the watershed is estimated to be 523 ha (nearly 5km2). There
are four villages identified within the watershed named, Quyo, Mariam-wuha, Shanko-
bahir and Feres-woga (Figure 2). The total number of households living in these
villages is estimated to be 276 of which 35 (13%) are women-headed households. It is
also estimated that about 1092 people are living in the watershed. Most farmers whose

9
farmlands are found in the watershed are living near the edge and outside of the
watershed. Several farmers also have farmlands outside the watershed.
Figure 2: Location of surveyed fields and villages where respondents were selected
The watershed is sensitive to erosion. Vegetation cover is poor (see Figure 3),
and rills and gullies are prominent features, threatening the existence of the
communities, reducing the arable area, cutting roads and making access difficult. As a
result, the area is considered as one of the degraded areas in Ethiopia. To reduce soil
loss, farmers had installed drainage furrows (locally called feses) slightly off the
contour. The few conservation efforts like stone and soil bunds that were installed
with the help of outsiders were not maintained. Most of these structures (stone and soil
bunds) are damaged, reducing their effectiveness and even allowing concentrated flow
that enhances the development of rills and gullies downstream.

10
Figure 3: Partial view of Debre Mewi watershed (photo by Assefa D. July 2008)
2.2 Climate
Based on 10 years (1996-2005, see appendix A Table A4-9) of metrological
data for the Adet station (7 km from the site), the climatic can be characterized as
follows: maximum annual temperatures occur in either March or April and ranges
from 22 to 29.4oC whereas; minimum annual temperature occur in either November or
December with a range of 5.4 to 12.1oC over the 10 years. The average annual rainfall
is 1238 mm with a maximum of 1695 mm in 1996 and a minimum of 956 mm in 2002.
Since the watershed lies at a higher elevation than Adet, temperatures are often slightly
lower while rainfall is likely greater. The rainfall follows a unimodal annual
distribution with more than 72% of the annual rainfall during the four months from
June to September (locally called kiremt). It is in this season that the major agricultural
activities, such as plowing, sowing and weeding are performed. The dry months are
between November and March (known as bega) when less than 6% of the total annual
rainfall occurs. The kiremt season (June – September) is more dependable for farming
activities.
According to the method of calculation made by the manual of watershed
management of Ministry of Agriculture in Ethiopia (2001), the annual potential
Sampled fields

11
evapotranspiration (PET) ranges from 110 to 125 mm. The length of growing period
(LGP) which is defined as the continuous period of the year when rainfall exceeds half
the potential evapotranspiration (PET) plus the period required evaporating an
assumed 100 mm of stored soil water (MoA, 2001) ranges from 120 to 180 days and
hence it is classified as a moist zone. The wind speed ranges from 0.68m/s in
November to 1.14 m/s in May. According to Bahir Dar station 30 km from the site, the
mean sun shines duration range from 4.4 hours in July and August to 10.0 hours in
February.
The relationship between mean annual rainfall, mean annual temperature and
mean annual humidity is illustrated in Figure 4.
Figure 4: Mean monthly rainfall, humidy and mean monthly temperature for the Adet weather station for the years 1996-2005, seven km from the Debre Mewi watershed
2.3 Soil
The dominant soil types in the watershed include vertic nitosols (locally known
as silehana) located at the major mid-slope positions. It is reddish-brown and popular
especially for tef crop production. Nitosols (locally, dewel) located in the upper part of
the watershed. This is a very deep, well-drained red clay loam soil. This is considered

12
as the most productive soil type in the watershed. The other major soil type is vertisols
(locally, walka), which covers the major lower slope positions of the watershed. This
soil class can be characterized by heavy clay black color and are mostly water logged
during the rainy season (Mohammad et al., 2001, Mintesinot, et al 2004).
2.4 Farming system
Agriculture in Debre Mewi watershed is rain-fed, with a subsistence mixing
farming system. Land and livestock are therefore the most important livelihood assets.
Tef (Eragrostis tef), finger millet, maize (Zea mays) and Wheat (Triticum vulgare) are
the major crops cultivated during the rainy season.
In the Debre Mewi watershed, livestock is kept for various reasons, such as a
means of transportation, sources of milk and meat, traction (plowing and land
preparation), and skins. Cows, oxen, sheep, goats and donkeys are the major livestock
in the area. Small ruminants like sheep and goats are kept for income generation. Oxen
are used for plowing while donkeys transport agricultural and non-agricultural
products.
13
CHAPTER THREE
3 METHODOLOGY
Rate of erosion was determined by measuring the dimension of the rills in time
and calculating from that the soil removed from the rills. The measured soil erosion
rates were compared to those predicted with the USLE. In addition, to understand
farmers’ perception of soil erosion processes and land conservation technologies,
personal interviews and group discussions were undertaken. The methods are
discussed in detail in the following sections.
3.1 Erosion measurement and prediction
For determining, the erosion by the rill measurements, 15 representative fields
were selected from the 523 ha land of the whole Debre Mewi watershed. The total area
of the 15 fields was 3.56 ha (almost 1% of the watershed area). These fields were
classified into three slope positions: upslope, mid-slope and down-slope fields. They
were defined according to their positions from the up-slope edge of the watershed (Fig.
2). The total distance from the edge to the river was 450 m, the up-slope plots were
within the first 100 m from the edge and had a slope of 9%, the mid-slope plots were
located from 100 to 250 m with a slope of 10%. Finally, the bottom plots were in
remainder concave part of the watershed with an average slope 13% (Appendix A,
TableA1). In the down slope position, all the six fields were covered by tef crop and in
the up slope position, both fields were sown with finger millet, whereas in the mid
slope position, four fields were covered with tef and the rest three fields were maize,
finger millet and wheat crops. Therefore, the rate of soil loss between different crop
types was compared only in the mid slope fields.
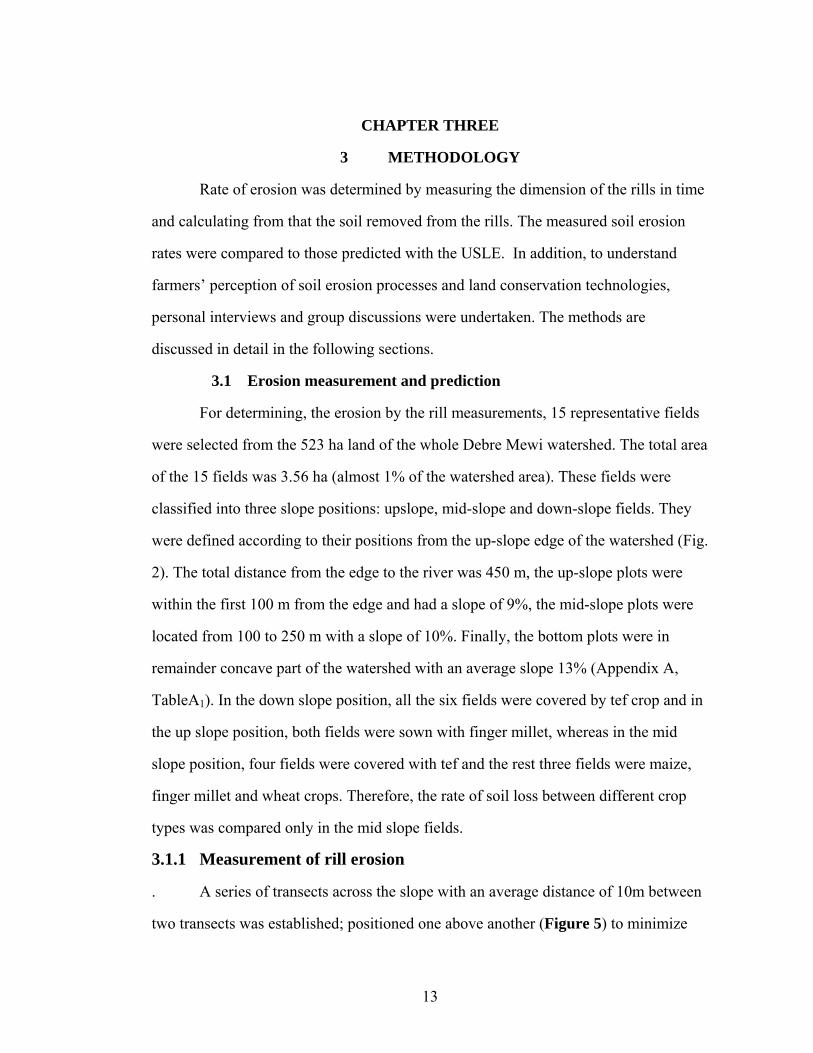
3.1.1 Measurement of rill erosion
. A series of transects across the slope with an average distance of 10m between
two transects was established; positioned one above another (Figure 5) to minimize

14
rill measurement errors and marked using sticks and stones (Hudson, 1993). Cultural
ditches (locally called feses) constructed in the field for conservation mechanisms
were also used as transects so that measurements of rills found between two
consecutive ditches were undertaken.
Figure 5: A single plot divided in to five transects to show how to measure rills
During the months of July and August when the greatest rainfall amounts
causing significant soil loss were recorded, each field was repeatedly visited
immediately after rainfall storms had occurred. Rill measurements were not taken until
rills were clearly noticed. At the initial measurement of rills, fields intended for tef
were not sown yet. For other fields intended for maize, wheat and millet,
measurements were carried out after sowing.
Though the channel size and shape of rills had a great influence on
measurement accuracy (Casalí et al., 2006), the length, width and depth of the rills
were carefully measured along two successive transects. The length of a rill was
measured from its starting point up to the place where the eroded soil was deposited.
The width and depth of rill was measured as shown in Figure 6. Widths were
measured at several points along a rill (Figure 6) to give a better approximation of a
mean width because the width varied along the rill (Herweg, 1996). Since the depths
Rills due to runon
Rills within field
Sticks or stones
One transect

15
of most rills were homogenous, the number of depth measurement points was not as
numerous as the width measurement points. From these measurements, different
magnitudes of rill erosion, such as rill volumes, rates of erosion, density of rills, area
of actual damage by the rills and the percentage of area covered by the rills to the total
area of surveyed fields, were determined (Herweg, 1996, Hagmann, 1996, Bewket and
Sterk, 2003).
Figure 6: Photographs of rill dimension measurements: depth on the right and width on the left (photo by Assefa D. 2008)
Metrological data of 10 years (1996-2005) was collected from the Adet
Metrological station (7 km from the study site) in order to describe the climatic
conditions of the study area. Daily rainfall data were obtained from this station before
the Adet Agricultural Research Center (AARC) installed a rain gauge in the watershed
at the end of July 2008 (see Appendix A Table A4-9). Starting from August 1, the
onsite rain gauge was used to measure daily rainfall amounts, which were used to
examine the relationship between the temporal distribution of rainfall amount, eroded
soil volume and rate due to rills (Mitiku et al., 2006, Bewket, and Sterk, 2003).
3.1.2 Prediction of soil loss
Finally, parameters including average annual rainfall, slope length, slope
gradient, soil color, land cover and management practices were collected in all the
surveyed fields and estimated according to Hurni (1985b) adapted for Ethiopian
conditions cited in the guide of watershed management by Ministry of Agriculture
(MoA) (2001) in order to test the universal soil loss equation (USLE). The USLE is as
follows:
E = R * K * L * S * C* P ….............................. Equation 1
where E is the mean annual soil loss, R is a rainfall erosivity index, K is a soil
erodibliity index, L is the slope length, S represents slope steepness, C is a crop factor,
16
P is a conservation practice factor. Hence, the amount of soil loss was estimated by
this equation and compared with the measured soil loss. The sediment collected from
the control plot of AARC research station was also used to compare with the surveyed
result.
3.2 Infiltration, Bulk density and Water holding capacity
Two infiltration tests on the mid-slope and down slope fields were conducted
in October using double-ring infiltrometer with diameters of 53cm and 30cm for the
larger and smaller rings respectively (Gregory et al., 2005). The ring was driven into
the ground an average of 15 cm on all locations. Both the outer and inner rings were
filled with water (100 mm depth), and the rate at which the water moves into the soil
was measured and this activity took for an hour until the rate became constant. A
graduated plastic ruler was used to read water depth differences in the inner ring. The
major constraint was shortage of water to replicate the measurements and therefore
only two tests were carried out. The other limitation was that siphon was not used for
further minimizing errors.
For the soil BD and MC assessment, soil samples were collected in the three
typical slope positions from fifteen fields in three locations within each field using a
core-sampler. The three locations in each of fifteen fields were selected to represent
the surveyed fields. Forty-five soil samples were collected from the topsoil of all
surveyed fields to estimate the bulk density (BD) and moisture content (MC) of the
soil. For confirmation of the initial measurements of MC, soil samples were collected
again at each of the three-slope positions one month after the first sample was taken.
Soil samples were brought back to the soil laboratory for air-dried and
examined for their physical properties like BD, MC. To estimate the value of bulk
density and moisture content of the soil, each core sampler before it was filled by soil
and after filled soil were carefully measured before entered to the oven to dry. The
17
dried soil was calculated by subtracting the mass of moisture and core-sampler having
volume 98.1 cm3 to get the bulk density of each sample. The MC was calculated by
subtracting the dried soil from moist soil measured before entered to the oven and
expressed as percentage.
3.3 Farmers’ perceptions of SWC measures
In order to capture the perception of soil erosion process and factors affecting
farmers’ land conservation decision-making processes and related reasons, a formal
and informal interview were conducted. In addition, the researcher periodically visited
the entire research area and the wider farming system so that he was able to learn
several things by observation. Issues that immerged from observation were used to
guide interviews and discussions with selected farmers. Closer observations were
made in selected fields where measurements were carried out.
Data and information about perceptions of farmers in soil erosion processes
and SWC technologies were collected using formal interviews with the sampled
households. To obtain information about the same fact from multiple methods and to
increase validity and reliability of data, focus group discussions (composed of elders,
male and female farmers and community leaders) and informal interviews with
developmental agents and Woreda agricultural experts were carried out.
The formal interview was conducted with 80 households (owning 95 ha crop
lands of which some plots are out of the watershed) selected in the four villages of the
Debre Mewi watershed (Quyo, Shanko-Bahir, Mariam-Wuha and Feres-Woga) as
indicated in figure 2 above. The sampled households (HHs) were randomly selected
from a list of total HHs collected from the representatives of each village. Every fourth
HH on the list contained all 276 HHs of the watershed was included in the sample
group before personal interview was conducted in August. However, using this
technique, only 69 HHs were selected. The rest 11 HHs were added by considering
18
those who possessed fields treated with soil and water conservation technologies and
those who had untreated fields. When the selected household was unavailable after
repeated visits or specifically stated their unwillingness, the next household on the list
was interviewed. Eight households, most of them from Fereswega village, were
substituted for this study. A few farmers in this village felt land insecure and not
willing to participate. They believed incorrectly that the objective of the interviews
was a trick to sell their land. Their belief was based on the experience of farmers in a
community in the neighboring kebele, 10 km towards Bahir Dar town, where land was
sold to investors for flower production
Most interviews were undertaken by going to each interviewee’s homestead
and some times in Debre Mewi small town when they came for marketing activities.
Since this interview used to obtain farmers’ knowledge and attitude of erosion
processes and the decisive factors that influence the adoption of the newly introduced
conservation measures, special care was given while interviewing farmers to get
enough information for the intended study.
Since the field work for this study was conducted during the rainy season (July
to September of 2008), the farmers were occupied with the preparation of the land,
sowing crops and weeding. Therefore, farmers did not have time to sit down and
participate in a formal interview in these working days. However, since all the
inhabitants in the watershed have only one type of religion (Orthodox), the only
options the researcher used was the holydays to undertake most of the interviews. In
these holydays (at least 12 days in a month), the regulation and rule of their religion
forbids working any agricultural practices. Violating the law makes out of any social
activities. Therefore, these days were convenient to undertake the formal interview.
The questionnaire was comprised of open and closed-ended questions. The final
questionnaire was modified conducted after pre-testing. The questionnaire included

19
issues of household and farm characteristics, perceptions of erosion problems and
noticeable changes in soil fertility and productivity and some hydrological parameters
over time. Causes of soil erosion, currently implemented soil conservation measures
and farmers’ conservation knowledge were also covered in the survey instrument.
Moreover, indicators of acceptance and adoptions of the newly introduced SWC
measures, and major limitations to apply SWC measures were the most important parts
of the instrument. Information which is used for explaining the perception of the soil
erosion problem, the adoption of conservation measures, household demographic and
some socioeconomic characteristics which were relevant for the study were collected
mostly using open ended questions.
The respondents were encouraged in order to express their perceptions,
feelings, knowledge and all ideas they had about the planned study. Though some
attempts were made to crosscheck responses of the farmers, like landholding sizes and
number of livestock owned from records of the DA and local agricultural office, the
researcher could not find any recent document regarding to such points.
3.4 Methods of data analysis
3.4.1 Rill erosion
In each field, maximum development of rills, both in number and dimensions,
was attained during August 1, 2008 (see appendix A, Table A2 how to calculate rill
magnitudes). After this time, the rill dimensions did not show significant change
though there was still soil loss as long as there is rainfall. Therefore, the maximum
value was analyzed in this paper to estimate the total soil loss due to rills. The eroded
soil volumes, rill densities, areas of actual damage and other quantities were calculated
from the measured rill dimensions: length, width and depth (Herweg, 1996). The soil
volume was calculated using the following formula.
..……………………….Equation 2 ( )A
NDWLX iiii
10000∑=

20
where X is the volume of rills in m3/ha, L is the length (m) of the rills, W is the width
(cm) of the rills, D is the depth (cm) of rills, A is the area of each field in ha, N is the
number of rills, i is the number of homogeneous dimensions. The calculated volume is
equivalent to the volume of soil lost from the formation of the rills. The total volume
of soil loss was obtained simply by summing the volumes of all homogenous rill
segments as shown in Equation 2. The eroded soil volume was also expressed in terms
of weight of eroded soil by multiplying the calculated volume by the measured bulk
density of the soils at each of the 15 fields in the site (Hagmann, 1996). The total soil
loss was converted into per unit hectare of land to express the annual rate of soil loss.
The area of actual damage per unit hectare was obtained from the product of length
and width dimensions of each homogenous rill segment by using Equation 3. The rill
density was calculated by dividing the total rill lengths, obtained by summing up the
length measurements of all the rills, by the total area of the surveyed fields (Equation
4).
..………………………Equation 3
.…………………………….. Equation 4
where AAD is the area of actual damage by rills in m2/ha, L is the length (m) of the
rills, W is the width (cm) of the rills, D is the density (m/ha) of rills, A is the area of
each field in ha, N is the number of rills, i is the number of homogeneous dimensions.
The rill densities were also converted into per unit hectare of land. The soil loss due to
cultural ditches themselves was estimated by calculating the changes of their widths
and depths by Equation 2. The relationships between soil loss rate, rainfall and crop
coverage were analyzed. The number of rills originating from upper fields and rills
( )A
NWLAAD iii
100∑=
( )A
NLD ii∑=

21
initiated within the field and their contributions to soil loss were identified in the
study. The spatial variation of rill erosion was analyzed by assessing the distribution of
the rate of soil erosion, rill density and areas of actual damage across the surveyed
fields in reference to their relative topographic positions (i.e. upslope, mid-slope and
down-slope), crop type and type classification. The difference of rill magnitudes
between each slope positions and crop cover types were analyzed statistically using
SPSS software. The sediment measured from control plot of experimental plots
monitored by AARC was used to compare the soil loss rate with the result of measured
soil loss using rill survey. Finally, the soil loss in the surveyed fields was estimated by
using universal soil loss equation (USLE) adapted for Ethiopian conditions by Hurni
(1985b).
3.4.2 Social Survey Analysis
The data generated by the structured questionnaires was analyzed using excel
and the frequencies and descriptive procedures of the statistical Package for Social
Science (SPSS) software, version 12. The data were thoroughly checked by the
researcher before the analysis by directly comparing all 80 cases with the original
questionnaire. The relevant qualitative information generated by the informal
discussions with farmers and other concerned bodies were integrated with the
quantitative data for better understanding of the issues covered in the study.

22
CHAPTER FOUR
4 RESULTS AND DISCUSSION
4.1 Physical properties of soil in the sampled fields
4.1.1 Bulk density
Soil bulk density is defined as the ratio of a mass of dry soil (oven-dried at
105oC) of its field volume and usually expressed in terms of grams per cubic
centimeter (g/cm3). Bulk density is determined by the texture of the soil and by soil
structure and the amount of soil pore space, which can be changed by management.
Compaction increases bulk density by reducing soil pore space. It is an increase in
bulk density and soil strength and a decrease in soil porosity by the application of
mechanical forces to the soil. The action of tillage implements and similar physical
forces crush soil aggregates and push soil particles closer together, especially under
wet soil conditions. Compacted soils or soil layers restrict root growth, water
movement, and air exchange.
The BD of soils under up slope fields was at about 6% higher than mid-slope
field soils and 8% higher than soils in the down slope fields. This means the BD
decreases down a slope positions However, it was not significantly different
statistically among the three slope positions (P-value = 0.09 within groups) (Table 1).
However, as we will see in section 4.2.5 by multiple comparison of ANOVA both
down and mid-slope fields showed were significantly different at (P < 0.01) (see
appendix A, Table12, for detail information).

23
Table 1: Soil physical characteristics in the surveyed fields taken in the rainy season.
Different letters (a,b,c) along the column indicate that they are significantly different, whereas the same letters indicate not significantly different within each slope position. Detailed information is attached in the appendix A, Table A11
4.1.2 Moisture Content (MC)
MC is the amount of water in a soil during the time of data collection. Soil
texture, structure, porosity, and organic-matter content determine soil moisture.
Though there was no significant difference at 0.05 levels, the moisture content of soil
in the down slope fields was 6% higher than soils in the mid-slope fields and 15%
higher than soils in the up-slope fields (Table 1). This result has an implication to the
erosion processes that will be discussed in the next section.
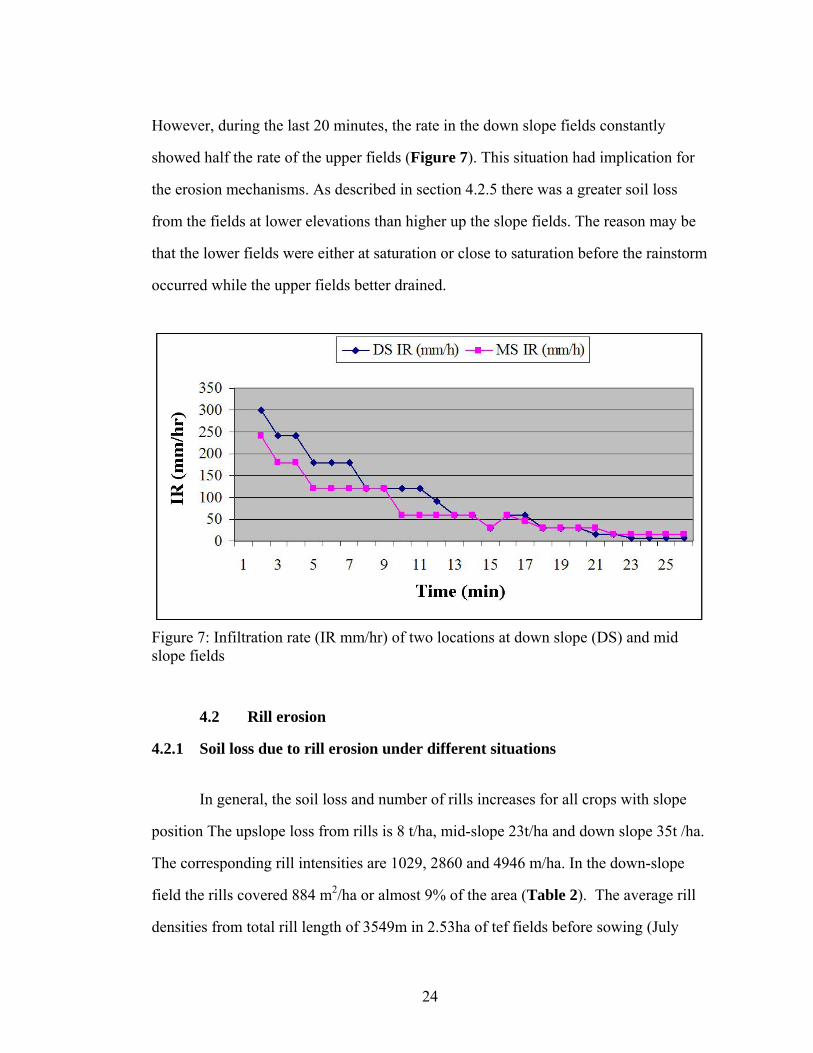
4.1.3 Infiltration
Infiltration is the process by which water arriving at the soil surface enters the
soil. This process affects surface runoff, soil erosion, and groundwater recharge
(Hanson, 2004, Bewket and Sterk, 2005). The measurement was carried out in October
2008 when the average MC of the soil was decreased by half (13 to 19%) from the
first measurement in the rainy season (32 to 38%).
Since there were no replicates during measurements of infiltration, it was
difficult to analyze the significances statistically. However, water drained better in the
upper fields than the down slope fields. At the initial point, the down slope fields
showed higher infiltration rate (varies between 300 and 7.5 mm/hr) than upper fields
(varies between 240 and 15 mm/hr). Hence, after one hour monitoring, the level of
water at down slope and mid-slope fields decreased by 54mm and 47mm respectively.
Topography Moisture content (%)
Bulk density (g/cm3)
Infiltration (mm/hr)
Down slope 37a 1.18a 7.5a Mid-slope 36a 1.21a 15a Upslope 32a 1.28b =
24
However, during the last 20 minutes, the rate in the down slope fields constantly
showed half the rate of the upper fields (Figure 7). This situation had implication for
the erosion mechanisms. As described in section 4.2.5 there was a greater soil loss
from the fields at lower elevations than higher up the slope fields. The reason may be
that the lower fields were either at saturation or close to saturation before the rainstorm
occurred while the upper fields better drained.
Figure 7: Infiltration rate (IR mm/hr) of two locations at down slope (DS) and mid slope fields
4.2 Rill erosion
4.2.1 Soil loss due to rill erosion under different situations
In general, the soil loss and number of rills increases for all crops with slope
position The upslope loss from rills is 8 t/ha, mid-slope 23t/ha and down slope 35t /ha.
The corresponding rill intensities are 1029, 2860 and 4946 m/ha. In the down-slope
field the rills covered 884 m2/ha or almost 9% of the area (Table 2). The average rill
densities from total rill length of 3549m in 2.53ha of tef fields before sowing (July

25
11,2008) was 1403m/ha and after sowing (July12 to August 27, 2008) all crops
(3.56ha) was 2614 m/ha from total rill length of 9305m. Therefore, the average rill
density before and after sowing crops from the total rill length of 12,854m was
3,611m/ha (Table 2 and (Table 3). In general, tef fields had the greatest soil loss
followed by maize and wehet and millet. As we will see later, the field preparation
affected these results.
Table 2: Classification of rills and their contribution in soil loss
Types of rills
No of rills Soil loss (t/ha) AAD (m2/ha) Rill density (m/ha)
US MS DS US MS DS US MS DS US MS DS Small 103 376 865 7 12 24 107 334 610 686 2299 4424Medium 2 74 94 1 9 11 69 271 274 21 543 522 Large 3 11 363 115 Total 105 453 959 8 23 35 176 662 885 708 2860 4946
Note: the widths of Small rills (<25cm), medium (25 to 200cm), Large (>200cm)
The rill erosion measurement does not consider soil loss from the land between
the rills (i.e., inter-rill erosion) and thus underestimate the actual erosion. According to
Zachar (1982), rill erosion underestimates 10 to 30 % of the actual soil loss. Govers
(1991) also reported, as the contribution of inter-rill erosion can be more than 30 % of
the total soil loss in fields where rills are present. Bewket and Sterk (2003) also
assumed 30% of the actual soil loss to calculate the contribution of inter-rill erosion to
soil loss. For this study, therefore, we assumed that the measured rill erosion rates
underestimated soil loss by 25%, making the annual average actual soil loss rates
around 36t/ha. If it were 30%, it would be around 38t/ha.

26
4.2.2 Classification of rills
By using the method of classification of rills of Herweg (1996), rills in the
study area were classified according to their widths in to three categories: Small (<25
cm), medium (25-200 cm), and large wide rills (>200 cm) (Table 3).
The depth of the rills in most cases did not vary much from field to field in the
surveyed fields (appendix A, Table A2). Therefore, to classify the rills we looked at
the widths. We found that 88.5% of the total rills were classified as small and 11% fell
in the medium classes. The large rills were the least in number (0.5% of the total). The
rills classified as large width were observed in one tef field in the medium slope
position. This field has no cultural ditches. However, it had damaged stone bunds that
could not control the high runoff from uplands. In other fields, the many cultural
ditches inside the field installed by the farmers might have prevented the formation of
the large and wide rills. Small rills contributed the largest amount (63.5% of the total)
of soil loss (Table 3) whereas the damage caused by large rills was minor, with a soil
loss of 3 percent and a damaged area of 3.4 percent (Table 3). This result contradicts
the result obtained by Bewket and Sterk (2003) and Hagman (1996) in which few large
rills contributed the highest amount of soil loss in their study. Indeed, their studies did
not indicate clearly if there were cultural ditches in their study sites.
One attempt at one tef field was made to measure the damage caused by
siltation of eroded materials in the mid-slope position at the field boundary (Figure 8).
The field had a 10% slope and flat (3% slope) at the lower part where siltation
occurred.

27
Table 3: General descriptions of rill erosion magnitudes in the Debre Mewi watershed measured in two months of July and August
Types of rills
Crop type
No of rills Soil loss (t/ha) AAD (m2/ha) Rill Density (m/ha) US MS DS Total US MS DS T US MS DS Total US MS DS Mean
Small
Maize 46 46 11 11 299 299 2209 2209 Wheat 13 13 4.5 4.5 106 106 705 705 Millet 103 21 124 7 4.5 6 156 51 123 997 695 903 TAS 272 538 810 6.5 18 17 415 422 419 2755 2835 2807 Sum 1 103 352 538 993 7 11 18 14 156 311 422 344 997 2146 2835 2330 TBS 24 327 351 2 5 4 39 188 136 258 1590 1126 Total 1 103 376 865 1344 7 12 24 17 156 334 610 441 997 2299 4424 3130
Medium
Maize 2 2 3 3 74 74 109 109 Wheat 1 1 3 3 63 63 126 126 Millet 2 5 7 1 3 1.4 100 189 128 31 168 74 TAS 36 60 96 9 8 9 212 199 204 442 304 352 Sum 2 2 44 60 106 1 5 8 7 100 169 199 175 31 315 304 276 TBS 30 34 64 7 3 4 173 76 109 385 218 276 Total 2 2 74 94 170 1 9 11 9 100 271 274 252 31 543 522 473
Wide* Sum 3 3 3 11 11 363 363 115 115 Total sum 105 453 959 1517 8 23 35 27 256 662 884 717 1029 2860 4946 3611
TBS = tef before sowing, TAS = tef after sowing, DS = down slope, MS = mid-slope US = upslope, AAD = area of actual damage, all values are rounded to whole numbers. * indicates that the rate was calculated by the area of that single field where the three large wide rills were developed.
28
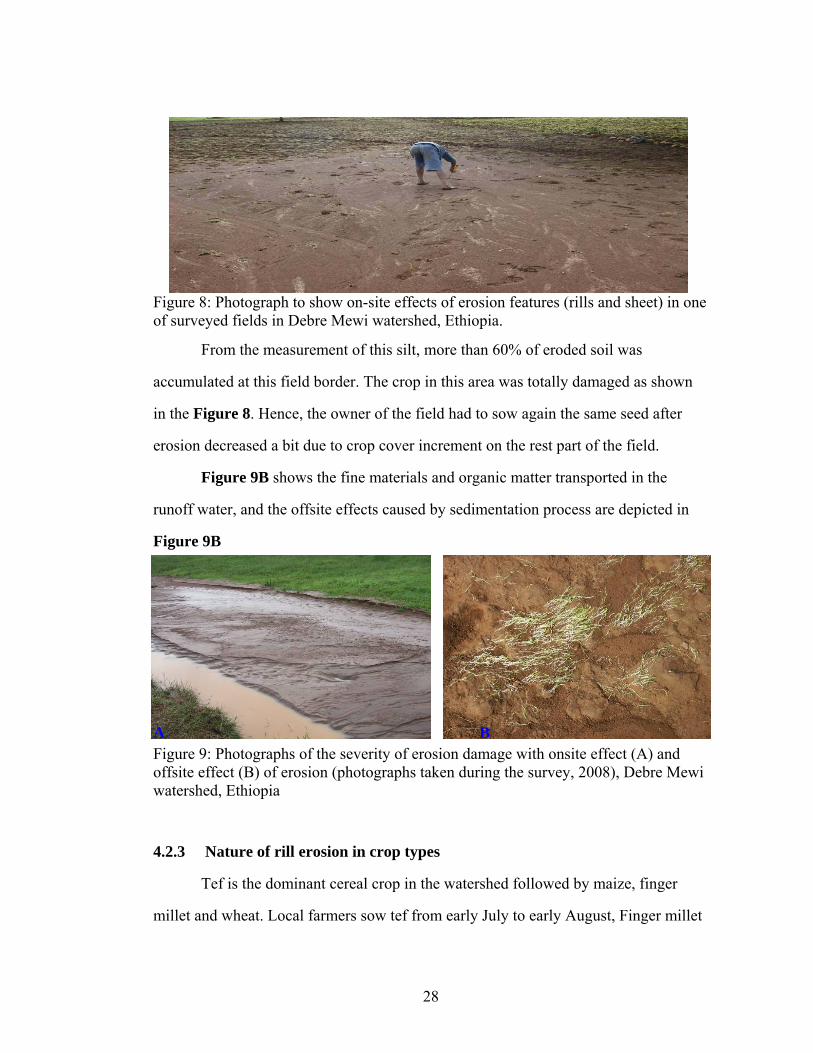
Figure 8: Photograph to show on-site effects of erosion features (rills and sheet) in one of surveyed fields in Debre Mewi watershed, Ethiopia.
From the measurement of this silt, more than 60% of eroded soil was
accumulated at this field border. The crop in this area was totally damaged as shown
in the Figure 8. Hence, the owner of the field had to sow again the same seed after
erosion decreased a bit due to crop cover increment on the rest part of the field.
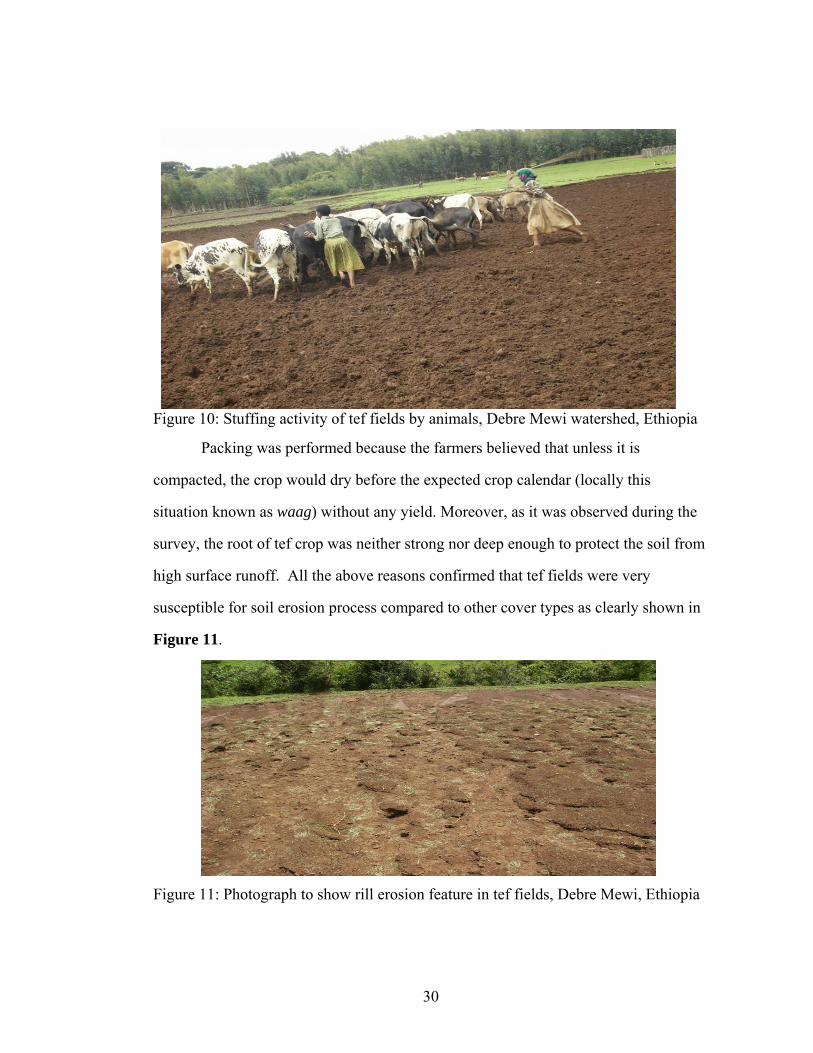
Figure 9B shows the fine materials and organic matter transported in the
runoff water, and the offsite effects caused by sedimentation process are depicted in
Figure 9B
A B Figure 9: Photographs of the severity of erosion damage with onsite effect (A) and offsite effect (B) of erosion (photographs taken during the survey, 2008), Debre Mewi watershed, Ethiopia
4.2.3 Nature of rill erosion in crop types
Tef is the dominant cereal crop in the watershed followed by maize, finger
millet and wheat. Local farmers sow tef from early July to early August, Finger millet

29
from late may to late June, maize from late April to mid June and wheat in June. This
timing has an implication on contribution of ground cover of the croplands in reducing
erosion. Tef and finger millet lands need five to seven times plowing, four times for
wheat and barely and three times for maize. Each sample observations are included in
appendix A Table A13.
The amount of soil eroded from the tef plots after land preparation and just
before sowing (July 11, 2008) was 8 t/ha (Table 4). An addition 26t/ha was lost after
sowing tef (between July 12 and August 27, 2008). Soil loss after that was negligible.
Thus the total soil loss for tef was 34 t/ha (Table 4). The soil loss in tef was three
times greater than for finger millet and wheat, and twice that in maize crops. The
ANOVA in Table 5 shows that the soil loss differences between crop covers was
significant. However, millet and wheat did not show significant differences. The area
actually damaged (AAD) by rills, only tef showed significant different with other crop
fields.
The main reason for the high erosion loss for tef is that the period of land
preparation for tef is during middle of the rainy season with high intensity rains, while
for the other crops tillage occurred earlier when rains were less intense. Another factor
that might be contributing was packing by animals’ feet (mostly by farm animals and
donkeys) just before sowing as shown in Figure 10. This activity is also common in
finger millet fields except, in this field, the activity is done twice just before and after
sowing.
30
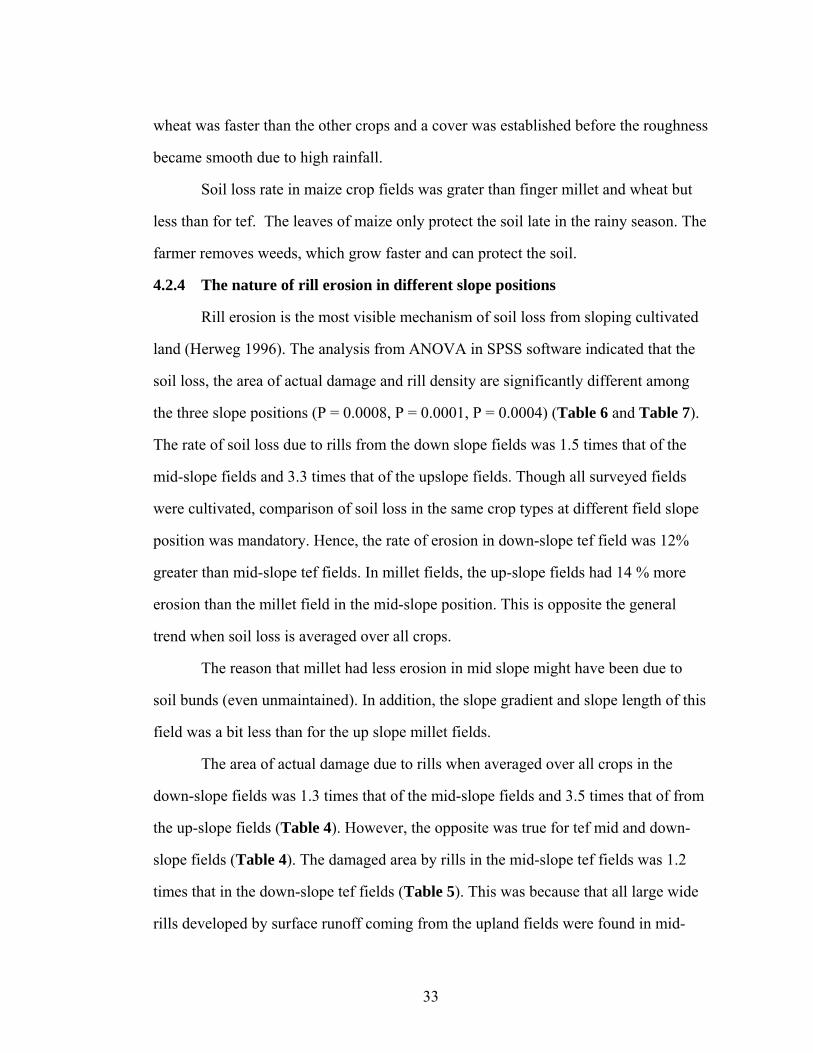
Figure 10: Stuffing activity of tef fields by animals, Debre Mewi watershed, Ethiopia
Packing was performed because the farmers believed that unless it is
compacted, the crop would dry before the expected crop calendar (locally this
situation known as waag) without any yield. Moreover, as it was observed during the
survey, the root of tef crop was neither strong nor deep enough to protect the soil from
high surface runoff. All the above reasons confirmed that tef fields were very
susceptible for soil erosion process compared to other cover types as clearly shown in
Figure 11.
Figure 11: Photograph to show rill erosion feature in tef fields, Debre Mewi, Ethiopia

31
Table 4: Rill magnitudes in different crop types
CT= crop type, TAS = tef after sowing, TBS = tef before sowing, US = up slope, MS = mid-slope, DS = down slope Different letters along the column indicate significantly different, and the same letters indicate not significantly different
CT No of rills Soil loss (t/ha) AAD (m2/ha) Rill density (m/ha)
US MS DS Total US MS DS Total US MS DS Total US MS DS Mean
Maize 48 48 14.2 14a 372.9 373a 2317 2317a
Wheat 14 14 7.6 7.6b 168.9 169a 832 832b
Millet 105 26 131 8.1 7 7.7b 256 240.5 251a 1029 863 977b
TAS 311 598 909 23.5 26.6 26 723.9 620 656 3227 3138.2 3158
TBS 54 361 415 8.9 7.6 8 211.4 264 246 643.2 1807.9 1403
TAS+TBS 365 959 1324 32.4 34.2 34c 935.2 884 902b 3870 4946 4561.3 4561c
Total 105 453 959 1517 8.1 23.2 34.2 26.5 256 662.1 884 717 1029 2860 4946.1 3603

32
Table 5: Multiple comparisons (LSD, ANOVA) to show significant differences of variables among crop cover types (CT is crop type, AAD is area of actual damage, MD is mean difference, Sig. is significance (P), * indicates those values that are significant at 0.05 level
In finger millet cropland, at the beginning of rill survey the numerous very
shallow rills were observed. However, after monitoring of one month (up to the
middle of August) almost all rills had disappeared.
Erosion hardly exists in wheat field since the surface, before and after sowing,
was rough. This increases infiltration, which in turn decreases runoff that was
considered as the major source of rills and sheet erosions in the area. The growth of
Soil Erosion (t/ha) AAD (m2/ha)
(I) CT (J) CT MD (I-J) Sig. MD (I-J) Sig.
Maize Wheat 6.4* 0.00 51 0.13
Millet 6.8* 0.00 44 0.23
Tef -4.7* 0.02 -340* 0.00
Wheat Maize -6.4* 0.00 -51 0.13
Millet 0.4 0.84 -7 0.84
Tef -11* 0.00 -391* 0.00
Millet Maize -6.8* 0.00 -44 0.23
Wheat -0.4 0.84 7 0.84
Tef -11.5* 0.00 -384* 0.00
Tef Maize 4.7* 0.02 340* 0.00
Wheat 11* 0.00 391* 0.00
Millet 11* 0.00 384* 0.00
33
wheat was faster than the other crops and a cover was established before the roughness
became smooth due to high rainfall.
Soil loss rate in maize crop fields was grater than finger millet and wheat but
less than for tef. The leaves of maize only protect the soil late in the rainy season. The
farmer removes weeds, which grow faster and can protect the soil.
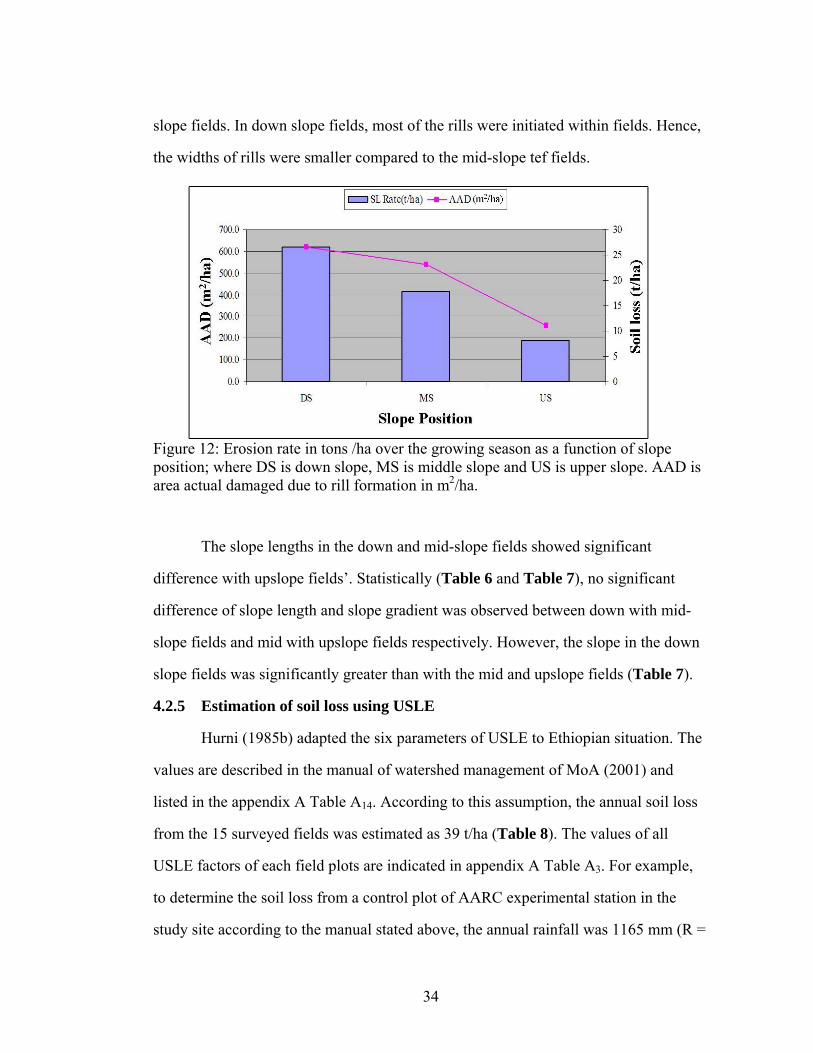
4.2.4 The nature of rill erosion in different slope positions
Rill erosion is the most visible mechanism of soil loss from sloping cultivated
land (Herweg 1996). The analysis from ANOVA in SPSS software indicated that the
soil loss, the area of actual damage and rill density are significantly different among
the three slope positions (P = 0.0008, P = 0.0001, P = 0.0004) (Table 6 and Table 7).
The rate of soil loss due to rills from the down slope fields was 1.5 times that of the
mid-slope fields and 3.3 times that of the upslope fields. Though all surveyed fields
were cultivated, comparison of soil loss in the same crop types at different field slope
position was mandatory. Hence, the rate of erosion in down-slope tef field was 12%
greater than mid-slope tef fields. In millet fields, the up-slope fields had 14 % more
erosion than the millet field in the mid-slope position. This is opposite the general
trend when soil loss is averaged over all crops.
The reason that millet had less erosion in mid slope might have been due to
soil bunds (even unmaintained). In addition, the slope gradient and slope length of this
field was a bit less than for the up slope millet fields.
The area of actual damage due to rills when averaged over all crops in the
down-slope fields was 1.3 times that of the mid-slope fields and 3.5 times that of from
the up-slope fields (Table 4). However, the opposite was true for tef mid and down-
slope fields (Table 4). The damaged area by rills in the mid-slope tef fields was 1.2
times that in the down-slope tef fields (Table 5). This was because that all large wide
rills developed by surface runoff coming from the upland fields were found in mid-
34
slope fields. In down slope fields, most of the rills were initiated within fields. Hence,
the widths of rills were smaller compared to the mid-slope tef fields.
Figure 12: Erosion rate in tons /ha over the growing season as a function of slope position; where DS is down slope, MS is middle slope and US is upper slope. AAD is area actual damaged due to rill formation in m2/ha.
The slope lengths in the down and mid-slope fields showed significant
difference with upslope fields’. Statistically (Table 6 and Table 7), no significant
difference of slope length and slope gradient was observed between down with mid-
slope fields and mid with upslope fields respectively. However, the slope in the down
slope fields was significantly greater than with the mid and upslope fields (Table 7).
4.2.5 Estimation of soil loss using USLE
Hurni (1985b) adapted the six parameters of USLE to Ethiopian situation. The
values are described in the manual of watershed management of MoA (2001) and
listed in the appendix A Table A14. According to this assumption, the annual soil loss
from the 15 surveyed fields was estimated as 39 t/ha (Table 8). The values of all
USLE factors of each field plots are indicated in appendix A Table A3. For example,
to determine the soil loss from a control plot of AARC experimental station in the
study site according to the manual stated above, the annual rainfall was 1165 mm (R =

35
647); the soil color to estimate erodiblity was red brown (K = 0.2); the slope length of
a plot was 30m (L = 1.3); The average slope gradient was 10% (S =1); The land cover
was tef (C = 0.25) and since it was control plot, only contour plowing was used as soil
conservation (P = 0.9). Therefore, the product of these values gave the amount of soil
loss rate in this single plot per year (i.e., 38 t/ha per annum).
The results estimated by the three methods (measured, USLE model and
experimental plot without conservation structure) above were similar; they showed
almost the same result. The correlation between measured and predicted data for the
15 surveyed fields was 72%. This value indicates that the equation USLE was best
approximation for soil loss due to rill and sheet erosion. Therefore, rill survey method
can be concluded as a central way to quantify soil loss at field level and to plan
effective and site dependent SWC measures. According to the method introduced by
Hurni (1993), the estimated soil loss rates from cultivated fields in the Debre Mewi
watershed was a bit lower compared to the average soil loss rates estimated for an
“average” cultivated fields of Ethiopia (42t/ha per annum).
Since USLE can be used to compute the total average annual soil loss from
sheet and rill erosion within a particular watershed, the soil loss from these erosion
features were calculated to compare with the measured soil loss (Table 8). The R2
value of measured and predicted soil loss was 0.5 (Appendix A, Figure A1). The
method under predicts the soil loss of the down slope fields that are saturated part of
the time.
36
Table 6: Multiple comparisons (LSD, ANOVA) to show significant difference between each slope positions
Table 7: Rill magnitudes in three different slope positions. Different letters (a,b,c) along the column indicate that they are significantly different, whereas the same letters indicate not significantly different within each slope position
Dependant variable
Soil loss(t/ha)
Moisture content
Bulk density
AAD Rill density Slope length
Slope gradient
(I) Slope
(J) Slope
MD (I-J)
Sig. MD (I-J)
Sig. MD (I-J)
Sig. MD (I-J)
Sig. MD (I-J)
Sig. MD (I-J)
Sig. MD (I-J)
Sig.
DS MS 5.9* 0.02 0.6 0.47 -0.03 0.12 280* 0.00 678* 0.01 2.1 0.78 3.6* 0.01 US 12.2* 0.00 2.8 0.05 -0.09* 0.00 726* 0.00 1378* 0.00 25* 0.04 5* 0.02MS DS -5.9* 0.02 -0.6 0.47 0.03 0.12 -281* 0.00 -678* 0.01 -2.1 0.78 -3.7* 0.01 US 6.2* 0.03 2.2 0.13 -0.06* 0.02 445* 0.00 699* 0.02 22.8 0.05 1.3 0.48US DS -12.2* 0.00 -2.8 0.05 0.09* 0.00 -726* 0.00 -1378* 0.00 -25* 0.04 -5* 0.02 MS -6.2* 0.03 -2.2 0.13 0.06* 0.02 -445* 0.00 -699* 0.02 -22.8 0.05 -1.3 0.48CT = crop type, AAD = area of actual damage, MD= mean difference, Sig. = significance, * = significant at 0.05 level
Slope Position
Soil erosion effects Erosion factors Soil loss
(t/ha) Area of actual damage
(m2/ha) Rill density
(m/ha) Length
(m) Slope (%)
Down slope 34a 884a 4946a 53a 14a Mid-slope 23b 662b 2860b 51a 10b Upslope 8c 256c 1029c 39b 9b
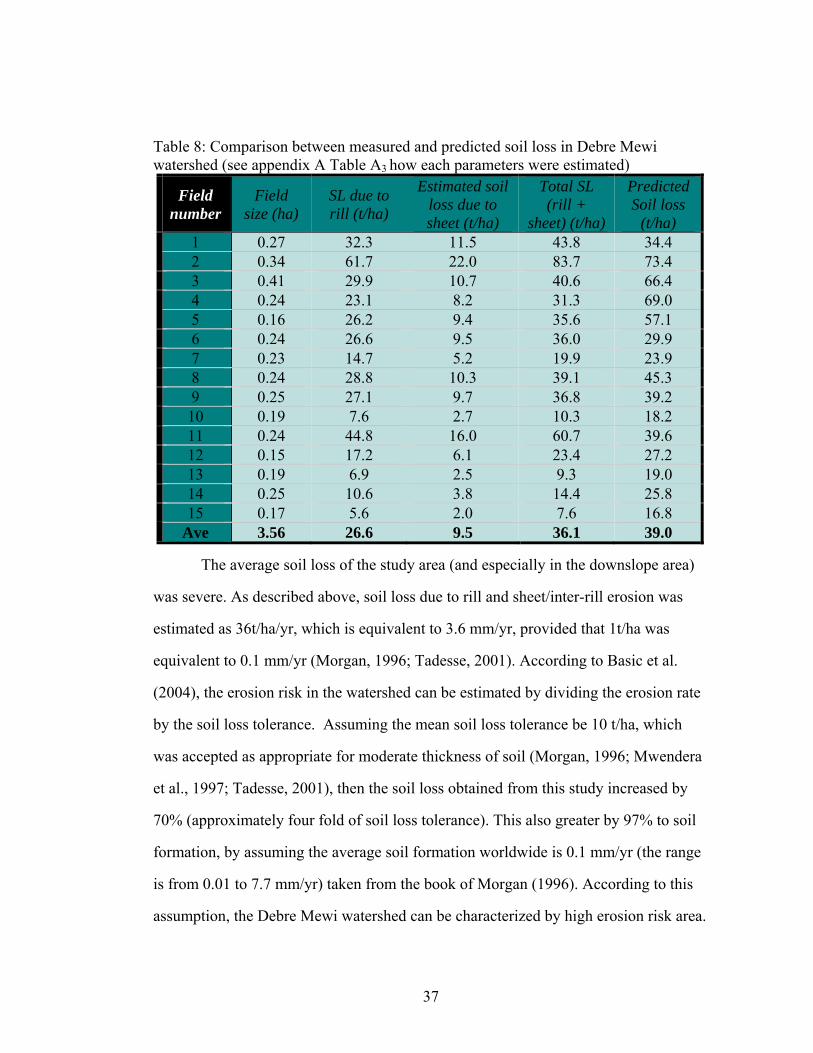
37
Table 8: Comparison between measured and predicted soil loss in Debre Mewi watershed (see appendix A Table A3 how each parameters were estimated)
Field number
Field size (ha)
SL due to rill (t/ha)
Estimated soil loss due to sheet (t/ha)
Total SL (rill +
sheet) (t/ha)
Predicted Soil loss
(t/ha) 1 0.27 32.3 11.5 43.8 34.4 2 0.34 61.7 22.0 83.7 73.4 3 0.41 29.9 10.7 40.6 66.4 4 0.24 23.1 8.2 31.3 69.0 5 0.16 26.2 9.4 35.6 57.1 6 0.24 26.6 9.5 36.0 29.9 7 0.23 14.7 5.2 19.9 23.9 8 0.24 28.8 10.3 39.1 45.3 9 0.25 27.1 9.7 36.8 39.2 10 0.19 7.6 2.7 10.3 18.2 11 0.24 44.8 16.0 60.7 39.6 12 0.15 17.2 6.1 23.4 27.2 13 0.19 6.9 2.5 9.3 19.0 14 0.25 10.6 3.8 14.4 25.8 15 0.17 5.6 2.0 7.6 16.8
Ave 3.56 26.6 9.5 36.1 39.0
The average soil loss of the study area (and especially in the downslope area)
was severe. As described above, soil loss due to rill and sheet/inter-rill erosion was
estimated as 36t/ha/yr, which is equivalent to 3.6 mm/yr, provided that 1t/ha was
equivalent to 0.1 mm/yr (Morgan, 1996; Tadesse, 2001). According to Basic et al.
(2004), the erosion risk in the watershed can be estimated by dividing the erosion rate
by the soil loss tolerance. Assuming the mean soil loss tolerance be 10 t/ha, which
was accepted as appropriate for moderate thickness of soil (Morgan, 1996; Mwendera
et al., 1997; Tadesse, 2001), then the soil loss obtained from this study increased by
70% (approximately four fold of soil loss tolerance). This also greater by 97% to soil
formation, by assuming the average soil formation worldwide is 0.1 mm/yr (the range
is from 0.01 to 7.7 mm/yr) taken from the book of Morgan (1996). According to this
assumption, the Debre Mewi watershed can be characterized by high erosion risk area.

38
4.3 Effects of different physical factors on soil erosion and processes
4.3.1 Effects of rainfall to soil erosion
From the group discussion and personal interviews, it was reported that rill
formation started at the beginning of the rainy season. Though the study had begun
lately after 25% of rainfall passed, the field survey showed almost the same result with
the interview. Of course, the rainfall in the months before monitoring dates was not
distributed evenly. There was no high rainfall recorded to erode significant amount of
soil loss compared to July and August months. The peak erosion was occurred in the
month of July which accounted for more than 90% soil loss, of which, about 42% was
occurred at the beginning of rill measurements, in the month of early July. This 42%
soil loss was recognized by 18% of the rainfall recorded in this July month. This result
showed similar findings with Herweg, et al. (2002). In general, at the beginning of
measuring date the soil loss was accounted approximately 37.5% of the total soil loss.
As it was described in the Figure 13, after the first measurement of rill
volumes, the rate of soil loss was increasing at decreasing rate. Only a few more rills
were formed in the month of August. Thus, most erosion occurred before the time of
highest rainfall. Though the rainfall increased, the change in rill erosion magnitudes
between each monitoring dates was getting smaller. Finally the redistributions of
sediment affected the rill dimensions and hence no significant change in magnitude of
rill erosion was observed at the mid-August and then. This finding is in agreement
with findings by Bewket and Sterk (2003) and Herweg et al (2002).

39
Figure 13: Average soil loss for the 15 upland agricultural fields in the Debre-Mewi watershed, the light shaded columns is the cumulative soil loss for the season. The black boxes are the soil losses for the individual storms; the line with diamonds is the cumulative rainfall.
Therefore, a large proportion of annual soil loss was occurred during a few
rainstorm periods (Herweg and Ludi, 1999). The generated runoff from these periods
was the most important direct driver of severe soil erosion. Rills were initiated mostly
by these few destructive storms, but their continued growth throughout much of the
wet season was the effect of the cumulative rainfall (Bewket and Sterk, 2003).
Therefore, the effectiveness of SWC technology depends on the extent to which it can
resist such ‘extreme’ rainstorm periods.
As observed during survey, the life span of rills was not uniform throughout
the wet season. Most of the shallow rills lost their depths and widths by sediment
redistributions and by the time, the crop covered the soil. Some of the rills joined to
other wider rills and after a while, they would disappear.
40
4.3.2 Effects of run-on to soil erosion
Run-on, surface runoff coming from the upper fields, was the cause of rill
formation in the mid and down-slope fields. Surface runoff coming as a run-on had
considerable contributions in rill formation and then soil loss. The upslope-surveyed
fields did not receive any surface runoff from the uplands due to the main car road
crossed and acting as a divide. Therefore, the rills in the upslope positions were
initiated by surface runoff generated inside the fields that created very small
dimensions of rills. In the mid-slope fields, the run-on coming from the upland fields
formed 46% of rills developed in the upper boundary of fields (Table 9). They
received large amounts of surface runoff from areas in the upslope position. The rills
contributed 68% soil loss resulted from the upper parts (in the first upper transects) of
seven mid-slope fields (Table 9). All rills classified in large wide rills were found in
this slope position.
Most down-slope fields had grasslands at the upslope boundary. As a result,
only 31% of rills initiated in the upper boundaries of the down slope-surveyed fields
were developed by run-on. These rills contributed 35% of soil loss formed in the first
upper transects of the down fields.
Hence, contrary to the mid-slope fields, the amount of soil loss produced from
rills initiated by run-on in the down slope fields was less than produced by within field
rills. One reason for this may be that all fields in this slope position were sown tef
crop, which is very susceptible to erosion. The soil type, slope gradient, slope lengths
and other hydrological factors may be other reasons.
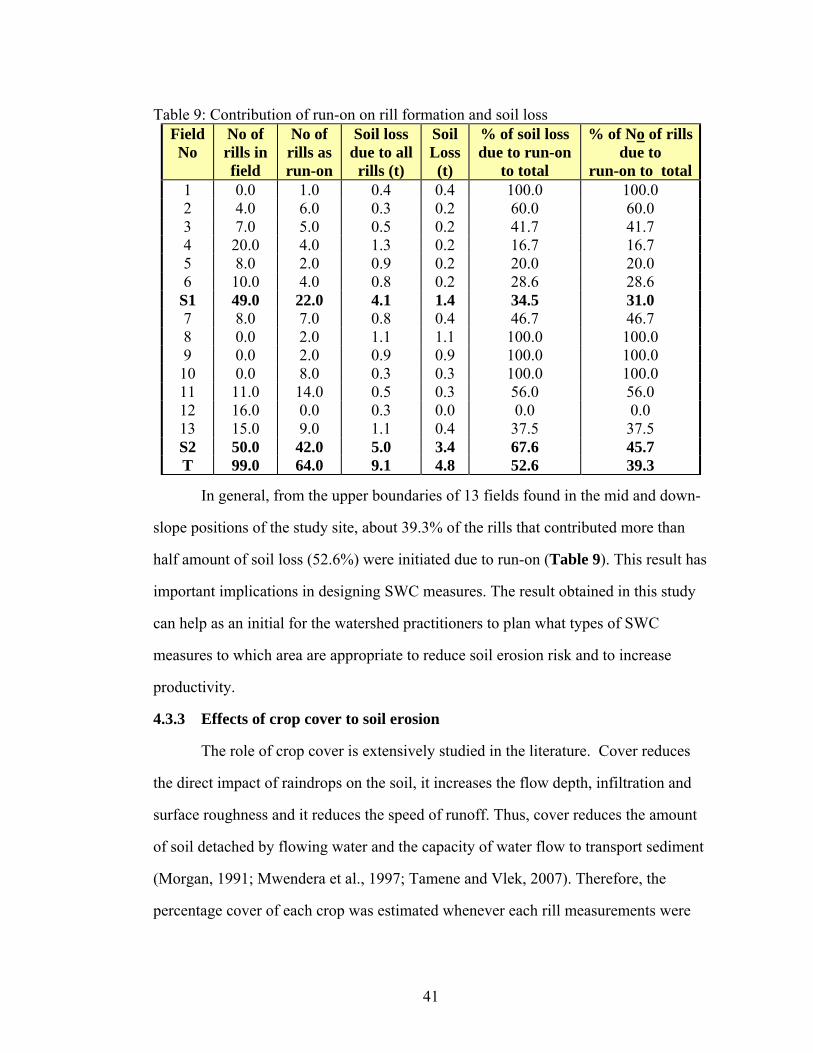
41
Table 9: Contribution of run-on on rill formation and soil loss Field No
No of rills in field
No of rills as run-on
Soil loss due to all
rills (t)
Soil Loss (t)
% of soil loss due to run-on
to total
% of No of rills due to
run-on to total1 0.0 1.0 0.4 0.4 100.0 100.0 2 4.0 6.0 0.3 0.2 60.0 60.0 3 7.0 5.0 0.5 0.2 41.7 41.7 4 20.0 4.0 1.3 0.2 16.7 16.7 5 8.0 2.0 0.9 0.2 20.0 20.0 6 10.0 4.0 0.8 0.2 28.6 28.6
S1 49.0 22.0 4.1 1.4 34.5 31.0 7 8.0 7.0 0.8 0.4 46.7 46.7 8 0.0 2.0 1.1 1.1 100.0 100.0 9 0.0 2.0 0.9 0.9 100.0 100.0 10 0.0 8.0 0.3 0.3 100.0 100.0 11 11.0 14.0 0.5 0.3 56.0 56.0 12 16.0 0.0 0.3 0.0 0.0 0.0 13 15.0 9.0 1.1 0.4 37.5 37.5 S2 50.0 42.0 5.0 3.4 67.6 45.7 T 99.0 64.0 9.1 4.8 52.6 39.3
In general, from the upper boundaries of 13 fields found in the mid and down-
slope positions of the study site, about 39.3% of the rills that contributed more than
half amount of soil loss (52.6%) were initiated due to run-on (Table 9). This result has
important implications in designing SWC measures. The result obtained in this study
can help as an initial for the watershed practitioners to plan what types of SWC
measures to which area are appropriate to reduce soil erosion risk and to increase
productivity.
4.3.3 Effects of crop cover to soil erosion
The role of crop cover is extensively studied in the literature. Cover reduces
the direct impact of raindrops on the soil, it increases the flow depth, infiltration and
surface roughness and it reduces the speed of runoff. Thus, cover reduces the amount
of soil detached by flowing water and the capacity of water flow to transport sediment
(Morgan, 1991; Mwendera et al., 1997; Tamene and Vlek, 2007). Therefore, the
percentage cover of each crop was estimated whenever each rill measurements were

42
undertaken. The result clearly showed that it has direct effect on the magnitudes of
rills (Figure 14).
Figure 14: Graph of crop cover versus soil loss rate
During fieldwork observation, the peak soil loss was measured when the cover
was approximately zero. Though there were other factors for this result, the cover
effect might take the major contributions. The effect of the five days temporal
variations of rainfall and crop coverage of the four crop types (namely Tef, Wheat,
Millet and Maize) in 2008 on soil loss for individual storms is clearly described in
Table 10 and Figure 14. The result showed almost similar trend. This means that the
soil loss rate in all fields decreased slowly while the cover continues its growth. The
correlation coefficient of soil loss and cover percentage of the three crop types (tef,
millet, and maize) was -0.7 and with wheat was -0.5. At the beginning of rill

43
measurement, the cover of tef and wheat lands was zero whereas the other two
croplands were covered in some amount. The soil loss in tef field was strictly
decreased with increasing the cover, whereas maize and wheat fields scored
exceptionally high value during the second and the third measurement time
respectively. Weeding during this time might be the case for special increment of soil
loss. As clearly shown in the Figure 14, the four graphs started in the first quadrant of
the plane figure and ended up in the second quadrant. This clearly shows that the soil
loss in all crops decreases as the cover increases. In general, coverage has direct
impact on erosion processes. Table 10: Relationship between soil loss and crop cover (cc).
Mon
th
Observation Date
RF/5 days (mm)
Rate of soil loss (t/ha) Crop coverage (%)
mz wh mt tef CC, mz
CC, wh
CC, mt
CC, tef
July
7/11/2008 51 4.9 0.9 6.9 7.3 26 3 10 0 7/18/2008 75 8.3 0.6 -1.4 6.8 36 10 25 1
7/22/2008 69 1.4 4.9 -2.0 4.2 40 25 30 5 7/29/2008 55 0.1 0.5 0.8 2.2 46 53 55 15
Aug
ust 8/1/2008 57 -1.0 0.6 -0.5 2.4 50 55 55 17
8/12/2008 34 -3.0 -0.7 -3.8 -7.0 60 70 70 40 8/27/2008 52 -1.1 -0.7 -0.6 75 85 90 75
mz is maize, wh is wheat and mt is millet
Therefore, soil cover can decrease soil erosion whose effectiveness can be
greatly increased if it is combined with good soil management practices. A unit
increase of percentage cover can bring about a much reduction in soil loss only where
the soil is properly managed.
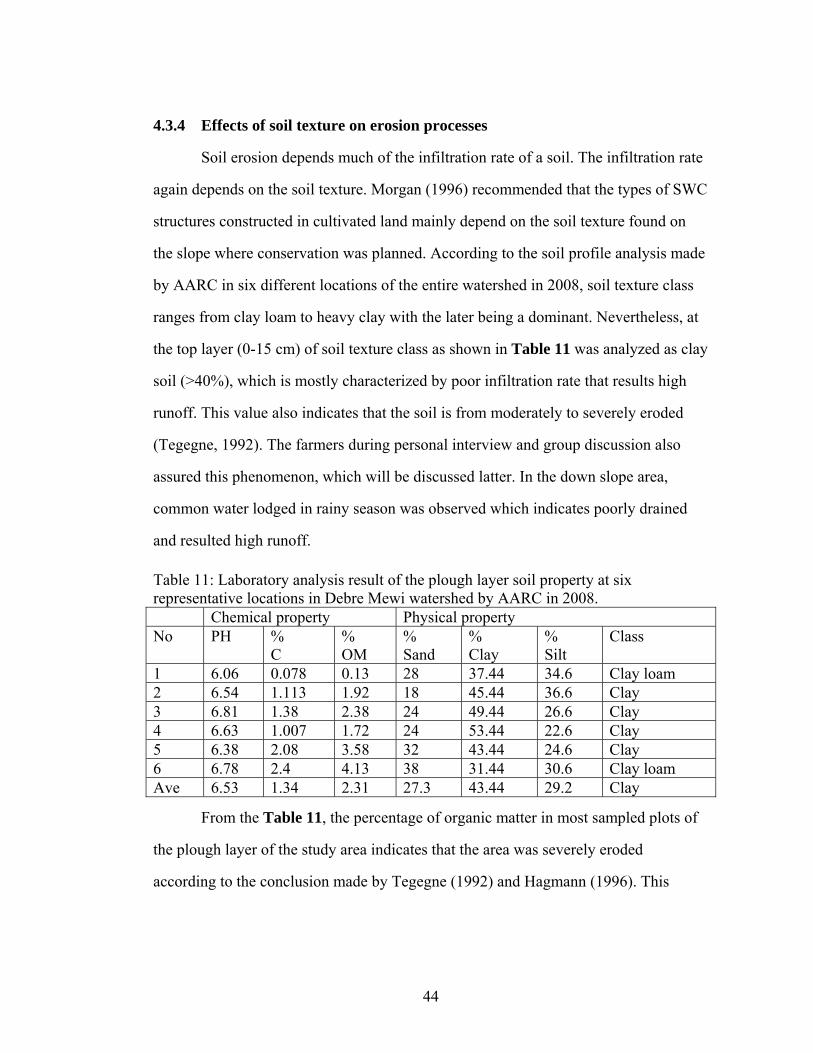
44
4.3.4 Effects of soil texture on erosion processes
Soil erosion depends much of the infiltration rate of a soil. The infiltration rate
again depends on the soil texture. Morgan (1996) recommended that the types of SWC
structures constructed in cultivated land mainly depend on the soil texture found on
the slope where conservation was planned. According to the soil profile analysis made
by AARC in six different locations of the entire watershed in 2008, soil texture class
ranges from clay loam to heavy clay with the later being a dominant. Nevertheless, at
the top layer (0-15 cm) of soil texture class as shown in Table 11 was analyzed as clay
soil (>40%), which is mostly characterized by poor infiltration rate that results high
runoff. This value also indicates that the soil is from moderately to severely eroded
(Tegegne, 1992). The farmers during personal interview and group discussion also
assured this phenomenon, which will be discussed latter. In the down slope area,
common water lodged in rainy season was observed which indicates poorly drained
and resulted high runoff. Table 11: Laboratory analysis result of the plough layer soil property at six representative locations in Debre Mewi watershed by AARC in 2008. Chemical property Physical property No PH %
C % OM
% Sand
% Clay
% Silt
Class
1 6.06 0.078 0.13 28 37.44 34.6 Clay loam 2 6.54 1.113 1.92 18 45.44 36.6 Clay 3 6.81 1.38 2.38 24 49.44 26.6 Clay 4 6.63 1.007 1.72 24 53.44 22.6 Clay 5 6.38 2.08 3.58 32 43.44 24.6 Clay 6 6.78 2.4 4.13 38 31.44 30.6 Clay loam Ave 6.53 1.34 2.31 27.3 43.44 29.2 Clay
From the Table 11, the percentage of organic matter in most sampled plots of
the plough layer of the study area indicates that the area was severely eroded
according to the conclusion made by Tegegne (1992) and Hagmann (1996). This

45
might be because of the high erosion rates are related to low organic matter contents
(Tegegne, 1992).
46
CHAPTER 5
5 FARMERS’ PERCEPTION OF LAND CONSERVATION
5.1 Household and farm characteristics
As it is described in Table 12, the total households living in the Debre Mewi
watershed is 276, of which 241 were headed by males and 35 by females. The total
population of these households was 1092, of which 47% were below 15 and 3% above
60. As reported by the farmers during discussion, the dramatically increase in
population caused multiple problems in the watershed. However, population increase
can be positive as well. For example, Amsalu and Graaff (2004) cited in their study
that better environmental conditions were observed in Kenya with growth in
population.
There were 485 people in the 80 surveyed households. The average family
size was six persons (Table 12). The average age of sampled farmers was 44, with a
minimum age of 30 and maximum 74. Of the total respondents, 7% were female,
mainly divorcees. Over half of the respondents (65%) were illiterate while the rest
could read and write through basic education and religion schools.
All of the interviewed farmers owned land. The mean holding size was about
1.2 ha. Taking the average household size and average land holdings of the sample
households, the per capita holding was 0.2 ha, which showed an agreement with
Benjamin et al., (2007) study that describes the average land holdings in Ethiopia
falling from 0.5 ha per person in 1960 to 0.11 ha per person in 1999. There was a
significant variation in the size of land holdings among householders. Of the sampled
households, the majority (56.2%) possessed between 0.6-1.0 ha of land. Only 9.4%
had more than two ha and some 14.1% had less than or equal to 0.5 ha (Table 12).
Though it was not included in the personal interview, the participants in the group
discussions reported that one household possessed up to six plots of farmlands within

47
the small total farm size. This fragmentation has its own negative effects to implement
soil and water conservation measures. As farmers noted during discussion,
constructing terraces or bunds on these small sized farmlands is believed as adding
another problem greater than erosion problems. Farmers do not recommend
constructing physical structures on very small croplands. Table 12: Characteristics of total households and their livestock in the four villages of the watershed (HH stands for household)
Characteristics Villages Mariam Wuha
Quyo Shanko Bahir
Feres Wag
Total
Total No of HH 52 83 52 89 276 Family size 149 285 243 415 1092 Age of 0-14 55 144 123 190 512
15-60 91 133 116 210 550 >60 3 8 4 15 30
Sample HH 26 26 11 17 80 Oxen 93 87 82 110 371 Cow 69 62 67 77 275
Young bull 42 40 45 42 169 Heifers 43 58 34 37 172 Calves 50 42 48 59 198 Mule 3 6 3 1 13 Horse 0 0 0 0 0
Donkey 48 60 34 50 192 Sheep 197 156 200 235 787 Goat 24 5 21 46 96
As in all other parts of the Ethiopian highlands, livestock are the most essential
element for the life of the people in the study area to fulfill a complex role in
smallholder mixed systems. They are not only used to produce meat and milk, but are
used as a store of wealth, for insurance purposes (as a saving account), that is, the
farmer can sell his livestock at the local markets whenever he is in need urgent of cash
and often for fulfilling social obligations (Tadesse, 2001, Thornton, 2003, Randolph et
al., 2007). The percentage of animals kept by the surveyed households is clearly
shown in Table 13. The composition of the farm animals was such that cattle

48
accounted for 50%, sheep 36%, goats 3% and mule and donkeys for 11%. Oxen
determine the efficiency of cropping. Nearly 10% of the households did not possess an
ox; some 19% owned only a single ox; 45% had a pair of oxen; 26% had 3 to 5 oxen.
Table 13: The percentage of respondents who owned livestock and farm size
Farm size (ha)
% of HH
No of livestock
cow %
ox %
donkey %
sheep %
goat %
0 – 0.5 12.5 0 18.75 10 43.75 15 93.750.6 - 1 37.5 1 40 18.75 35 5 0 1.1 - 2 47.5 2 25 45 13.75 31.25 2.5
> 2 2.5 3 6.25 12.5 7.5 22.5 0 <1 26.25 4 3.75 8.75 0 13.75 1.25
<mean 50 5 6.25 5 0 7.5 2.5 > mean 50 >5 0 0 0 5 0
Oxen are the decisive factor of production in the most of Ethiopian highlands
in general and in the Debre Mewi watershed in particular. Farmers have no any option
to produce crops without these main resources. Farmers without or one ox have
difficulty to plow the land, which is a serious farming constraint. Farmers without
oxen usually are renting their lands for crop sharing or for money. Those who
possessed one ox have used pairing (locally called kenja) with those facing the same
problem and sometimes with those possessing more than two oxen to overcome such
problems.
Leasing lands has its own negative implication for SWC practices as observed
in the study area. Croplands, which are leased especially for money, were cultivated
without any conservation structures except some traditional ditches. As farmers said,
these lands are fast loosing their productivity due to lack of attention given by the
owner or the one who rent. In the Debre Mewi watershed, ruminant animals like sheep
are very important sources of cash. The mules and donkeys transport people and
goods. There are only a few goats due to lack of feed as they mostly graze leaves of
small trees.
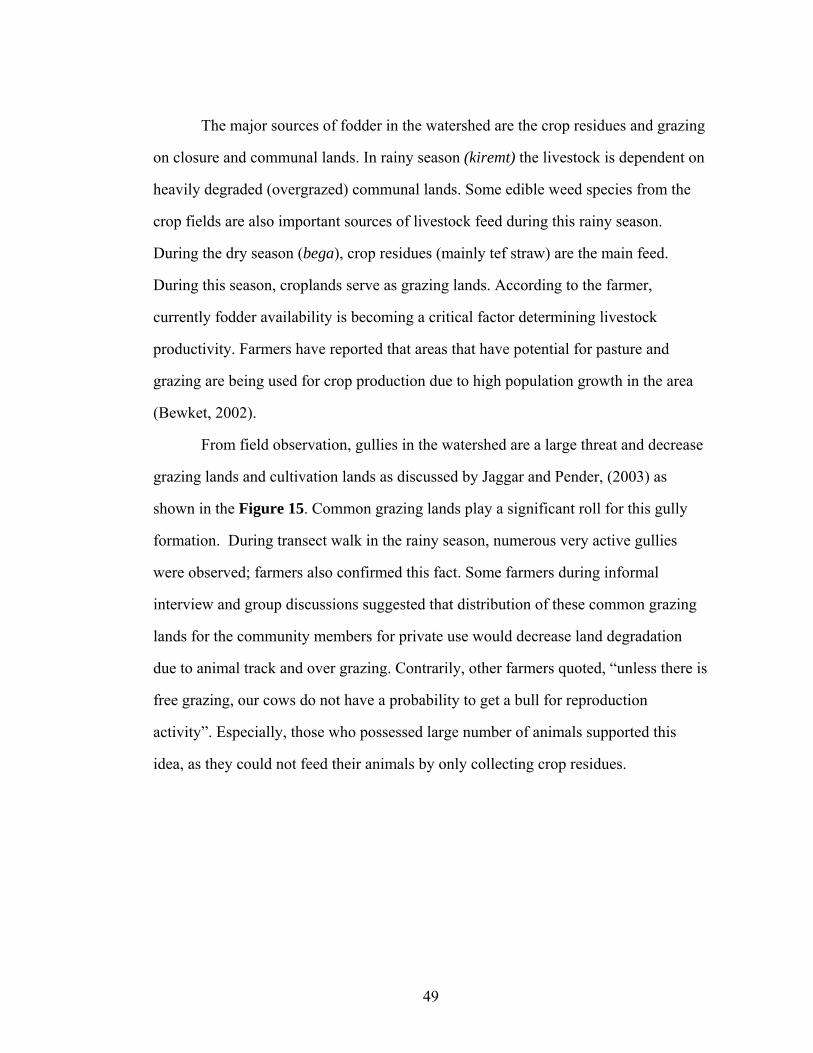
49
The major sources of fodder in the watershed are the crop residues and grazing
on closure and communal lands. In rainy season (kiremt) the livestock is dependent on
heavily degraded (overgrazed) communal lands. Some edible weed species from the
crop fields are also important sources of livestock feed during this rainy season.
During the dry season (bega), crop residues (mainly tef straw) are the main feed.
During this season, croplands serve as grazing lands. According to the farmer,
currently fodder availability is becoming a critical factor determining livestock
productivity. Farmers have reported that areas that have potential for pasture and
grazing are being used for crop production due to high population growth in the area
(Bewket, 2002).
From field observation, gullies in the watershed are a large threat and decrease
grazing lands and cultivation lands as discussed by Jaggar and Pender, (2003) as
shown in the Figure 15. Common grazing lands play a significant roll for this gully
formation. During transect walk in the rainy season, numerous very active gullies
were observed; farmers also confirmed this fact. Some farmers during informal
interview and group discussions suggested that distribution of these common grazing
lands for the community members for private use would decrease land degradation
due to animal track and over grazing. Contrarily, other farmers quoted, “unless there is
free grazing, our cows do not have a probability to get a bull for reproduction
activity”. Especially, those who possessed large number of animals supported this
idea, as they could not feed their animals by only collecting crop residues.

50
Figure 15: Photograph of active gully formation in the Debre Mewi watershed, Ethiopia
5.2 Perceptions of erosion as a problem
All the interviewed farmers perceived soil erosion as a problem constraining crop
production (Table 13). They reported that the most important top soil for crop
production activity was deteriorating over time due to erosion processes. Hence, they
observed frequently how the loss of soil from cultivated fields has been reducing the
depth of the topsoil through time and the number of stones in their farmlands has been
increasing over time. Moreover, when soil depth decreases the unproductive soil
(locally called zinza or sometimes gel) will be left. This soil is not productive. This
penomenon was common in the watershed.
The majority of the farmers reported that the occurrence of rill erosion was the
dominant erosion feature (89%) on their farmlands (Table 14). This percentage of
respondents also compared rill erosion problem as the highest with other erosion
features. Gully erosion was also reported by 11.25% of farmers along their farm
boundaries and waterways. Surprisingly, not all the respondents perceived sheet
erosion as a problem, which has been estimated in the literature to contribution to soil
up to 30% of actual soil loss (for example Govers, 1991). From all respondents, 64%
of the farmers rated the extent of the problem as sever and all the respondents

51
mentioned that the rate of soil erosion has been increasing over time. All of them also
answered that erosion can be controlled.
Table 14: Perception of respondents for soil erosion as a problem
Farmers’ responses to: Options Percentage (n=80)
Occurrence of soil erosion
Yes No
100 0
Prevailing form of erosion
Sheet erosion Rill erosion Gulley erosion
0 89 11
Extent of soil erosion severe Moderate Minor
64 36
Rill erosion compared to other erosion features
highest medium low
89 10 1
The rate of erosion over time
Increasing Same Decreasing
100 0 0
Can soil erosion be controlled?
Yes No
100 0
Farmers were asked to response how did they know soil erosion occurs on their
farmlands in open-ended question part. Some of the responses were; when there is
overflow of constructed ditches and damage their crops; when there is siltation in and
out of their field mostly at the lower field border; when rills appeared on their fields,
when the color of soil in the upper part of the field goes to red whereas the lower part
goes to black. From these responses, it can be concluded that farmers have good
perception of erosion as a problem that limits soil productivity.
5.3 Causes of Soil erosion, Soil fertility and Productivity decline
As indicated in Table 15, the major cause of soil erosion mentioned by 98 %
farmers was lack of conservation structures. Indeed, the transect walk in the entire
watershed confirmed that the SWC technologies were poorly constructed. Even those
few constructed conservation structures, mostly in the western part, were damaged

52
conservation structures. The majority of the farmers (61%) believed that damaged
structures contributed to soil loss. Minor contribution for soil erosion were steep
slopes (10%), lack of diversion ditch (5%) and others 5%.
Table 15: Farmers’ response to the causes of soil erosion, fertility and productivity decline
Farmers’ response to: Options Percentage (n=80)
Causes of soil erosion Lack of conservation structures Steep land w/o conservation structure Damaged conservation structures Lack of diversion ditch Others
98 10 61 5
Causes for soil fertility declining
Repeated cultivation Lack of manure Soil erosion Lack of fertilizer Others
79 9
100 0 0
Causes of crop productivity decline
Rain fall shortage Fertility decline Continuous cultivation Soil erosion Others
11 76 31 83 3
Note: Totals over 100% are due to multiple responses
Almost all of the farmers that either participated in the group discussion or in
interview reported declining in soil fertility in their farm plots over time. All the
respondents suggested that soil erosion was the major cause of soil fertility decline.
Repeated cultivation (continuous cultivation without rest) was also the other major
causes mentioned by 79% of the respondents. The other reasons given little
importance for fertility decline process were lack of manure (9%) and insufficient use
of artificial fertilizers.
Almost all of the interviewed farmers reported productivity decline. The
respondents mentioned that soil erosion was the main cause of productivity decline
53
was 83% followed by soil fertility (77%). Only 31% of them reported that continuous
cultivation had its own effect on soil productivity, whereas rainfall shortage was not
reported as a problem (Table 15). This observation agrees with those of Amsalu and
Graaff (2004) in the central highlands of Ethiopia, Bewket and Sterk (2002) in the
western Ethiopian highlands.
In general, soil fertility was the most important factor for crop production
mentioned by the farmers of the Debre Mewi watershed. It reflects the availability of
plant nutrients and soil organic matter (Moges and Holden, 2006). However, it is
decreasing over time due to soil erosion resulting from improper and exploitative
farming practices in the watershed. Most farmers in the watershed lack attention for
the effects of soil erosion on soil fertility. From the group discussions, farmers noted
that resting the land restores the nutrient depletion by soil erosion. Nevertheless, due
to scarcity of farm sizes this method cannot be practiced. To maintain soil fertility in
their lands, farmers commonly used animal manure and crop residues mostly around
their home and chemical fertilizer in other croplands. Few farmers have prepared
composts in order to minimize the expenditure of chemical fertilizers. However, lack
of materials like crop residues for this preparation and lack of technical supports from
extension agents limited their efforts to exercise such production of organic matter.
Some resource-poor farmers were observed while sowing crops without chemical
fertilizer because the price was beyond their capability. These practices do not secure
food as the fertilizer response of all crop fields is decreasing over time.
5.4 Farmers’ conservation practices in the watershed
Almost all of the farmers reported that SWC measures were very helpful for
erosion control and better crop production. Farmers commonly used to protect their
farm lands from soil erosion were stone terraces/bunds, cultural drainage ditches, soil
bunds, waterways and contour plowing (Table 16).
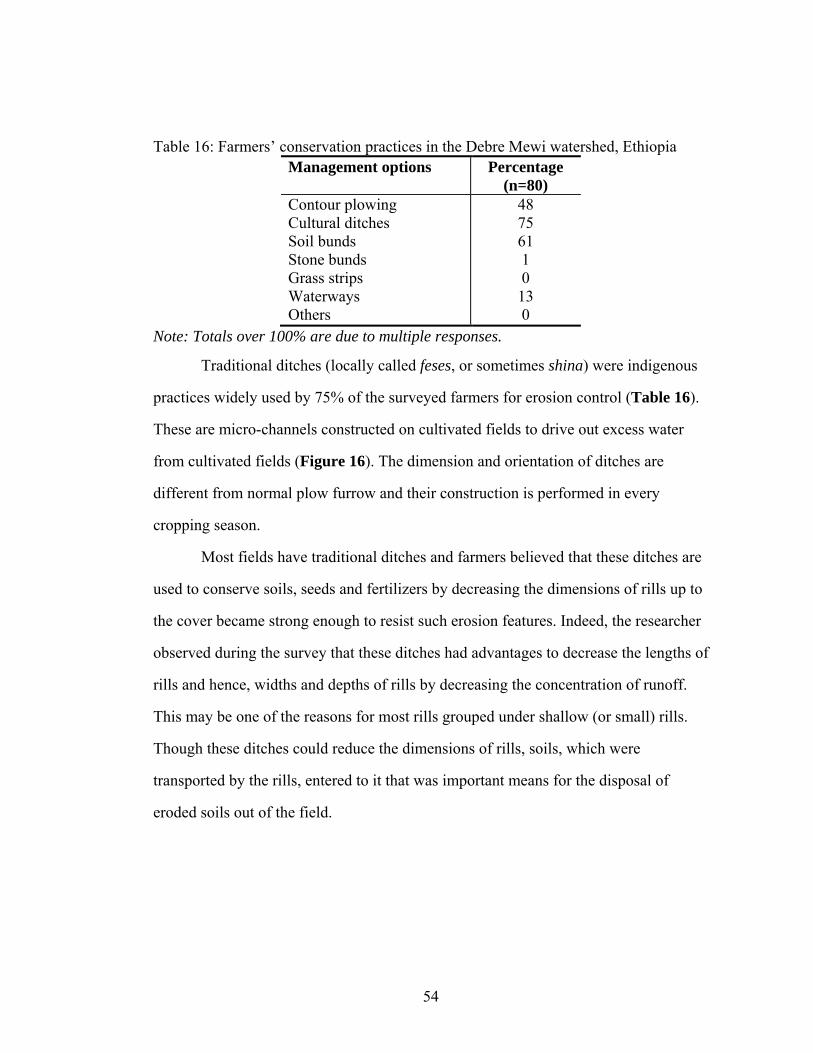
54
Table 16: Farmers’ conservation practices in the Debre Mewi watershed, Ethiopia
Management options Percentage (n=80)
Contour plowing Cultural ditches Soil bunds Stone bunds Grass strips Waterways Others
48 75 61 1 0 13 0
Note: Totals over 100% are due to multiple responses.
Traditional ditches (locally called feses, or sometimes shina) were indigenous
practices widely used by 75% of the surveyed farmers for erosion control (Table 16).
These are micro-channels constructed on cultivated fields to drive out excess water
from cultivated fields (Figure 16). The dimension and orientation of ditches are
different from normal plow furrow and their construction is performed in every
cropping season.
Most fields have traditional ditches and farmers believed that these ditches are
used to conserve soils, seeds and fertilizers by decreasing the dimensions of rills up to
the cover became strong enough to resist such erosion features. Indeed, the researcher
observed during the survey that these ditches had advantages to decrease the lengths of
rills and hence, widths and depths of rills by decreasing the concentration of runoff.
This may be one of the reasons for most rills grouped under shallow (or small) rills.
Though these ditches could reduce the dimensions of rills, soils, which were
transported by the rills, entered to it that was important means for the disposal of
eroded soils out of the field.

55
Figure 16: Side effects of cultural ditches, the left side is improperly designed and the right side indicates the overflowing of concentrated runoff .
Farmers reported during their interview that the ditches were effective
especially for one cropping season to conserve soil and chemical fertilizer from high
runoff. They also emphasized, “ditches demand less labor and low cost and short time
to construct compared to other newly introduced conservation measures”. However
finally, they underlined that for sustainability of the land, ditches have little
importance compared to other conservation structures like bunds and others. This
shows that though farmers have awareness for conservation structures to sustain land
productivity, they are still using conservation measures, which are important for short
span of time. This suggests that efforts of educating and training farmers towards the
newly introduced SWC technologies are very important.
Soil bunds were reported as the other means to conserve soil practiced by 61%
of the surveyed farmers. However, from field observation, soil bunds were rarely
constructed and poorly maintained. Though stone-bunds were not reported as a
measure of conservation, there were some efforts in the northwestern part of the
watershed where stones are easily available. Farmers indicated the inappropriateness
of the soil bunds on steep slopes where runoff is high. Waterways, permanent

56
structures constructed alongside the cultivated fields, were used by 12% of the
respondents. These structures are wider and deeper than the ditches and normally
require maintenance. Farmers connect the ditches to waterways for the safe disposal of
excess water.
Contour plowing was widely used in the area mentioned by 48% of the
respondents. This measure was commonly used not only to conserve soil from erosion
but also to decrease traction power of animas during plowing. As SWC measure, it is
an efficient technique for reducing runoff mainly in moderately and gently sloping
areas. On steep slopes, as farmers noted, contour plowing only may not be effective; it
needs other techniques like bunds to do with effectively control erosion. Furthermore,
during discussion, crop rotation was reported as one of the important mechanism to
reduce soil erosion impacts. Fallowing was hardly possible due to scarcity of land.
Intercropping has also rarely been applied because of priority of farmers for high
market value crops.
5.5 Farmers’ perception, acceptance and adoption of SWC measures
As it can be seen in Table 17, almost all of the respondents (98%) reported
that the technologies were effective in arresting soil erosion. Similarly, all of the
respondents believed that the new SWC technologies had the potential to improve land
productivity. The farmers who tried to implement some conservation measures in their
plots were interviewed how they measure the effectiveness of SWC technologies.
They had already observed a better growth and development of crops particularly
along the structures where fertile sediments were trapped. They also evaluated that the
amount of sediment trapped by the structure was very high which would be out of the
field if that conservation structure were not built. During group discussion,
participants who treated their lands by some conservation structures gave witness for
the group that the technology they have been using improved their land productivity.

57
Table 17: Indicators of acceptance and adoption of SWC technologies
Farmers’ response to: Options Yes No Indicators of acceptance
- Their knowledge of SWC measures - Effectiveness of SWC in arresting
soil erosion - SWC have a potential to improve
land productivity
98.75
98.75
100
1.25
1.25 0
Indicators of adoption - Plan to implement the new SWC tech. - Plan to maintain the constructed
structures - Farmers should be paid for
constructing and maintaining SWC in their farm
98.75
100
15
1.25 0
85
The farmers were asked also what their intentions were regarding using the
introduced SWC technologies in the future (Table 17). Almost all of the respondents
expressed their commitment to continue maintaining the established structures. In
addition to this, from the farmers interviewed whether they would like to apply the
SWC technologies in the rest of their farm fields (plots that were not treated by that
time), all of the respondents expressed that they had plan to implement the SWC
measures. To assess their attitudes towards support need from the government, they
were asked whether they should be paid for constructing and maintaining the SWC
technology in their farm. The majority (85%) responded “NO” while only 15%
answered, “Yes”. This showed farmers had a potential to construct conservation
measures if they have technical support from concerned body.
Except some factors that limit their acceptance and adoption as stated in the
next section, it can be concluded that the introduced SWC technologies were widely
acknowledged and accepted as effective measures against soil erosion and as having
the potential to improve land productivity. Though they eagerly expressed the belief

58
that they could control erosion on their farm plots, yet the constructed SWC structures
in the farmlands were not maintained and some of them totally damaged
5.6 Factors Affecting Adoption of the Introduced SWC Technologies
In the watershed, the newly introduced soil and water conservation measures are rare.
Though farmers showed willingness to adopt the newly introduced SWC structures,
they are reluctant to practice these measures to their farmlands. From the interviewed
farmers, 87% reported that some conservation measures like terraces, bunds and
fanyajuus were time consuming and labor demanding for construction (Table 18). The
other issue that affected their conservation practices was lack of technical support
(23%) from the agricultural experts to construct bunds and terraces (locally known as
kiyessa). In the group discussion and informal interviews, lack of kiyessa was the big
issue raised by the participants. Table 18: Farmers’ reasons for not adopting the newly introduced SWC measures
Options Percentage (n = 80) Requires too much labor to implement Land insecurity Decrease farm size and difficult to plow Harbor mole-rats Lack of knowledge Not considering erosion as a problem Others (lack of technical support)
88 5 19 11 10 0 23
Note: Totals over 100% are due to multiple responses.
For example, farmers who wanted to construct with his indigenous knowledge
like terraces and if his neighbor does not, the runoff will not drained out, as the owner
of the down slope fields does not permit to receive the runoff since he did not
construct some conservation measures like the one who did. However, they
underlined, “if there were kiyessa, all the farmers would construct”, “even tomorrow
morning”. The researcher interviewed this issue to the Adet local district agricultural
office experts. They of course confirmed that there was little attention given to this
59
issue. However, they also assured that the office designed strategies to apply the
technology based on the farmers’ indigenous knowledge. The experts added that
farmers have awareness to the technologies but are unwilling to implement except few
in the district. In the watershed especially in Feres-woga village, few farmers felt land
insecure because they perceived as the government would take the watershed for the
investment purpose as was done at their neighbor kebele.
Finally, farmers during personal interview and group discussion were asked to
recommend what should be done to improve the effectiveness of SWC measures. They
suggested: (a) most farmers do not have materials to construct terraces and bunds.
Therefore, the concerned body like government should support in this regard; (b)
technical support from experts to design the SWC measures is mandatory; (c) though
farmers have awareness to soil erosion problem, continuous training and experience
sharing and incentives should be given for the community to understand and
implement the new SWC measures; (d) Once conservation structure constructed, it
should be maintained whenever necessary; (e) efforts should be taken until farmers
show willingness to adopt/adapt the technology; (f) the gap between two consecutive
terraces should consider the steepness of the crop lands; (g) if there is accessibility of
grasses and trees seedlings, they have dual purposes: for forage and for soil
conservation measures.
60
CHAPTER SIX
6 RECOMMENDATIONS
The current trend of land degradation by soil erosion is a threat to food security
and Debre Mewi watershed is not an exception. The farmers in the Debre-Mewi
watershed suffer from severe erosion. Gullies and their effects are increasing at
alarming. Basic natural resources like soil, water and vegetative cover in the
watershed are deteriorating. Farmers are not satisfied with the status of their current
land holding. Based on the interview and field observation, the intensity of the rainfall
coupled with poor vegetation cover has aggravated the soil erosion in the watershed.
Hence, crop production and soil productivity have been decreasing overtime. Sofar,
farmers hardly undertake action to reduce erosion. Only few soil conservation
structures accompanied with poor management practices at household level were
observed frequently during the survey. If nothing is done to correct the existing
situation, more land will become unsuitable for crop production amd put even more
strain on the existing resources Therefore, sustainable soil management systems must
be developed to reduce further degradation and restore the productivity of the eroded
land. The management options to reduce the soil loss are to implement conservation
measures and/or to change the crop to be planted. Soil conservation methods including
terraces and bunds as well as semi-permeable structures like grass strips are used as
barriers to holdback runoff and sediment carried with it. Agronomic measures like
contour plowing have the advantage to reduce runoff and soil loss. Changing to crops
that need less tillage and improve the soil structure can reduce the problem of erosion.
Especially the soil conservation designers should find a mechanism in such a way that
farmer can plant tef to get high profit while its contribution to erosion is minimized.
Cultural ditches currently implemented by farmers are effective in general and should
be an integral part in soil and water management practices proposed by soil
61
conservation designers. In the few cases that the cultural ditches did not perform well
they should be designed properly.
Farmers should be motivated to adapt the newly introduced SWC technologies
based on their indigenous knowledge. This may require a long and continuous effort
until they accept and implement the technology. During discussions with local
farmers, they showed great interest to practice terraces/bunds and grass strips and
plantation in their croplands. However, accessibility of grasses and trees seedling may
limit the application of such measures. The author hopes that AARC together with the
local office of Agriculture can help farmers in this regard.
Finally, the participation of different stakeholders during strategy
development, policy formulation and technology selection to sustain agricultural
productivities will help to identify the interests of the different stakeholders and to
choose more acceptable and appropriate management options. Therefore, detail
investigation should be undertaken through the collaboration of stakeholders to
identify better management options that decrease soil erosion and improve food
productivity. At last but not the least, as there is no best conservation measure, the
integration measures are highly recommended.
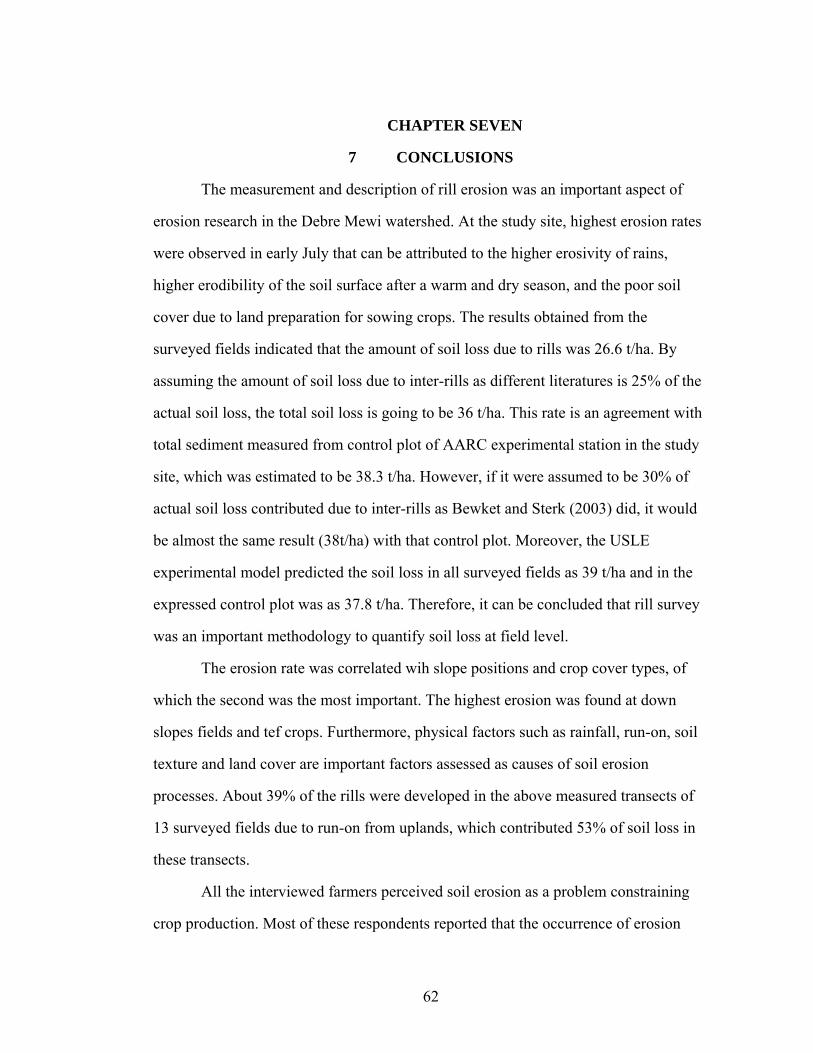
62
CHAPTER SEVEN
7 CONCLUSIONS
The measurement and description of rill erosion was an important aspect of
erosion research in the Debre Mewi watershed. At the study site, highest erosion rates
were observed in early July that can be attributed to the higher erosivity of rains,
higher erodibility of the soil surface after a warm and dry season, and the poor soil
cover due to land preparation for sowing crops. The results obtained from the
surveyed fields indicated that the amount of soil loss due to rills was 26.6 t/ha. By
assuming the amount of soil loss due to inter-rills as different literatures is 25% of the
actual soil loss, the total soil loss is going to be 36 t/ha. This rate is an agreement with
total sediment measured from control plot of AARC experimental station in the study
site, which was estimated to be 38.3 t/ha. However, if it were assumed to be 30% of
actual soil loss contributed due to inter-rills as Bewket and Sterk (2003) did, it would
be almost the same result (38t/ha) with that control plot. Moreover, the USLE
experimental model predicted the soil loss in all surveyed fields as 39 t/ha and in the
expressed control plot was as 37.8 t/ha. Therefore, it can be concluded that rill survey
was an important methodology to quantify soil loss at field level.
The erosion rate was correlated wih slope positions and crop cover types, of
which the second was the most important. The highest erosion was found at down
slopes fields and tef crops. Furthermore, physical factors such as rainfall, run-on, soil
texture and land cover are important factors assessed as causes of soil erosion
processes. About 39% of the rills were developed in the above measured transects of
13 surveyed fields due to run-on from uplands, which contributed 53% of soil loss in
these transects.
All the interviewed farmers perceived soil erosion as a problem constraining
crop production. Most of these respondents reported that the occurrence of erosion

63
damages get bigger when the soil was bare (before vegetative growth). Farmers
expressed the opinion that the loss of soil from cultivated fields reduced the depth of
the topsoil and lead to a reduced production potential. Rill erosion was the dominant
forms mentioned by 89% of the farmers whereas, sheet erosion was not perceived as
erosion problem. The farmers consider that erosion is severe mostly when the visible
erosion features like rills and gullies appeared in their fields.
The most widely used land conservation techniques by farmers in Debre Mewi
watershed were: traditional ditches, soil bunds and contour plowing. Of these,
drainage ditches, whose limitations and advantages are discussed in this paper, are the
preferred and most widely practiced conservation measures because they are less labor
demanding and more effective in disposal of excess water after heavy rain occurred.
The major factors influencing farmers’ land conservation decision processes were:
demanding much labor, decreasing farm size and difficult to plow and lack of
technical support from agricultural experts.

64
CHAPTER EIGHT
8 REFERENCES
Amsalu Aklilu; Graaff J.D., 2004. Farmers’ Views of Soil Erosion Problems and their
Conservation Knowledge at Beressa Watershed, Central Highlands of Ethiopia, Volume 23 pp. 99-108.
Amsalu Aklilu; Graaff J.D., 2006. Determinants of adoption and continued use of
stone terraces for soil and water conservation in an Ethiopian highland Ecological economics 61, pp: 294-302.
Amsalu Aklilu, Leo Stroosnijder, Jan deGraaff 2007. Long-term dynamics in land
resource use and the driving forces in the Beressa watershed, high lands of Ethiopia, Enviromental management 83, 448-459.
, Angima S.D., Stott, D.E., O'Neill, M.K., Ong, C.K., Weesies, G.A., 2003. Soil
erosion prediction using RUSLE for central Kenya highland conditions. Agriculture Ecosystem and Envi. 295-308.
Azene B., 2001. Status and dynamics of natural resources in Ethiopia. In: Taye A.
(Ed.), Food Security through Sustainable Land Use: Population, Environment and Rural Development Issues for Sustainable Livelihoods in Ethiopia. NOVIB Partners Forum on Sustainable Land Use, Addis Ababa, Ethiopia, pp. 165–184.
Basic F., I. Kisic, M. Mesic, O. Nestroy, A. Butorac, 2004. Tillage and crop
management effects on soil erosion in central Croatia. Soil & Tillage Research 78, 197–206.
Bekele W., Drake, L., 2003. Soil and water conservation decision behavior of
subsistence farmers in the eastern highlands of Ethiopia: a case study of the Hunde-Lafto area. Ecological Economics 46, 437–451.
Belyaev V., P.J. Wallbrink, V. Golosov, A.S. Murray and A. Sidorchuk, 2004. A
comparison of methods for evaluating soil redistribution in the severely eroded Stavropol region, southern European Russia,Faculty of Geography, Moscow State University, Russia.
Benjamin M. Liu, Yitayew Abebe, Oloro V. McHugh, Amy S. Collick, Brhane
Gebrekidan and Tammo S. Steenhuis, 2007. Overcoming limited information through participatory watershed management: Case study in Amhara, Ethiopia ,Department of Biological and Environmental Engineering, Cornell University, Ithaca, NY, United States.

65
Beshah T., 2003. Understanding farmers: explaining soil and water conservation in
Konso, Wolaita and Wello, Ethiopia. Tropical Resource Management Papers, vol. 41. Wageningen University. 245 pp.
Bewket W., Sterk, G., 2002. Farmers’ participation in soil and water conservation
activities in Chemoga watershed, Blue Nile Basin, Ethiopia. Land Degrad. Dev. 13, 189–200.
Bewket W., 2002. Land Cover Dynamics since the 1950s in Chemoga watershed, Blue
Nile Basin, Ethiopia, Mountain Research and Development Vol 22 No 3 August 2002: 263-269.
Bewket W., 2003. Household level tree planting and its implications for
environmental management in the northwestern highlands of Ethiopia: a case study in the Chemoga watershed, Blue Nile basin. Land Degrad. Develop. 14: 377–388.
Bewket W. and Geert Sterk, 2003. Assessment of soil erosion in cultivated fields
using a survey methodology for rills in the Chemoga watershed, Ethiopia. Agriculture, Ecosystems and Environment 97 (2003) 81–93.
Bewket W. and Geert Sterk, 2005. Dynamics in land cover and its effect on stream
flow in the Chemoga watershed, Blue Nile basin, Ethiopia Hydrological Process. 19, 445–458.
Bewket W., 2007. Soil and water conservation intervention with conventional
technologies in northwestern highlands of Ethiopia: Acceptance and adoption by farmers. Land use policy papers 24, pp 404–416, Department of Geography and Environmental Studies, Addis Ababa University.
Bobe B.W., 2004.Evaluation of soil erosion in the Haregie Region of Ethiopia using
soil loss models, rainfall simulation and field trials, Doctorial Thesis, Pretoria University.
Brazier Richard, 2004. Quantifying soil erosion by water in the UK: a review of
monitoring and modeling approaches, Progress in Physical Geography 28, 3, pp. 340–365.
Casalí J. , Loizu J., Campo M.A. , De Santisteban L.M. and Álvarez-Mozos J., 2006.
Accuracy of methods for field assessment of rill and ephemeral gully erosion, Public University of Navarre, Department of Projects and Rural Engineering, Campus de Arrosadia s/n, 31006 Pamplona, Navarre, Spain.
Daba S., 2003. An investigation of the physical and socioeconomic determinants of

66
soil erosion in the hararghe highlands, eastern Ethiopia. Land Degrad. Develop. 14: 69–81.
Daba Shibru, Wolfgang Rieger, Peter Strauss, 2003. Assessment of gully erosion in
eastern Ethiopia using photogrammetric techniques Catena 50, 273– 291. Evans R., 1993. On assessing accelerated erosion of arable land by water. Soils and Fertilizers 56, no.11: 1285-1293. Feoli E., Laura Gallizia Vuerich, Woldu Zerihun, 2002. Evaluation of environmental
degradation in northern Ethiopia using GIS to integrate vegetation, geomorphological, erosion and socio-economic factors , Agriculture, Ecosystems and Environment 91, 313–325.
Gebremedhin B., Swinton S.M., 2003. Investment in soil conservation in northern
Ethiopia: the role of land tenure security and public programs. Agricultural Economics 29, 69–84.
Govers G., 1991. Rill erosion on arable land in central Belgium: Rates, controls, and
predictability. Catena 18: 133-155. Graaff J.D., 1993. Soil conservation and sustainable land use: An economic approach
Royal Tropical Institute, Amsterdam. Ethiopia: The agricultural sector: an overview. Vols. II and I.Rome: FAO.
Graaff, J.D., Amsalu, A., Bodnar, F., Kessler, A., Posthumus, H.,Tenge, A., 2005.
Adoption of soil and water conservation measures. Paper presented at EFA RD Conference in Zurich. Agricultural Research for Development: European Responses to Changing Global Needs. Zurich, 27 – 29 April, Switzerland.
Gregory J.H., Michael D. Dukes Grady L. Miller, Pierce H. Jones, 2005. Analysis of
Double-Ring Infiltration Techniques and Development of a Simple Automatic Water Delivery System. Plant Management Network.
Hagmann Jurgen, 1996. Mechanical soil conservation with contour ridges: cure for, or
cause of, rill erosion? Land degradation & development, vol. 7,145-160. Hanson D. L., T. S. Steenhuis, M. F. Walter and J. Boll, 2004. Effects of soil
degradation and management practices on the surface water dynamics in the talgua river watershed in Honduras, Land Degradation Develop. 15: 367–381.
Haregeweyn N., Jean Poesen,T, Jan Nyssena, Gert Verstraeten, Joris de Vente,
Gerard Govers, Seppe Deckers, Jan Moeyersons, 2005. Specific sediment yield in Tigray-Northern Ethiopia: Assessment and semi-quantitative modeling Geomorphology 69, 315–331.

67
Herweg K., 1993. ‘‘Problems of acceptance and adoption of soil conservation in
Ethiopia.’’ Topics in Applied Resource Management 3: 391–411. Herweg K., 1996. Field manual for assessment of current erosion damage. Soil
conservation research programme (SCRP), Ethiopia and centre for development and environment (CDE), University of Berne, Switzerland.
Herweg K., Ludi E., 1999. The performance of selected soil and water conservation
measures—case studies from Ethiopia and Eritrea, Catena 36, 99–114. Herweg K., Stillhardt, B., Krauer, J., Frey, L., Hurni, H., 2002.
http://www.sfiar.infoagrar.ch/documents/posters/frey.pdf. Hudson N.W., 1993. Field measurement of soil erosion and runoff. Food and
Agricultural Organization (FAO) of the united nations Ampthil, United Kingdom.
Hurni H., 1985a. Erosion-productivity systems in Ethiopia. In: Proceedings of the
Fourth International Conference on Soil Conservation. Venezuela. Hurni H., 1985b. An ecosystem approach to soil conservation. In: El-Swaify, S.A.,
Moldenhauer, W.C., Lo, A. (Eds.), Soil Erosion and Conservation. Soil Conservation Society of America, Ankey, Iowa, pp. 759–771.
Hurni H., 1993. Land degradation, famine, and land resource scenarios in Ethiopia.
Cambridge University Press, Cambridge, pp. 27-62. Hurni H.; Kebede T.; Zeleke G., 2005. Implications of Changes in Population,
Land Use and Land Management for surface runoff in the upper basin area of Ethiopia. Mountain Research and Development; May 2005; 25, 2; 147-154.
Jaggar P., John Pender, 2003.The role of trees for sustainable management of less-
favored lands: the casa of eucalyptus in Ethiopia. Forest Policy and Economics 5, 83-95.
Makombe G.l & Dawit K. & Dejene A, 2007. A comparative analysis of rain fed and
irrigated agricultural production in Ethiopia, Irrig Drainage Syst 21:35–44. MoA (Ministry of Agriculture), 2001. A guide to watershed management, Ethiopia. Mintesinot B., H. Verplancke , E. Van Ranst , H. Mitiku, 2004. Examining traditional
irrigation methods, irrigation scheduling and alternate furrows irrigation on vertisols in northern Ethiopia. Agricultural Water Management 64, 17–27.

68
Mitiku H., Herweg, K., Stillhardt, B., 2006. Sustainable land Management- a New Approach to Soil and Water Conservation in Ethiopia.pp.79-89, Mekele University, Ethiopia.
Moges A. and Holden N.M., 2006. farmers’ perceptions of soil erosion and soil
fertility loss in southern ethiopia, land degradation & development. Mohammad A. Jabbar, M.A. Mohamed Saleem and Hugo Li-Pun, 2001. Towards
transdisciplinarity in technology and resource management research: a project in Ethiopia. Outlook on AGRICULTURE Vol 30, No 4, pp 257–260.
Morgan R.P.C., 1996. Soil Erosion and Conservation, second ed. Longman Silsoe
College, Cranfield University. Morgan RPC., 2005. Soil erosion and conservation. Blackwell Publishing, Malden,
MA: pp 304. Mwendera E. J., Mohamed Saleem M. A. and Dibabe A., 1997.The effect of livestock
grazing on surface runoff and soil erosion from sloping pasture lands in the Ethiopian highlands, Australian Journal of Experimental Agriculture, 37, 421–30.
Mwendera E.J. & Mohamed Saleem M.A. ,1997. Infiltration rates, surface runoff, and
soil loss as influenced by grazing pressure in the Ethiopian highlands Soil Use and Management 13, 29-35.
Nyssen Jan, Jean Poesena, Jan Moeyersonsc, Jozef Deckersd, Mitiku Haileb, Andreas
Lange, 2004. Human impact on the environment in the Ethiopian and Eritrean highlands—a state of the art Earth-Science Reviews 64, 273–320.
Pimentel D., Harvey, C., Resosudarmo, P., Sinclair, K., Kurz, D., McNair, M., Crist,
S., Shpritz, L., Fitton, L., Saffouri, R., Blair, R., 1995. Environmental and economic costs of soil erosion and conservation benefits. Science 267, 1117–1123.
Randolph T. F., E. Schelling, D. Grace, C. F. Nicholson, J. L. Leroy, D. C. Cole, M.
W. Demment, A. Omore, J. Zinsstag, and M. Ruel, 2007. Invited Review: Role of livestock in human nutrition and health for poverty reduction in developing countries1,2,3. pp 2788- 2800.
Shiferaw B., Holden, S., 1998. Resource degradation and adoption of land
conservation technologies in the Ethiopian highlands: a case study in Andit Tid, North Shewa. Agric. Econ. 18, 233–247.
Shiferaw B. and Holden S., 1999. Soil Erosion and Smallholders' Conservation

69
Decisions in the Highlands of Ethiopia. World Development Vol. 27, No. 4, pp. 739 – 752.
Shiferaw B., Stein T. Holden, 2000. Policy instruments for sustainable land
management: the case of highland smallholders in Ethiopia. Agricultural Economics 22, 217–232.
Shiferaw B., Holden, T.S., 2001. Farm-level benefits to investments for mitigating
land degradation: empirical evidence from Ethiopia. Environ. Dev. Econ. 6, 335–358.
Sonneveld B.G.J.S., 2002. Land Under Pressure: The Impact of Water Erosion on
Food Production in Ethiopia. Shaker Publishing, Maastricht, The Netherlands. Sonneveld B. G. J. S. and Keyzer M. A., 2003. Land under pressure: soil conservation
concerns and opportunities for Ethiopia. Land Degrad. Develop. 14: 5–23. Tadesse, G., 2001. Land degradation: a challenge to Ethiopia. Environmental Management 27, 815–824. Tamene L., Park S.J., Dikau R., Vlek P.L.G. 2006. Analysis of factors determining
sediment yield variability in the highlands of northern Ethiopia, Geomorphology 76, 76– 91.
Tamene L. & P. L. G. Vlek2007. Assessing the potential of changing land use for
reducing soil erosion and sediment yield of catchments: a case study in the highlands of northern Ethiopia, Soil Use and Management, 23, 82–91.
Tegegne B., 1992. Erosion: its effects on properties and productivity of eutric nitosols
in Gununo area, southern Ethioia, Doctoral thesis. Thorntona P.K., P.M. Kristjansona, P.J. Thorneb, 2003. Measuring the potential
impacts of improved food-feed crops: methods for ex ante assessment Field Crops Research 84, 199–212.
Wainwright, J., Parsons, A.J. and Abrahams, A. 2000: Plot-scale studies of vegetation,
overland flow and erosion interactions: case studies from Arizona and New Mexico.Hydrological Processes 14, 2921–43.
Yeraswork, A. (2000). Twenty Years to Nowhere: Property Rights, Land Management
and Conservation in Ethiopia. Lawrenceville, New Jersey: Red Sea Press. Zancher D. 1982. Soil Erosion, Developments in Soil Sciences, Elsevier, Amsterdam. Zinabu G. M., Elizabeth Kebede-Westhead & Zerihun Desta1, 2002. Long-term

70
changes in chemical features of waters of seven Ethiopian rift-valley lakes Hydrobiologia 477: 81–91.

71
APPENDIX A: TABLES
TABLE A1: SOME DESCRIPTIONS OF THE SURVEYED FIELDS Slope positions
Field No
Field L (m)
Field W (m)
Field size (ha)
Crop type
Date of sowing
First measurement
date
Slope (%)
Slope length (m)
Critical distance
(m)
Down slope
1 60 45 0.27 Tef 7/14/2008 7/11/2008 11_16 60 5 2 75 45 0.34 Tef 7/13/2008 7/11/2008 12_20 75 5 3 55 74 0.41 Tef 7/16/2008 7/11/2008 14_16 55 6 4 50 47 0.24 Tef 7/15/2008 7/11/2008 10_15 50 5 5 44 36 0.16 Tef 7/15/2008 7/11/2008 12_16 44 6 6 34 70 0.24 Tef 7/15/2008 7/11/2008 11_12 34 6
Mid slope
7 78 29 0.23 Maize 6/11/2008 7/11/2008 12_18 78 6 8 62 38 0.24 Tef 7/16/2008 7/12/2008 8_12 62 7 9 56 45 0.25 Tef 7/15/2008 7/12/2008 8_10 56 7 10 49 39 0.19 Wheat 7/7/2008 7/12/2008 9_12 49 6 11 40 60 0.24 Tef 7/4/2008 7/2/2008 10_12 40 6 12 31 49 0.15 Tef 7/16/2008 7/12/2008 7_9 31 7 13 41 47 0.19 Millet 7/3/2008 7/12/2008 7_9 41 7
upslope
14 50 50 0.25 Millet 7/4/2008 7/12/2008 9_10 50 7 15 28 60 0.17 Millet 6/23/2008 7/12/2008 8_10 28 7
Total 3.56

72
TABLE A2: SELECTED MAXIMUM RILL DIMENSIONS AIDING ANALYSIS OF RILL MAGNITUDES Observ. Date
Tran sect
No of rills
Ave L (m)
Ave W (cm)
Ave. D (cm)
Field size (ha)
soil loss (m3)
Soil Loss ∑(m3)
Soil loss (t)
Soil loss (t/ha)
AAD (m2)
AAD ∑(m2)
AAD as% to field size (%)
Soil Loss per AAD m3/ha
Total length (m)
Rill density (m/ha)
8/1/
2008
1 1 17 70 3 0.27
0.36 0.36 0.43 1.60 11.9 11.9 0.4 300.0 17.0 63.0 17 10 15 3 0.05 0.77 0.93 3.43 1.5 25.5 0.9 300.0 170.0 629.6
2 12 8 15 3 0.04 0.43 0.52 1.94 1.2 14.4 0.5 300.0 96.0 355.6 1 8 50 4 0.16 0.16 0.19 0.72 4.0 4.0 0.1 400.0 8.0 29.6 1 10 150 4 0.60 0.60 0.73 2.69 15.0 15.0 0.6 400.0 10.0 37.0
3 1 10 50 3 0.15 0.15 0.18 0.67 5.0 5.0 0.2 300.0 10.0 37.0 20 8 10 3 0.02 0.48 0.58 2.15 0.8 16.0 0.6 300.0 160.0 592.6 2 12 200 3 0.72 1.44 1.74 6.45 24.0 48.0 1.8 300.0 24.0 88.9
4 1 18 200 4 1.44 1.44 1.74 6.45 36.0 36.0 1.3 400.0 18.0 66.7 8 8 8 2 0.01 0.10 0.12 0.46 0.6 5.1 0.2 200.0 64.0 237.0 1 14 150 4 0.84 0.84 1.02 3.76 21.0 21.0 0.8 400.0 14.0 51.9
Sum 4 65 11.2 83.5 3.3 4.38 6.77 8.19 30.32 121.0 201.9 7.5 335.1 591.0 2188.9
8/1/
2008
1 18 8 15 4 0.34
0.05 0.86 1.05 3.10 1.2 21.6 0.6 400.0 144.0 426.7 2 9 195 4 0.70 1.40 1.70 5.03 17.6 35.1 1.0 400.0 18.0 53.3 10 8 12 5 0.05 0.48 0.58 1.72 1.0 9.6 0.3 500.0 80.0 237.0 2 1 16 60 4 0.38 0.38 0.46 1.38 9.6 9.6 0.3 400.0 16.0 47.4 12 8 15 4 0.05 0.58 0.70 2.07 1.2 14.4 0.4 400.0 96.0 284.4 10 10 12 4 0.05 0.48 0.58 1.72 1.2 12.0 0.4 400.0 100.0 296.3 3 9 12 15 4 0.07 0.65 0.78 2.32 1.8 16.2 0.5 400.0 108.0 320.0 1 11 90 4.5 0.45 0.45 0.54 1.60 9.9 9.9 0.3 450.0 11.0 32.6 4 9 10 12 3 0.04 0.32 0.39 1.16 1.2 10.8 0.3 300.0 90.0 266.7 20 10 20 4 0.08 1.60 1.94 5.74 2.0 40.0 1.2 400.0 200.0 592.6 1 10 30 3 0.09 0.09 0.11 0.32 3.0 3.0 0.1 300.0 10.0 29.6 5 20 10 25 3 0.08 1.50 1.82 5.38 2.5 50.0 1.5 300.0 200.0 592.6 6 18 10 20 3 0.06 1.08 1.31 3.87 2.0 36.0 1.1 300.0 180.0 533.3
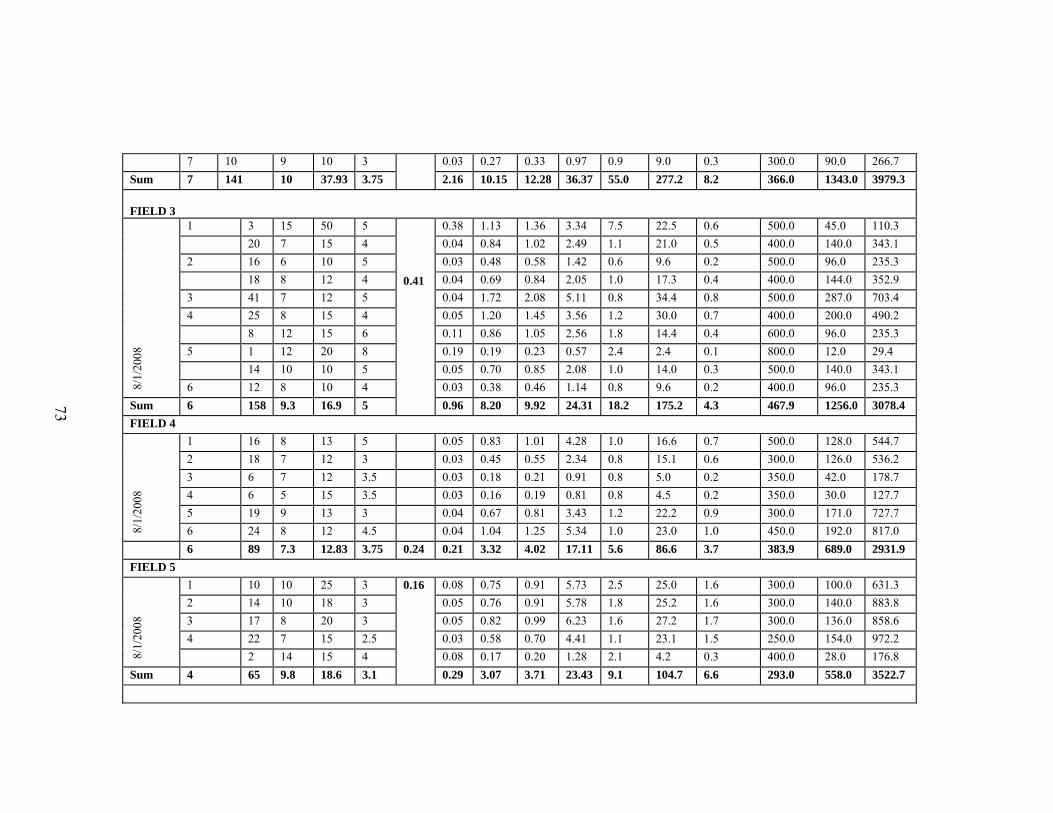
73
7 10 9 10 3 0.03 0.27 0.33 0.97 0.9 9.0 0.3 300.0 90.0 266.7 Sum 7 141 10 37.93 3.75 2.16 10.15 12.28 36.37 55.0 277.2 8.2 366.0 1343.0 3979.3 FIELD 3
8/1/
2008
1 3 15 50 5 0.41
0.38 1.13 1.36 3.34 7.5 22.5 0.6 500.0 45.0 110.3 20 7 15 4 0.04 0.84 1.02 2.49 1.1 21.0 0.5 400.0 140.0 343.1 2 16 6 10 5 0.03 0.48 0.58 1.42 0.6 9.6 0.2 500.0 96.0 235.3 18 8 12 4 0.04 0.69 0.84 2.05 1.0 17.3 0.4 400.0 144.0 352.9 3 41 7 12 5 0.04 1.72 2.08 5.11 0.8 34.4 0.8 500.0 287.0 703.4 4 25 8 15 4 0.05 1.20 1.45 3.56 1.2 30.0 0.7 400.0 200.0 490.2 8 12 15 6 0.11 0.86 1.05 2.56 1.8 14.4 0.4 600.0 96.0 235.3 5 1 12 20 8 0.19 0.19 0.23 0.57 2.4 2.4 0.1 800.0 12.0 29.4 14 10 10 5 0.05 0.70 0.85 2.08 1.0 14.0 0.3 500.0 140.0 343.1 6 12 8 10 4 0.03 0.38 0.46 1.14 0.8 9.6 0.2 400.0 96.0 235.3
Sum 6 158 9.3 16.9 5 0.96 8.20 9.92 24.31 18.2 175.2 4.3 467.9 1256.0 3078.4 FIELD 4
8/1/
2008
1 16 8 13 5 0.05 0.83 1.01 4.28 1.0 16.6 0.7 500.0 128.0 544.7 2 18 7 12 3 0.03 0.45 0.55 2.34 0.8 15.1 0.6 300.0 126.0 536.2 3 6 7 12 3.5 0.03 0.18 0.21 0.91 0.8 5.0 0.2 350.0 42.0 178.7 4 6 5 15 3.5 0.03 0.16 0.19 0.81 0.8 4.5 0.2 350.0 30.0 127.7 5 19 9 13 3 0.04 0.67 0.81 3.43 1.2 22.2 0.9 300.0 171.0 727.7 6 24 8 12 4.5 0.04 1.04 1.25 5.34 1.0 23.0 1.0 450.0 192.0 817.0
6 89 7.3 12.83 3.75 0.24 0.21 3.32 4.02 17.11 5.6 86.6 3.7 383.9 689.0 2931.9 FIELD 5
8/1/
2008
1 10 10 25 3 0.16 0.08 0.75 0.91 5.73 2.5 25.0 1.6 300.0 100.0 631.3 2 14 10 18 3 0.05 0.76 0.91 5.78 1.8 25.2 1.6 300.0 140.0 883.8 3 17 8 20 3 0.05 0.82 0.99 6.23 1.6 27.2 1.7 300.0 136.0 858.6 4 22 7 15 2.5 0.03 0.58 0.70 4.41 1.1 23.1 1.5 250.0 154.0 972.2 2 14 15 4 0.08 0.17 0.20 1.28 2.1 4.2 0.3 400.0 28.0 176.8
Sum 4 65 9.8 18.6 3.1 0.29 3.07 3.71 23.43 9.1 104.7 6.6 293.0 558.0 3522.7

74
FIELD 6
8/1/
2008
1 2 7 15 1.5 0.24 0.02 0.03 0.04 0.16 1.1 2.1 0.1 150.0 14.0 58.1 2 11 8 15 4 0.05 0.53 0.64 2.65 1.2 13.2 0.5 400.0 88.0 365.4 3 12 10 10 8 0.08 0.96 1.16 4.82 1.0 12.0 0.5 800.0 120.0 498.3 4 16 10 15 6 0.09 1.44 1.74 7.24 1.5 24.0 1.0 600.0 160.0 664.5 5 5 4 15 2 0.01 0.06 0.07 0.30 0.6 3.0 0.1 200.0 20.0 83.1 7 10 15 3 0.05 0.32 0.38 1.58 1.5 10.5 0.4 300.0 70.0 290.7 6 5 12 10 10 0.12 0.60 0.73 3.01 1.2 6.0 0.2 1000.0 60.0 249.2 7 11 9 20 2 0.04 0.40 0.48 1.99 1.8 19.8 0.8 200.0 99.0 411.1 8 14 9 25 2 0.05 0.63 0.76 3.17 2.3 31.5 1.3 200.0 126.0 523.3
8 83 8.78 15.56 4.28 0.49 4.96 6.00 24.93 12.1 122.1 5.1 406.3 757.0 3143.7 FIELD 7
7/29
/200
8
1 14 10 15 3 0.23 0.05 0.63 0.76 3.37 1.5 21.0 0.9 300.0 140.0 618.9 2 9 7 10 3 0.02 0.19 0.23 1.01 0.7 6.3 0.3 300.0 63.0 278.5 7 20 15 3 0.09 0.63 0.76 3.37 3.0 21.0 0.9 300.0 140.0 618.9 1 15 75 4 0.45 0.45 0.54 2.41 11.3 11.3 0.5 400.0 15.0 66.3 3 1 10 45 6 0.27 0.27 0.33 1.44 4.5 4.5 0.2 600.0 10.0 44.2 5 9 10 3 0.03 0.14 0.16 0.72 0.9 4.5 0.2 300.0 45.0 198.9 4 11 12 10 3 0.04 0.40 0.48 2.12 1.2 13.2 0.6 300.0 132.0 583.6
Sum 4 48 12 25.71 3.571 0.94 2.70 3.27 14.44 23.1 81.8 3.6 330.3 545.0 2409.4 FIELD 8
8/2/
2008
1 13 15 10 2.5 0.24 0.04 0.49 0.59 2.50 1.5 19.5 0.8 250.0 195.0 827.7 2 6 300 2.5 0.45 0.90 1.09 4.62 18.0 36.0 1.5 250.0 12.0 50.9 2 1 15 325 2.5 1.22 1.22 1.47 6.26 48.8 48.8 2.1 250.0 15.0 63.7 20 6 12 3 0.02 0.43 0.52 2.22 0.7 14.4 0.6 300.0 120.0 509.3 3 6 12 20 3 0.07 0.43 0.52 2.22 2.4 14.4 0.6 300.0 72.0 305.6
sum 3 42 11 133.4 2.7 1.80 3.47 4.20 17.82 71.4 133.1 5.6 260.8 414.0 1757.2 FIELD 9 8/2/2008 1 14 7 20 3 0.15 0.04 0.59 0.71 4.68 1.4 19.6 1.3 300.0 98.0 645.2
2 1 5 60 3 0.09 0.09 0.11 0.72 3.0 3.0 0.2 300.0 5.0 32.9

75
16 6 12 2.5 0.02 0.29 0.35 2.29 0.7 11.5 0.8 250.0 96.0 632.0 3 19 9 10 2.5 0.02 0.43 0.52 3.41 0.9 17.1 1.1 250.0 171.0 1125.7 2 8 150 3 0.36 0.72 0.87 5.74 12.0 24.0 1.6 300.0 16.0 105.3
Sum 3 52 7 50.4 2.8 0.53 2.11 2.56 16.84 18.0 75.2 5.0 281.0 386.0 2541.1 FIELD 10
8/2/
2008
1 8 6 15 4 0.19 0.04 0.29 0.35 1.82 0.9 7.2 0.4 400.0 48.0 251.2 2 2 7 15 3 0.03 0.06 0.08 0.40 1.1 2.1 0.1 300.0 14.0 73.3 3 3 24 15 3 0.11 0.32 0.39 2.05 3.6 10.8 0.6 300.0 72.0 376.8 1 24 50 4 0.48 0.48 0.58 3.04 12.0 12.0 0.6 400.0 24.0 125.6
Sum 3 14 15 23.75 3.5 0.66 1.16 1.40 7.31 17.6 32.1 1.7 359.8 158.0 826.8 FIELD 11
8/2/
2008
1 12 10 20 3 0.24 0.06 0.72 0.87 3.65 2.0 24.0 1.0 300.0 120.0 502.5 6 14 55 4 0.31 1.85 2.24 9.36 7.7 46.2 1.9 400.0 84.0 351.8 2 17 9 12 3 0.03 0.55 0.67 2.79 1.1 18.4 0.8 300.0 153.0 640.7 1 14 150 5 1.05 1.05 1.27 5.32 21.0 21.0 0.9 500.0 14.0 58.6 3 22 8 12 3 0.03 0.63 0.77 3.21 1.0 21.1 0.9 300.0 176.0 737.0 10 4 15 3 0.02 0.18 0.22 0.91 0.6 6.0 0.3 300.0 40.0 167.5 4 20 7 12 3 0.03 0.50 0.61 2.55 0.8 16.8 0.7 300.0 140.0 586.3 5 15 8 10 2.5 0.02 0.30 0.36 1.52 0.8 12.0 0.5 250.0 120.0 502.5 6 6 5 8 2 0.01 0.05 0.06 0.24 0.4 2.4 0.1 200.0 30.0 125.6 1 10 100 10 1.00 1.00 1.21 5.07 10.0 10.0 0.4 1000.0 10.0 41.9 7 25 5 12 2.5 0.02 0.38 0.45 1.90 0.6 15.0 0.6 250.0 125.0 523.5
Sum 7 135 8.5 36.9 3.7 2.57 7.21 8.72 36.53 46.0 192.9 8.1 373.8 1012.0 4237.9 FIELD 12
7/12
/200
8
1 16 6 10 2.5 0.19 0.02 0.24 0.29 1.51 0.6 9.6 0.5 250.0 96.0 498.2 2 16 6 8 2.5 0.01 0.19 0.23 1.21 0.5 7.7 0.4 250.0 96.0 498.2 3 17 5 10 2 0.01 0.17 0.21 1.07 0.5 8.5 0.4 200.0 85.0 441.1 4 8 7 12 2 0.02 0.13 0.16 0.84 0.8 6.7 0.3 200.0 56.0 290.6 5 22 6 10 2.5 0.02 0.33 0.40 2.07 0.6 13.2 0.7 250.0 132.0 685.0
Sum 5 79 6 10 2.3 0.07 1.07 1.29 6.70 3.0 45.7 2.4 233.3 465.0 2413.1

76
FIELD 13
8/2/
2008
1 10 11 30 3 0.25 0.10 0.99 1.20 4.75 3.3 33.0 1.3 300.0 110.0 436.5 2 15 10 25 3 0.08 1.13 1.36 5.40 2.5 37.5 1.5 300.0 150.0 595.2 3 14 12 12 2.5 0.04 0.50 0.61 2.42 1.4 20.2 0.8 250.0 168.0 666.7 4 16 15 10 2.5 0.04 0.60 0.73 2.88 1.5 24.0 1.0 250.0 240.0 952.4 5 24 15 10 2.5 0.04 0.90 1.09 4.32 1.5 36.0 1.4 250.0 360.0 1428.6
5 79 13 17.4 2.7 0.29 4.12 4.98 19.78 10.2 150.7 6.0 273.4 1028.0 4079.4 FIELD 14
7/23
/200
8
1 25 6 10 2.5 0.25
0.02 0.38 0.45 1.82 0.6 15.0 0.6 250.0 150.0 600.0 2 18 8 10 2.5 0.02 0.36 0.44 1.74 0.8 14.4 0.6 250.0 144.0 576.0 3 18 7 12 3 0.03 0.45 0.55 2.20 0.8 15.1 0.6 300.0 126.0 504.0 1 8 60 3 0.14 0.14 0.17 0.70 4.8 4.8 0.2 300.0 8.0 32.0 4 1 14 18 4 0.10 0.10 0.12 0.49 2.5 2.5 0.1 400.0 14.0 56.0 9 8 12 2.5 0.02 0.22 0.26 1.05 1.0 8.6 0.3 250.0 72.0 288.0 8 5 20 2.5 0.03 0.20 0.24 0.97 1.0 8.0 0.3 250.0 40.0 160.0 5 12 5 15 3 0.02 0.27 0.33 1.31 0.8 9.0 0.4 300.0 60.0 240.0
Sum 5 92 7.6 19.63 2.875 0.38 2.12 2.56 10.26 12.3 77.5 3.1 273.5 614.0 2456.0 FIELD 15 7/23/ 2008
1 1 6 200 3 0.17 0.36 0.36 0.44 2.59 12.0 12.0 0.7 300.0 6.0 35.7 2 12 6 25 2 0.03 0.36 0.44 2.59 1.5 18.0 1.1 200.0 72.0 428.6
Sum 2 13 6 112.5 2 0.39 0.72 0.87 5.19 13.5 30.0 1.8 240.0 78.0 464.3

77
TABLE A3: ESTIMATION OF SOIL LOSS USING USLE MODEL No Collected data for USLE parameters in each field Estimated values for each parameter At slope
length (15m)
Crop cover
RF (mm)
Soil color
L (m)
S (%)
Soil mgt Crop cover
RF (mm)
Soil color
L (m)
S% Avg
Soil mgt
Predict. Soil loss (t/ha)
at L = 15m
Soil loss at L=15m
1 Tef 1165 Brown 60 13.5 So. bund 0.25 647 0.2 1.6 1.33 0.5 34.4 0.8 34.4 2 Tef 1165 Brown 75 14 contour 0.25 647 0.2 1.8 1.40 0.9 73.4 0.8 36.2 3 Tef 1165 Brown 55 15 contour 0.25 647 0.2 1.5 1.50 0.9 66.4 0.8 38.8 4 Tef 1165 Brown 50 16 contour 0.25 647 0.2 1.5 1.58 0.9 69.0 0.8 40.9 5 Tef 1165 Brown 44 14 contour 0.25 647 0.2 1.4 1.40 0.9 57.1 0.8 36.2 6 Tef 1165 Black 34 11.5 contour 0.25 647 0.15 1.2 1.14 0.9 29.9 0.8 22.1 7 Maize 1165 Red 78 17 So. bund 0.1 647 0.25 1.8 1.64 0.5 23.9 0.8 21.2 8 Tef 1165 Red 62 10 St. bund 0.25 647 0.25 1.6 1.00 0.7 45.3 0.8 32.4 9 Tef 1165 Red 56 9 contour 0.25 647 0.25 1.5 0.90 0.7 39.2 0.8 29.1 10 Wheat 1165 Red 49 10.5 So. bund 0.15 647 0.25 1.5 1.00 0.5 18.2 0.8 19.4 11 Tef 1165 Red 40 10.5 contour 0.25 647 0.25 1.4 1.00 0.7 39.6 0.8 32.4 12 Tef 1165 Red 31 8 contour 0.25 647 0.25 1.2 0.80 0.7 27.2 0.8 25.9 13 Millet 1165 Red 41 8 contour 0.15 647 0.25 1.4 0.80 0.7 19.0 0.8 15.5 14 Millet 1165 Red 50 9.5 contour 0.15 647 0.25 1.6 0.95 0.7 25.8 0.8 18.4 15 Millet 1165 Red 28 9 contour 0.15 647 0.25 1.1 0.90 0.7 16.8 0.8 17.5 39 28
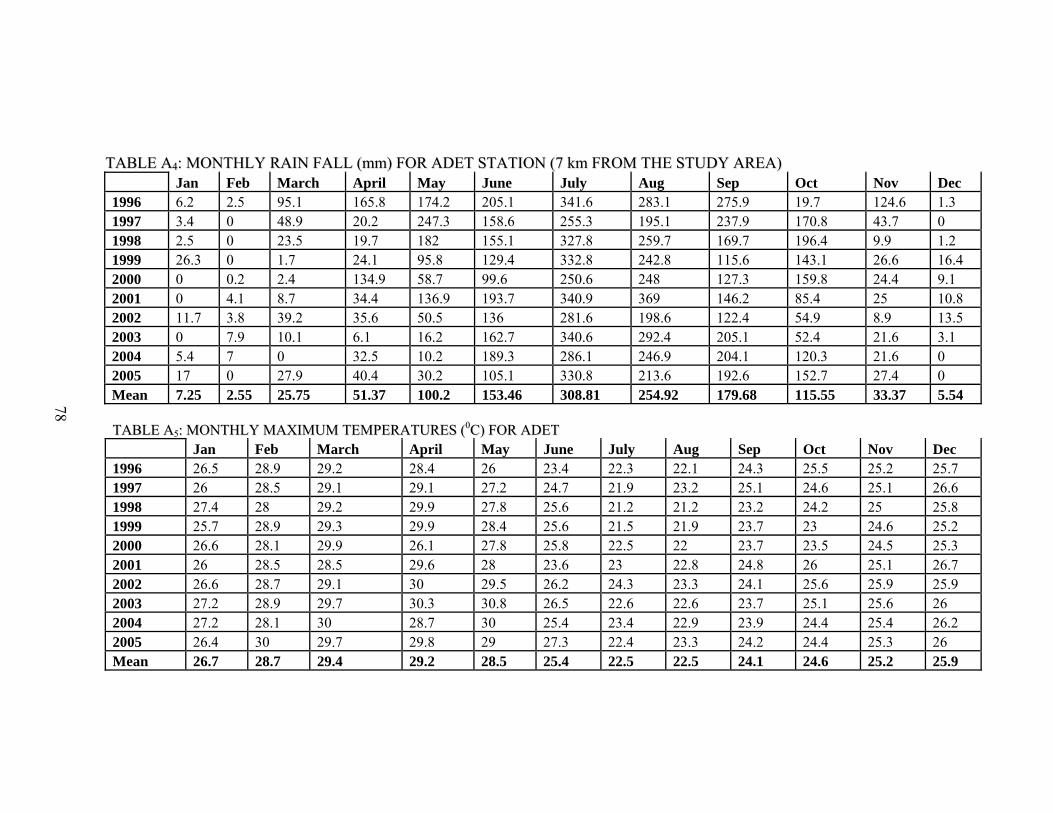
78
TTAABBLLEE AA44:: MMOONNTTHHLLYY RRAAIINN FFAALLLL ((mmmm)) FFOORR AADDEETT SSTTAATTIIOONN ((77 kkmm FFRROOMM TTHHEE SSTTUUDDYY AARREEAA)) Jan Feb March April May June July Aug Sep Oct Nov Dec 1996 6.2 2.5 95.1 165.8 174.2 205.1 341.6 283.1 275.9 19.7 124.6 1.3 1997 3.4 0 48.9 20.2 247.3 158.6 255.3 195.1 237.9 170.8 43.7 0 1998 2.5 0 23.5 19.7 182 155.1 327.8 259.7 169.7 196.4 9.9 1.2 1999 26.3 0 1.7 24.1 95.8 129.4 332.8 242.8 115.6 143.1 26.6 16.4 2000 0 0.2 2.4 134.9 58.7 99.6 250.6 248 127.3 159.8 24.4 9.1 2001 0 4.1 8.7 34.4 136.9 193.7 340.9 369 146.2 85.4 25 10.8 2002 11.7 3.8 39.2 35.6 50.5 136 281.6 198.6 122.4 54.9 8.9 13.5 2003 0 7.9 10.1 6.1 16.2 162.7 340.6 292.4 205.1 52.4 21.6 3.1 2004 5.4 7 0 32.5 10.2 189.3 286.1 246.9 204.1 120.3 21.6 0 2005 17 0 27.9 40.4 30.2 105.1 330.8 213.6 192.6 152.7 27.4 0 Mean 7.25 2.55 25.75 51.37 100.2 153.46 308.81 254.92 179.68 115.55 33.37 5.54 TTAABBLLEE AA55:: MMOONNTTHHLLYY MMAAXXIIMMUUMM TTEEMMPPEERRAATTUURREESS ((00CC)) FFOORR AADDEETT Jan Feb March April May June July Aug Sep Oct Nov Dec 1996 26.5 28.9 29.2 28.4 26 23.4 22.3 22.1 24.3 25.5 25.2 25.7 1997 26 28.5 29.1 29.1 27.2 24.7 21.9 23.2 25.1 24.6 25.1 26.6 1998 27.4 28 29.2 29.9 27.8 25.6 21.2 21.2 23.2 24.2 25 25.8 1999 25.7 28.9 29.3 29.9 28.4 25.6 21.5 21.9 23.7 23 24.6 25.2 2000 26.6 28.1 29.9 26.1 27.8 25.8 22.5 22 23.7 23.5 24.5 25.3 2001 26 28.5 28.5 29.6 28 23.6 23 22.8 24.8 26 25.1 26.7 2002 26.6 28.7 29.1 30 29.5 26.2 24.3 23.3 24.1 25.6 25.9 25.9 2003 27.2 28.9 29.7 30.3 30.8 26.5 22.6 22.6 23.7 25.1 25.6 26 2004 27.2 28.1 30 28.7 30 25.4 23.4 22.9 23.9 24.4 25.4 26.2 2005 26.4 30 29.7 29.8 29 27.3 22.4 23.3 24.2 24.4 25.3 26 Mean 26.7 28.7 29.4 29.2 28.5 25.4 22.5 22.5 24.1 24.6 25.2 25.9

79
TTAABBLLEE AA66:: MMOONNTTHHLLYY MMIINNIIMMUUMM TTEEMMPPEERRAATTUURREESS ((00CC)) FFOORR AADDEETT Jan Feb March April May June July Aug Sep Oct Nov Dec 1996 4.1 5.5 9.1 11 11.8 11.5 11.8 11.5 11.1 8.9 7.6 5.7 1997 3.7 5.1 10 10.2 11.8 11.1 11.6 11.7 10 10 9.1 5.5 1998 5 4.6 9.5 8.9 11.4 11.5 11.4 12.2 11.2 11 6.9 4.3 1999 5.4 6.5 4.8 7.3 9.2 10.9 11.9 11.9 10.2 10.6 6.4 6.2 2000 5.7 6.5 6.7 9.7 11 10.7 11.7 11.2 10.3 10.9 7.9 6.3 2001 4.4 7.5 10 10.7 11.4 11.9 12.5 12.6 10.7 11 7.9 6.8 2002 6.3 8.5 10 11 11.4 12.7 12.1 12.4 10.7 9.8 8.7 6.5 2003 6 9.5 12 11.6 13.4 12.8 12.9 13 11.4 10 8.3 6.6 2004 7.2 8.2 10.4 12.6 12.2 12.1 11.7 12.3 10.9 9.4 9.2 7.4 2005 6.1 8.8 10.8 13 11.6 11.6 11.9 12.3 11.9 11.1 7.7 4.7 Mean 5.39 7.07 9.33 10.6 11.52 11.68 11.95 12.11 10.84 10.27 7.97 6
TTAABBLLEESS AA44DD:: MMOONNTTHHLLYY MMEEAANN SSUUNNSSHHIINNEE DDUURRAATTIIOONN FFOORR BBAAHHIIRR DDAARR SSTTAATTIIOONN Jan Feb March April May June July Aug Sep Oct Nov Dec 1996 9.6 10.2 8.9 8.9 6.4 6.9 5.4 4.3 6.9 9.6 9 10 1997 9.1 10.2 8.4 8.3 7.9 6.2 5.2 5.3 8.1 7.9 9.1 10.1 1998 9.6 10.1 9 9.7 8.5 8.1 3.3 3.6 6.4 8.4 10.1 10.7 1999 9.6 10.7 10.4 9.7 8.5 7.1 4.7 5 6.5 7.4 10.4 10.1 2000 10.4 10.3 10.3 7.3 8.8 7.7 4.9 3.6 6.6 7.3 9.5 9.7 2001 10.3 9.8 7.9 9.5 8.5 5.3 4.2 3.9 7.3 8.3 9.6 9.9 2002 8.7 9.9 8.8 10.3 9.9 7.4 5.8 5 7 8.9 9.5 10.1 2003 10.3 9.3 8.8 9.8 8.5 6.5 3.8 3.5 5.5 9.5 9.6 10 2004 9.7 9.8 9.9 7.9 9.7 6.2 5.4 4.6 6.2 8.7 9 9.7 2005 9.3 10 8.8 8.6 8.7 7.1 3.8 5.1 6.7 8.6 9.5 10 Mean 9.66 10.03 9.12 9 8.54 6.85 4.65 4.39 6.72 8.46 9.53 10.03
80
TABLE A7: MONTHLY RELATIVE HUMIDITY FOR ADET STATION
Year Months
Jan Feb March April May June July Aug Sep Oct Nov Dec 1996 50.7 44.7 51.7 58 66.3 66 78.7 79.3 74.3 62 59.3 57 1997 47.3 43.7 55.3 51 64.3 71.7 80.3 78.7 69.7 69.3 63.3 54.7 1998 50 43 47.3 41.3 57 70 84.3 86.3 79 75 62.7 53.7 1999 62 49 47.5 47 62.5 68 84 79.5 75.5 76.5 59 59.5 2000 51.3 45.3 40.3 59.3 57.3 68.7 80 83.7 76 79 65.7 63.3 2001 58 55 50.3 50.3 63.3 79 83.3 84.3 75.7 74 68.7 63.3 2002 64 62.7 65 59.7 60.3 71.7 76.3 83.7 83 80 74.7 71 2003 64 61.3 60 53.3 52.7 79 89 90.7 88 80.3 76 71.3 2004 67.7 65.3 59.3 63.3 60.7 80.3 86.7 89.7 88 79.7 78 66.3 2005 45.3 32.7 42 38 42.7 64.1 64.3 79 77.3 71.4 62.3 48.2 Mean 56.03 50.27 51.87 52.12 58.71 71.85 80.69 83.49 78.65 74.72 66.97 60.83
TABLE A8: TEN YEARS (1996-2005) AVERAGE METEOROLOGICAL DATA FROM ADET STATION
Jan Feb March April May June July Aug Sep Oct Nov Dec
Rain Fall 7.25 2.55 25.75 51.37 100.2 153.46 308.81 254.92 179.68 115.55 33.37 5.54 Mean Temp 16.045 17.885 19.365 19.9 20.01 18.54 17.225 17.305 17.47 17.435 16.585 15.95 Mean Hum 56.03 50.27 51.87 52.12 58.71 71.85 80.69 83.49 78.65 74.72 66.97 60.83

81
TABLE A9: SUM OF FIVE DAYS RAINFALL DATA DURING RESEARCH TIME (2008) Date April May June July August Sep 1_5 4 47.6 38 9.8 56.5 30 6_10 28.2 33.6 21.6 51.2 35 12 11_15 112.9 13.8 19.9 51.4 34 43.5 16_20 0 9.7 35.2 75 40 12 21_25 10.4 2.3 14.1 69.1 35 16 26_31 12.8 36.4 13.9 55.1 52 33 Total 168.3 143.4 142.7 311.6 252.5 146.5
TABLE A10: RATE OF SOIL LOSS IN DIFFERENT CROP COVER TYPE AND COVER EFFECT
Month
Observation Date
RF/5 days
Rate of soil loss (t/ha) Crop coverage (%) maize wheat millet tef CC,
maize CC,
wheat CC,
millet CC, tef Ave
cc July
7/11/2008 51 4.89 0.94 6.86 7.31 26 3 10 0 9.8 51
7/18/2008 75 8.27 0.58 -1.44 6.8 36 10 25 1 18.0 7/22/2008 69 1.41 4.94 -1.95 4.17 40 25 30 5 21.5 7/29/2008 55 0.11 0.47 0.82 2.24 46 53 55 15 32.8
August
8/1/2008 57 -1.01 0.62 -0.46 2.39 50 55 55 17 38.5 35
8/12/2008 34 -3.03 -0.7 -3.83 -7.03 60 70 70 40 56.3 40 35
8/27/2008 52 -1.04 -0.74 -0.58 75 85 90 75 75.0
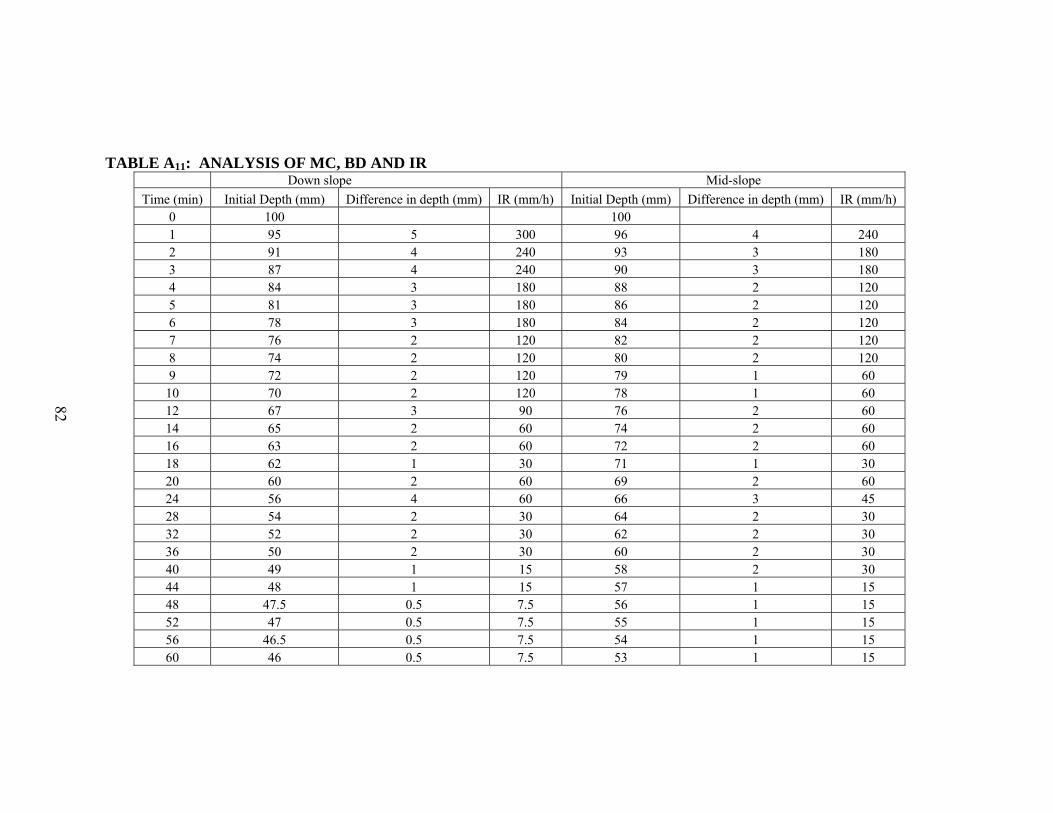
82
TABLE A11: ANALYSIS OF MC, BD AND IR Down slope Mid-slope Time (min) Initial Depth (mm) Difference in depth (mm) IR (mm/h) Initial Depth (mm) Difference in depth (mm) IR (mm/h)
0 100 100 1 95 5 300 96 4 240 2 91 4 240 93 3 180 3 87 4 240 90 3 180 4 84 3 180 88 2 120 5 81 3 180 86 2 120 6 78 3 180 84 2 120 7 76 2 120 82 2 120 8 74 2 120 80 2 120 9 72 2 120 79 1 60
10 70 2 120 78 1 60 12 67 3 90 76 2 60 14 65 2 60 74 2 60 16 63 2 60 72 2 60 18 62 1 30 71 1 30 20 60 2 60 69 2 60 24 56 4 60 66 3 45 28 54 2 30 64 2 30 32 52 2 30 62 2 30 36 50 2 30 60 2 30 40 49 1 15 58 2 30 44 48 1 15 57 1 15 48 47.5 0.5 7.5 56 1 15 52 47 0.5 7.5 55 1 15 56 46.5 0.5 7.5 54 1 15 60 46 0.5 7.5 53 1 15
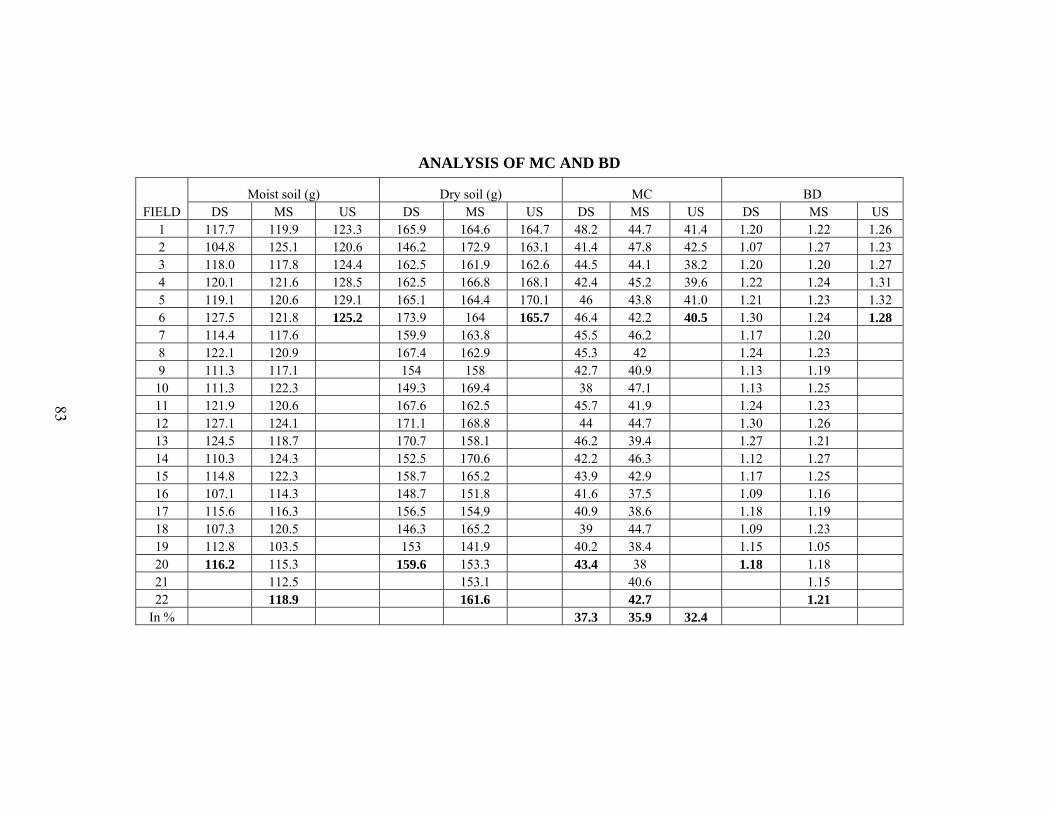
83
ANALYSIS OF MC AND BD
FIELD Moist soil (g) Dry soil (g) MC BD
DS MS US DS MS US DS MS US DS MS US 1 117.7 119.9 123.3 165.9 164.6 164.7 48.2 44.7 41.4 1.20 1.22 1.26 2 104.8 125.1 120.6 146.2 172.9 163.1 41.4 47.8 42.5 1.07 1.27 1.23 3 118.0 117.8 124.4 162.5 161.9 162.6 44.5 44.1 38.2 1.20 1.20 1.27 4 120.1 121.6 128.5 162.5 166.8 168.1 42.4 45.2 39.6 1.22 1.24 1.31 5 119.1 120.6 129.1 165.1 164.4 170.1 46 43.8 41.0 1.21 1.23 1.32 6 127.5 121.8 125.2 173.9 164 165.7 46.4 42.2 40.5 1.30 1.24 1.28 7 114.4 117.6 159.9 163.8 45.5 46.2 1.17 1.20 8 122.1 120.9 167.4 162.9 45.3 42 1.24 1.23 9 111.3 117.1 154 158 42.7 40.9 1.13 1.19
10 111.3 122.3 149.3 169.4 38 47.1 1.13 1.25 11 121.9 120.6 167.6 162.5 45.7 41.9 1.24 1.23 12 127.1 124.1 171.1 168.8 44 44.7 1.30 1.26 13 124.5 118.7 170.7 158.1 46.2 39.4 1.27 1.21 14 110.3 124.3 152.5 170.6 42.2 46.3 1.12 1.27 15 114.8 122.3 158.7 165.2 43.9 42.9 1.17 1.25 16 107.1 114.3 148.7 151.8 41.6 37.5 1.09 1.16 17 115.6 116.3 156.5 154.9 40.9 38.6 1.18 1.19 18 107.3 120.5 146.3 165.2 39 44.7 1.09 1.23 19 112.8 103.5 153 141.9 40.2 38.4 1.15 1.05 20 116.2 115.3 159.6 153.3 43.4 38 1.18 1.18 21 112.5 153.1 40.6 1.15 22 118.9 161.6 42.7 1.21
In % 37.3 35.9 32.4
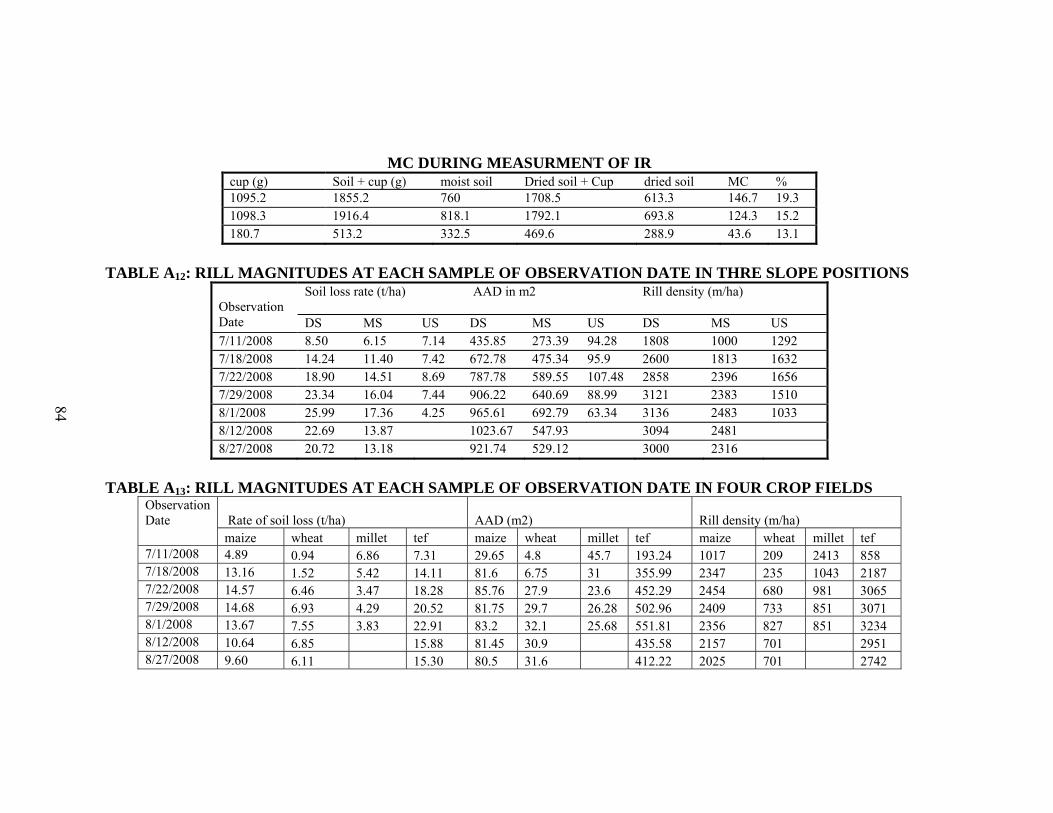
84
MC DURING MEASURMENT OF IR cup (g) Soil + cup (g) moist soil Dried soil + Cup dried soil MC % 1095.2 1855.2 760 1708.5 613.3 146.7 19.3 1098.3 1916.4 818.1 1792.1 693.8 124.3 15.2 180.7 513.2 332.5 469.6 288.9 43.6 13.1
TABLE A12: RILL MAGNITUDES AT EACH SAMPLE OF OBSERVATION DATE IN THRE SLOPE POSITIONS
Observation Date
Soil loss rate (t/ha)
AAD in m2 Rill density (m/ha)
DS MS US DS MS US DS MS US 7/11/2008 8.50 6.15 7.14 435.85 273.39 94.28 1808 1000 1292 7/18/2008 14.24 11.40 7.42 672.78 475.34 95.9 2600 1813 1632 7/22/2008 18.90 14.51 8.69 787.78 589.55 107.48 2858 2396 1656 7/29/2008 23.34 16.04 7.44 906.22 640.69 88.99 3121 2383 1510 8/1/2008 25.99 17.36 4.25 965.61 692.79 63.34 3136 2483 1033 8/12/2008 22.69 13.87 1023.67 547.93 3094 2481 8/27/2008 20.72 13.18 921.74 529.12 3000 2316
TABLE A13: RILL MAGNITUDES AT EACH SAMPLE OF OBSERVATION DATE IN FOUR CROP FIELDS
Observation Date Rate of soil loss (t/ha)
AAD (m2)
Rill density (m/ha)
maize wheat millet tef maize wheat millet tef maize wheat millet tef 7/11/2008 4.89 0.94 6.86 7.31 29.65 4.8 45.7 193.24 1017 209 2413 858 7/18/2008 13.16 1.52 5.42 14.11 81.6 6.75 31 355.99 2347 235 1043 2187 7/22/2008 14.57 6.46 3.47 18.28 85.76 27.9 23.6 452.29 2454 680 981 3065 7/29/2008 14.68 6.93 4.29 20.52 81.75 29.7 26.28 502.96 2409 733 851 3071 8/1/2008 13.67 7.55 3.83 22.91 83.2 32.1 25.68 551.81 2356 827 851 3234 8/12/2008 10.64 6.85 15.88 81.45 30.9 435.58 2157 701 2951 8/27/2008 9.60 6.11 15.30 80.5 31.6 412.22 2025 701 2742
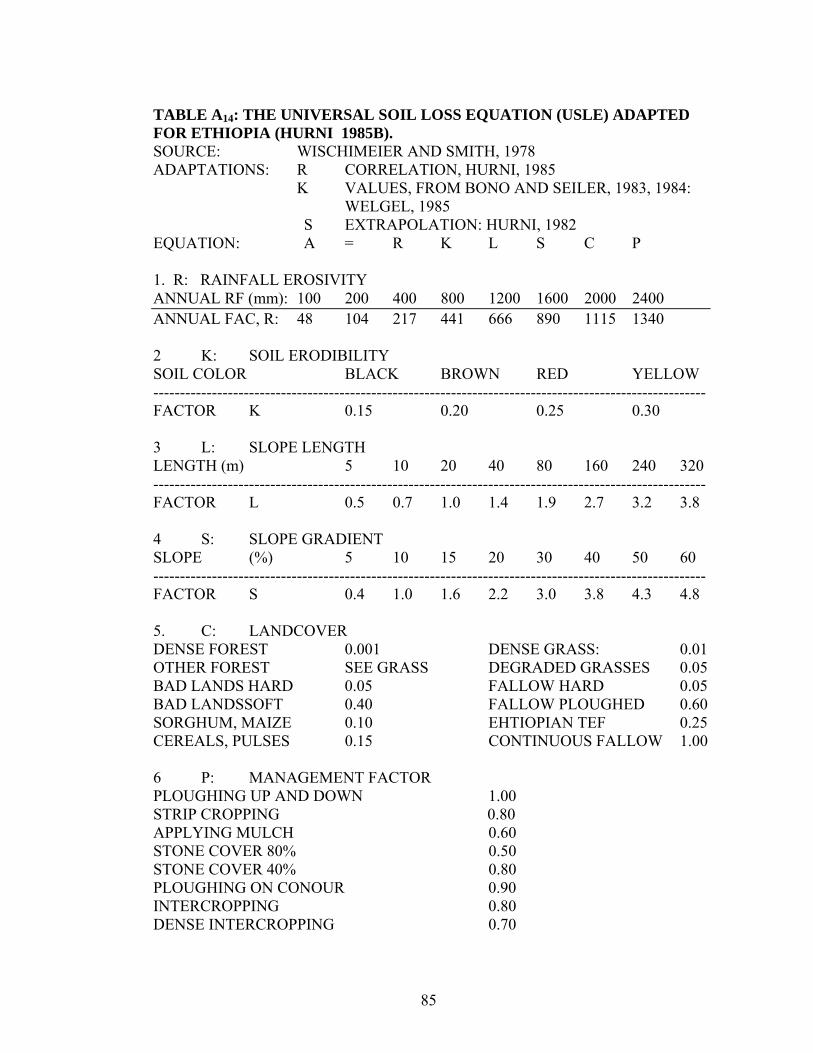
85
TABLE A14: THE UNIVERSAL SOIL LOSS EQUATION (USLE) ADAPTED FOR ETHIOPIA (HURNI 1985B). SOURCE: WISCHIMEIER AND SMITH, 1978 ADAPTATIONS: R CORRELATION, HURNI, 1985
K VALUES, FROM BONO AND SEILER, 1983, 1984: WELGEL, 1985
S EXTRAPOLATION: HURNI, 1982 EQUATION: A = R K L S C P 1. R: RAINFALL EROSIVITY ANNUAL RF (mm): 100 200 400 800 1200 1600 2000 2400 ANNUAL FAC, R: 48 104 217 441 666 890 1115 1340 2 K: SOIL ERODIBILITY SOIL COLOR BLACK BROWN RED YELLOW -------------------------------------------------------------------------------------------------------- FACTOR K 0.15 0.20 0.25 0.30 3 L: SLOPE LENGTH LENGTH (m) 5 10 20 40 80 160 240 320 -------------------------------------------------------------------------------------------------------- FACTOR L 0.5 0.7 1.0 1.4 1.9 2.7 3.2 3.8 4 S: SLOPE GRADIENT SLOPE (%) 5 10 15 20 30 40 50 60 -------------------------------------------------------------------------------------------------------- FACTOR S 0.4 1.0 1.6 2.2 3.0 3.8 4.3 4.8 5. C: LANDCOVER DENSE FOREST 0.001 DENSE GRASS: 0.01 OTHER FOREST SEE GRASS DEGRADED GRASSES 0.05 BAD LANDS HARD 0.05 FALLOW HARD 0.05 BAD LANDSSOFT 0.40 FALLOW PLOUGHED 0.60 SORGHUM, MAIZE 0.10 EHTIOPIAN TEF 0.25 CEREALS, PULSES 0.15 CONTINUOUS FALLOW 1.00 6 P: MANAGEMENT FACTOR PLOUGHING UP AND DOWN 1.00 STRIP CROPPING 0.80 APPLYING MULCH 0.60 STONE COVER 80% 0.50 STONE COVER 40% 0.80 PLOUGHING ON CONOUR 0.90 INTERCROPPING 0.80 DENSE INTERCROPPING 0.70

86
Source: Ministry of Agriculture Watershed Management guide page 51, January, 2001
Figure A1: The R-squared value (R2) between measured and predicted value of soil loss
y = 0.6748x + 16.851R2 = 0.5213
0.0
10.0
20.0
30.0
40.0
50.0
60.0
70.0
80.0
0.0 10.0 20.0 30.0 40.0 50.0 60.0 70.0 80.0 90.0
Measured value (t/ha)
Pred
icte
d va
lue
(t/h
a)

87
APPENDIX B: QUESTIONNAIRE Debre-Mewi Micro watershed, Amharic Regional State, Ethiopia, 2008 This questionnaire has been prepared to generate information on the extent of the farmers’ attitudes, acceptance and adoption of the introduced SWC technologies. Their awareness and perception of erosion processes, hazards and Factors that constraint their land conservation decision making processes. The approach followed in the planning and implementation of the technologies. Name of the household’s head--------------------------------------- Sex -------- age----- Part one Open ended questions 1 House hold characteristics, and access to resources
HH member Education Age Dependant I ------------------- ------------ --------- ------------- II ------------------- ------------ --------- ------------- III ------------------- ------------ --------- ------------- IV ------------------- ------------ --------- ------------- Farm size (ha) ------------ Livestock owned: Cow ------- Ox------ Donkey ----- Goat ----- Sheep ----, others------ 1 What are the major crops you have been using to your farmland?
-----------------------------------------------------------------------------------------------2 Is there a major change in cropping pattern during the last 15 years --------------
If yes what are the reasons -----------------------------------------------------------------------------------------------------------------------------------------------------------------------------------------------------------------------------------------------------------------------------------------------------------------------------------------------------------------------------------------------
3 How does change in cropping pattern affect soil erosion? -------------------------------------------------------------------------------------------------------------------------------------------------------------------------------------------------------------------------------------------------------------------------------------------------------------------------------------------------------------------------------------------------------------------------------------------------------------------
4 Do you have a problem of erosion in your farm? ----------- 5 How do you know soil erosion occurs on your farm land? (Indicators) ----------
-----------------------------------------------------------------------------------------------------------------------------------------------------------------------------------------------------------------------------------------------------------------------------------------------------------------------------
6 What are the noticeable changes in your farm land over time in: i Soil fertility / crop productivity / fertilizer response ----------------------------
-----------------------------------------------------------------------------------------------

88
-----------------------------------------------------------------------------------------------------------------------
ii Intensity of rill erosion -------------------------------------------------------------------------------------------------------------------------------------------------------------------------------------------------------------------------------------------------------------------------------------
iii soil depth/surface stoniness ---------------------------------------------------------------------------------------------------------------------------------------------------------------------------------------------------
iv runoff generation /infiltration/ water holding capacity -------------------------------------------------------------------------------------------------------------------------------------------------------------------------------------------------------------------------------------------------
7 From where dose the major runoff that cause soil erosion in your farm comes from? -----------------------------------------------------------------------------------------------------------------------------------------------------------------------------------------------------------------------------------------------------------------------------------------------------------------------
8 Have you ever discussed the issue with your fellow farmer and draw potential solutions? ---------------------- If yes, what were problems to materialize the potential solutions? -------------------------------------------------------------------------------------------------------------------------------------------------------------------------------------------------------------------------------------------------------
9 How do you protect your farmland from erosion? (List all methods you are applying) -----------------------------------------------------------------------------------------------------------------------------------------------------------------------------------------------------------------------------------------------------------------------------------------------------------------------------------------------------
10 Are methods you applying effective? ------------------------- 11 How do you measure the effectiveness of SWC measure? -------------------------
---------------------------------------------------------------------------------------------------------------------------------------------------------------------------------------------------------------------------------------------------------------------------------------
12 Do you know about SWC technologies? ---------------------- 13 Have you ever participated in SWC technology demonstration, field days or
workshops before? ---------- 14 Do you have information on use of different SWC practices / technologies? ----
-----------------If yes, state the advantages and disadvantages. Advantages ----------------------------------------------------------------------------------------------------------------------------------------------------------------------------------------------------------------------------------------------------------------------------------------------------------------------------------------------------------------------- Disadvantages ----------------------------------------------------------------------------------------------------------------------------------------------------------------------------

89
-----------------------------------------------------------------------------------------------------------------------------------------------------------------------------------------
15 Do you apply SWC on your whole farm? ---------- If no, how do you select a farm plot for SWC treatment? --------------------------------------------------------------------------------------------------------------------------------------------------------------------------------------------------------------------------------------------------------Years used in this way-------------------------------------------------------------------
16 In your opinion, what should be done to improve the effectiveness of SWC measure? --------------------------------------------------------------------------------------------------------------------------------------------------------------------------------------------------------------------------------------------------------------------------------------------------------------------------------------------------------------------------------
17 Do you apply fertilizer to your farmland? ------------------------ If yes, since
when? -----------------------------------------------------------------------------------------------------------
18 What level of yield advantage you would expect from fertilizer addition? Without fertilizer = -----------------With fertilizer = ----------------------------- yield addition in% =---------------------------------------------------------------------------------------------------------------------------------------------------------------------
19 Do you expect the yield advantage would remain the same amount with the same quantity of fertilizer of the next 5 years? -------------------, 10 years? ------
What was the trend over the past: 5 years? --------------------------------------------------------- 10 years? ------------------------------------------------------- 15 years? -------------------------------------------------------- 20 Have you applied the same amount and type of fertilizer since you start
applying fertilizer to your farmland (crop)? --------------------------------------- Part two Closed questions Farmers’ perceptions of soil erosion hazards in the watershed 1 Is soil erosion a problem in your farm? A/ yes B/ no 2 If yes, what is the severity of the problem A/ sever B/ moderate C/minor 3 Under what conditions do you say erosion is severe? A/ sheet B/ rill C/ gully 4 How do you compare the soil loss due to rill with other erosion features? A/
highest B/ medium C/low 4 You believe that the rate of erosion over time is, A/ increasing B/ same
C/decreasi 5 Observed change in soil erosion severity over the past 10 years: A/ large B/
moderate C/ no change 6 What do you believe is the impact of soil erosion on crop yields? A/ large
decrease B/ moderate decrease C/ no change D/ moderate increase E/ large increase
7 Do you believe that soil erosion can be controlled A / yes B/ no

90
For 8-10 choose those you agree with 8/ The main causes of soil erosion on your farm
9/ The main causes for declining of soil fertility on your farm
10/ The main causes of productivity decline on your farm
A/ lack of conservation structures B/ steep land without conservation structures C/ damaged conservation structures D/ lack of diversion ditch E/ the land is under steep ridges F/ others-----------------------------------------------------------------------------
A/ repeated cultivation B/ lack of manure C/ soil erosion D/ lack of fertilizer E/ others --------------------------------------------------------------------------------------------------------------------
A/ rain fall shortage B / fertility decline C/continuos cultivation D/ soil erosion E/ others -------------------------------------------------------------------------------------------------------------------------------
11 Indicators of farmers’ acceptance and adoption of the SWC technologies in
the watershed acceptance and adoption Answer
Yes No11.1 Indicators of acceptance Did you know the introduced SWC technologies before? Are the newly introduced SWC technologies effective in arresting soil erosion?
Do you believe that the new SWC technologies have the potential to improve land productivity?
11.2. Indicators of adoption Do you have plan/intention to maintain the constructed structures? Do you have plan/intention to implement the new technologies in the rest of your plots currently untreated?
Do you believe that SWC is farmers’ responsibility? Should farmers be paid for constructing and maintaining SWC in their farms?
12 What are the major limitations to apply SWC measures on your farm land? A/ The new technologies require too much labor to implement B/ Land tenure insecurity C/ Decrease the size of crop land D/ The new technologies harbor mole rats E/ Lack knowledge F/ Not considering erosion as a major problem G/Others -----------------------------------------------------------------------------------
13 What are the major determinant factors to adopt SWC measures? A/ Farm experience (age) B/farm size C/ plot size D/ severity of soil erosion E/ Others ---------------------------------------------------------------------------------------------------------------------------------------------