Embed Size (px)
Citation preview

ASSESSMENT OF TRADE FACILITATION AND COMPETITIVENESS OF CAMEROON’S COFFEE SECTOR: IMPLICATIONS FOR TRADE LIBERALISATION
Ernest L. Molua1
1. Introduction Changes in the agriculture and food sectors over the last ten years have been heavily influenced not only by world economic events but by both the global trade policy and domestic economic reforms. These have had serious impacts on African economies and on the response of the agricultural sector for agrarian economies such as Cameroon. Cameroon is a small developing country whose economy depends heavily on agricultural export commodities, the most important being coffee (Tambi, 1999; Nchare, 2007; World Bank, 2008). Coffee is a typical global good with a highly competitive market. In Cameroon, coffee revenue accounts for some 20% of total export earnings, 10% of agricultural GDP, and 2% of national GDP. However, sustained fluctuations in export earnings have raised concern on the country’s earnings, growth prospects and debt servicing. Like most Sub-Saharan African economies (see McKay et al. 1999; and Milner and Morrissey, 1999), Cameroon’s markets have suffered from inefficiencies in domestic production and trading systems, stemming from inappropriate government policies that inhibit competition and the exploitation of economies of scale. Following its independence in 1960, Cameroon followed an interventionist approach to development (Tambi, 1984). Prices, as well as the rate of exchange and the interest rate, were regulated, quantitative restrictions were imposed on trade, and private-sector activity was controlled. Government was directly involved in the provision of services such as marketing and in some cases were also producers, e.g. banana and oil palm cultivation. The Cameroon National Produce Marketing Board (NPMB) was created to overcome market disruption and price instability. Farmers were guaranteed outlets for their crops and given the opportunity to participate in the cash economy, with everyone being paid the same price for the same product irrespective of their location. Hostility to the private sector and adopted single-channel marketing made it easier for the government to collect export taxes. Given the then structure of the economy, macroeconomic imbalances ensued in the late 1980s and these negatively impacted on demand management, exchange rate, external financing and aggregate output levels. In the early 1990s Cameroon embarked on structural adjustment measures with the purpose of stimulating economic recovery, on the assumption that macroeconomic stability will enshrine economic stability, brought on by reduced internal budget deficits. Since 2000, GDP has grown on average by about 4% a year. The new optimism on the state of Cameroon’s economy is founded on the improved public finances. In 2004, receipts of US$ 2.5 billion accrued over expenses of US$ 2.3 billion. Despite the cautious optimism that Cameroon is emerging from its long period of economic hardship, the country still has a precarious trade balance with key trading partners such as Spain (recipient of 16% of Cameroon’s exports), Italy (14%), France (10%), UK (10%), USA (11%) and Netherlands (6%). Export revenue of US$2.5 billion was realised in 2005, from an export basket that comprised principally: crude oil and petroleum products, lumber, cocoa beans, aluminium, coffee and cotton. Agriculture remains the backbone of the economy, with an average share in GDP and in total exports approximating 25% and 60%, respectively. Given the foregoing review, some research questions that need to be answered include; does liberalisation facilitate trade? Is competitiveness of coffee trade affected by transport costs? The goal of this paper is to examine the significance of liberalisation in facilitating Cameroon’s coffee trade. Specifically, the paper examines whether changes in coffee export prices, foreign exchange rate and transportation costs affect the volume of coffee exported from Cameroon. Reliable estimates of the determinants of coffee export
1 Department of Economics and Management, University of Buea, Cameroon, E-mail: [email protected] / [email protected]

earnings are essential for policy decisions to foster better living conditions of farm families and general welfare of the economy. This hinges on the premise that steps taken by Cameroon to lower trade barriers, including removing obstacles to trade, is critical to expanding product supply and trade. The removal of non-tariff barriers and lower trade costs are increasingly recognized as key factors that affect economic progress. Trade costs, which include international transportation costs, transaction costs, and distribution costs in countries of origin, destination, and transit, are an important barrier to trade. These costs can be more significant than tariffs and other trade policy barriers. Even in rich countries with regional trade arrangements where formal trade barriers are almost fully eliminated, trade costs still remain as strong barriers to exports and imports. In the next four sections of the paper, we review the coffee sector in Cameroon, the extent of trade liberalisation, the nature of trade facilitation and the impact of competitiveness on coffee export values. 2. Cameroon Coffee Sector Cameroon boasts of advantageous natural conditions to produce export crops, amongst the staple market commodities of coffee, cocoa, rubber and palm oil. Coffee is grown in diverse agroecologies, making Cameroon an important player in global coffee production and trade. Cameroon’s extensive volcanic soil, high altitude and bimodal rainfall promote the cultivation of Robusta coffee in all agroecologies except in the dry sahelian northern part of the country. Arabica coffee is mainly produced in the high altitudes of the savannah grassland of the west and northwest provinces. Production technology is simple and labour intensive, with berries harvested by hand. The farm plots are small, averaging about 5 hectares, with drying principally in the sun. Coffee features prominently in farm enterprise mix, as shade trees for food crops in agroforestry plantations. In 1961 total coffee production was 43000 metric tones rising steadily to more than 100,000 metric tonnes in 1974. Despite vagaries in weather in the 1982/83 season, 1984 witnessed the highest levels of production (138,000 metric tones). As shown in figure 1, declines then ensued from 1987, dropping to about 41,000 metric tonnes in 2002. Today, coffee production levels average 50,000 metric tonnes. A plethora of factors account for variations in coffee production, these may include environmental constraints, production and marketing infrastructure, the agricultural policy environment, amongst others.
0
20000
40000
60000
80000
100000
120000
140000
160000
1961
1963
1965
1967
1969
1971
1973
1975
1977
1979
1981
1983
1985
1987
1989
1991
1993
1995
1997
1999
2001
2003
2005
2007
Prod
uctio
n (to
nnes
)
Fig. 1: Coffee Production in Cameroon, 1961 – 2007(Data Source: FAOSTAT)
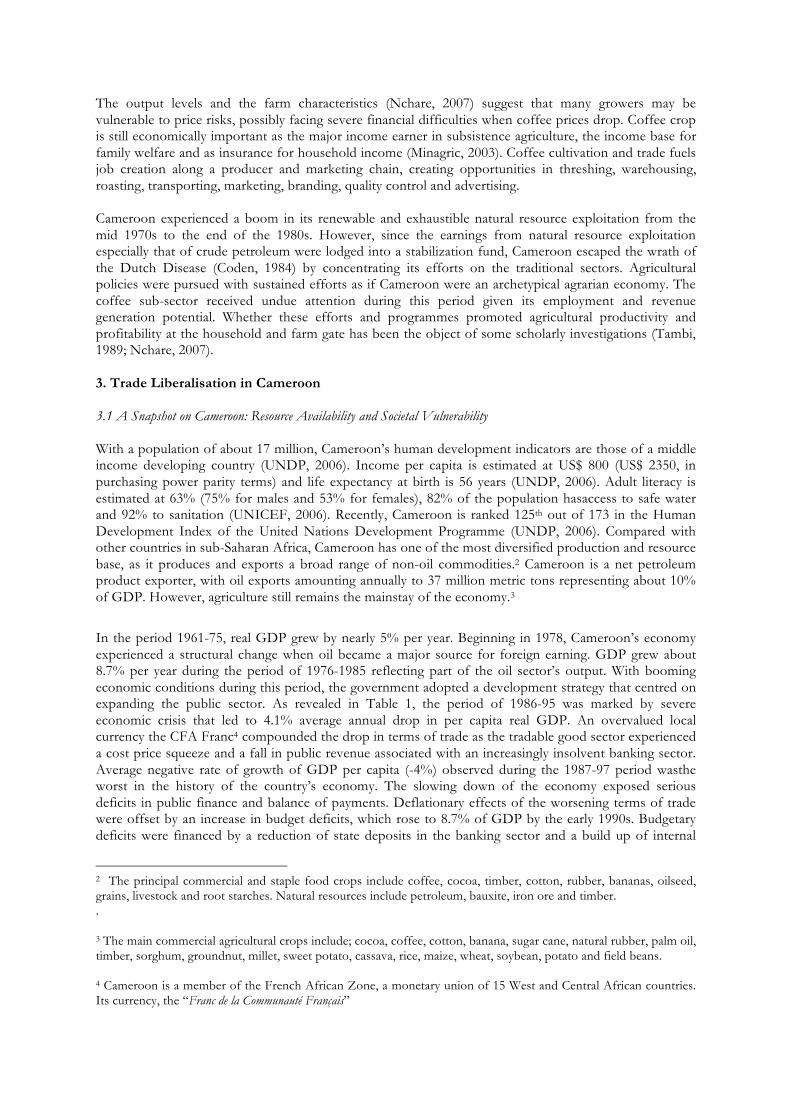
The output levels and the farm characteristics (Nchare, 2007) suggest that many growers may be vulnerable to price risks, possibly facing severe financial difficulties when coffee prices drop. Coffee crop is still economically important as the major income earner in subsistence agriculture, the income base for family welfare and as insurance for household income (Minagric, 2003). Coffee cultivation and trade fuels job creation along a producer and marketing chain, creating opportunities in threshing, warehousing, roasting, transporting, marketing, branding, quality control and advertising. Cameroon experienced a boom in its renewable and exhaustible natural resource exploitation from the mid 1970s to the end of the 1980s. However, since the earnings from natural resource exploitation especially that of crude petroleum were lodged into a stabilization fund, Cameroon escaped the wrath of the Dutch Disease (Coden, 1984) by concentrating its efforts on the traditional sectors. Agricultural policies were pursued with sustained efforts as if Cameroon were an archetypical agrarian economy. The coffee sub-sector received undue attention during this period given its employment and revenue generation potential. Whether these efforts and programmes promoted agricultural productivity and profitability at the household and farm gate has been the object of some scholarly investigations (Tambi, 1989; Nchare, 2007). 3. Trade Liberalisation in Cameroon 3.1 A Snapshot on Cameroon: Resource Availability and Societal Vulnerability With a population of about 17 million, Cameroon’s human development indicators are those of a middle income developing country (UNDP, 2006). Income per capita is estimated at US$ 800 (US$ 2350, in purchasing power parity terms) and life expectancy at birth is 56 years (UNDP, 2006). Adult literacy is estimated at 63% (75% for males and 53% for females), 82% of the population hasaccess to safe water and 92% to sanitation (UNICEF, 2006). Recently, Cameroon is ranked 125th out of 173 in the Human Development Index of the United Nations Development Programme (UNDP, 2006). Compared with other countries in sub-Saharan Africa, Cameroon has one of the most diversified production and resource base, as it produces and exports a broad range of non-oil commodities.2 Cameroon is a net petroleum product exporter, with oil exports amounting annually to 37 million metric tons representing about 10% of GDP. However, agriculture still remains the mainstay of the economy.3
In the period 1961-75, real GDP grew by nearly 5% per year. Beginning in 1978, Cameroon’s economy experienced a structural change when oil became a major source for foreign earning. GDP grew about 8.7% per year during the period of 1976-1985 reflecting part of the oil sector’s output. With booming economic conditions during this period, the government adopted a development strategy that centred on expanding the public sector. As revealed in Table 1, the period of 1986-95 was marked by severe economic crisis that led to 4.1% average annual drop in per capita real GDP. An overvalued local currency the CFA Franc4 compounded the drop in terms of trade as the tradable good sector experienced a cost price squeeze and a fall in public revenue associated with an increasingly insolvent banking sector. Average negative rate of growth of GDP per capita (-4%) observed during the 1987-97 period wasthe worst in the history of the country’s economy. The slowing down of the economy exposed serious deficits in public finance and balance of payments. Deflationary effects of the worsening terms of trade were offset by an increase in budget deficits, which rose to 8.7% of GDP by the early 1990s. Budgetary deficits were financed by a reduction of state deposits in the banking sector and a build up of internal
2 The principal commercial and staple food crops include coffee, cocoa, timber, cotton, rubber, bananas, oilseed, grains, livestock and root starches. Natural resources include petroleum, bauxite, iron ore and timber. . 3 The main commercial agricultural crops include; cocoa, coffee, cotton, banana, sugar cane, natural rubber, palm oil, timber, sorghum, groundnut, millet, sweet potato, cassava, rice, maize, wheat, soybean, potato and field beans. 4 Cameroon is a member of the French African Zone, a monetary union of 15 West and Central African countries. Its currency, the “Franc de la Communauté Français”
arrears of payment. The balance of payments deficit was funded by an increase in foreign debts and repatriation of external bank assets (Tchoungi et al., 1996). In addition, the sustained weakness of the primary commodity markets and its attendant consequence for public revenue impeded attempts to halt the downward slide of the country’s economic and financial stand. This, no doubt, led to an accumulation of public and private sector debts.5 In line with recommendations and support from the Bretton Woods institutions [International Monetary Fund (IMF) and the World Bank] the government embarked on a series of measures embodied in an Economic Reform Programme (ERP), designed to spur business investment, increase efficiency in agriculture, re-capitalise the nation’s banks and jump-start the economy.
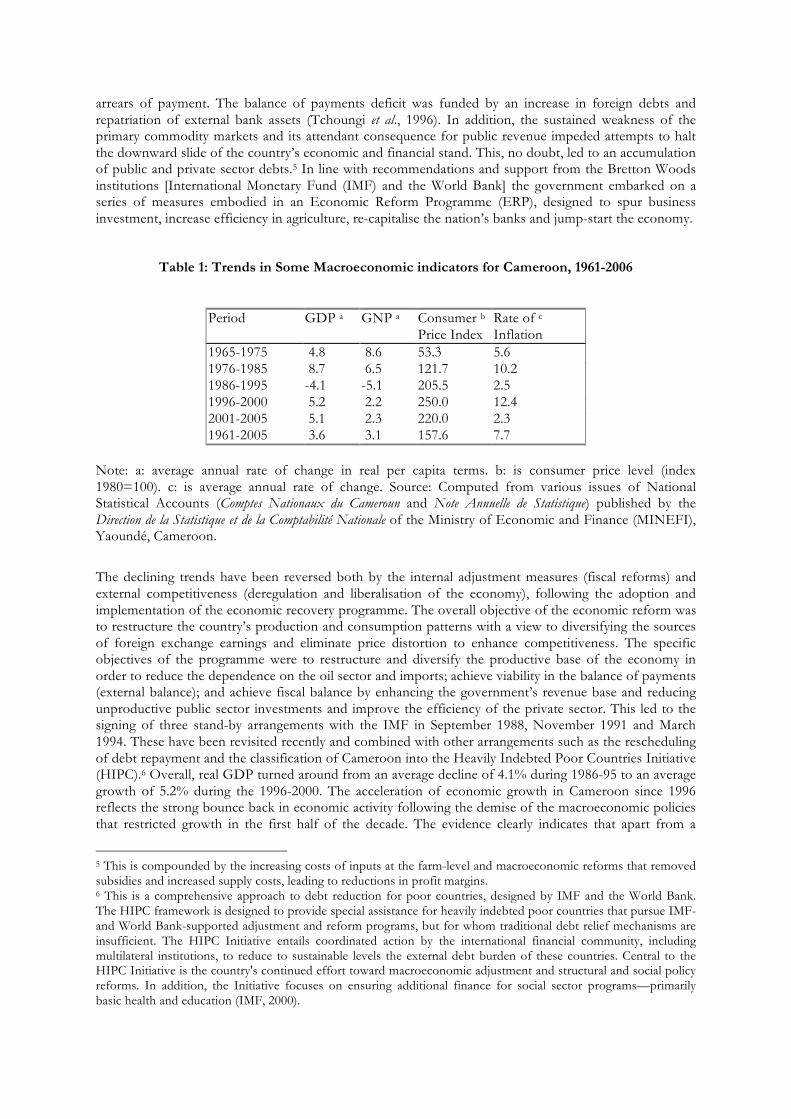
Table 1: Trends in Some Macroeconomic indicators for Cameroon, 1961-2006
Period GDP a GNP a Consumer b Price Index
Rate of c Inflation
1965-1975 4.8 8.6 53.3 5.6 1976-1985 8.7 6.5 121.7 10.2 1986-1995 -4.1 -5.1 205.5 2.5 1996-2000 5.2 2.2 250.0 12.4 2001-2005 5.1 2.3 220.0 2.3 1961-2005 3.6 3.1 157.6 7.7
Note: a: average annual rate of change in real per capita terms. b: is consumer price level (index 1980=100). c: is average annual rate of change. Source: Computed from various issues of National Statistical Accounts (Comptes Nationaux du Cameroun and Note Annuelle de Statistique) published by the Direction de la Statistique et de la Comptabilité Nationale of the Ministry of Economic and Finance (MINEFI), Yaoundé, Cameroon.
The declining trends have been reversed both by the internal adjustment measures (fiscal reforms) and external competitiveness (deregulation and liberalisation of the economy), following the adoption and implementation of the economic recovery programme. The overall objective of the economic reform was to restructure the country’s production and consumption patterns with a view to diversifying the sources of foreign exchange earnings and eliminate price distortion to enhance competitiveness. The specific objectives of the programme were to restructure and diversify the productive base of the economy in order to reduce the dependence on the oil sector and imports; achieve viability in the balance of payments (external balance); and achieve fiscal balance by enhancing the government’s revenue base and reducing unproductive public sector investments and improve the efficiency of the private sector. This led to the signing of three stand-by arrangements with the IMF in September 1988, November 1991 and March 1994. These have been revisited recently and combined with other arrangements such as the rescheduling of debt repayment and the classification of Cameroon into the Heavily Indebted Poor Countries Initiative (HIPC).6 Overall, real GDP turned around from an average decline of 4.1% during 1986-95 to an average growth of 5.2% during the 1996-2000. The acceleration of economic growth in Cameroon since 1996 reflects the strong bounce back in economic activity following the demise of the macroeconomic policies that restricted growth in the first half of the decade. The evidence clearly indicates that apart from a
5 This is compounded by the increasing costs of inputs at the farm-level and macroeconomic reforms that removed subsidies and increased supply costs, leading to reductions in profit margins. 6 This is a comprehensive approach to debt reduction for poor countries, designed by IMF and the World Bank. The HIPC framework is designed to provide special assistance for heavily indebted poor countries that pursue IMF- and World Bank-supported adjustment and reform programs, but for whom traditional debt relief mechanisms are insufficient. The HIPC Initiative entails coordinated action by the international financial community, including multilateral institutions, to reduce to sustainable levels the external debt burden of these countries. Central to the HIPC Initiative is the country's continued effort toward macroeconomic adjustment and structural and social policy reforms. In addition, the Initiative focuses on ensuring additional finance for social sector programs—primarily basic health and education (IMF, 2000).

noticeable decline in the 1986-95 period, economic progress as measured by real GNP per capita has been growing marginally over the past 40 years. Since 1996, real GNP growth has rebounded in Cameroon, advancing at about 2.3% per year.
3.2 Agricultural Sector Liberalisation and Coffee Trade More than two decades of steady growth ensued in Cameroon until 1987. Since the mid 1970s, petroleum production complemented the expansion in agricultural production and exports. As a result, Cameroon recorded average real growth rates on the order of 7 percent over a period of about ten years (World Bank, 2000). In 1970 export revenue of US$ 50 million accrued to the coffee sub-sector. This increased steadily to US$ 30 million in 1970 (Figure 2). As shown in the figure, since 1987 coffee export values have declined from US$ 34 million to about US$ 6 million at par with the mid 1970 levels (see Figure 3). In the beginning of 1986, export revenues from both petroleum and agricultural commodities declined dramatically by approximately 8% of GDP. The deterioration in economic activity accelerated as a result of the continued decline in the price of the principal exports (petroleum, coffee, cocoa, and cotton). Growth rates of exports turned negative between 1985 and 1988, as the terms of trade deteriorated by half. There was a 40% fall in per capita consumption between 1986 and 1993, and the external debt stock rose, from under one-third, to more than three-quarters of GDP between 1985 and 1993 (World Bank, 2000). Investment declined from 27% of GDP to less than 11% of GDP. To deal with the pronounced deterioration in public finances, marked by unmanageable cash flow pressures, drastic cuts in civil service wages were introduced. The social situation deteriorated sharply by 1995. The restructuring of the public and semi-public enterprise sectors, involving the closing of certain establishments, a civil service hiring freeze, and other labor-shedding measures, led to a significant rise in unemployment. These effects highlight that Cameroon was not immune to the global market downturn observed in Hazell et al. (1990). To restructure the agriculture sector, State subsidies for principal crops such as coffee and cocoa were eliminated. The provision of fertilizers and insecticides to farmers, and the State regulation of coffee trade, its marketing structure, quality control and pricing were halted (see Box 1). The marketing of cocoa, coffee and other export crops was liberalized, and the National Produce Marketing Board (NPMB) restructured into a National Cocoa and Coffee Board (NCCB), with reduced mandate to facilitate production and marketing of cocoa and coffee (Tchoungi et al., 1996). For the last 20 years, following the withdrawal of government subsidies in 1990, the liberalisation of the coffee trade and the devaluation of the CFA franc have combined to force small farmers to integrate their coffee into traditional family farms, leading to a less intensive and more casual production of coffee (Gilbert et al., 1999). Together with the decline of the coffee price, forced many coffee farmers to abandon or diversify their farms (see Benhin and Barbier, 1999). A combination of endogenous and exogenous factors explains the performance of the sub-sector.
y = 21657x0.5223
0
50000
100000
150000
200000
250000
300000
350000
400000
1961
1964
1967
1970
1973
1976
1979
1982
1985
1988
1991
1994
1997
2000
2003
Expo
rt Va
lue
(000
US$
)
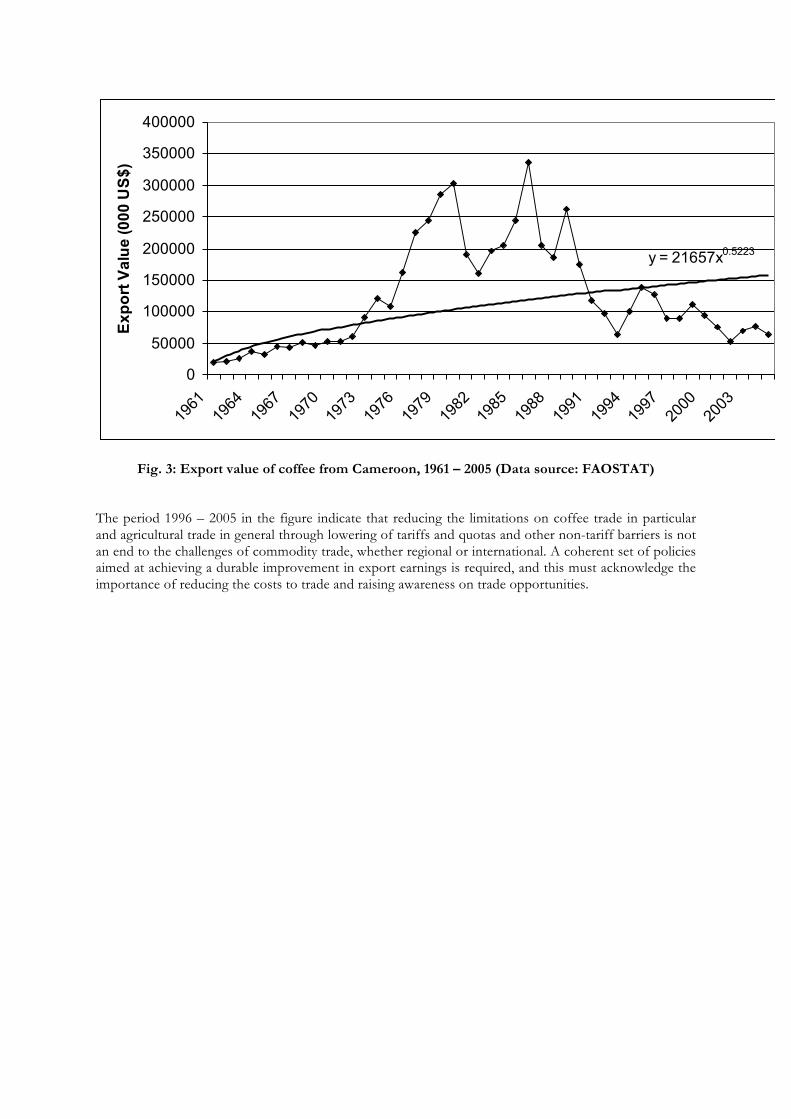
Fig. 3: Export value of coffee from Cameroon, 1961 – 2005 (Data source: FAOSTAT) The period 1996 – 2005 in the figure indicate that reducing the limitations on coffee trade in particular and agricultural trade in general through lowering of tariffs and quotas and other non-tariff barriers is not an end to the challenges of commodity trade, whether regional or international. A coherent set of policies aimed at achieving a durable improvement in export earnings is required, and this must acknowledge the importance of reducing the costs to trade and raising awareness on trade opportunities.

4. Transport Infrastructure, Cost and Trade Facilitation in Cameroon It could be possible that despite the deregulation of coffee marketing and agricultural trade, export earnings never regained their peak levels because of the absence of factors that motivate supply response. There is an inherent relationship between export supply and factors that facilitate trade. International trade holds promise as an important engine for private sector development and reduction in poverty, particularly for small and medium-sized firms in developing countries. However, the extent of trade facilitation determines the ability of firms to deliver goods and services on time, at lowest possible costs to the world economy (Limao and Venables, 2000). Once formal trade barriers come down following liberalisation, other trade issues therefore become more important, with producers and marketers seeking to acquire information on other countries’ importing and exporting regulations and how customs procedures are handled. Cutting red-tape at the point where goods enter a country and providing easier access to this kind of information are possible ways of facilitating trade (Helbe et al., 2007; Balat and Porto, 2008). Transport infrastructure in Cameroon includes an extensive network of roads, limited railway infrastructure, three functioning international airports, underutilized domestic air-routes, tough inland waterways, over-utilized coastal shipping facilities at the Douala ‘shallow’ Seaport, undeveloped Limbe and Kribi ‘deep’ seaports, underutilized river ports and oil pipelines running from north to south of the country. However, coffee transportation from farms to marketing centers and international border is predominantly by road, and then shipped out to international markets from the Douala seaport. The road infrastructure is of paramount importance as it carries the bulk of Cameroon’s produce. These include both rural earth roads and urban bituminized roads. The responsibility for road development is shared

between the national government and local municipal authorities. Only 4000 kilometers of the 34,000 kilometers of road network is tarred, mostly urban road. This means that rural areas are more difficult to reach, while mountainous terrain and annual torrential rains seriously degrade the road system in many areas. Given the long distances, difficult terrain, and climatic conditions, transportation thus faces enormous challenges whether it is rural or urban road. A difficult topography makes the cost of construction or rehabilitation officially generally high. The nature of the soils, poor drainage conditions, the heavy rainfall in the southern humid forest zone where the Air and Sea ports are located, make it difficult and expensive to maintain road and rail transport facilities. This implies coffee products are abandoned in some hinterlands and some proportion only reach export terminals after the value has been affected due to long delays chiefly by inadequate road facility. The rising cost of fuel add to the challenges faced by both producers and marketers. Trade facilitation is therefore now at the forefront of recent trade policy dialogue as developing countries look for ways to bolster their economic growth through increased trade performance (Wilson et al., 2004). This includes the transparency of trade policy and regulation, as well as product standards, infrastructure to support trade, and technology as it applies to lowering trade costs (Negri and Porto, 2008). Trade facilitation therefore include the improvement of transport infrastructure, the removal of government corruption, the modernization of customs administration, the removal of other non-tariff trade barriers, export marketing and promotion as well as improving the wider environment in which trade transactions take place.7 Lowering trade-related transaction costs is expected to result in significant improvement in Cameroon’s ability to compete effectively in the global economy. Further range of benefits to be realised include: improved revenue collection, improved border controls and security, lower administrative costs, encouragement of more trade and investment, and enhancement of the competitiveness of the domestic business in the home market as well as in the export market. According to Portugal-Perez and Wilson (2008), “the high costs of trade, i.e. transporting goods and getting them across borders, are a major obstacle to African trade performance. High trade costs have a negative effect on economies enduring them, making producers less competitive as imported inputs are relatively more expensive and the cost of final goods is relatively higher. Although direct evidence on border costs shows that tariff barriers are relatively low across all countries, poor infrastructure and weak institutions contribute in a larger extent to high trade costs along the logistic chain in Sub-Saharan African countries.” Limao and Venables (2001) identify poor infrastructure as significant deterrents to trade expansion. Transportation accounts for significant costs of delivery and distribution and rise in distance, as each kilometer traveled requires fuel, man-labour and capital expense. Cameroon has a challenging terrain for new road construction or rehabilitation of existing road infrastructure. In this guise, Amjadi and Yeats (1995) observe that transport costs represent a more important obstacle in Africa than import tariffs and trade restrictions. This is corroborated in Buys et al (2006) who assert that if transport infrastructure is improved then intra-African trade as a whole can be expected to increase from 10 billion to about 30 billion USD per year, while initial investments and annual maintenance costs would be relatively moderate, and significantly increase the volume of trade by 7.93%. 5. Impact of Trade Facilitation on Coffee Supply and Competitiveness 5.1. Analytical Model T o ascertain the effect of trade facilitation and competitiveness on coffee trade, we employ an econometric framework in which indicators and variables are tested on the level of significance on which they influence coffee exports from Cameroon. The general form of the coffee export supply is specified in the log-log form as: (1)
itttttattiteit
ditt EXGPPTRERGDPVGTPRPPQS µβββββββββα ++++++++++= 9876543210 lnlnlnlnlnlnlnln
7 This relates to transparency and professionalism in customs and regulatory environments, as well as harmonization of standards and conformance to international or regional regulation.
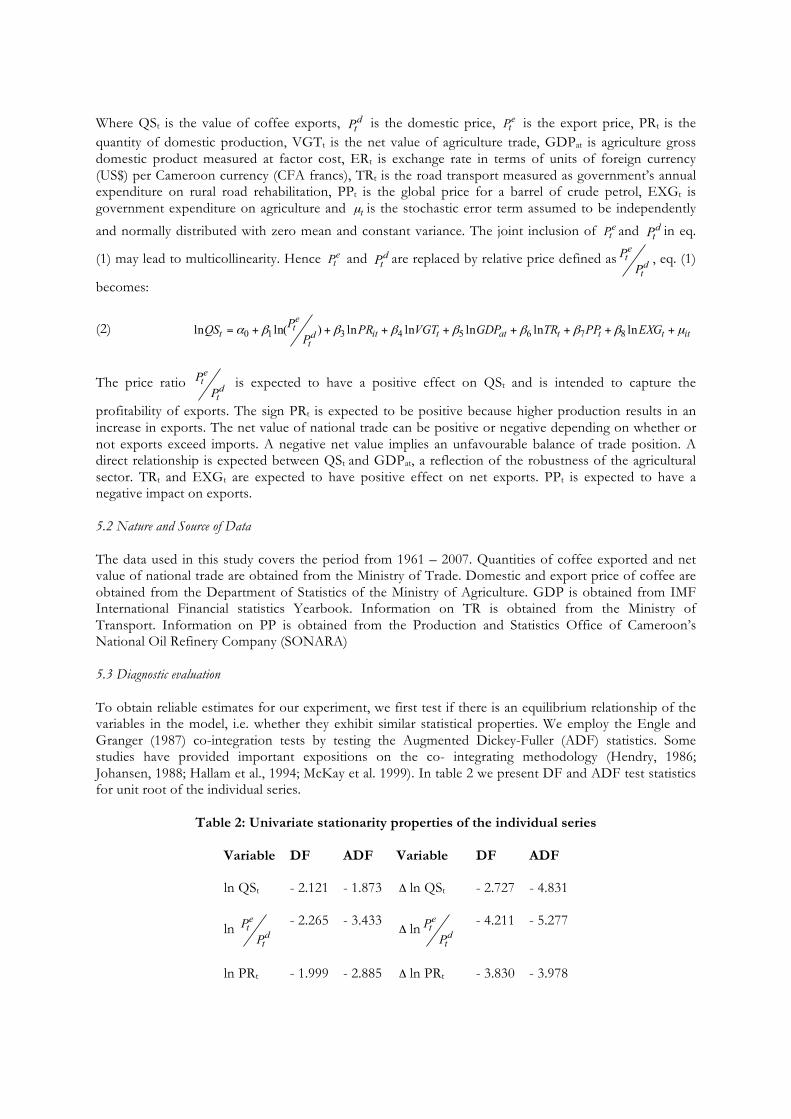
Where QSt is the value of coffee exports, d
tP is the domestic price, etP is the export price, PRt is the
quantity of domestic production, VGTt is the net value of agriculture trade, GDPat is agriculture gross domestic product measured at factor cost, ERt is exchange rate in terms of units of foreign currency (US$) per Cameroon currency (CFA francs), TRt is the road transport measured as government’s annual expenditure on rural road rehabilitation, PPt is the global price for a barrel of crude petrol, EXGt is government expenditure on agriculture and tµ is the stochastic error term assumed to be independently
and normally distributed with zero mean and constant variance. The joint inclusion of etP and d
tP in eq.
(1) may lead to multicollinearity. Hence etP and d
tP are replaced by relative price defined as dt
etP
P , eq. (1)
becomes:
(2) ittttattitdt
ett EXGPPTRGDPVGTPRP
PQS µβββββββα ++++++++= lnlnlnlnln)ln(ln 87654310
The price ratio dt
etP
P is expected to have a positive effect on QSt and is intended to capture the
profitability of exports. The sign PRt is expected to be positive because higher production results in an increase in exports. The net value of national trade can be positive or negative depending on whether or not exports exceed imports. A negative net value implies an unfavourable balance of trade position. A direct relationship is expected between QSt and GDPat, a reflection of the robustness of the agricultural sector. TRt and EXGt are expected to have positive effect on net exports. PPt is expected to have a negative impact on exports. 5.2 Nature and Source of Data The data used in this study covers the period from 1961 – 2007. Quantities of coffee exported and net value of national trade are obtained from the Ministry of Trade. Domestic and export price of coffee are obtained from the Department of Statistics of the Ministry of Agriculture. GDP is obtained from IMF International Financial statistics Yearbook. Information on TR is obtained from the Ministry of Transport. Information on PP is obtained from the Production and Statistics Office of Cameroon’s National Oil Refinery Company (SONARA) 5.3 Diagnostic evaluation To obtain reliable estimates for our experiment, we first test if there is an equilibrium relationship of the variables in the model, i.e. whether they exhibit similar statistical properties. We employ the Engle and Granger (1987) co-integration tests by testing the Augmented Dickey-Fuller (ADF) statistics. Some studies have provided important expositions on the co- integrating methodology (Hendry, 1986; Johansen, 1988; Hallam et al., 1994; McKay et al. 1999). In table 2 we present DF and ADF test statistics for unit root of the individual series.
Table 2: Univariate stationarity properties of the individual series
Variable DF ADF Variable DF ADF
ln QSt - 2.121 - 1.873 Δ ln QSt - 2.727 - 4.831
ln dt
etP
P - 2.265 - 3.433
Δ ln dt
etP
P - 4.211 - 5.277
ln PRt - 1.999 - 2.885 Δ ln PRt - 3.830 - 3.978

ln VGTt - 0.817 - 1.621 Δ ln VGTt - 2.924 - 3.156
ln GDPat - 1.261 - 2.388 Δ ln GDPat - 2.881 - 3.487
ln TRt - 2.316 - 2.111 Δ ln TRt - 2.007 - 3.531
ln PPt - 1.962 - 2.910 Δ ln PPt - 2.893 - 3.891
ln EXGt - 1.851 - 2.793 Δ ln EXGt - 2.913 - 3.087
Critical Value for the ADF statistic is -3.46 For all the variables the null hypothesis that each series is I(1) cannot be rejected as the ADF statistics are below the critical value of -3.46. Thus, the variables are non-stationary in their level form. In the first difference form, however, we can reject the null hypothesis that the variables are I(2), except for VGTt and EXGt. We however proceed to examine the long run equilibrium relationship between coffee supply and relative prices and transport variables using the data in their level form. The estimates presented in
table 3 show a positive and significant relationship between coffee exports and dt
etP
P , PRt, GDPat, TRt
and EXGt and an indirect relationship with PPt.
Table 3: Test for Long-run Effects of coffee exports in Cameroon
Regressors Coefficients
Intercept 2.565 (5.300)
dt
etP
Pln 0.139 (2.963)
ln PRt 1.056 (2.009)
atQGDPln 0.160 (3.524)
tTRln 0.115 (3.109)
tPPln - 0.126 (-1.804)
tEXGln 0.420 (3.605)
tε - 0.024 (-2.099)
R2 adj. 0.813
DW 1.961
Box-Pierce 2χ 3.764
J-B 2χ 0.672
Chow – F 1.59

DW is the Durbin-Watson statistic. J-B is the Jarque and Bera statistic with a critical value of 3.71. The critical value for the Box-Pierce statistic is 9.6, while the critical value for the Chow statistic is 2.53. We employ the Johansen procedure to test for the existence and number of possible cointegrating vectors. The null hypothesis is that the number of cointegrating vectors is less than or equal to r, where r is 0,1,2,4 or 5. As shown in table 4, we can reject the null hypothesis of zero cointegrating vectors at the 95 percent level. The null hypothesis that r≤1 or r≤2 against the general alternative cannot be rejected. The trace test statistic for r≤2 is 95.178 which is greater than the critical value of 24.31. This means that there exists more than two cointegrating vectors.
Table 4: Johansen test for the number of cointegrating vectors
Ho Trace test
statistic
Maximum eigenvalue statistic (λmax)
Ho Ha
r = 0 297.585 r = 0 r = 1 92.268
r ≤ 1 175.660 r = 1 r = 2 64.306
r ≤ 2 95.178 r = 2 r = 3 39.741
r ≤ 3 26.232 r = 3 r = 4 23.169
r ≤ 4 13.456 r = 4 r = 5 11.521
r ≤ 5 0.052 r = 5 r = 0 0.095
Critical values are from Johansen and Juselius, 1990 Since some of the data series have a long-run equilibrium relationship we formulate an error correction representation (ECM) to capture the short-run dynamics. Upon differencing the VGTt and EXGt remain non-stationary and therefore not fit for inclusion in the analysis. In Eq. (3) below, the residuals from the equilibrium co-integrating regression are used as an error-correcting regression (ECt lagged one period).
(3) ∑∑∑=
−
==
− Δ+Δ+Δ+=Δ3
03
2
02
1
110 ln)ln(lnln
n
iiati
n
idt
eti
n
iitit GDP
PPQSQS ββββ
tt
n
iti
n
iiti PPTR εδµββ ++Δ+Δ+ −
==
− ∑∑ 1
5
06
4
05 lnln
The variables are as already defined, and Δ refer to the difference operator. The lagged quantities for cocoa and coffee measure the short-run dynamics, 1−tµ is the lagged value of the residuals and is included to measure the long-run equilibrium adjustment with δ as the error correction coefficient and tε is a random error term. Eq. (3) is a dynamic ECM of the short-run behaviour of commodity exports. 6. Results and Implications Results of the ECM and the diagnostic tests are presented in table 5. The ECM coefficients for coffee export integrate the short-run dynamics in the long-run relationship. Lagged values of coffee exports do not have a significant short-run effect on changes in exports. Changes in exports are determined jointly by export/domestic price ratio, agricultural GDP and foreign exchange. Lagged values of cocoa as substitute crop are tested and dropped since these do not seem to have a significant short-run dynamic effect on changes in coffee exports. In the light of the research objectives, government expenditure on
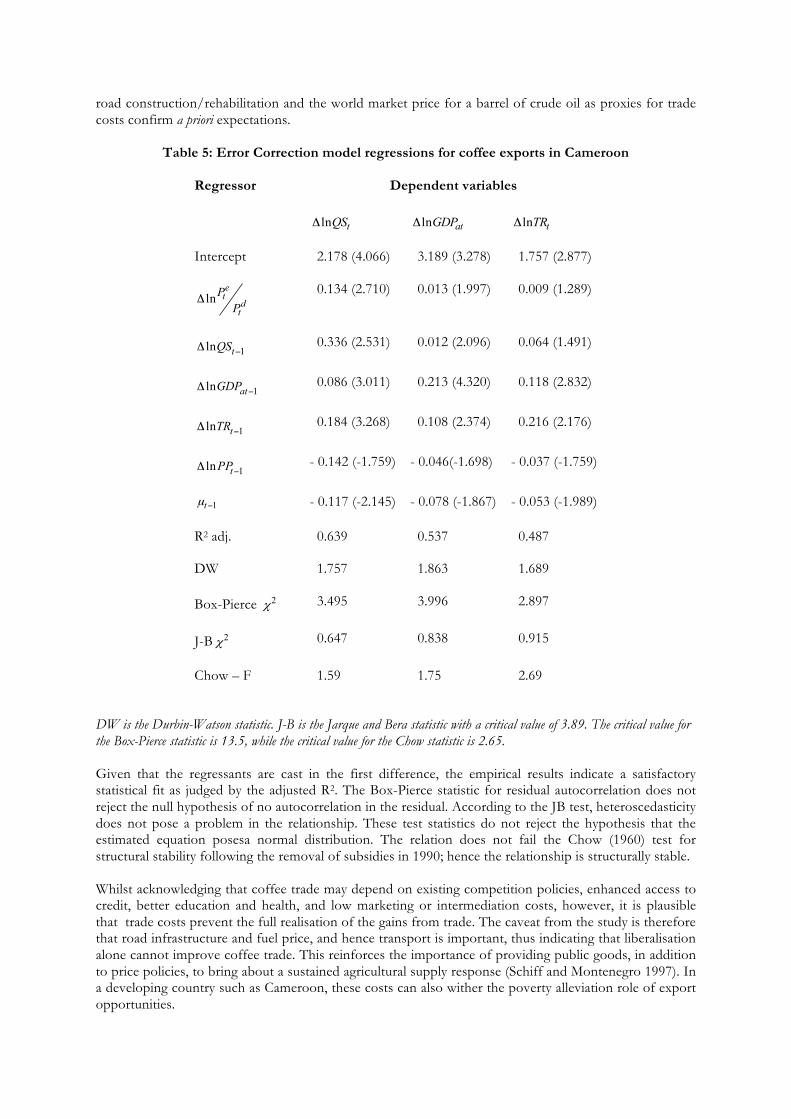
road construction/rehabilitation and the world market price for a barrel of crude oil as proxies for trade costs confirm a priori expectations.
Table 5: Error Correction model regressions for coffee exports in Cameroon
Regressor Dependent variables
tQSlnΔ atGDPlnΔ tTRlnΔ
Intercept 2.178 (4.066) 3.189 (3.278) 1.757 (2.877)
dt
etP
PlnΔ 0.134 (2.710) 0.013 (1.997) 0.009 (1.289)
1ln −Δ tQS 0.336 (2.531) 0.012 (2.096) 0.064 (1.491)
1ln −Δ atGDP 0.086 (3.011) 0.213 (4.320) 0.118 (2.832)
1ln −Δ tTR 0.184 (3.268) 0.108 (2.374) 0.216 (2.176)
1ln −Δ tPP - 0.142 (-1.759) - 0.046(-1.698) - 0.037 (-1.759)
1−tµ - 0.117 (-2.145) - 0.078 (-1.867) - 0.053 (-1.989)
R2 adj. 0.639 0.537 0.487
DW 1.757 1.863 1.689
Box-Pierce 2χ 3.495 3.996 2.897
J-B 2χ 0.647 0.838 0.915
Chow – F 1.59 1.75 2.69
DW is the Durbin-Watson statistic. J-B is the Jarque and Bera statistic with a critical value of 3.89. The critical value for the Box-Pierce statistic is 13.5, while the critical value for the Chow statistic is 2.65. Given that the regressants are cast in the first difference, the empirical results indicate a satisfactory statistical fit as judged by the adjusted R2. The Box-Pierce statistic for residual autocorrelation does not reject the null hypothesis of no autocorrelation in the residual. According to the JB test, heteroscedasticity does not pose a problem in the relationship. These test statistics do not reject the hypothesis that the estimated equation posesa normal distribution. The relation does not fail the Chow (1960) test for structural stability following the removal of subsidies in 1990; hence the relationship is structurally stable. Whilst acknowledging that coffee trade may depend on existing competition policies, enhanced access to credit, better education and health, and low marketing or intermediation costs, however, it is plausible that trade costs prevent the full realisation of the gains from trade. The caveat from the study is therefore that road infrastructure and fuel price, and hence transport is important, thus indicating that liberalisation alone cannot improve coffee trade. This reinforces the importance of providing public goods, in addition to price policies, to bring about a sustained agricultural supply response (Schiff and Montenegro 1997). In a developing country such as Cameroon, these costs can also wither the poverty alleviation role of export opportunities.

7. Concluding remarks Over the last 15years Cameroon has embarked on liberalisation that is significantly opening the economy, shifting from a highly regulated and centralized to a more market-based and liberal economic paradigm. Cameroon’s policy reforms aimed at building a sound macroeconomic environment that would stimulate domestic and foreign investment and enhance productivity, while reducing the role of the state in production. No other sector is embracing these reforms as the export crop sector. The reform programs were designed to reduce the bias against the sector as a means to reduce poverty and increase economic growth. While the rural economy continues to be highly dependent on cash crops, producers’ participation in markets for input as well as output is significantly impacted by the extent of trade facilitation. Road infrastructure and the costs are significantly important, and co-integrate with other factors such as export price and exchange rate to influence returns from coffee exports. References Amjadi, Yeats, 1999, “Have Transport Costs Contributed to the Relative Decline of Sub-Saharan African Exports?” World Bank Policy Research Working Paper Series, 1559, The World Bank, Washington DC. Balat, B. and Porto, G.G. (2008), “Realizing the gains from trade: export crops, marketing costs, and poverty”, World Bank Policy Research Paper, 4488, The World Bank, Washington DC. Banerjee, A., J. Dolado, J. Glabraith and D. Hendry (1993), Co-integration, Error Correction and the Econometric Analysis of Non-Stationary Data, Oxford: Oxford University Press. Benhin, J.K.A and Barbier, E.B., 1999. “Case Study Analysis of The Effects of Structural Adjustment on Agriculture and on Forest Cover in Cameroon.” Final Report for The Center For International Forestry Research (CIFOR) and The Central African Regional Program For The Environment (CARPE), Environment Department, University of York, UK Box, G.E.P. and Pierce, D.A., 1970. Distribution of residual autocorrelations in autoregressive integrated moving average time series models. Journal of American Statistical Association, 65, 1509-1526 Buys, P., Deichmann U. and Wheeler, D., 2006, “Road Network Upgrading and Overland Trade Expansion in Sub-Saharan Africa”. World Bank Policy Research Working Paper No. 4097, The World Bank, Washington DC. Chow, G.C., 1960. Tests of equality between sets of coefficients in two linear regressions. Econometrica 59, 591 – 605. Engle, R.F and Granger, C.W.J, 1987. Cointegration and error correction: Representation, estimation and testing. Econometrica, 55: 251 - 276 Gilbert, C.L., Tollens, E., Nchare, A., Kamajou, F., Essomba A.S. and Fankam, H., 1999. “Impacts of Economic Liberalisation in Cameroon’s Coffee and Cocoa sub-Sectors.” Final Report for the European Commission Delegation, Department of Finance, Free University of Amsterdam. Hallam, D., Machado, F. and Rapsomanikis, G., 1994. Cointegration analysis and the determinants of land prices. Journal of Agricultural Economics, 45 (1): 29-37 Helble, M., Shepherd, B. and Wilson, J.S., 2007, Transparency and Trade Facilitation in the Asia Pacific: Estimating the Gains from Reform, Washington, D.C.: The World Bank, Washington DC
Johansen, S., 1988. “Statistical Analysis of Cointegration Vectors,” Journal of Economic Dynamic and Control, 12 (1-2). Johansen, S and Juselius, K., 1990. “Maximum Likelihood Estimation and Inference on Cointegration with Application to the Demand for Money”, Oxford Bulletin of Economics and Statistics, 52 (2). Johansen, S and Juselius, K., 1992. “Testing Structural Hypotheses in a Multivariate Cointegration Analysis of the PPP and the UIP for UK”, Journal of Econometrics, 53 (1-3). Limao, N. and Venables, A.J., 2000, “Infrastructure, Geographical Disadvantage, Transport Costs, and Trade”, World Bank Economic Review, 15(3): 451-479. McKay, A., Morrissey, O. & Vaillant, C. 1999. Aggregate Agricultural Supply Response in Tanzania. J. International Trade and Economic Development, 8:1, 107-123. Milner, C. & Morrissey, O. 1999. Measuring Trade Liberalisation in Africa. In McGillivray, M. & O. Morrissey, eds. Evaluating Economic Liberalisation, London: Macmillan, pp. 60-82. Minagric (Ministry of Agriculture), 2003. Rural Sector Development Strategy Paper, Yaoundé, Cameroon Nchare, A., 2007, “Analysis of Factors Affecting Technical Efficiency of Arabica Coffee Producers in Cameroon,” Research Paper 163, Africa Economic Research Consortium, Nairobi. Negri M, and Porto G.G., 2008. “Burley tobacco clubs in Malawi: Nonmarket institutions for exports”, World Bank Policy Research Paper 4561, The World Bank, Washington DC Portugal-Perez A. and Wilson, J.S., 2008. “Trade Costs and the Business Environment: A Focus on Africa,” Paper Presented at the African Economic Research Consortium and the World Bank Workshop, Entebbe Uganda, May 31, 2008. Schiff, M. and Montenegro, C.E., 1997, “Aggregate Agricultural Supply Response in Developing Countries: A Survey of Selected Issues,” Economic Development and Cultural Change, 45(2):393-410. Shepherd, A.W. and Farolfi, S., 1999, Export Crop Liberalisation in Africa: A review. FAO Agricultural Services Bulletin, No. 135, FAO Rome. ISSN 1010-1365 Tambi, E.N., 1999. Co-integration and error correction modelling of agricultural export supply in Cameroon. Agricultural Economics, 20 (1): 57 - 67 Tambi, E.N. 1984, Agricultural development policy and performance in Cameroon, 1960-1980', PhD thesis, University of Pittsburgh, USA Tchoungi, R., Gartlan, S., Mope Simo, J.A., Sikod, F., Youmbi, A. and Njatsana, M., 1996. “Case study for Cameroon.” In: Reed, D., (ed.) Structural Adjustment, the Environment and Sustainable Development. Earthscan Publications London. Chap. 3: pp 53-81. UNDP, 2006. Human Development Report 2006. United Nations Development Programme, New York. Oxford University Press, pp 264 . UNICEF, 2006. Statistics for Cameroon. United Nations International Children’s Emergency Fund, New York. Downloadable at: http://www.unicef.org/statis/ as of 24th July, 2006. Wilson, J.S., Mann E., and Otsuki, T., 2004. "Assessing the Potential Benefit of Trade Facilitation: A Global Perspective." World Bank Policy Working Paper, No. 3324. World Bank, 2000. Republic of Cameroon: Interim Poverty Reduction Strategy Paper, Washington DC